
2
MNC Case Studies
In order to study the management of successful MNCs, the Japanese MNC working group met for a half day almost every month from April 1993 to December 1994. Eleven companies, six U.S.-based companies in Japan and five Japan-based companies in the United States and England as listed in Table 2-1 , were selected for extensive case presentations from their top executives. A research contract was also granted to Tama Institute of Management and Information Sciences to supplement the hearings.
STATISTICS ON FOREIGN-BASED MNCS IN JAPAN
Foreign capital companies have attached special importance to entry into the Japanese market in the past as well as the present, as Mr. Yoshihara's survey indicates,1 shown in Table 2-2 , indicates. In the past, 25 percent of the respondents rated the growth potential of the market as their top motive, 18 percent sought to establish Asian bases and 11 percent emphasized Japan's importance for their global strategies. These motives remain the top three even today and without regard to period distinction. However, Japan's importance for global strategy has been emphasized recently.
TABLE 2-1 List of MNCs Selected for Extensive Case Hearings
|
Established |
Date of Hearing |
|
|
U.S.-based companies |
||
|
Fuji Xerox |
1962 |
June 6, 1993 |
|
Nippon Motorola |
1962 |
June 30, 1993 |
|
Du Pont Toray |
1964 |
July 28, 1993 |
|
TI Japan |
1968 |
September 29, 1993 |
|
Sumitomo 3M |
1960 |
October 25, 1993 |
|
IBM Japan |
1937 |
June 24, 1994 |
|
Japan-based companies |
||
|
Honda America |
1965 |
November 19, 1993 |
|
Nissan Motor U.K. |
1960 |
December 22, 1993 |
|
Bridgestone/Firestone |
1988 |
January 24, 1994 |
|
I/N Tek (Nippon Steel) |
1987 |
February 18, 1994 |
|
Sun Chemical (Dai Nippon Ink) |
1968 |
March 25, 1994 |
TABLE 2-2 Motives for MNCs Entering Japan By Time Period
|
Motive for entering Japan |
Past |
Present |
Past and Present |
Total |
|||
|
Size and growth in market |
56 (25%) |
66 (16%) |
247 (30%) |
369 (25%) |
|||
|
Overcome Japanese protectionism |
5 (2) |
0 (0) |
5 (1) |
10 (1) |
|||
|
Attract skilled personnel |
7 (3) |
26 (6) |
57 (7) |
90 (6) |
|||
|
Access to materials/parts |
8 (4) |
17 (4) |
29 (4) |
54 (4) |
|||
|
Access to technology/know how |
4 (2) |
28 (7) |
32 (4) |
64 (4) |
|||
|
Gather technology and market information |
7 (3) |
40 (10) |
62 (8) |
109 (7) |
|||
|
Establish base for Asia |
40 (18) |
49 (12) |
70 (9) |
159 (11) |
|||
|
Achieve high profits |
18 (8) |
34 (8) |
47 (6) |
99 (7) |
|||
|
Proximity to Japanese competitors |
5 (2) |
27 (6) |
26 (3) |
58 (4) |
|||
|
Fill unaddressed niche market |
23 (10) |
24 (6) |
41 (5) |
88 (6) |
|||
|
Japan's importance for global strategy |
25 (11) |
107 (25) |
194 (24) |
326 (22) |
|||
|
Other |
24 (11) |
2 (0) |
2 (0) |
28 (2) |
|||
|
Total |
222 (100) |
420 (100) |
812 (100) |
1,454 (100) |
|||
|
SOURCE: H. Yoshihara, Foreign Capital Companies (Tokyo: Toyokeizai-shinposha, 1992), p. 34. |
|||||||
Structural comparisons of foreign capital companies in Japan are shown in Figure 2-1 according to five different categorizations; (1) by industry, (2) by country, (3) by total assets, (4) by foreign ownership ratio, and (5) by year of establishment. A major role is played by U.S. based companies, which make up 46.4 percent of all foreign capital companies. The manufacturing sector constitutes 30.3 percent of all business activities and other industries evenly divide the remainder. Over 40 percent of the companies have been in business at least 15 years and over 40 percent were established in the past eight years. The five year period from 1985 to 1989 accounted for 30.3 percent of new establishments, the highest among the periods. In the most recent period of the survey, from 1990 to 1992, there were over 300 new entries into the market and major MNCs established R&D centers.
Table 2-3 shows a list of entry years of leading U.S. companies in Japan. The table is not at all complete. It was assembled for the purpose of selecting the companies for case studies. Several companies such as ITT, which had played important roles prior to the Second World War, are not listed because they have changed their core business areas almost completely. Relatively new entries of high potential are also not listed since their management credibility has not yet been established.
Referring to Mr. Yoshihara's survey again, the relationship between the period of the MNC's entry and its success or failure is shown in Table 2-4 . The rate of success of 79 percent is surprisingly high, during the entry period prior to 1970, when the market was tightly controlled. The rate of failure is a mere 7.5 percent. There might have been many failed companies that were not on the survey list or failed to reply. However, it is more likely that those companies, which entered into the market during such difficult time, had made very careful studies of the market,
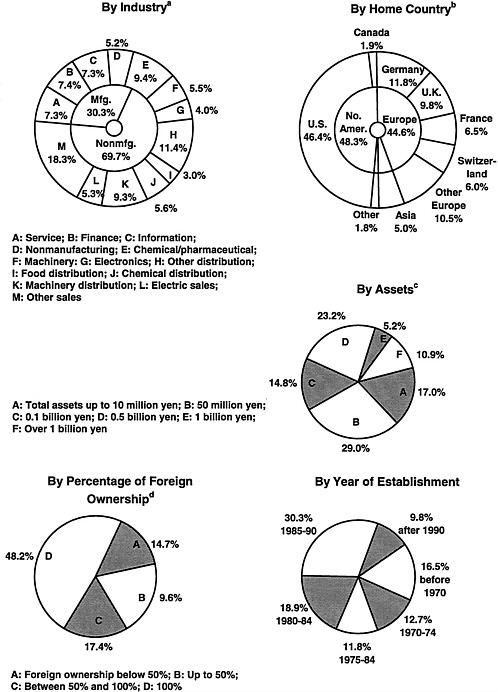
FIGURE 2-1 Structural comparison of foreign capital companies analyzed from five different angles. aFinance category includes of branches of commercial banks and securities houses, leasing and loan companies, investment consultants, and others. bIncludes 1,445 companies, excluding those not in industrial categories in the “By Industry” chart. cIncludes 2,945 companies. dIncludes 2,936 companies. SOURCE: Toyokeizai Handbook on Foreign Capital Companies 1993 (Tokyo: Toyokeizai-shinposha, 1994), p. 103.
established a solid management strategy, and made every effort to accomplish success as our case hearings clearly revealed.
The success rate of recent entries, after 1986, is the lowest among the four entry periods, at 49 percent. The failure rate is the lowest for the 1971-1980 period, at 2 percent, followed by the 1981-1985 period, at 4 percent. The average success rate of 72 percent is surprisingly high and
TABLE 2-3 Entry Year of Leading U.S. Companies
|
Before 1975 |
After 1975 |
||||||
|
Citibank |
1902 |
Bausch & Lomb |
1976 |
||||
|
IBM a |
1937 |
Intel |
1976 |
||||
|
AIU |
1946 |
Eastman Kodak |
1977 |
||||
|
Boeing Japan |
1953 |
Cray Research Japan |
1979 |
||||
|
Sumitomo 3M a |
1960 |
DEC |
1982 |
||||
|
GE Japan |
1960 |
AT&T |
1982 |
||||
|
Grace Japan |
1960 |
Proctor & Gamble |
1983 |
||||
|
Mobil |
1961 |
Apple Computer |
1983 |
||||
|
Nippon Motorola a |
1962 |
Micro Focus |
1984 |
||||
|
Xerox |
1962 |
Oracle |
1985 |
||||
|
Bristol-Myers |
1963 |
Phillip Morris |
1985 |
||||
|
YHP |
1963 |
Reebok |
1985 |
||||
|
Du Pont Toray a |
1964 |
Microsoft |
1986 |
||||
|
Texas Instruments a |
1968 |
||||||
|
Morgan Stanley |
1969 |
||||||
|
McDonald's |
1971 |
||||||
|
Merrill Lynch |
1972 |
||||||
|
Bankers Trust |
1973 |
||||||
|
Ford Motor |
1974 |
||||||
|
Dow Chemical |
1974 |
||||||
|
a Companies interviewed by Japanese MNC working group. |
|||||||
TABLE 2-4 Relationship Between MNC Entry Period and Success/Failure
|
Entry Period |
Success |
Intermediate (number of companies) |
Failure |
Total |
|||
|
Prior to1971 |
115 (78.8%) |
20 (13.7%) |
11 (7.5%) |
146 (100%) |
|||
|
1971-1980 |
94 (77.7) |
25 (20.7) |
2 (1.6) |
121 (100) |
|||
|
1981-1985 |
52 (71.2) |
18 (25.7) |
3 (4.1) |
73 (100) |
|||
|
After 1985 |
38 (49.4) |
30 (39.0) |
9 (11.6) |
77 (100) |
|||
|
Total |
299 (71.7) |
93 (22.3) |
25 (6.0) |
417 (100) |
|||
|
NOTE: H. Yoshihara, Foreign Capital Companies(Tokyo: Toyokeizai-shinposha, 1992), p. 28. |
|||||||
the average failure rate of 6 percent is low. Over 22 percent of the companies are still struggling to achieve success, enduring great hardship against fiercely competing Japanese companies and establishing their strategic bases in Asia. They have been working hard to become members of local Japanese communities.
The relationship between MNC size and its success or failure is shown in Table 2-5 . It is not surprising to note that the larger the company size, the higher the resulting success rate. The success rate of 63 percent for smaller companies is very attractive. Since the total number of relatively new entries, after 1981, that responded to the survey is 150, many of them were established before 1980. Even so, 30 percent of them are still working harder to achieve success. It is encouraging to know many MNCs are following the basic principles of corporate management.
TABLE 2-5 Relationship Between MNC Size and Success/Failure
Major access problems encountered by foreign capital companies are summarized in Table 2-6 . Among three major categories of problems and difficulties listed, the third category, market activity, received responses from 83 percent of the companies. Among nine sub-questions in the category, the highest response was the high level of quality expected by customers. In spite of the fact that keiretsurelations and closed sales channels have been strongly criticized as major causes for the large U.S.-Japan trade imbalance, they were rated far below customer behavior, which the government and industry cannot control. Government regulations are common problems for Japanese companies as well and do not discriminate against foreign based MNCs.
Compared with Yoshihara's survey, how does a survey by the American Chamber of Commerce in Japan differ? Figure 2-2 , Figure 2-3 , and Figure 2-4 summarize reasons for U.S. companies being unable to better penetrate the Japanese market.
The wording of each questionnaire might have been different: however, both surveys revealed reasonably similar results.
It is certainly undeniable that those problems related to differences in culture and customs affect an MNC's ability to do business in Japan. Those problems are encountered by foreign based MNCs in any country, even in the U.S. market. As Yoshihara's survey reveals and our case studies clarified, many foreign based MNCs, including U.S. based MNCs, have succeeded by overcoming various difficulties. Of course, there are many companies which failed or gave up on their businesses in Japan. Most of them failed to follow the basics of business management. A report by the United States International Trade Commission in 1990 explained the failures in different terms as follows: “a reason why leading U.S. firms have failed in the Japanese market
is because they did not pay enough attention to the Japanese market and they did not devote enough business effort to it.”
TABLE 2-6 Problems Accessing the Japanese Market
|
Problems and Difficulties |
Percentage of Sample |
Percentage of Companies Answering Yes |
|||||
|
Relations with Japanese government |
64% (277 companies) |
||||||
|
Regulations, administrative guidance |
53% |
||||||
|
Tax issues |
43% |
||||||
|
Troublesome commercial/customs procedures |
28% |
||||||
|
Relations with parent company |
72% (313 companies) |
||||||
|
Understanding Japanese market |
56% |
||||||
|
Short-term profit goal |
39% |
||||||
|
Communication between parent and local staff |
31% |
||||||
|
Marketing activities |
83% (362 companies) |
||||||
|
Sensitive, quality-conscious customers |
62% |
||||||
|
Hiring sales staff |
34% |
||||||
|
Keiretsu relations |
28% |
||||||
|
Complex, multitiered distribution |
25% |
||||||
|
SOURCE: H. Yoshihara, Foreign Capital Companies(Tokyo: Toyokeizai-shinposha, 1992), p. 66. |
|||||||
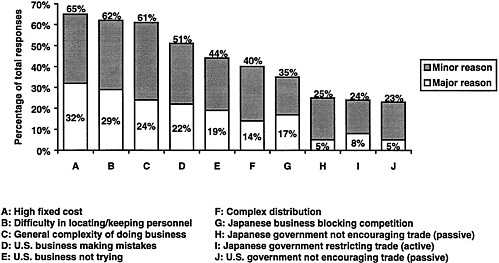
FIGURE 2-2 Restrictions on market penetration. NOTE: Multiple answers allowed. SOURCE: American Chamber of Commerce in Japan, Trade and Investment in Japan: The Current Environment, 1991, p. 15.
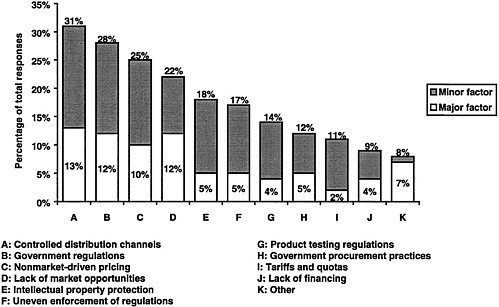
FIGURE 2-3 Factors inhibiting greater trade with Japan. SOURCE: American Chamber of Commerce in Japan, Trade and Investment in Japan: The Current Environment, 1991, p. 16.
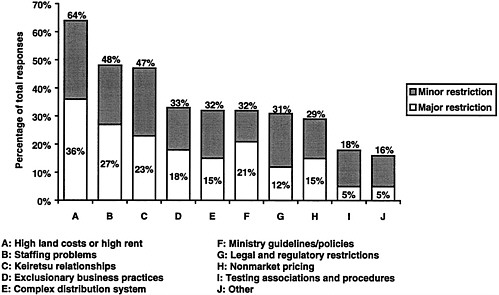
FIGURE 2-4 Reasons affecting companies' ability to do business in Japan. SOURCE: American Chamber of Commerce in Japan, Trade and Investment in Japan: The Current Environment, 1991, p. 17.
REASONS FOR SUCCESS OF U.S.-BASED MNCS IN JAPAN
Soon after the Second World War, U.S. companies, either individually or in joint ventures with leading Japanese companies, extended their businesses into the Japanese market. Through the active use of their strategic technologies and nurturing their employees, they have built up consistent profits and market shares in the market.
Table 2-7 , quoted from Toyokeizai Handbook on Foreign Capital Firms 1992compares representative performances of foreign and domestic companies. The average profit as a percentage of sales for foreign based MNCs in Japan is almost twice as high as that of Japanese companies; however, the average profit per employee is four times higher.
Quoting Yoshihara's survey again, Table 2-8 and Table 2-9 show statistics on the incomes and dividends of foreign based MNCs. In 1990, 81 percent of respondents had operating incomes and 71 percent had net incomes. The average operating income was 5.6 percent and 41 of respondents achieved a more than 5 percent operating income.
According to published reports,2 many U.S. based MNCs in Japan are more profitable than their operations in the States. A survey reveals that the foreign capital companies paid out in average 52.8 percent of after tax profits to dividends.3 This is a distinct difference from Japanese companies; they usually pay only 23.3 percent in dividends. On the other hand, the internal reserve rate is opposite to the dividend rate: Japanese companies reserve 72.4 percent whereas U.S. companies reserve only 46.5 percent.
Based on the MNC working group case studies, we have come to appreciate the unceasing efforts that successful U.S. based MNCs in Japan have exerted in order to reach their present levels. As the statistics clearly indicate, the excellent U.S. based MNCs in Japan were established prior to and during the 1960s when the Japanese market was tightly closed in order to nurture infant industries such as the computer and semiconductor industries. They had very difficult experiences for at least a decade or so. But they endured various difficulties and established a solid base on Japanese soil. These companies have not withdrawn from the Japanese market even during severe depressions. They now enjoy far better profit margins than most Japanese companies, high reputations, highly qualified Japanese employees and a bright future as strategic bases for expanding business into Asian countries. They have been contributing for the advancement of national economy as well as science and technology in the home and host countries.
TABLE 2-7 Performance Comparison of Foreign and Domestic Companies
|
Foreign |
Japanese |
Foreign as Share of Total |
|||||
|
Total assets (hundred billion yen) |
85.8 |
10,614 |
0.8% |
||||
|
Sales (hundred billion yen) |
140.0 |
13,079 |
1.1% |
||||
|
Operating profit (billion yen) |
791 |
38,915 |
2.1% |
||||
|
Number of employees (thousand people) |
172 |
34,261 |
0.5% |
||||
|
Profit as percentage of sales |
5.7 |
3.0 |
1.9 times |
||||
|
Profit per employee (ten thousand yen) |
460 |
114 |
4.0 times |
||||
|
Percentage of dividends |
19.3 |
8.4 |
2.3 times |
||||
|
Capital investment (hundred million yen) |
3,717 |
181,480 |
2.0 % |
||||
|
SOURCE: Toyokeizai Handbook on Foreign Capital Companies 1992 (Tokyo: Toyokeizai-shinposha, 1992), p.120. |
|||||||
TABLE 2-8 Foreign Capital Firms' Operating Incomes, Dividends, and Accumulated Incomes
|
Yes |
No |
|
|
Operating income (1990) |
199 companies (81%) |
46 companies (19%) |
|
Dividends (1990) |
143 (48) |
152 (52) |
|
Accumulated income |
207 (71) |
84 (29) |
|
SOURCE: H. Yoshihara, Foreign Capital Companies (Tokyo: Toyokeizai-shinposha, 1992), p.22. |
||
TABLE 2-9 Foreign Capital Firms' Operating Income as a Percentage of Sales, Fiscal Year 1990
|
Negative |
40 companies |
(16%) |
|
0-5% a |
102 |
(42) |
|
5-10% |
55 |
(22) |
|
10-15% |
22 |
(9) |
|
15-20% |
13 |
(5) |
|
Above 20% |
13 |
(5) |
|
Total |
245 |
(100) |
|
Average operating income |
234 b |
(5.6) |
|
a Six companies reported 0%. b Excluded 11 companies whose operating income was below −50% or above 50%. SOURCE: H. Yoshihara, Foreign Capital Companies(Tokyo: Toyokeizai-shinposha, 1992), p. 24. |
||
As listed in Table 2-1 , we selected six excellent U.S. based MNCs and asked their top executives to make one hour presentations and then to respond to another hour of question and answer sessions. The study concluded that the reasons for successful MNC operations are as follows:
-
A long-term strategic approach,
-
Mutual trust among the top managements of the parents of joint ventures,
-
Appropriate division of responsibilities between headquarters and foreign subsidiaries,
-
Business/sales alliance among companies,
-
Fusion of U.S. and Japanese management styles,
-
Emphasis on higher profitability and growth potential of core businesses,
-
Granting operational independence to joint venture to manage own affairs,
-
The synergistic effects of technology exchange and sharing of advanced technology data through joint ventures.
These elements represent nothing new and have been taught in basic management textbooks; however, many companies have failed to follow up on these principles.
From the forgoing reasons for success, it is clearly indicated that in order to succeed in the Japanese market, the MNC must adopt a consciously well-rounded business strategy. During the case presentations, it was reported that even an excellent U.S. semiconductor company had to make extra efforts in order to satisfy demanding Japanese customers. A representative of a U.S.
pharmaceutical company in Japan stated in his Japanese book4 that “the real problem is, no matter how well you succeed in making top management pay attention to the special nature of the Japanese market, can you create a system which will be completely acceptable to the Japanese people?”
We accept the fact that Japanese customers are highly demanding, often emphasizing high quality and better service over the price of product, and that the market is fiercely competitive. The special demands of the Japanese market for high quality and better service is culturally based. Any company, without regard to their origin, which does business in Japan has to meet the challenge of such demands, otherwise it is difficult to succeed. Successful foreign based MNCs have demonstrated that they can do better than most Japanese companies by advancing their management to overcome cultural and customary barriers.
It is important to note that the same success factors for U.S. based MNCs in Japan are remarkably similar to the necessary factors for Japan based MNCs to succeed in the United States, as we shall present later. We believe that, in spite of various differences in culture and customs existing between Japan and the United States, the basic business management necessary for success is similar and has not changed in over a century.
Many foreign based MNCs in Japan have been expanding research and development activities recently. Most of them used to operate only engineering centers to transfer product technology from and manufacturing technology to the parent company. Recently, however, they are increasing contacts with major universities and even becoming members of Japanese research consortia. Some of them are playing an important role as strategic R&D centers of corporate technological development. Hence they are actively participating in Japanese academic activity and contributing not only to the development of corporate technology but also to the advancement of science and technology.
REASONS FOR SUCCESS OF JAPAN-BASED MNCS IN THE UNITED STATES
The history of Japan based MNCs is relatively short compared with U.S. based MNCs. Most of them are still having difficulty in hiring top local managers, who have high management qualifications and good communication ability with Japanese top management, since Japanese speaking capability among Americans is quite rare. With regard to this problem, U.S. based MNCs are blessed with many talented local candidates with good communication ability. Many Japan-based MNCs are also having difficulty hiring capable engineers since they have not yet established corporate citizenship in the host countries. Hence they have scarcely contributed to the advancement of science and technology in the host countries but only to the transfer of advanced manufacturing technology.
The substantial increase of business operations in the United States by Japanese manufacturers began from the latter half of the 1970 's, motivated by the increasing value of the yen, a desire to alleviate trade frictions, a need to match the moves of Japanese rivals, and by other factors. It may be nonsense from a “demand and supply” business principle; however, many Japanese industrial leaders felt a sense of guilt for causing the hollowing out of U.S. industries through the flood of low cost manufactured goods, and a sense of crisis for it might affect Japanese comprehensive national security since manufacturing is an important component of national security.
Reviewing the movement of Japan based MNCs to the United States, many of them were certainly not moved by solid business strategies, but were rather moved by some mood or epidemic reaction. The U.S. market may be easy to access, but it is extremely difficult to succeed in. Hence many Japanese companies have had difficulties in establishing their business bases, resulting from poor business strategies and poor knowledge of different cultures and socioeconomic changes. Even so a substantial number of companies have managed to succeed, overcoming various difficult conditions.
The following important success factors can be extracted from the case presentations of four MNCs in the United States and one in England:
-
Establishment of mutual trust between the top managements of parent companies,
-
Procurement from and collaboration with local companies, and maintaining good relations with regional companies,
-
Articulating a clear business vision and outlook for the future,
-
Establishing an appropriate division of authority with parent companies,
-
Constant efforts to achieve the appropriate apportionment of business expansion between Japan and overseas,
-
Convergence of corporate cultures of Japanese and U.S. companies,
-
Creation of synergistic effects through better communications and collaborations,
-
Autonomous management of subsidiary companies.
The order and wording of the reasons for success are different for the U.S. based MNCs in Japan and Japan MNCs; however, they are very similar as summarized in Table 2-10 .
TABLE 2-10 Management Factors for Successful Japanese and U.S. MNCs
The U.S. market is the most advanced and dynamic; therefore, in order to succeed in the U.S. market, Japan based MNCs have to increase research and development activity in the United States. Figure 2-5 and Figure 2-6 show some data illustrating the trend in Japanese R&D investment in the United States. It is rapidly growing; however, compared with other advanced countries, the activity is still inadequate.
There seems to be a certain amount of skepticism and criticism toward Japanese companies in the United States in spite of the fact that at least the manufacturing MNCs have been trying to be members of the U.S. manufacturing industry. Especially in the early days of establishing R&D activities, since such efforts were criticized as espionage activity or a free riding, Japanese companies had difficulty in attracting capable staff. However, they have recently been able to hire capable members by demonstrating their sincere objectives and as a result of the substantial reduction in R&D activities at major U.S. industrial laboratories.
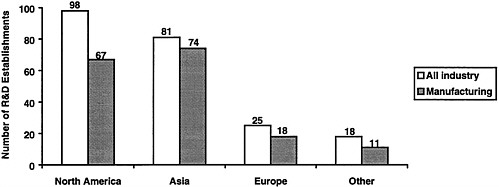
FIGURE 2-5 Japanese R&D establishments by region, 1991. SOURCE: Ministry of International Trade and Industry, Fourth Annual Survey of Japanese Companies' Overseas Activities, 1991.
SOME U.S.-BASED MNCS IN JAPAN STILL HAVE ROOM FOR MANAGEMENT EFFORTS
Many U.S. companies are succeeding in Japan. The U.S. based MNCs such as IBM, McDonald's, Coca Cola, Kentucky Fried Chicken, Levi's, Tupperware, Max Factor, and others, too many to mention, have made their names and brands household words in Japan. Also high technology companies such as AT&T, Intel, Texas Instruments (TI), Microsoft, Hewlett-Packard, Oracle, and others have established sold bases in the Japanese market. Even though these U.S. companies experienced difficulties in establishing their initial bases in Japan, the majority have succeeded in building market share, establishing positions and gaining profits. One of the reasons for their success, as illustrated in the case of TI, is that U.S. companies learned to adapt their management to the strict demands of Japanese users. It is also important to recognize that the success of U.S. companies in Japan was not based on such financial measures as mergers and acquisitions and leveraged buyouts.
However, there are certain U.S. companies, which have not been able to make profits in the Japanese market or achieve business success, that have denied their own responsibility for failure
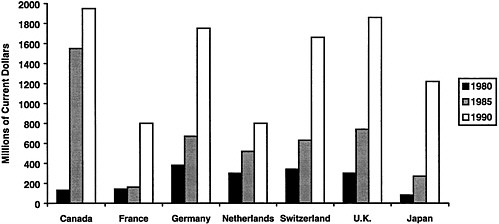
FIGURE 2-6 Foreign R&D expenditures in the United States by country, 1980-1990. NOTES: Includes foreign direct investments of nonbank U.S. affiliates with 10 percent or more foreign ownership. Excludes expenditures for R &D conducted for others under a contract. SOURCE: U.S. Department of Commerce, Bureau of Economic Analysis, Foreign Direct Investment in the United States, as presented in National Science Board, Science and Engineering Indicators—1993 (Washington, D.C.: Government Printing Office, 1993).
and have gone crying to the government, engaging in lobbying activities. Table 2-11 shows a list of reasons for failure of foreign capital companies surveyed by Yoshihara.
After the Second World War, Japanese industrialists were told by American leaders that the use of political power in business was against industrial morals. Since such conduct is against business principles, it may appear to be successful for a while, but it faces a danger of tangling in foreign affairs and eventually fragments the company's business foundations. The enlargement of market access should be based on the efforts of individual companies. The government role should be limited to the creation of an environment that encourages companies to fully utilize their own capabilities.5 It is important to reaffirm that the excessive protection of industries always works against a realization of the spirit of enterprise. Japan has learned enough lessons in this respect. Many outdated regulations are inhibiting the activity of Japanese companies as well as foreign capital companies.
As is often pointed out, scarcely any success cases of U.S. companies in Japan have been publicized in the United States since many established MNCs would like to protect their vested interests and not draw attention to themselves. Hence those who failed in Japan and are seeking easier business in Japan have had chances to persuade the public and the government to blame Japan's socioeconomic structure. In order to avoid such chaos, we have to publicize more actively in the United States and other advanced countries the examples of successful foreign companies in Japan.
The Japanese working group's case studies revealed that almost all companies have encountered many problems in doing business in different countries, in particular at the beginning of foreign operations. It can be said that the same is true for U.S. companies entering into Japan. In the course of entering the Japanese market, U.S. companies must persevere with unceasing management efforts. They must recognize the need for extended periods of time in
order to adjust to Japan's culture, severe competitive environment, different market requirements and other business customs.
However, there may also be cases in which the companies face many Japanese regulations, which constitute barriers that are hard to overcome through corporate effort alone. For the U.S. companies seeking to enter the Japanese market, it is needless to say, but recommended that they make thorough preliminary studies on Japanese regulatory barriers and commercial practices.6 It is also recommended that they effectively utilize the function of the Foreign Company Manager's Association established in 1993 as a forum of foreign business in Japan to make policy suggestions to national and local governments.7
DIFFICULTIES OF JAPANESE COMPANIES IN DOING BUSINESS IN THE UNITED STATES
The rise in the yen, resulting from the dollar crisis of the early 1970s and the demise of fixed exchange rates, spurred the first phase of the foreign investment boom in Japan. However, the investment of this period was primarily to promote exports, and it was mostly for the expansion of sales and marketing infrastructure in the United States. Reflecting the further appreciation of the yen that followed the Plaza Accord in the mid 1980s, the second phase of the foreign investment boom involved many Japanese companies in a variety of industries setting up U.S. subsidiaries. In particular, Japanese manufacturing companies began a significant offshore advance from this time, pursuing an international division of labor strategy for manufacturing.
In the area of Japanese management, this period of increased direct investment coincided with the peak of the “Japanese management boom, ” centered in the United States and also extended to other advanced countries, that began in the late 1970s and lasted through the first half of the 1980s. So among Japanese companies there was great confidence in their product quality and management in particular, resulting from their ignorance of international business. At that time, Japanese companies misjudged, believing that through establishing factories in the United States they could make headway easily on the basis of “just-in-time” production management, industrial robots and quality circles. However, many companies were unable to survive in the U.S. market on the basis of Japanese domestic management experience alone. Table 2-12 shows some statistics of profit data of overseas subsidiaries of Japanese companies.
Reasons for failure influenced by the socioeconomic environment are summarized as follows:
-
Many Japanese companies that established operations in the United States were seriously hampered by the poor condition of U.S. basic industries, which had been declining as a result of the “hollowing ” of U.S. manufacturing industry since the 1970s.
-
As a result of this industrial hollowing and the lingering weakness of the U.S. economy, the sphere of activity of Japanese companies was severely limited, and the management vitality was sapped, resulting in difficulties in establishing efficient production and effective logistics networks.
-
Due to the poor business performance of parent companies in Japan, resulting from the burst of the bubble economy, a number of firms unavoidably scaled down, sold or shut down overseas operations.
TABLE 2-11 Reasons for Failure of Foreign Capital Companies in Japan
TABLE 2-12 Profit Data of Overseas Subsidiaries of Japanese Companies, Fiscal Year 1989
|
Percentage of Profitable Companies |
Profit Percentage per Sales |
||||||
|
All Industries |
Manufacturing |
All Industries |
Manufacturing |
||||
|
North America |
44.8% |
42.2% |
0.5% |
0.2% |
|||
|
Europe |
50.7% |
55.9% |
0.8% |
2.3% |
|||
|
Asia |
57.7% |
55.7% |
2.0% |
3.8% |
|||
|
Total (including other areas) |
55.0% |
53.1% |
1.0% |
1.8% |
|||
|
SOURCE: Ministry of International Trade and Industry, Fourth Annual Survey of Overseas Companies' Activities,1991. |
|||||||
As Table 2-12 indicates, of all the regions in which Japanese manufacturers operate, the profitability is the poorest in the United States. According to a JETRO report,8 more than half of these were expecting profits in the future, meaning that they were unprofitable. The same results can be seen in the data of another researcher.9 However, Japanese companies are providing jobs for over 400,000 people in the United States.10 Another factor that should be mentioned is the trouble that often arises with U.S. partners in the case of Japan-U.S. joint ventures, in particular when the U.S. parent company decides to dissolve the joint venture not only because of judgements that their missions are finished, but also for purely internal reasons such as a desire for quick capital gains or the acquisition of the U.S. parent by a third party.11
According to one of the Japanese working group members, who was involved in managing several of these ventures, there were even cases where the operating results of the venture were good and return on investment was rising, but the U.S. side, in opposition to the Japanese partner, wished to sell the venture at a time when the asset value seemed high. In particular, there is a tendency for the U.S. side to approach the venture with the goal of building asset value and selling it. In contrast, the Japanese side places emphasis on the continuation of the business for the public interest. Hence there is a tendency for the Japanese partner to buy even reluctantly the interest of U.S. partner and run the business even after the joint venture is dissolved.
In considering these differences in strategy between the partners and their roles in the dissolution of joint ventures, it is useful to recall the statement made by Stopford and Wells12 even 25 years ago that if the joint venture, regardless of the ratio of investment, is authorized to run more independently, it tends to be more highly profitable. In this connection, the Japanese working group case studies reached the same conclusion that the joint venture with a high degree of management autonomy tends to be rewarded with greater success.
NEW TRENDS FOR MNCS
Some governments used to be skeptical about the behavior of MNCs for such activities as use as tax havens, technology transfer, and destruction of domestic industry that may not be in accord with national interests. However, modern business is much advanced socioeconomically and highly sophisticated customers increasingly demand better choices of services. As the study of the working group revealed, the company that aims to be successful, regardless of whether it is domestic or foreign, has to be loyal to the customer as well as the nations it serves.
Looking from the standpoint of the U.S.-Japan economic friction, foreign capital companies are contributing to lessening trade friction by increasing imports. As shown in Table 2-13 , in 1991, the total amount of imports by foreign capital was 5,381.1 billion yen, which was 17.3 percent of Japan's total imports of 31 trillion yen. Furthermore, the foreign capital companies accounted for 2.2 percent of total assets of all companies in Japan, 2.5 percent of sales, 3.4 percent of profits, and 1.2 percent of employees.
Although there are important differences between the industrial structures of Japan and the United States, investments by Japanese companies in the United States have led to many business opportunities for U.S. companies. The U.S. manufacturing sector is said to have a higher rate of in-house production compared with the Japanese manufacturing sector.13 The management of a high captive production rate has the merit of speeding up the implementation of management decisions; however, it also has the demerit of higher cost since it is usually isolated from free market competition.14 The manufacturing operations of many small- and medium-sized Japanese companies in the United States provided opportunities for U.S. companies to lower their captive production rate. Meanwhile, leading Japanese companies have learned about local management practices in the United States and elsewhere and have been steadily increasing their degree of globalization.
Table 2-14 shows trends of inward direct investments in Japan. The investment, including cash loans, has been increasing steadily, in spite of the fact that criticism against the closed market has been rising. It tells us that MNCs have been investing based on their global strategies, centered around their Asian market strategy.
Japan is an important base for the global strategy of foreign companies, especially for that of Asian markets. Success in Japan makes it easier to penetrate into the Asian market. For example, Fuji Xerox, after successfully establishing their Japanese base, has set up subsidiaries in Korea, Taiwan, Thailand, Indonesia, and the Philippines. There are many more such examples. Due to China's rapidly growing economy, the U.S. investment into China has increased recently more than that of Japan as shown in Table 2-15 . Furthermore, even Vietnam, where the U.S. trade blockade was removed, is experiencing a foreign investment boom.
We are entering into a period of Asia's rapid growth. Japanese companies will not be able to enjoy leading positions in Asia any longer. Even the concept of the Asian economy as a flock of “flying geese” led by the Japanese economy, which has been called the key concept in Asia's
TABLE 2-13 Export-Import Balance of Foreign Capital Companies in Japan (100 million yen)
TABLE 2-14 Trends of Inward Foreign Direct Investment (million dollars)
TABLE 2-15 Top Ten Foreign Investors in China, 1979-1993
|
Number of Projects |
Contracted Investment (billion dollars) |
|
|
Hong Kong |
114,147 |
150.90 |
|
United States |
5,269 |
78.47 |
|
Taiwan |
20,982 |
18.40 |
|
Japan |
7,180 |
8.90 |
|
France |
242 |
6.84 |
|
Singapore |
3,122 |
4.80 |
|
Britain |
616 |
3.00 |
|
Thailand |
1,399 |
2.10 |
|
Canada |
1,540 |
1.80 |
|
Germany |
569 |
1.50 |
|
SOURCE: Ministry of Foreign Trade and Economic Cooperation. |
||
economic growth, will inevitably undergo substantial modification. Hence, it is quite possible that the concept of a vertical international integration of labor with Japanese companies at the top will become outdated. Similarly, complex, global corporate networks of Europe, America, and various Asian countries will likely spread through the Asian region.
During the 1970s and the first half of the 1980s, the independent management strategy that served as the basis for the overseas advance of Japanese MNCs started to shift. This trend, more than a simple shift in the strategies of individual firms, reflected a corporate response to a shift in the economic environment. With the increase of proportion of goods made overseas and the process of forming closer links with local companies, we are now facing the final days of the pure, one-country keiretsu corporate group as the basis for economic networking functions. As we entered into the 1990s, almost all major firms had formed sales and technology alliances with major U.S. companies. At the same time, many of the U.S. partners are those companies that entered Japan during the period of high-speed growth. With the lingering slump of the early 1990s, consolidation and rationalization of these groups are proceeding rapidly. 15
As the socioeconomic climate and industrial technology surrounding us has been changing so rapidly and becoming increasingly complex, it is no longer possible for MNCs to succeed by relying on traditional selfish strategies. Corporate core technologies are no longer sufficient to develop attractive products. Company sales networks alone are inadequate to sell products, especially in foreign markets. In order for MNCs to succeed, they have to be good local citizens in host countries. MNCs have to manage their businesses based on global strategies. Hence they have been developing complex industrial alliances in order to survive, regardless of political pressures. The Japanese working group highly appreciates this trend toward a better global industrial organization.
NOTES AND REFERENCES
1 Yoshihara, H. 1992. Foreign Capital Companies.Tokyo: Toyokeizai-shinposha.
2 Morgan, J. C. and J. J. Morgan. 1993. Nihon Sebryaku(Japan Strategy). Tokyo: Diamond; and International Herald Tribune,June 12, 1991.
3 Toyo Keizai Inc. 1992. Toyokeizai Handbook on Foreign Capital Companies 1992.Tokyo: Toyokeizai-shinposha.
4 Mauler, Reid. 1989. Nihon Shijo de no Kyoso(Competition in the Japanese Market), as translated by J. Hayashi. Tokyo: Symal Press.
5 Okimoto, D. 1991. MITI and High-Tech Industry.Tokyo: Simul Press; and G. J. Hane. 1993. “The Real Lessons of Japanese Research Consortia.” Issues in Science and Technology10(2):56.
6 Toyo Keizai Inc. 1991. Toyokeizai Handbook on Foreign Capital Companies 1991.Tokyo: Toyokeizai-shinposha.
7 Toyo Keizai Inc. 1994. Toyokeizai Handbook on Foreign Capital Companies 1994.Tokyo: Toyokeizai-shinposha.
8 Japan External Trade Organization. 1993. Current Status of Japanese Manufacturing Companies in the United States.Tokyo: Ministry of Finance Press Bureau.
9 Kaku, K. and H. Horaguchi. 1993. “Survey on Withdrawals from Foreign Markets.” Toyokeizai Handbook on Foreign Investments.Tokyo: Toyokeizai-shinposha.
10 Japan External Trade Organization, 1993, p. 19.
11 Sakurai, H. Unpublished mimeograph on U.S.-Japan joint ventures, provided for the case studies.
12 Stopford, J. M. and L. T. Wells. 1976. Organization and Ownership Policies of Multinational Companies,as translated by K. Yamazaki. Tokyo: Diamond.


