
Page 30
2
Our Aging World
One prominent demographic outcome of the 20th century is the extent of population aging that has resulted from reduced fertility and increased survival. For the first time in history, many societies have the opportunity to age. Accompanying this broad demographic process, however, are other changes—shifting disease profiles, macroeconomic strains, emergent technologies, changing work patterns and social norms—that are difficult for societies to anticipate and plan for. The intersection of such changes with an evolving demographic context may generate unforeseen issues that become the socioeconomic problems of current and future generations.
Although virtually all of the world's populations are becoming older on average, the extent and pace of aging can vary enormously from society to society. Likewise, as noted in Chapter 1, the meaning of the term “elderly” varies as a result of broad national differences in culture, institutions, and health. Indeed, any chronological demarcation of age boundaries is arbitrary and open to dispute on the grounds that it poorly represents the biological, physiological, or even psychological dimensions of the human experience. Attainment of age 85 may be as extraordinary in one nation as it is commonplace in another. Nevertheless, such demarcation is necessary for a descriptive comparison of international aging. In the following pages, therefore, the term “elderly” refers to persons aged 65 and over, and the term “oldest old” refers to those at least 80 years old. 1
1The chronological demarcation of “oldest old” is an arbitrary one. In industrialized nations, the term usually refers to people aged 85 and over, while in less industrialized nations, where life expectancy on average is lower, the term commonly refers to people aged 80 and over.Page 31
As a backdrop for subsequent chapters, this chapter describes the current demographic situation of the world's elderly and considers how the future situation might evolve. In addition to reviewing numbers and proportions of elderly people around the world, the discussion provides an overview of the dynamics of population aging, the increasingly important influence of changes in mortality at older ages on overall population aging, and the uncertainty such changes may introduce into our best efforts to project the size and composition of tomorrow's older population.
NUMBERS AND PROPORTIONS OF ELDERLY
Estimates for the year 2000 indicate an aggregate global total of 419 million persons aged 65 and over, 6.9 percent of the earth's total population. As noted in Chapter 1, the net balance of the world's elderly population is currently increasing by more than 750,000 people each month; two decades from now, the increase will likely be 2 million per month. The number of persons aged 65 and over has increased by 289 million since 1950 and by 99 million just since 1990. 2 In 1995, 30 countries had elderly populations of at least 2 million; projections to the year 2030 indicate that more than 60 countries will reach this level. 3
Population aging refers most commonly to an increase in the percentage of all extant persons who have lived to or beyond a certain age. While the size of the world's elderly population has been increasing for centuries, it is only in recent decades that the proportion has caught the attention of researchers and policy makers. Italy was the demographically oldest of the world's major 4 nations in 2000, with more than 18 percent of
2The demographic estimates and projections in this chapter are taken from two sources. Unless otherwise noted, estimates prior to 1990 are from the latest revision of World Population Prospects (United Nations, 1999). Estimates and projections from 1990 onward are from the International Data Base maintained by the International Programs Center, U.S. Bureau of the Census, and supported by the Office of the Demography of Aging, U.S. National Institute on Aging.
3Though these and other projected figures are by no means certain, they may be more accurate than demographic projections of total population because the latter must incorporate assumptions about the future course of human fertility. Short- and medium-term projections of tomorrow's elderly are not contingent upon fertility because anyone who will be aged 65 or over in 2030 has already been born. When projecting the size and composition of the world's future elderly population, human mortality is the key demographic component. As discussed later in this chapter, current and future uncertainties about changing mortality, particularly at the oldest old ages, may produce widely divergent projections of the size of tomorrow's elderly population.
4Some small nations or areas of special sovereignty, such as Monaco, San Marino, and the Isle of Man, have high percentages of elderly among their populations. Monaco's percentage is higher than that of Italy.
Page 32
its population aged 65 and over (compared with 8 percent in 1950). Other notably high levels (17 percent or more) are seen in Sweden, Greece, Belgium, and Japan. The elderly share of total population will increase only modestly in most industrialized nations between 2000 and 2010, and may even dip slightly as a function of the relatively small cohorts born prior to and during World War II. After 2010, the numbers of and percents of elderly should increase rapidly in some countries as the large post-war birth cohorts (the baby boom) begin to reach age 65.
Europe has had the highest proportions of population aged 65 and over among major world regions for many decades and should remain the global leader in this regard well into the 21st century (see Table 2-1).
|
Region |
Year |
65 Years and Over |
75 Years and Over |
80 Years and Over |
|
Europe |
2000 |
14.0 |
5.6 |
2.8 |
|
2015 |
16.3 |
7.7 |
4.3 |
|
|
2030 |
23.1 |
10.8 |
6.3 |
|
|
2050 |
28.6 |
15.7 |
10.2 |
|
|
North America |
2000 |
12.6 |
6.0 |
3.3 |
|
2015 |
14.8 |
6.3 |
3.8 |
|
|
2030 |
20.3 |
9.4 |
5.4 |
|
|
2050 |
20.7 |
11.6 |
8.0 |
|
|
Oceania |
2000 |
10.2 |
4.5 |
2.4 |
|
2015 |
12.7 |
5.4 |
3.2 |
|
|
2030 |
16.3 |
7.5 |
4.4 |
|
|
2050 |
20.0 |
10.6 |
6.6 |
|
|
Asia |
2000 |
5.9 |
1.9 |
0.8 |
|
2015 |
7.7 |
2.7 |
1.3 |
|
|
2030 |
11.9 |
4.5 |
2.2 |
|
|
2050 |
18.0 |
8.5 |
4.9 |
|
|
Latin America/Caribbean |
2000 |
5.5 |
1.9 |
0.9 |
|
2015 |
7.4 |
2.8 |
1.5 |
|
|
2030 |
11.6 |
4.5 |
2.4 |
|
|
2050 |
18.1 |
8.4 |
4.9 |
|
|
Near East/North Africa |
2000 |
4.3 |
1.4 |
0.6 |
|
2015 |
5.2 |
1.8 |
0.9 |
|
|
2030 |
8.1 |
2.8 |
1.3 |
|
|
2050 |
13.3 |
5.4 |
2.9 |
|
|
Sub-Saharan Africa |
2000 |
2.9 |
0.8 |
0.3 |
|
2015 |
3.1 |
1.0 |
0.4 |
|
|
2030 |
3.7 |
1.3 |
0.6 |
|
|
2050 |
5.3 |
1.8 |
0.9 |
SOURCE: U.S. Bureau of the Census (2000).
Page 33
Of the 30 nations with populations at least 13 percent elderly in 2000, only 2 (Japan and Uruguay) are non-European. Until recently, Europe also had the highest proportions of population in the most advanced age categories. But by 1995, percentages of population aged 75 and over and 80 and over in North America had surpassed those in Europe as a whole, largely as a result of small European birth cohorts around the time of World War I. By 2015, however, these percents are again expected to be highest in Europe, and in the year 2050, nearly one of every six Europeans is projected to be aged 75 or older.
North America and Oceania also have relatively high aggregate percentages of elderly, and these are projected to increase substantially in the coming decades. Levels for 2000 in Asia and Latin America/Caribbean are expected to more than double by 2030, while aggregate proportions of elderly population in sub-Saharan Africa will grow rather modestly as a result of continued high fertility in many nations.
Two important factors bear mention when considering aggregate elderly proportions of regional populations. The first is that regional averages often mask great diversity (see Figure 2-1). Bangladesh and Thailand may be close geographically, but they have divergent paths of expected population aging. Likewise, many Caribbean nations have high proportions of elderly population (the Caribbean is the oldest of all developing world regions) in comparison with their Central American neighbors. By the middle of the 21st century, the elderly share of the total population in Italy is projected to exceed 36 percent, significantly higher than the European average in Table 2-1. Second and more important, percentages by themselves may not give a sense of the growth of absolute numbers. Although the change in percent elderly in sub-Saharan Africa from 2000 to 2015 in Table 2-1 is barely perceptible, the size of the elderly population is expected to increase by 50 percent, from 19.3 to 28.9 million people.
Sometimes lost amid the attention paid to population aging in Europe and North America is the fact that older populations in developing countries typically are growing more rapidly than those in the industrialized world. 5 As noted earlier, the net balance of the world's elderly population was increasing by more than 750,000 persons each month at the end of the 1990s; 80 percent of this change was occurring in the developing world. Projections to the year 2050 suggest that the growth rate of the elderly in
5The country classification used in this chapter corresponds to that of the United Nations, wherein “more developed” (and its synonyms “industrialized” and “developed”) comprises all nations in Europe (including seven of the former republics of the Soviet Union) and North America, plus Japan, Australia, and New Zealand. The remaining nations of the world are classified as “less developed” (also referred to as “developing”).Page 34
FIGURE 2-1 Mean and range of variation in percent elderly, by region: 2015. SOURCE: U.S. Bureau of the Census (2000). 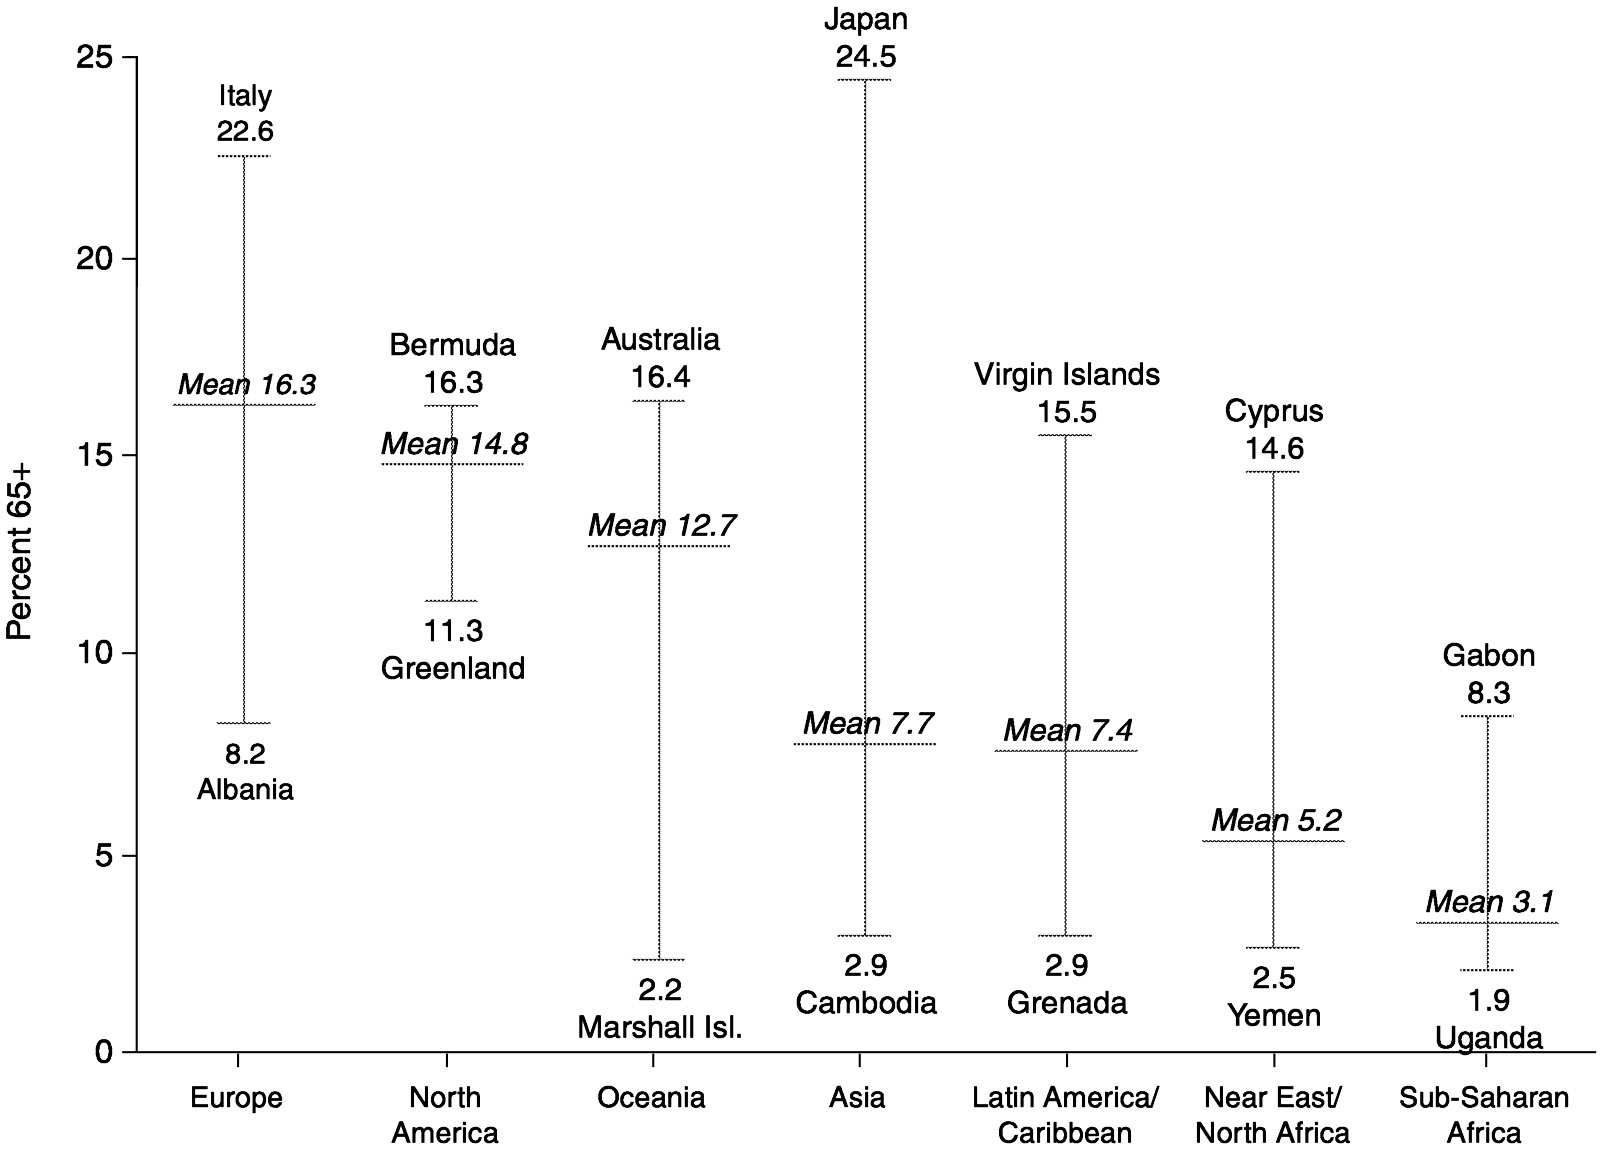
~ enlarge ~
Page 35
SOURCE: United Nations (1999). 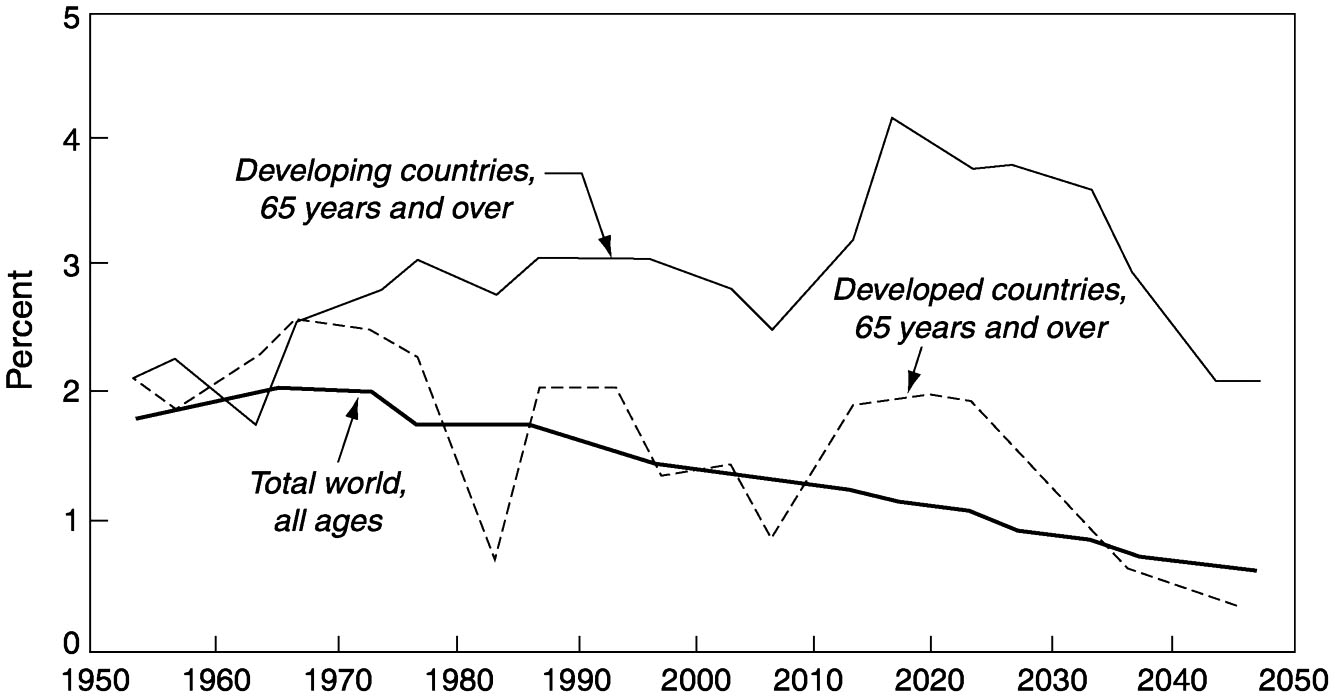
~ enlarge ~
FIGURE 2-2 Average annual percent growth of elderly population in developed and developing countries.
the developing world will remain significantly higher than in today's industrialized countries (see Figure 2-2). Between 2000 and 2050, countries as diverse as Colombia, Liberia, and Malaysia may expect more than a quadrupling of their elderly populations.
GROWTH OF THE OLDEST OLD
As a result of past fluctuations in fertility and current trends in mortality, age categories within the elderly aggregate may grow at different rates. An increasingly important feature of societal aging is the progressive aging of the elderly population itself. The fastest-growing age segment in many countries is the oldest old. This group currently constitutes more than 20 percent of the aggregate elderly population in industrialized countries (as opposed to about 13 percent in 1950). In the year 2000, nine industrialized nations had oldest old populations in excess of 1 million. While the proportions of oldest old are lower in developing countries, absolute numbers may be quite high. China, for example, was home to approximately 11.5 million oldest old in 2000, more than in any other country of the world. Figure 2-3 shows the estimated percent distribution of the world's population aged 80 and over at the turn of the century.
There is substantial international variation in the projected age components of elderly populations. The share of oldest old among all elderly in the United States was 26 percent in 2000 and is expected to be the same by 2030; the flow of baby boom cohorts into the ranks of the elderly after
Page 36
NOTE: Data represent the share of the world's total oldest old in each country or region. Individual countries with 2 percent or more of the total are shown separately. SOURCE: U.S. Bureau of the Census (2000). 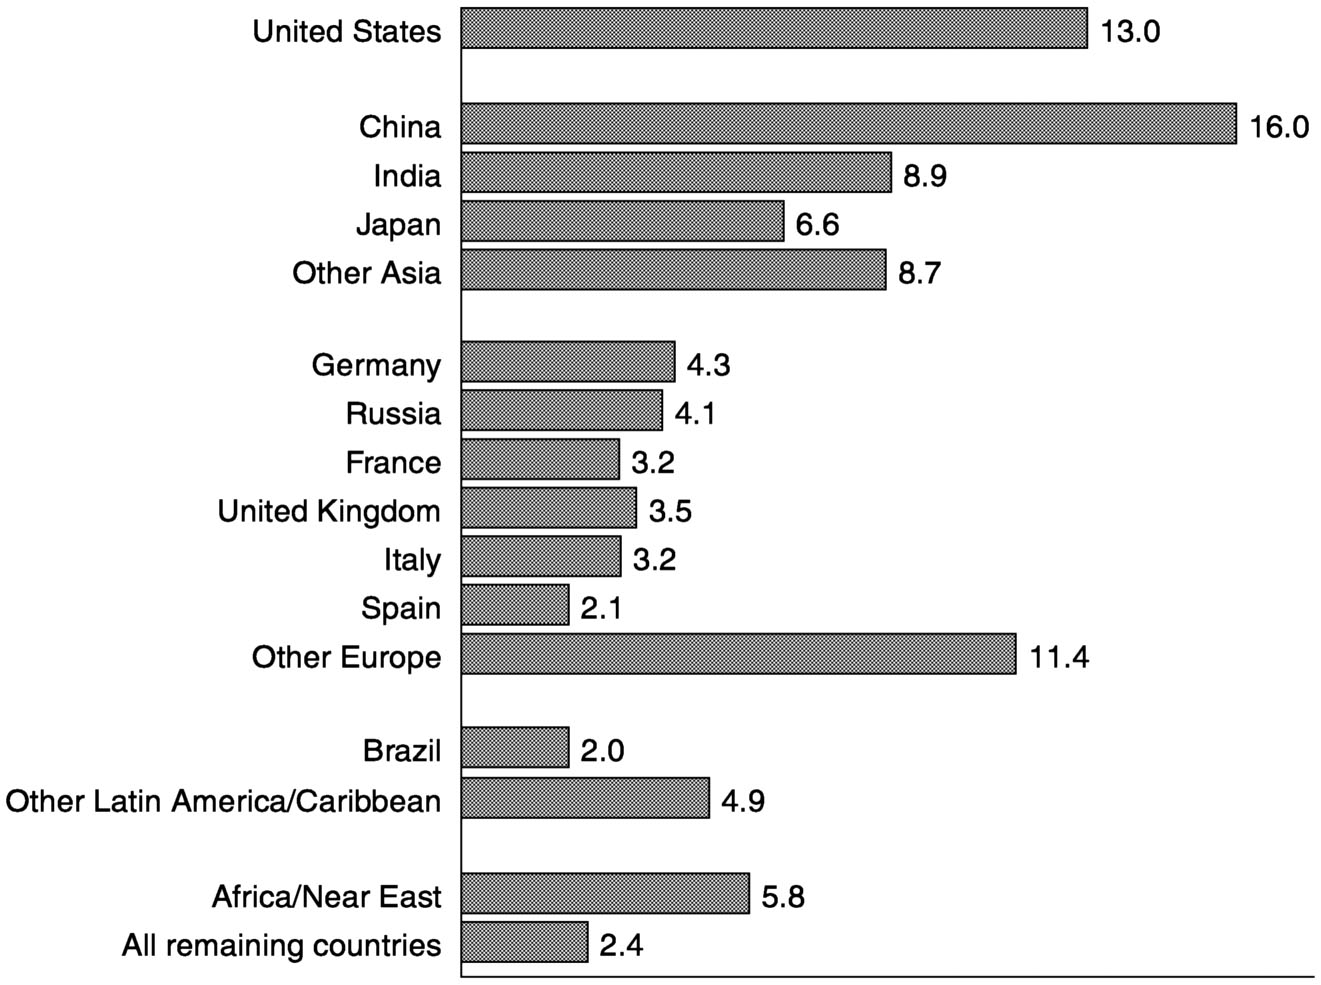
~ enlarge ~
FIGURE 2-3 Percent distribution of world population aged 80 and over: 2000.
2010 will keep the overall elderly population relatively young. Because of differences in past fertility and mortality trends, some European nations will experience a sustained rise in the share of the oldest old among their elderly populations, while others will see an increase during the next two decades and then a subsequent decline. The most striking global increase is likely to occur in Japan; by 2030, nearly 40 percent of all elderly Japanese are expected to be at least 80 years old. Most developing countries should experience modest long-term increases in this ratio.
The share of oldest old among the elderly population may not change significantly in some societies, but burgeoning absolute numbers merit attention. In the United States, the oldest old increased from 374,000 in 1900 to more than 9 million today. The static proportion noted above for the United States masks a projected absolute increase of more than 9 million oldest old (see Figure 2-4). Four-generation families are becoming
Page 37
SOURCES: U.S. Bureau of the Census for 1900-1990, decennial census data; for 2000-2050, “Population Projections of the United States by Age, Sex, Race, Hispanic Origin, and Nativity: 1999 to 2100” (published January 2000) <
http://www.census.gov/population/www/projections/natproj.html >. 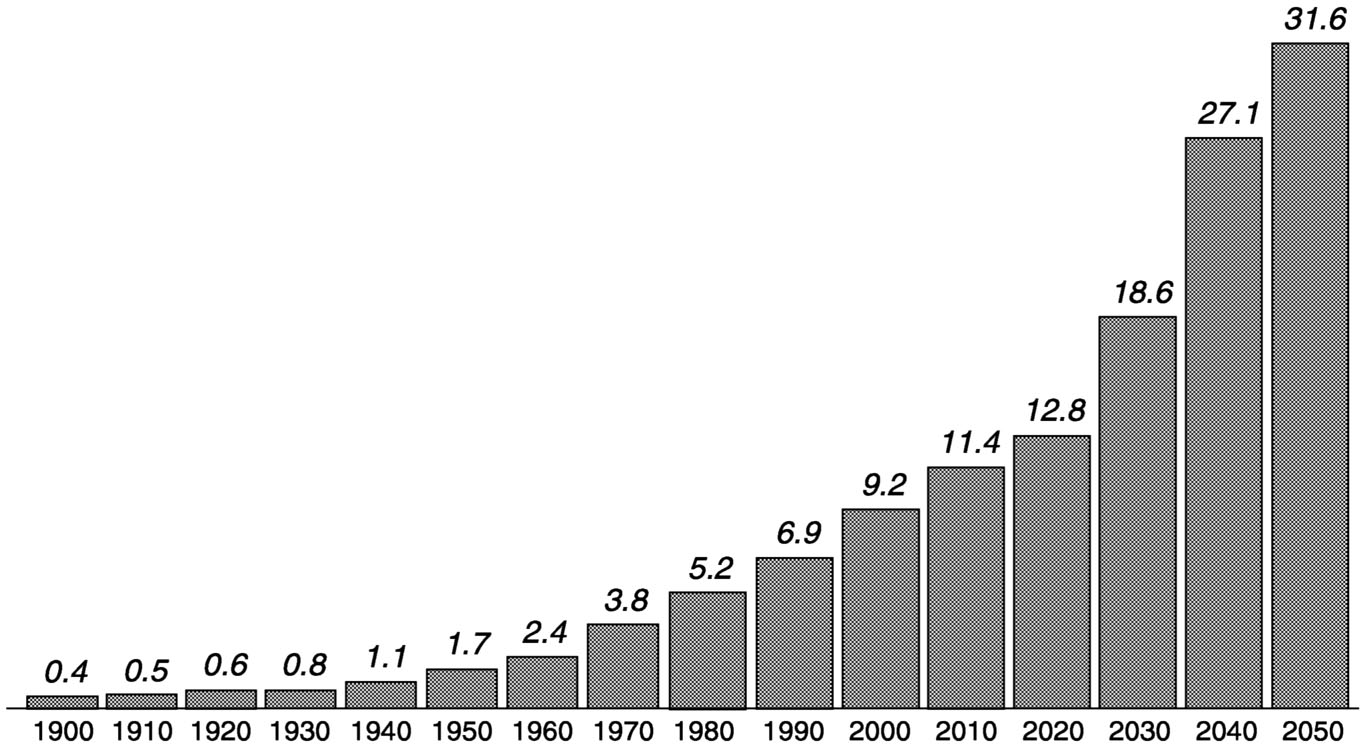
~ enlarge ~
FIGURE 2-4 Population aged 80 and over in the United States: 1900 to 2050 (in millions).
increasingly common (Soldo, 1996; Grundy et al., 1999), and the aging of baby boom cohorts may result in a great-grandparent boom.
The demands of the oldest old vis-à-vis policy making should increase markedly in the 21st century as a result of levels of illness and disability much higher than those of other age groups. The numerical growth and increasing heterogeneity of the oldest old compel social planners to seek further health and socioeconomic information about this group. While it may be simplistic to equate the growth of the oldest old with spiraling health care costs (Binstock, 1993), the fact remains that this group consumes disproportionate amounts of health and long-term care services (Suzman et al., 1992).
METRICS OF AGING
Speed of Aging
The transition from a youthful to a more aged society has occurred gradually in some nations, but will be compressed in many others. For instance, it took only a quarter of a century for the proportion of population aged 65 and over in Japan to increase from 7 to 14 percent (see Figure
Page 38
2-5). A similarly short transition period is projected for China beginning in the year 2000, and for several other East Asian nations, such as South Korea and Thailand, beginning slightly later in the 21st century. These rapid gains will be driven by sharp drops in fertility in recent decades. In
SOURCE: Kinsella and Gist (1995). 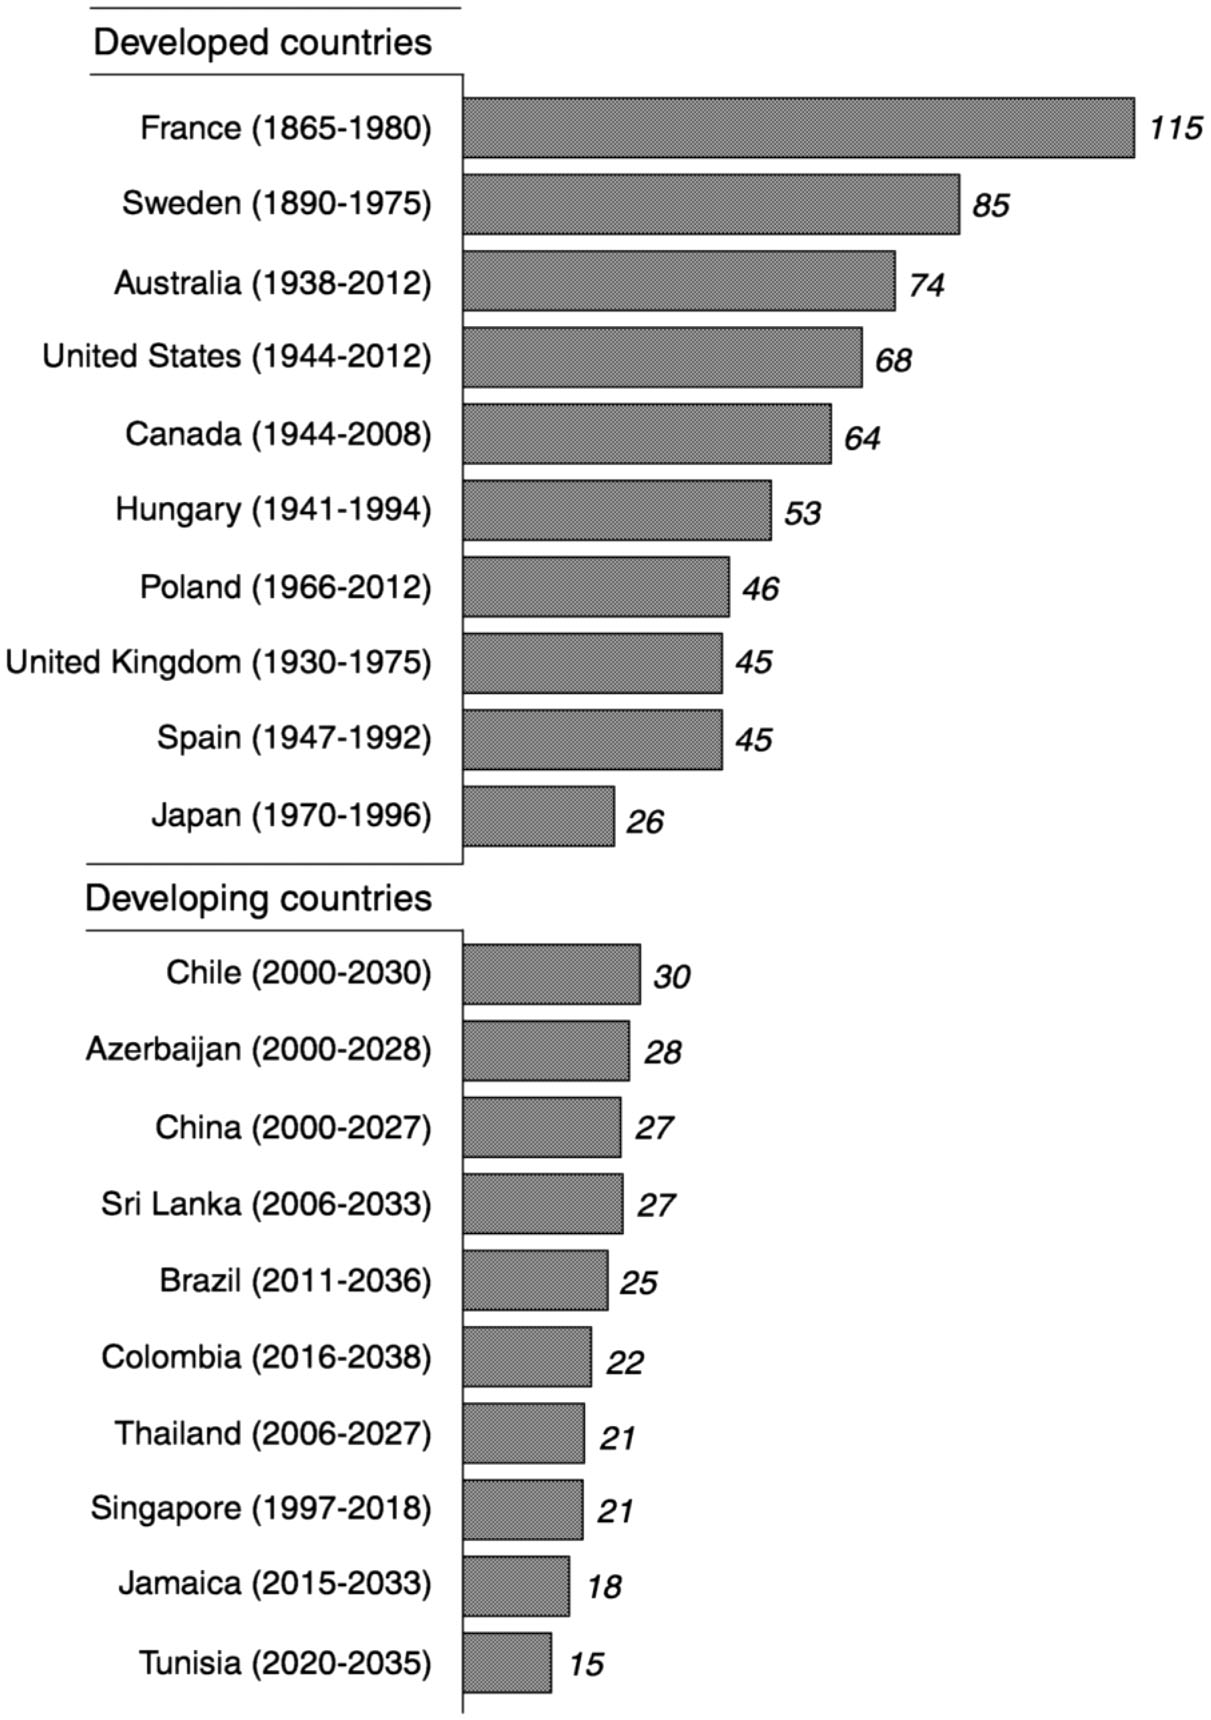
~ enlarge ~
FIGURE 2-5 Speed of population aging (number of years required or expected for percent of population aged 65 and over to rise from 7% to 14%).
Page 39
South Korea, for example, the total fertility rate 6 plummeted from 5 children per woman in the late 1960s to less than 1.8 today. The pace of aging in parts of Asia stands in stark contrast to that in some European countries, where the comparable change occurred over a much longer period. The percent elderly among France's population was higher in the mid-1800s than the current percent elderly in a large majority of the world's developing countries. However, today's rapidly aging societies are likely to face the contentious issues related to health care costs, social security, and intergenerational equity that have sparked public debate in Europe and North America. The speed of population aging may even prompt governments to rethink their overall population policies. Singapore, once a prime advocate of fertility reduction, achieved such success in this arena that the declining birth rate became a cause for political and economic concern. Consequently, Singapore's “Stop at 2” (children) policy was modified in 1987 to provide incentives for higher fertility, particularly among better-educated segments of the population (Phillips and Bartlett, 1995).
Median Age
Another way to look at population aging is to consider a society's median age, the age that divides a population into numerically equal parts of younger and older persons. While nearly all industrialized countries are above the 31-year level, most developing nations have median ages under 25. In some African and South Asian countries in the mid-1990s, half of the entire population was younger than 15, and high numbers of annual births are likely to keep these countries relatively young in the near future. Yet in developing countries such as China, South Korea, and Thailand, where fertility rates have fallen precipitously, median ages are rising rapidly and should exceed 40 by the year 2025.
The concept of median age encourages a broader view of population aging that focuses less on the elderly population per se. In many developing countries, the initial effects of population aging will be seen in the relative growth of young and middle-aged adult populations. This implies a shift in overall population age structure, with accompanying changes in labor force characteristics, household/family structure, and disease patterns. On the one hand, the movement of large birth cohorts into the prime working ages represents an opportunity from a business or government planning perspective. As the working-age population swells, it provides a large potential labor force that may serve as a social and tax
6The total fertility rate is defined as the average number of children that would be born per woman if all women lived to the end of their childbearing years and bore children according to a given set of age-specific fertility rates.
Page 40
base for dependents at both ends of the age continuum. Large numbers of workers relative to elderly persons also may provide the incentive to introduce or expand defined-benefit (pay-as-you-go) pension programs. The latter, however, often become unsustainable in the long run as declines in fertility eventually produce shrinking cohorts of new workers (see Chapter 3). And the potential opportunity presented by a large labor force may be confounded by unstable economic growth and job availability. For example, dramatic percentage increases in labor force size are likely to occur in Africa and the Near East during the period 1990-2020, and the aggregate number of potential job seekers will more than double. The percentage increase will be less in other developing regions, but the absolute growth will be enormous. In Asia alone, economies will need to generate more than a billion additional jobs during the next three decades simply to maintain current rates of employment.
Head-Count Ratios
A second common set of aging indicators includes the aging index and the elderly support ratio, both of which relate the size of one broad age group (or groups) to another. The aging index is usually defined as the number of people aged 65 and over per 100 youths under the age of 15. Changes in this ratio over time simply indicate the shifting balance of children versus elderly within a society. By the year 2030, most developed countries have a projected aging index of at least 100, and several European countries and Japan likely will have indexes in excess of 200. 7 The elderly support ratio typically is construed as the number of people aged 65 and over per 100 persons aged 20-64, the so-called working-age population. This ratio is often combined with a youth support ratio (persons aged 0-19 per 100 persons aged 20-64) to form a total support ratio that provides a rough indication of the number of non-economically active versus economically active persons in a given society. Such aggregate “head count” measures may be broadly useful in thinking about evolving population age structures, and the shifting weight of youth versus elderly in a country such as China can be remarkable (see Figure 2-6). However, measures such as the elderly support ratio also embody questionable assumptions that make them of limited analytical use (see Box 2-1).
7Given its aggregate nature, the aging index may be more useful for examining within-country differences in the level of population aging than for tracking national-level changes. For example, there can be significant differences in the extent of aging between urban and rural areas and among broader regions, especially in large nations such as Brazil. Based on 1991 census data, the overall aging index in Brazil was 14. However, this measure ranged from less than 6 in several northern states of the country to 21 in the state of Rio de Janeiro.
Page 41
NOTE: Total ratio = persons 0 to 19 and 65 years and over per 100 persons 20 to 64 years; youth ratio = persons 0 to 19 years per 100 persons 20 to 64 years; elderly ratio = persons 65 years and over per 100 persons 20 to 64 years. SOURCE: U.S. Bureau of the Census (2000). 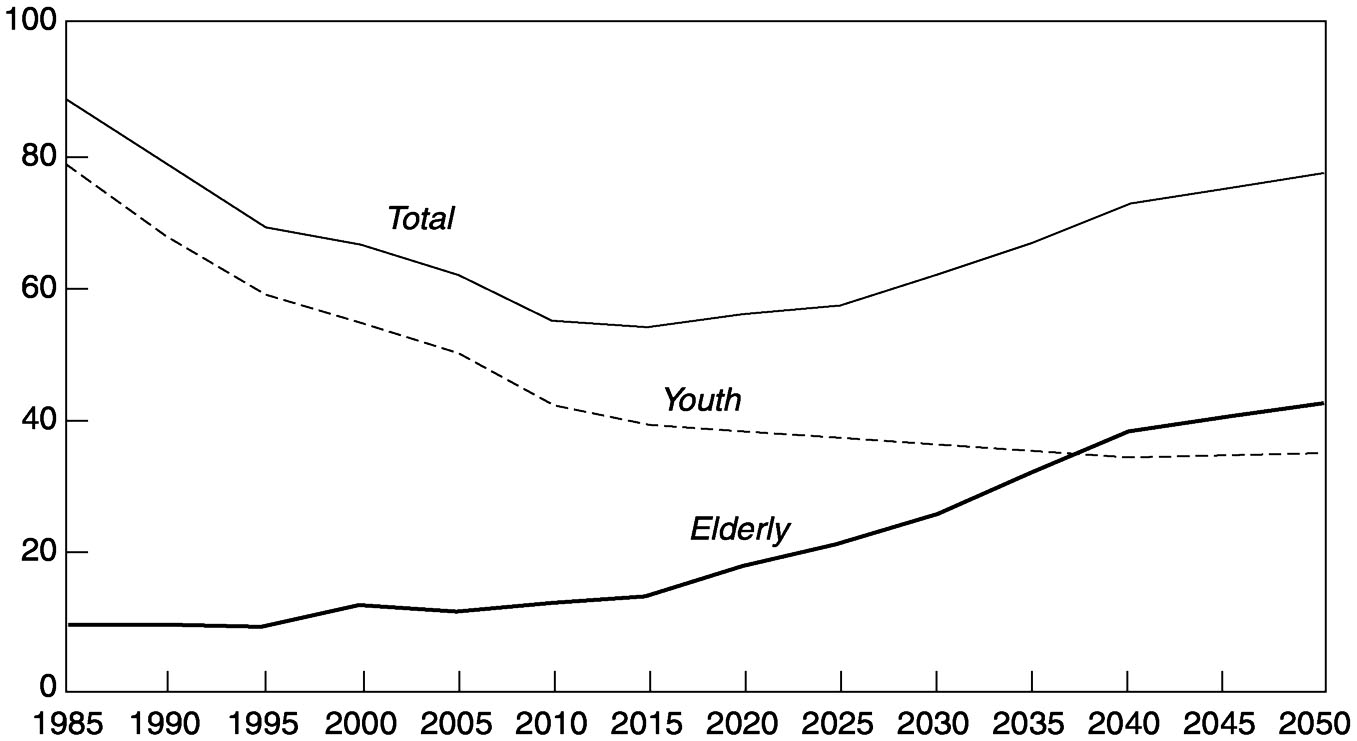
~ enlarge ~
FIGURE 2-6 Support ratios in China: 1985 to 2050.
DYNAMICS OF POPULATION AGING
More sophisticated models and analyses of aging have been developed to partition population growth into different categories (Lee, 1994) and to consider factors such as generation length (Preston, 1986), fertility and mortality “echo” effects (Stolnitz, 1992), population momentum (Kim and Schoen, 1997), and changes in age distribution within age categories (Chu, 1997). Regardless of how one conceptualizes population aging, the process involves primarily change over time in levels of fertility and mortality. Populations with high fertility tend to have low proportions of older persons and vice versa. Current total fertility rates in excess of 6 children per woman usually correlate with elderly population shares of less than 3 percent.
Demographers use the term “demographic transition” to refer to the gradual process whereby a society shifts from having high to having low rates of fertility and mortality. 8 This transition is characterized first by declines in infant and child mortality as infectious and parasitic diseases
8The concept of demographic transition is broad, and some would argue that it has many permutations and/or that there is more than one form of demographic transition; see, for example, the discussions in Coale and Watkins (1986) and Jones et al. (1997).
Page 42
BOX 2-1Usefulness of Elderly Support RatiosImplicit in the standard definition of an elderly support ratio is the notion that all people aged 65 and over are in some sense dependent on the population at the working ages, 20 to 64. The latter often provide direct support to the elderly, as well as indirect support through taxes and contributions to social welfare programs. We know, of course, that elderly populations are extremely diverse in terms of resources, needs, and abilities, and that many elderly are not dependent in either a financial or a physical (health) sense. Older people pay taxes, possess wealth that fuels economic growth, and provide support to younger generations. Likewise, substantial portions of the working-age population may not be financial earners because of unemployment, inability to work, pursuit of education, and so on. While it is empirically difficult to incorporate factors such as intrafamily financial assistance and child care activities into an aggregate social support measure, it is feasible to take account of the employment characteristics of both the working-age and elderly populations. In Figure 2-7, the topmost bar for each country represents the standard elderly support ratio as defined above. The second bar includes only the economically active population aged 20 to 64 in the denominator, thereby excluding those who choose not to work, unpaid household workers, non-working students, and perhaps those individuals whose health status keeps them out of the labor force. The third bar represents a calculation similar to the second, but removes economically active people aged 65 and over from the numerator on the assumption that they are not economically dependent. The fourth bar builds on the third by adding these economically active elderly to the ratio denominator of other economically active individuals, on the assumption that these working elderly continue to contribute tax revenue to national coffers. The alternative ratios are higher than the standard elderly support ratio in industrialized countries except in Japan, where the elderly have a relatively high rate of labor force participation (often as part-time workers). To the extent that policy and program agencies use support ratio calculations, the impact of including versus excluding labor force participation rates appears considerable in most countries. Data permitting, other adjustments might be made to these ratios to account for such factors as (1) workers under age 20, (2) unemployment rates, (3) average retirement ages, (4) levels of pension receipt and institutionalization among the elderly, and (5) the prevalence of disabilities. The implications of some of these factors are considered in more detail in subsequent chapters. And it may be argued that an intergenerational accounting method such as that discussed in Chapter 5 provides a more useful summary of the state of balance in an age distribution than do population support ratios. |
are controlled. The resulting improvement in life expectancy at birth occurs while fertility tends to remain high, thereby producing large birth cohorts and an expanding proportion of children relative to adults. Other things being equal, this initial decline in mortality produces a younger population age structure as more babies and young children survive the
Page 43
SOURCE: U.S. Bureau of the Census (2000). 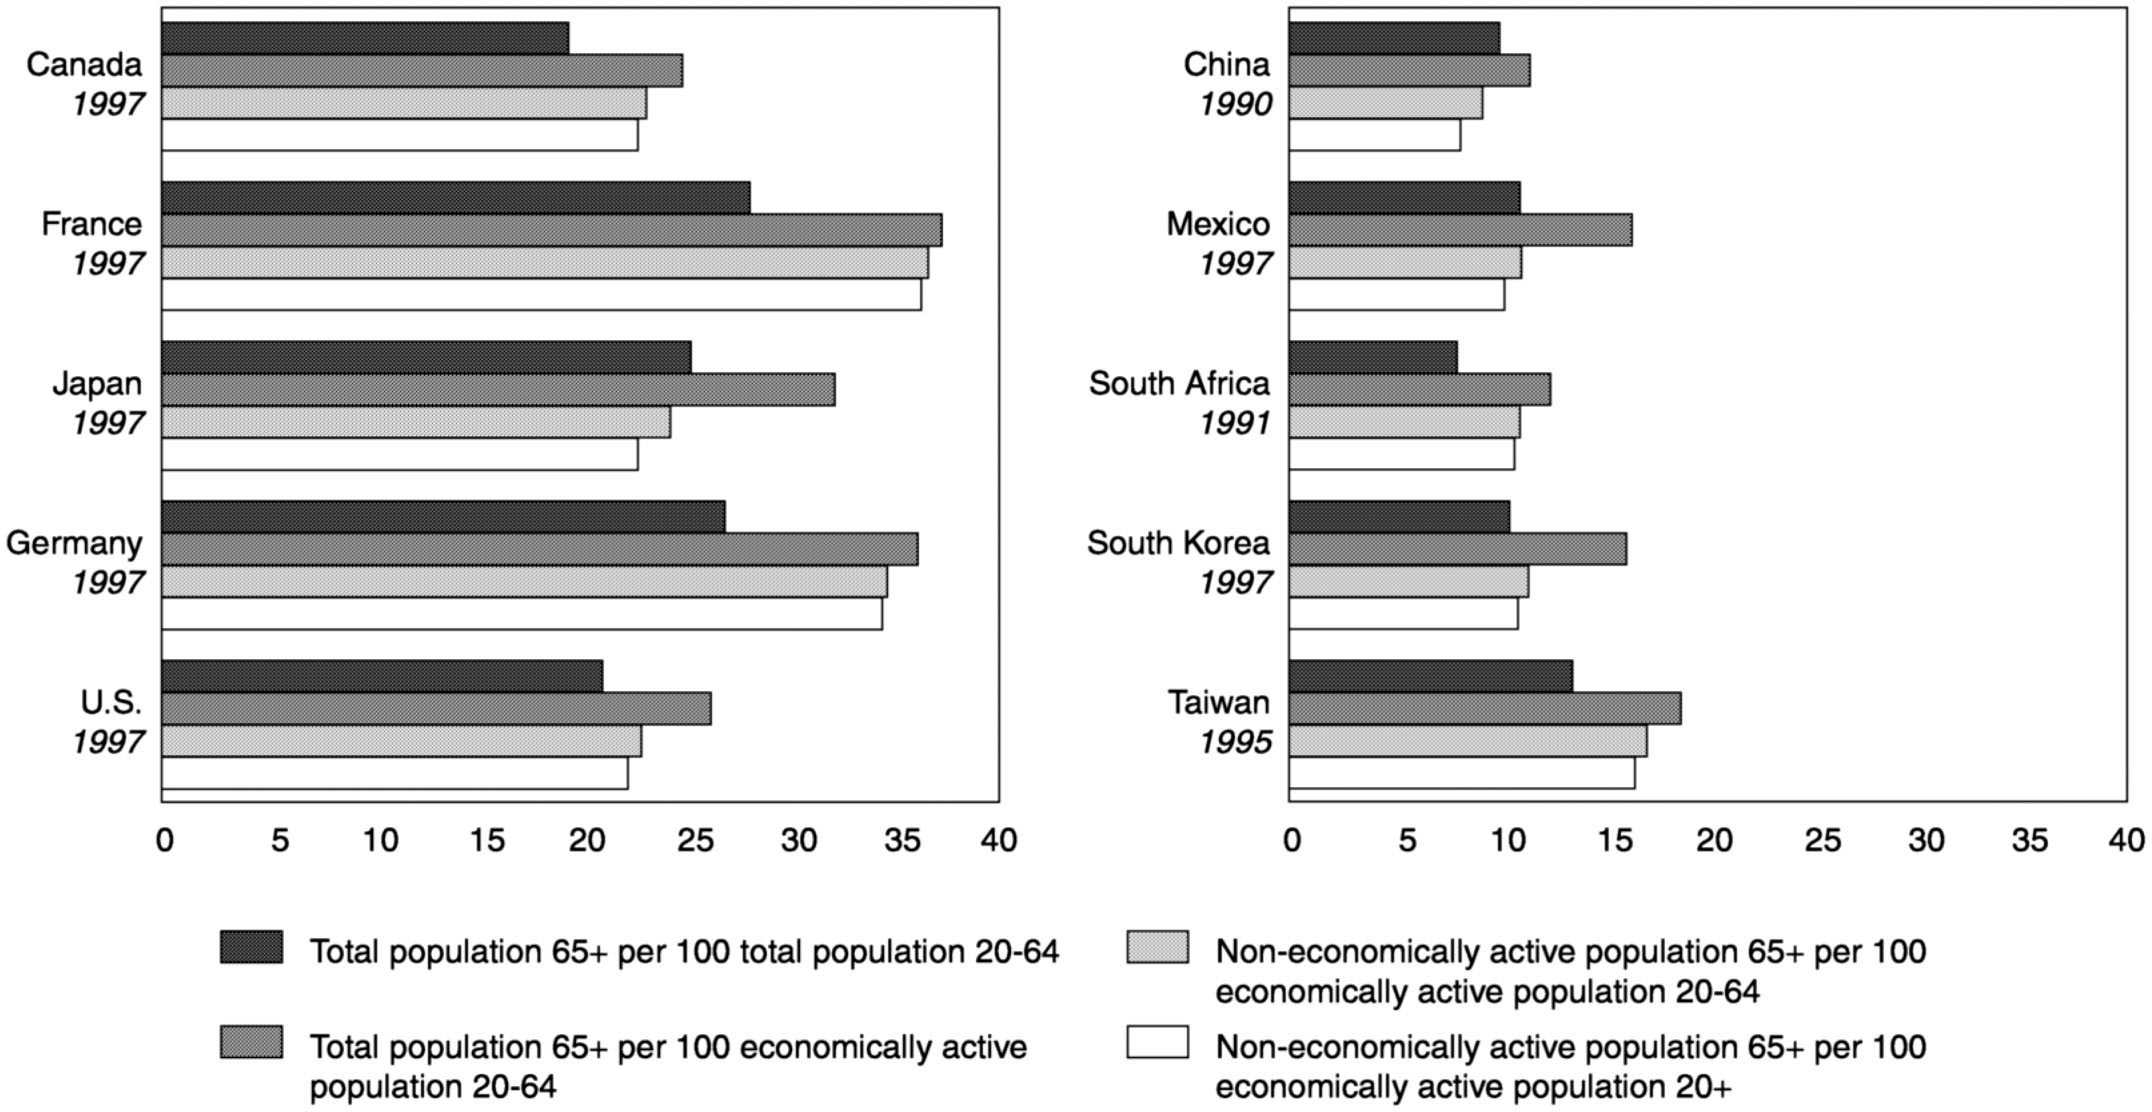
~ enlarge ~
FIGURE 2-7 Standard and alternative elderly support ratios: Selected years 1990 to 1997.
Page 44
initial high-risk years (Lee, 1994). Generally, whole populations begin to age when fertility rates decline and mortality improvements occur at older ages. Successive birth cohorts may eventually become smaller and smaller, although some countries experience a “baby boom echo” when women from large birth cohorts reach childbearing age.
International migration usually does not play a major role in the demography of aging. One might expect that a steady stream of migration from one country to another would result in additional aging in the sending country, given that most migrants tend to be under the age of 65, and a corresponding rejuvenation of the receiving country. However, numerous studies have shown that the numbers of migrants must be very large to have an appreciable effect on population aging (see, e.g., Lesthaeghe et al., 1988; Le Bras, 1991; Lesthaeghe, 2000). In a major receiving country such as the United States, it has been shown that an annual immigration of 1.4 million persons a year has a very small effect on the projected future percentage of elderly (Day, 1996). Sustained immigration has little impact on overall age composition because immigrants themselves age (Espenshade, 1994), and because initial labor migration often becomes family migration as relatives join family members who have become established in a new country.
International migration can, however, be significant in smaller populations. Certain Caribbean nations, for example, have experienced a combination of emigration among working-age adults, immigration of elderly retirees from other countries, and return migration of former emigrants who are above the average population age; all three factors contribute to population aging. And, as noted below, international migration may come to assume a more prominent role in the aging process, particularly in graying countries where persistently low fertility has led to stable or even declining total population size. Eventual shortages of workers could generate demand for immigrant labor (Peterson, 1999) and could force nations to choose between relaxed immigration policies and pronatalist strategies designed to raise birth rates (Kojima, 1996). Debate on these issues has recently heated up in Europe (United Nations, 2000b).
The most prominent historical factor in population aging has been fertility decline. The generally sustained decrease in total fertility rates in industrialized nations since at least 1900 has resulted in current levels below the population replacement rate of 2.1 live births per woman in most such nations. Persistent low fertility since the late 1970s has led to a decline in the size of successive birth cohorts and a corresponding increase in the proportion of older relative to younger persons. The Population Division of the United Nations (1999) projects that the populations of Japan and most of Europe will decrease in size over the next 50 years, a projection that has resulted in increased attention to “replacement migra-
Page 45
tion” as a possible solution to declining populations and rapid aging (Eberstadt, 2000; United Nations, 2000a, b). This concern is increasingly discussed in popular as well as scholarly literature, although some demographers (see Bongaarts, 2000) have emphasized that delayed childbearing and expressed preference for larger family sizes may well raise the currently low levels of European fertility.
Fertility change in the developing world has been more recent and more rapid, with most regions having achieved major reductions in fertility rates over the last 30 years. Although the aggregate total fertility rate remains in excess of 5 children per woman in Africa, overall levels in Asia and Latin America decreased by about 50 percent (from approximately 6 to 3 children per woman) from 1965 to 1995. Total fertility in many developing countries—notably Chile, China, South Korea, Thailand, and at least a dozen Caribbean nations—is now at or below replacement level.
Figure 2-8 illustrates the historical and projected transition in population age structure in developed and developing countries. At one time, most if not all countries had a youthful age structure similar to that of developing countries as a whole in 1950. A large percentage of the entire population was under the age of 15. Given the relatively high rates of fertility that prevailed in most developing countries from 1950 through
SOURCE: United Nations (1999). 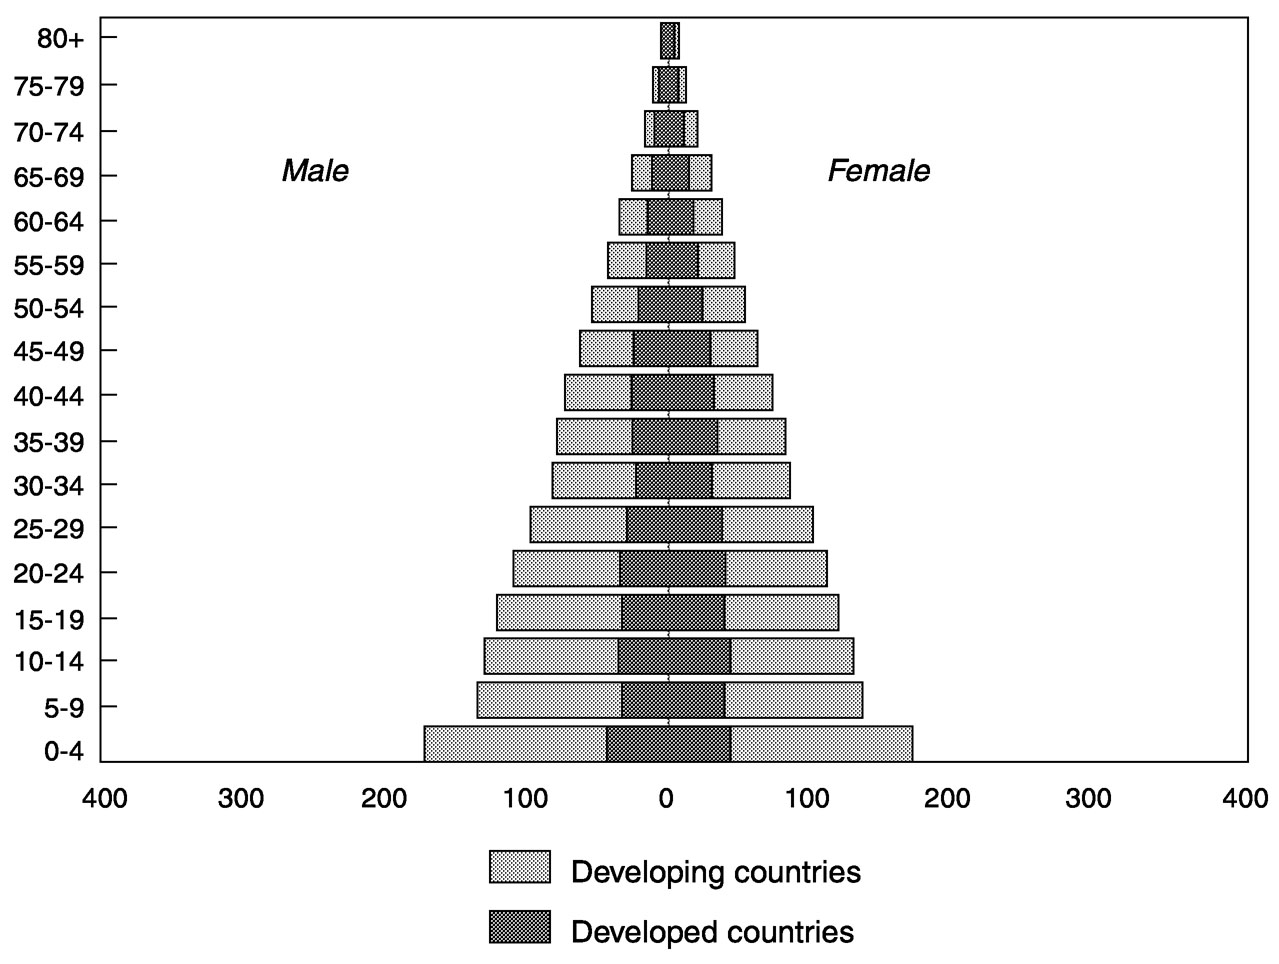
~ enlarge ~
FIGURE 2-8a Population, by age and sex: 1950 (in millions).
Page 46
SOURCE: United Nations (1997). 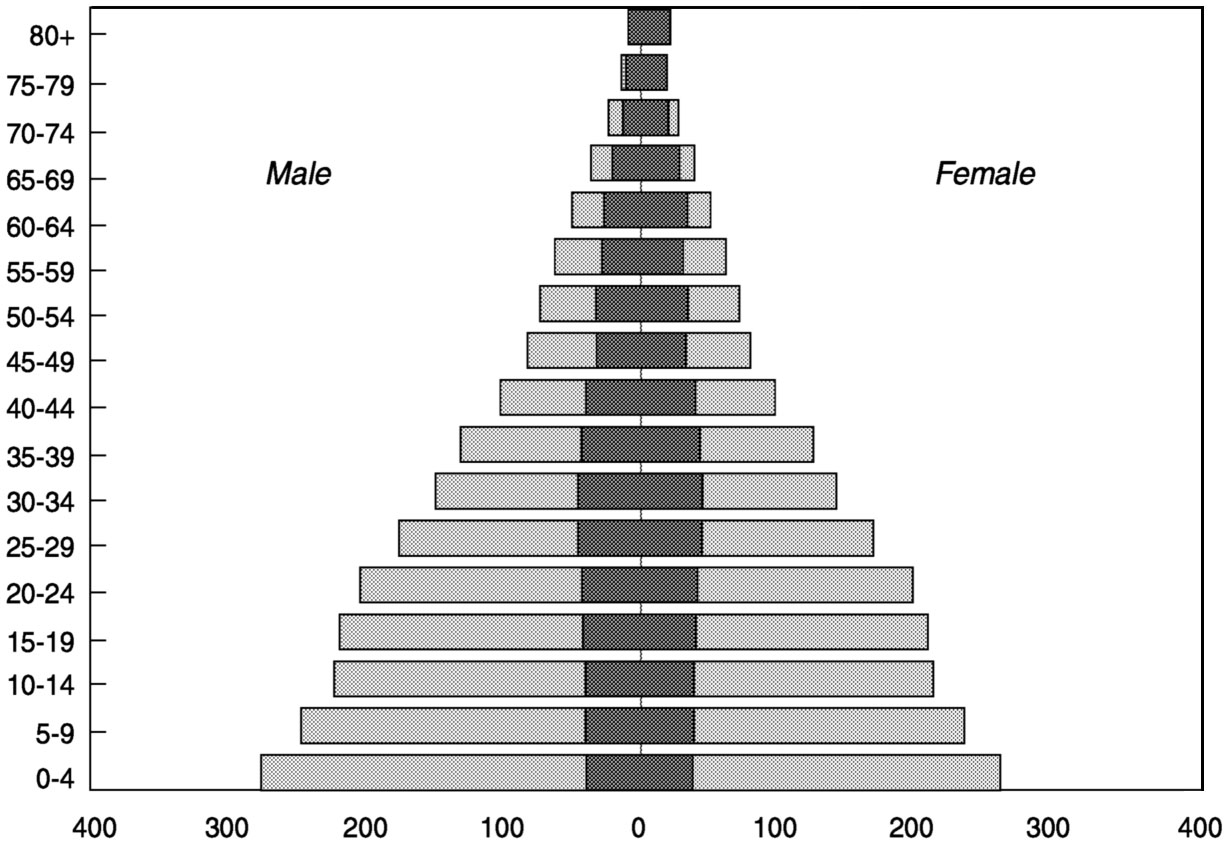
~ enlarge ~
FIGURE 2-8b Population, by age and sex: 1990 (in millions).
SOURCE: U.S. Bureau of the Census (2000). 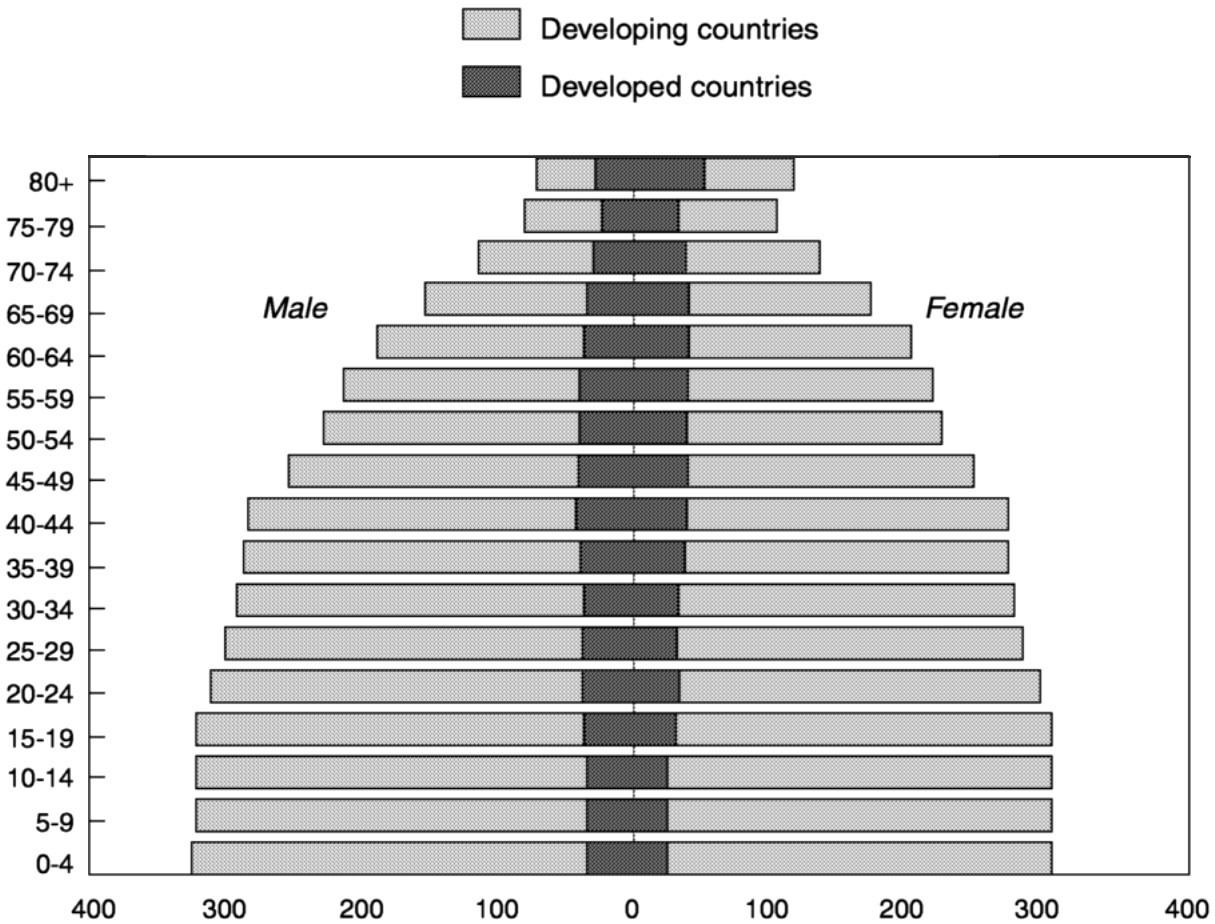
~ enlarge ~
FIGURE 2-8c Population, by age and sex: 2030 (in millions).
Page 47
the early 1970s, the overall pyramid shape had changed very little by 1990. However, the effects of fertility and mortality decline can be seen in the projected pyramid for 2030, which loses its strictly triangular shape as the elderly portion of the total population increases.
The picture in developed countries has been and will be quite different. In 1950, there was relatively little variation in the size of 5-year groups between the ages of 5 and 24. The beginnings of the post-World War II baby boom can be seen in the 0-to-4-year age group. By 1990, the baby boom cohorts were 25 to 44 years old, and the cohorts under age 25 were becoming successively smaller. If fertility rates continue as projected through 2030, the aggregate pyramid will start to invert, with more weight on the top than on the bottom. The prominence of the oldest old (especially women) will increase, and persons aged 80 and over will out-number any younger 5-year age group.
Life Expectancy at Birth
The stunning gains in human life expectancy that accelerated in the mid-1800s and continued during the following century often are attributed primarily to improvements in medicine. However, the major impact of improvements in both medicine and public health did not occur until the late 19th century (McKeown, 1979). Earlier and more important factors in lowering mortality were innovations in industrial and agricultural production and distribution, which enabled nutritional diversity and consistency for large numbers of people (Thomlinson, 1976). A growing research consensus attributes the gain in human longevity since the early 1800s to a complex interplay of advances in medicine and public health coupled with new modes of familial, social, economic, and political organization, as well as related behavioral changes (Preston and Haines, 1991; Moore, 1993).
Although the effect of fertility decline is usually the driving force behind changing population age structures, changes in mortality assume much more importance as countries reach lower levels of fertility (Caselli and Vallin, 1990; Gjonca et al., 1999). Since the beginning of the 20th century, industrialized countries have made great progress in extending life expectancy at birth (see Table 2-2). 9 Japan enjoys the highest life
9Measurement of mortality trends and magnitudes of change requires the selection of an appropriate index that represents the level of mortality and a decision about how to measure relative change. Life expectancy at birth is the most widely used index for representing the level of mortality in a population, but there are two measurement problems that should be recognized when comparing changes in life expectancy. The first is that life expectancy at birth is a highly summarized index of mortality at all ages. It is useful to monitor change over time in life expectancy at birth, but it may be more instructive to
Page 48
|
Circa 1900 |
Circa 1950 |
2000 |
||||
|
Region/Country |
Male |
Female |
Male |
Female |
Male |
Female |
|
Developed Countries |
||||||
|
Western Europe |
||||||
|
Austria |
37.8 |
39.9 |
62.0 |
67.0 |
74.5 |
81.0 |
|
Belgium |
45.4 |
48.9 |
62.1 |
67.4 |
74.5 |
81.3 |
|
Denmark |
51.6 |
54.8 |
68.9 |
71.5 |
74.0 |
79.3 |
|
France |
45.3 |
48.7 |
63.7 |
69.4 |
74.9 |
82.9 |
|
Germany a |
43.8 |
46.6 |
64.6 |
68.5 |
74.3 |
80.8 |
|
Norway |
52.3 |
55.8 |
70.3 |
73.8 |
75.7 |
81.8 |
|
Sweden |
52.8 |
55.3 |
69.9 |
72.6 |
77.0 |
82.4 |
|
United Kingdom |
46.4 |
50.1 |
66.2 |
71.1 |
75.0 |
80.5 |
|
Southern and Eastern Europe |
||||||
|
Czech Republic a |
38.9 |
41.7 |
60.9 |
65.5 |
71.0 |
78.2 |
|
Greece |
38.1 |
39.7 |
63.4 |
66.7 |
75.9 |
81.2 |
|
Hungary |
36.6 |
38.2 |
59.3 |
63.4 |
67.0 |
76.1 |
|
Italy |
42.9 |
43.2 |
63.7 |
67.2 |
75.9 |
82.4 |
|
Spain |
33.9 |
35.7 |
59.8 |
64.3 |
75.3 |
82.5 |
|
Other |
||||||
|
Australia |
53.2 |
56.8 |
66.7 |
71.8 |
76.9 |
82.7 |
|
Japan |
42.8 |
44.3 |
59.6 |
63.1 |
77.5 |
84.1 |
|
United States |
48.3 |
51.1 |
66.0 |
71.7 |
74.2 |
79.9 |
|
Developing Countries b |
||||||
|
Africa |
||||||
|
Egypt |
41.2 |
43.6 |
61.3 |
65.5 |
||
|
Ghana |
40.4 |
43.6 |
56.1 |
58.8 |
||
|
Mali |
31.1 |
34.0 |
45.5 |
47.9 |
||
|
South Africa |
44.0 |
46.0 |
50.4 |
51.8 |
||
|
Uganda |
38.5 |
41.6 |
42.2 |
43.7 |
||
|
Congo (Brazzaville) |
37.5 |
40.6 |
44.5 |
50.5 |
||
|
Asia |
||||||
|
China |
39.3 |
42.3 |
69.6 |
73.3 |
||
|
India |
39.4 |
38.0 |
61.9 |
63.1 |
||
|
Kazakhstan |
51.6 |
61.9 |
57.7 |
68.9 |
||
|
South Korea |
46.0 |
49.0 |
70.8 |
78.5 |
||
|
Syria |
44.8 |
47.2 |
67.4 |
69.6 |
||
|
Thailand |
45.0 |
49.1 |
65.3 |
72.0 |
||
|
Latin America |
||||||
|
Argentina |
60.4 |
65.1 |
71.7 |
78.6 |
||
|
Brazil |
49.3 |
52.8 |
58.5 |
67.6 |
||
|
Costa Rica |
56.0 |
58.6 |
73.3 |
78.5 |
||
|
Chile |
57.8 |
61.3 |
72.4 |
79.2 |
||
|
Mexico |
49.2 |
52.4 |
68.5 |
74.7 |
||
|
Venezuela |
53.8 |
56.6 |
70.1 |
76.3 |
Page 49
expectancy of the world's major countries; according to current mortality schedules, the average Japanese born today can expect to live 80 years. The level in various European nations approaches or exceeds 79 years. Three important observations can be made concerning the trends shown in Table 2-2. First, the relative difference among countries has narrowed with time. Second, the pace of improvement has not been linear, especially for males. From the early 1950s to the early 1970s, for example, there was little or no change in male life expectancy in Australia, the Netherlands, Norway, and the United States; in Eastern Europe and much of the former Soviet Union, male life expectancy declined in the 1970s and early 1980s, and again in some countries in the early 1990s. Third, the difference in female versus male longevity, which universally has been in favor of women in this century, has widened with time.
Reliable estimates of life expectancy in most developing countries prior to 1950 are lacking. Since the middle of the 20th century, estimated changes in the progress of life expectancy in developing regions have been more uniform than in the industrialized world. Most nations have experienced continued improvement, with some exceptions in Latin America and more recently in Africa. The most dramatic gains have been achieved in East Asia, where regional life expectancy at birth increased from less than 43 years in 1950 to more than 70 years in 1995. Extreme variations exist throughout the developing world, however. While Costa Rica, Taiwan, and numerous Caribbean island nations enjoy levels that match or exceed those of many European nations, the normal lifetime in other countries spans fewer than 45 years. Aggregate life expectancy at birth in Latin America (69 years) is 20 years higher than in sub-Saharan Africa. On average, individuals born in an industrialized country will outlive their counterparts in the developing world by 13 years according to mortality schedules for the late 1990s.
Moreover, while global reductions in overall mortality levels have been the norm in recent decades, the HIV/AIDS epidemic has had a devastating impact on life expectancy in parts of Africa and Asia. The impact of the epidemic on life expectancy at birth can be considerable, given that AIDS deaths often are concentrated in the childhood and
consider change over time in mortality in different age groups. In other words, very different mortality trends may be occurring at different ages in a single population, trends that would not be well represented by an overall measure of life expectancy at birth.
A second important point regarding life expectancy at birth is the reliability of mortality information at older ages, especially in developing countries. In a large majority of such nations, there simply are no reliable, representative statistics on older-age mortality. Hence, life-table estimates of older-age mortality typically represent an assumption based on a model.
Page 50
middle adult (30 to 45) ages. Projections to the year 2010 suggest that AIDS will continue to reduce average life expectancy at birth by more than 25 years from otherwise-expected levels in countries such as Botswana, Kenya, and Zimbabwe (Stanecki and Way, 1999). The impact on future population age structure and overall population aging is less striking insofar as the effects of a long-term epidemic become more evenly distributed across age groups.
The Feminization of Old Age
As noted earlier, the female advantage in life expectancy at birth is nearly universal. At the end of the 20th century, the average gap between the sexes in developed countries was roughly 7 years, but as great as 13 years in parts of the former Soviet Union as a result of unusually high levels of adult male mortality. The gender differential usually is smaller in developing countries, commonly in the 3-to-6-year range. Moreover, women's share of the older population increases with age. In some nations the sex ratio at older ages can be pronounced. As a result of the lingering effects of heavy male mortality during World War II, for example, women account for 80 percent of the oldest old in Russia and nearly 75 percent in Germany.
Gender-specific differences in mortality play an important role in determining factors such as marital status and living arrangements in older age. Because women tend to marry men who are older and to remarry less frequently upon divorce or the death of a spouse, percents widowed are much higher for women than men until extreme old age. The typical age/gender pattern is illustrated in Figure 2-9 with data from Belgium, where percents widowed for women are 2 to 4 times higher than for men between the ages of 60 and 85. Many older widows in industrialized nations live alone. These realities combine with a host of other gender differences (e.g., in educational attainment, poverty, and functional status) to present special problems for women as they age.
Life Expectancy and Mortality at Age 65
Where infant mortality rates are still relatively high but declining, as in many developing countries, most of the improvement in life expectancy at birth results from infants surviving the high-risk initial years of life. But when infant and childhood mortality reaches low levels, as in developed countries, improvements in average life expectancy are achieved primarily through declines in mortality among older segments of the population.
Any discussion of changes in death rates and life expectancy at older
Page 51
SOURCE: U.S. Bureau of the Census (2000). 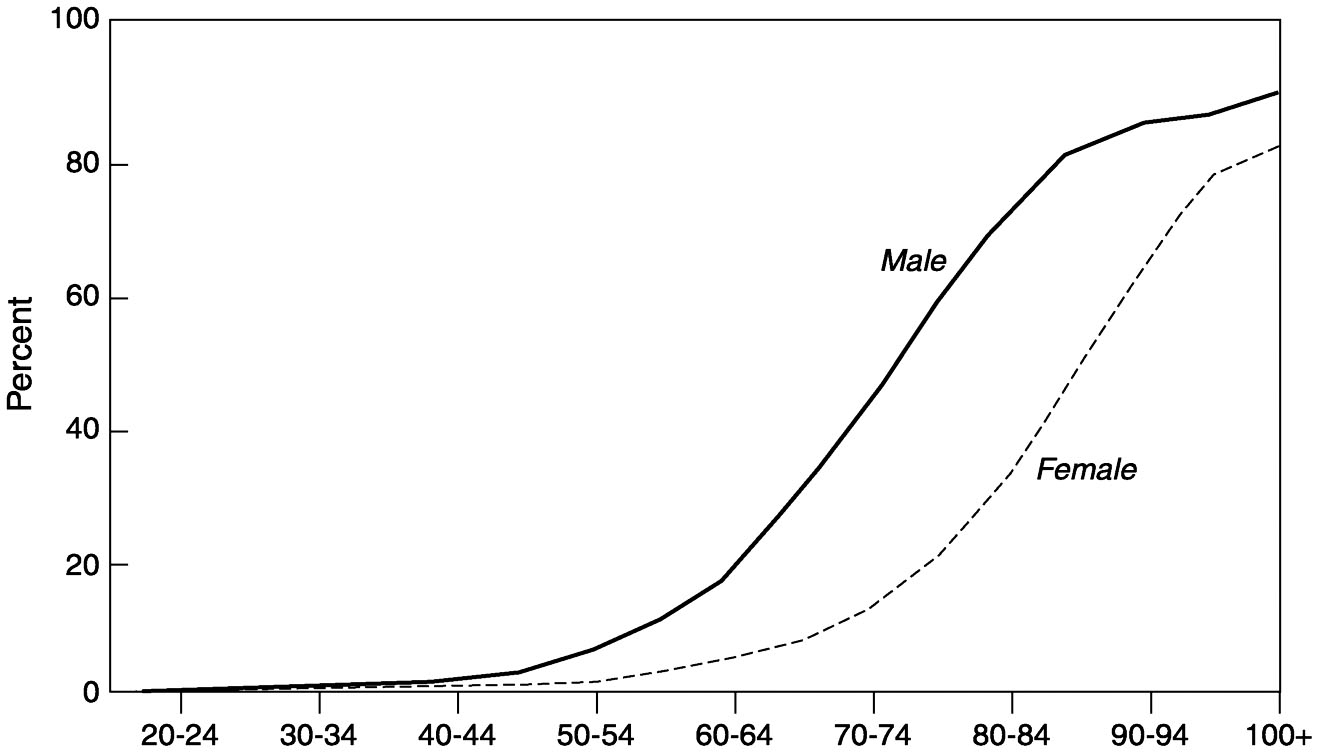
~ enlarge ~
FIGURE 2-9 Percent widowed in Belgium: 1995.
ages is hampered by the fact that the relevant data are suspect in quality at best and nonexistent at worst. Even in many industrialized nations with good vital registration systems, it is widely recognized that there may be problems with data at older ages (Condran et al., 1991; Kestenbaum, 1992; Murray and Lopez, 1996; see also Chapter 6). In general, mortality among older adults is inherently more difficult to study than that among children and youth. Data on child mortality usually can be collected from mothers, whereas there is no single universally suitable informant to provide data about adult deaths. Likewise, while characteristics of parents are among the more crucial determinants of the risk of death in childhood, it is less reliable to use the socioeconomic characteristics of respondents as proxies for those of deceased individuals when studying adult mortality differentials (Timaeus, 1993).
A more onerous problem in measuring older-age mortality, of course, is age misreporting. Particularly in developing countries, older persons are often unlikely to have birth certificates and health documentation. Actual age and age at death both tend to be exaggerated, which may introduce large biases into the estimation of mortality rates at older ages (Dechter and Preston, 1991). Where feasible, the assessment of age misreporting and the quality of mortality estimates at older ages can be greatly enhanced by linking data from different sources to investigate distortions and systematic biases in particular datasets. One innovative approach used in the United States (Hill et al., 2000) involves linking a
Page 52
sample of death certificates for native-born whites aged 85 and over to both census data from the early 1900s and Social Security Administration records. The results show surprising consistency among sources and suggest that (at least for U.S. whites) the effect of age misreporting on old-age mortality estimates is very small.
Old-Age Mortality in Developed Countries
Reliable data for Japan shown in Table 2-3 illustrate the rapid declines in old-age mortality that characterize many industrialized nations. Among the young old (ages 65-69), death rates for men and women plummeted between 1950 and 1996; the female level in 1996 was less than one-fourth that in 1950. Major declines can be seen at older ages as well. As a consequence of these steep drops, life expectancy at age 65 rose 5.6 years for men and 8.2 years for women during the period 1950-1996. Under the mortality conditions of 1996, the average Japanese woman aged 65 could expect to live an additional 21.5 years and the average Japanese man of the same age nearly 17 years.
Myers (1996) used a decompositional technique to assess the age-specific impact of mortality decline on overall changes in life expectancy during the period 1950-1990 in six industrialized nations. The major conclusions of the study were as follows. First, the influence of old-age mortality changes was substantial. In Australia, for example, 40 and 28 percent of the overall female and male gains in life expectancy at birth, respectively, during the 40-year period was due to mortality improvements at ages 65 and over. Second, gains in life expectancy at ages 65 and over have generally accelerated over time, that is, were more rapid during the period 1970-1990 than during the preceding 20-year period. Third, increases in life expectancy due to changes at older ages have been more rapid for women than for men, which suggests that the gender differential in life expectancy may not be narrowing.
|
65-69 |
75-79 |
80-84 |
||||
|
Year |
Male |
Female |
Male |
Female |
Male |
Female |
|
1950 |
51.6 |
35.7 |
114.4 |
87.1 |
177.9 |
142.9 |
|
1970 |
37.4 |
20.9 |
98.1 |
67.2 |
151.2 |
115.5 |
|
1996 |
19.5 |
8.2 |
51.2 |
26.2 |
86.7 |
49.6 |
Page 53
The importance of changes in mortality rates at older ages in relatively low-mortality nations has been examined from another perspective. Olshansky et al. (1991) calculated that from 1900 to 1985, most mortality declines in the United States occurred among infants, children, and women of childbearing age. The conditional probability of death under the age of 50 declined more than 70 percent for both men and women, with smaller declines after age 50. Because mortality rates are now so low at younger and middle ages, any significant additional gains in life expectancy must come from reductions in death rates among older population groups. If all U.S. deaths prior to the age of 50 were eliminated, the total gain in life expectancy at birth would be only 3.5 years.
Some countries are approaching the time when subsequent improvements in overall life expectancy will derive from changes not merely among the elderly, but primarily among the oldest old. Wilmoth et al. (2000), using detailed data for Sweden, have shown that mortality decline above age 70 was the major cause of the increase in maximum achieved life span in that country between 1861 and 1999. In a comprehensive study of death rates at ages 80 and over in the post-1950 period for 28 low-mortality countries, Kannisto (1994) demonstrated that old-age mortality had reached much lower levels than ever previously recorded, and that the decline had tended to accelerate in recent years. Perhaps surprisingly, there had been no perceptible convergence of national old-age mortality levels. The only commonality among the 28 countries was a speedier decline for women than for men, thus widening the female advantage in life expectancy at birth. Kannisto attributed the rapid decline in old-age mortality to period rather than cohort effects, citing in particular the effects of recent medical advances and the adoption of healthier lifestyles by better-educated, wealthier, and urban population subgroups. If this interpretation is correct, there is likely to have been a widening of socio-economic differentials in old-age mortality, as has been suggested for adult populations in general in the United Kingdom, the United States, and other Western nations (Preston and Taubman, 1994; Marmot and Wilkinson, 1999). At the same time, there would appear to be great potential for further overall (national) improvements in old-age mortality to the extent that other social groups can benefit from technology and lifestyle changes. In any case, the great reductions in old-age mortality have caught many demographers and policy planners by surprise.
Old-Age Mortality in Developing Countries
The greater relative improvement in life expectancy at older versus younger ages is not yet widespread in developing regions of the world. However, the proportional increase in life expectancy at older ages is
Page 54
approaching or has surpassed the relative increase in life expectancy at birth in some developing countries, notably in Latin America and the Caribbean. As the epidemiological profile in the developing world changes, a greater share of all deaths is seen at older ages. Data compiled by the World Health Organization indicate that half or more of all female deaths occur after age 65 in numerous developing nations; the corresponding percentage for males typically is less, but exceeds half in several countries.
Given the problems with data and mortality measurement discussed earlier, one cannot confidently assess changes in mortality rates at old ages across developing regions. In general, countries in Latin America and the Caribbean are thought to have the most accurate mortality information and longest time series, with many nations having reasonable life table estimates dating back to 1950 or before. One analysis 10 of 19 countries (14 of which are in the western hemisphere) indicates that, with the exception of Belize around 1970, there was an unmistakable decline in Latin American/Caribbean death rates at age 65 during the second half of the 20th century and a corresponding increase in the number of years of life remaining for those persons who reach age 65. Gains for women typically were greater than for men; in Costa Rica, Panama, Puerto Rico, and Peru, more than 5 years was added to female life expectancy at age 65 between 1950 and 1990. In Singapore and Taiwan, improvements in older-age mortality were even more rapid. Mortality rates for those aged 65-69 dropped by more than 50 percent during the last half of the century, and the corresponding gains in life expectancy at age 65 for both men and women were greater than those seen in Latin America.
Short-term projections of life expectancy at age 65 in both developed and developing countries show that the female advantage in life expectancy at birth persists at older ages. In all 20 nations shown in Table 2-4, women who reach age 65 have higher remaining life expectancies than do elderly men. The gender gap is usually about 4 years in developed countries and 2-3 years in developing countries.
Major Cause-Specific Changes in Old-Age Mortality
The change in national mortality and disease profiles associated with population aging in developed countries has been well documented (Lopez, 1990; Lopez et al., 1995). At ages 65 and over, a majority of
10Using life tables compiled and evaluated by the U.S. Bureau of the Census, based on country-specific vital registration and survey data, estimates of death underregistration, and secondary sources/analyses.
Page 55
|
Men |
Women |
|
|
Developed Countries |
||
|
Australia |
17.5 |
21.6 |
|
Bulgaria |
13.4 |
16.2 |
|
Canada |
17.1 |
21.7 |
|
France |
16.7 |
21.3 |
|
Germany |
15.4 |
19.2 |
|
Italy |
16.2 |
20.2 |
|
Japan |
17.0 |
21.3 |
|
Russia |
11.5 |
15.4 |
|
Sweden |
16.4 |
20.3 |
|
United Kingdom |
15.2 |
19.1 |
|
Developing Countries |
||
|
Brazil |
14.1 |
17.9 |
|
China |
13.1 |
15.6 |
|
Egypt |
10.6 |
12.9 |
|
India |
13.3 |
13.9 |
|
Kenya |
13.3 |
15.1 |
|
Mexico |
14.2 |
17.0 |
|
Peru |
15.1 |
17.3 |
|
Thailand |
14.2 |
17.7 |
|
Turkey |
15.5 |
18.4 |
|
Zimbabwe |
10.1 |
13.8 |
NOTE: Figures refer to the average number of years of remaining life for an individual who reaches age 65 in the year 2000.
SOURCE: Projected by the U.S. Bureau of the Census (2000) based on the most recent data for each country.
developed countries have seen reductions in the proportions of deaths from heart disease and stroke since 1950, often accompanied by a reduction in the death rate from these two diseases. Conversely, cancer rates and proportional mortality from neoplasms have generally risen with time, although the trend has varied by disease site. Multiple-decrement life table analyses for selected developed countries have shown that the sharp rise in cancer rates with age implies a doubling of deaths from cancer in some countries during the period 1950-1990 (Myers, 1996). Among older men, deaths have risen for most disease sites, with the notable exception of stomach cancer. For older women, there is concern about skyrocketing rates of lung cancer (Levi et al., 1992; Lopez, 1995) that have resulted from the upsurge in tobacco consumption among women in the 1960s and 1970s. In France, standardized death rates at ages 65-74
Page 56
for cancers are now higher than for cardiovascular diseases for both men and women (Mesle and Vallin, 1999).
Median ages at death for most chronic conditions have increased over time (Myers and Manton, 1987). For example, from 1950 to 1990, the average age at death from heart disease for women in Canada increased by an estimated 7.5 years, of which 5.3 years is attributed to reductions in mortality at age 65 and over. In other words, the increase in life expectancy at older ages during recent decades is the result of reductions in age-specific rates for most major causes of death. Such reductions may result from the delayed onset of disease (due, perhaps, to better health promotion efforts), as well as from prolonged survival with a disease (perhaps reflecting better treatment of existing conditions).
The potential for additional years of life with chronic disease raises important issues about the quality of those additional years. Are we living healthier as well as longer lives, or are we spending an increasing portion of our older years with disabilities, mental disorders, and ill health? In aging societies, the answer to this question will have a profound impact on policies regarding national health and long-term care systems, and on the sufficiency of individual and collective retirement savings. As discussed in Chapter 6, the need to better understand trends in and causes of disability, both within and across countries, is a major challenge for gerontological research.
While cause-of-death data at older ages are problematic in every country in terms of precision and cross-national comparability, the problems are exacerbated in developing countries by underreporting of deaths, lack of causal information, inaccurate diagnoses, and ethnologic differences. On a broad scale, it appears clear that the general epidemiological transition already experienced in the developed world has occurred or is occurring in many developing nations as well. 11 Data from Taiwan shown in Table 2-5 exemplify the typical epidemiological shift in causes of death. The infectious and parasitic diseases that dominated Taiwanese mortality in the mid-1950s have given way to chronic and degenerative diseases. By 1976, cerebrovascular disease (primarily stroke) and cancers 12 had become the top killers, and the broader cardiovascular disease category—including cerebrovascular, heart, and hypertensive disease)—accounted for nearly 30 percent of all deaths. The role of cardiovascular diseases
11This is not to say that there is a single, linear trajectory to the epidemiological transition. As Frenk et al. (1991) have shown for several Latin American countries, the “typical” stages of epidemiological transition may not follow a sequential order, but may in fact overlap or even reverse direction.
12It should be noted that cancers themselves may be infectious diseases, particularly in developing countries. Pisani et al. (1999) estimate that 16 percent of all cancer deaths worldwide in the early 1990s were due to infectious agents.
Page 57
|
1956 |
1976 |
1996 |
|
|
1 |
GDEC a |
Cerebrovascular disease |
Malignant neoplasms |
|
2 |
Pneumonia |
Malignant neoplasms |
Cerebrovascular disease |
|
3 |
Tuberculosis |
Accidents |
Accidents |
|
4 |
Perinatal conditions |
Heart disease |
Heart disease |
|
5 |
Vascular lesions of CNS b |
Pneumonia |
Diabetes mellitus |
|
6 |
Heart disease |
Tuberculosis |
Cirrhosis/chronic liver disease |
|
7 |
Malignant neoplasms |
Cirrhosis of the liver |
Nephritis/nephrosis |
|
8 |
Nephritis/nephrosis |
Bronchitis c |
Pneumonia |
|
9 |
Bronchitis |
Hypertensive disease |
Hypertensive disease |
|
10 |
Stomach/duodenum ulcer |
Nephritis/nephrosis |
Bronchitis c |
a
Includes gastritis, duodenitis, enteritis, and colitis (except diarrhea of newborns).
b
CNS refers to the central nervous system.
c
Includes emphysema and asthma.
SOURCE: Taiwan Department of Health (1997).
as the principal cause of death also has been well documented in other parts of Asia (Ruzicka and Kane, 1991) and in a large majority of Latin American and Caribbean countries (Pan American Health Organization, 1998). With regard to causes of death at ages 65 and over, World Health Organization (1998) data for developing countries with reasonably reliable cause-of-death information suggest that more than half of all deaths in the 1990s in numerous nations (e.g., Argentina, Kazakstan, Tajikistan, Uzbekistan) were attributable to cardiovascular disease. The share of cancer deaths among the elderly is between 12 and 25 percent in most cases.
RELIABILITY OF DEMOGRAPHIC PROJECTIONS OF THE ELDERLY
Tomorrow's elderly, as noted earlier, already have been born, at least until the time horizon reaches the year 2065. Therefore, future fertility rates may affect the proportion of older persons in a given society, but not their number. Current and future mortality trends are of increasing concern to social scientists and policy planners because assumptions about these trends vary considerably and may have surprisingly divergent implications for future programs. Past population projections often have underestimated improvements in mortality rates, particularly among the oldest old. Consequently, global and national projections of the size of older populations generally have missed the mark and regularly have
Page 58
been revised upwards. For example, in its 1980 assessment of world population, the United Nations projected a global total of 760 million elderly (65+) by the year 2025. The latest United Nations (1999) assessment projects 817 million elderly, 57 million and roughly 8 percent more than forecast in 1980. On a national level, consistently low projections of the elderly population poorly serve planning in such areas as health care costs and delivery systems, pension scheme payouts, and housing design.
In industrial nations, mortality is now so low among children and young adults that improvements at these ages (except for mortality from violence and HIV/AIDS among young males), even if it occurs, can contribute very little to overall improvements in life expectancy (National Research Council, 2000). Hence, projection “errors” tend to be greatest at older ages. A series of studies by Keilman (cited in Lee and Miller, 2000) has identified systematic underestimation of the elderly population in projections for industrialized countries on the order of .5 percent per year for the elderly and about 1 percent per year for persons aged 85 and over. Over a 75-year period, these errors would compound so that the actual number of elderly could be 60 percent higher than expected, while the 85-and-over population could exceed current projections by 300 percent.
Such calculations lead some to argue that the actual numbers of tomorrow's elderly and especially the oldest old could be much higher than presently anticipated (see Box 2-2). Until recently, it was generally assumed that the human death rate increases with age in an exponential manner. Research has now documented that at very old ages, the rate of increase in the mortality rate tends to slow down, 13 and several hypotheses have been advanced as explanations for this phenomenon (see Horiuchi and Wilmoth, 1998, for one discussion of competing explanations). There is no empirical or theoretical basis for assuming that life expectancy will peak at some numerical limit in the future. This is especially so in light of recent medical advances, potential developments in gene therapy, and the realization that the rate of mortality increase in humans slows down at very advanced ages.
Methodological issues also are important in this context. Caselli (1996) has explored the usefulness of projecting mortality by cause of death, noting that the results provide a strong basis for implementing health promotion measures. Lee and Tuljapurkar (1998) argue that the usual method for dealing with uncertainty in population projections—i.e., the use of high/medium/low variants—is flawed. They and others (Lutz et al., 1998; National Research Council, 2000) posit that stochastic forecasts based on time series of vital rates offer important advantages,
13This has been demonstrated in nonhuman species as well; see, for example, Carey, 1997; Vaupel et al., 1998.
Page 59
BOX 2-2The Proliferation of CentenariansAs the average length of life increases, the concept of “oldest old” will change. We now have, for the first time in history, the opportunity to consider significant numeric growth of the population aged 100 and over. While people of extreme old age constitute a very small portion of the total population in most of the world, their numbers are of growing significance, especially in more developed nations. Hence it is increasingly important to have greater age detail about the very old. In the past, comparable population projections for the world's countries often grouped those aged 80 and over into a single open-ended category. Recently, agencies such as the United Nations Population Division and the U.S. Bureau of the Census's International Programs Center have produced or made plans to produce sets of international population projections that expand the range of older age groups to include an open-ended category of age 100 and over. According to researchers in Europe, the number of centenarians has doubled each decade since 1950 in industrialized countries. Using reliable statistics from 10 western European countries and Japan, Vaupel and Jeune (1995) estimated that some 8,800 centenarians lived in these countries as of 1990, and that the number of centenarians grew at an average annual rate of approximately 7 percent between the early 1950s and the late 1980s. They also estimated that over the course of human history, the odds of living from birth to age 100 may have risen from 1 in 20 million to 1 in 50 for females in low-mortality nations such as Japan and Sweden. There are several problems with obtaining accurate age data on very old people (Kestenbaum, 1992; Elo et al., 1996), and estimates of centenarians from censuses and other data sources should be scrutinized carefully. For example, the 1990 U.S. census recorded some 37,000 centenarians. Although the actual figure is thought to be closer to 28,000 because of age misreporting (Krach and Velkoff, 1999), the census figure represents a doubling of the population aged 100 and over from 1980 to 1990, similar to estimates for European nations. The potentially spectacular increase in numbers of centenarians is illustrated by data and projections for France. Dinh (1995) estimated that there were about 200 centenarians in France in 1950, and that by the year 2000 the number would be 8,500. His 50-year projections suggest there will be 41,000 people aged 100 and over by 2025, increasing to 150,000 in 2050. If these projections are realized, the number of centenarians in France will have multiplied by a factor of 750 in one century. SOURCE: Excerpted from U.S. Bureau of the Census (in press). |
particularly for mortality estimation, 14 and suggest exploring the value of cohort projections of life expectancy.
The upshot is that such views, coupled with expectations of future advances in a variety of medical and nonmedical technologies, may lead
14Lee and Tuljapurkar's favored model suggests that future increases in life expectancy in the United States will proceed approximately twice as fast as implied by projections of the U.S. Bureau of the Census and the U.S. Social Security Administration.
Page 60
researchers to very different assumptions about the trajectory of human mortality and the numbers of tomorrow's elderly populations. For example, Figure 2-10 shows forecasts of the size of the U.S. population aged 85 and over through the year 2040, produced by the U.S. Bureau of the Census using two different mortality assumptions. These official projections are contrasted with those made by Guralnik et al. (1988), which show the effect of assuming a continuation of the 2 percent annual decline in death rates experienced during the 1980s. Much more optimistic forecasts of lowered death rates have resulted from mathematical simulations of reductions in known risk factors for chronic diseases, other morbidity, and mortality. One such simulation (Manton et al., 1993) generated an extreme upper bound projection of 54 million people aged 85 and over in the United States in 2040. While this and other projections are perhaps not the most likely, they underscore the potential impact of changes in adult mortality on the future size of the very old population and demonstrate the uncertainty inherent in projections of numbers and age composition. Indeed, this report and its recommendations are motivated in large part by the necessity to know more about health and mortality dynamics in aging populations and to increase our ability to factor uncertainty into program and policy planning.
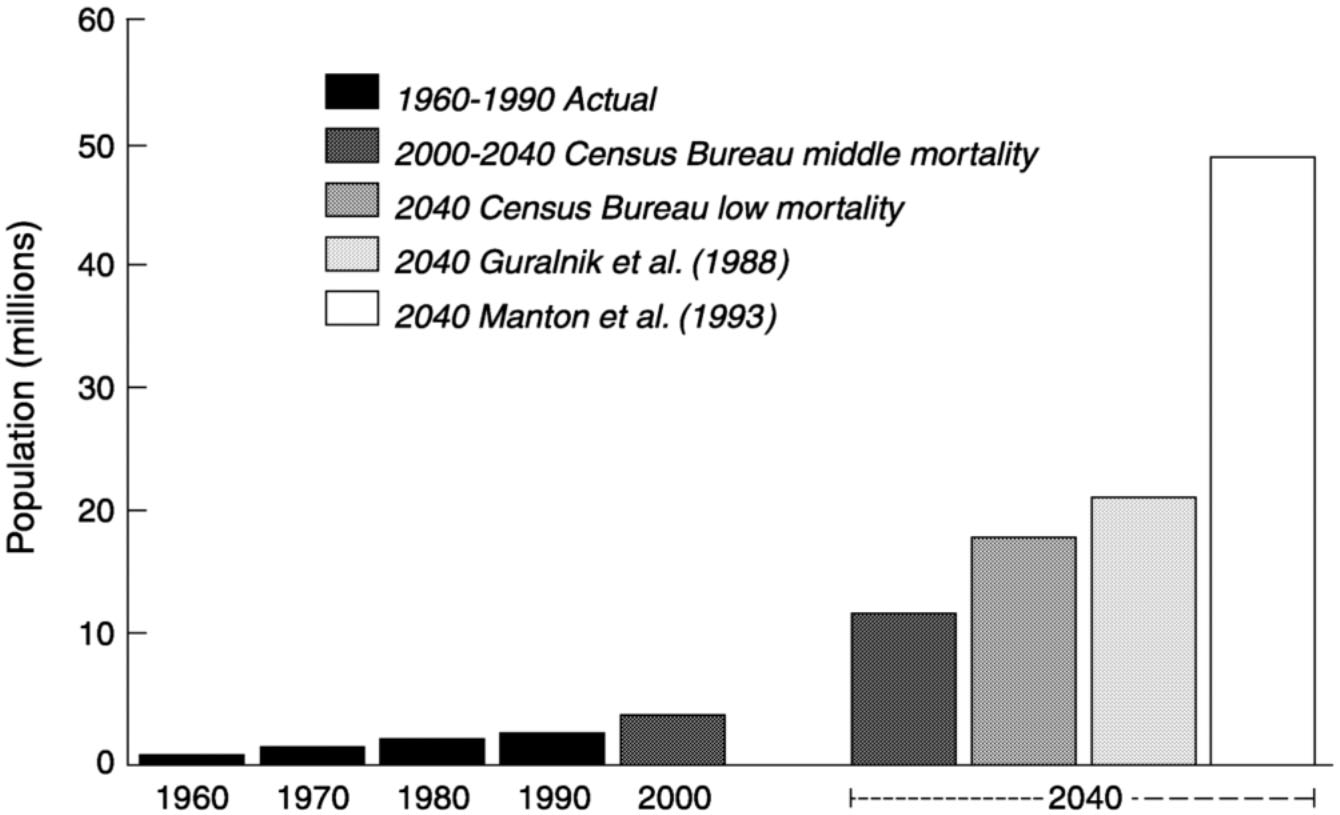
~ enlarge ~
FIGURE 2-10 Forecasts of the U.S. population aged 85 and over.
Page 61
REFERENCES
1993 Health care costs around the world: Is aging a fiscal ‘black hole?' Generations (Winter): 37-42 .
2000 What's Next? Population Explosion or Decline? Available: http://www.popcouncil.org/news_views/pop_momentum.html [February 28, 2001].
1997 What demographers can learn from fruit fly actuarial models and biology. Demography 34(1): 17-30 .
1996 Future longevity among the elderly. In Health and Mortality Among Elderly Populations , G. Caselli and A.D. Lopez, eds. Oxford : Clarendon Press .
, and 1990 Mortality and aging. European Journal of Population 6(1): 1-25 .
1997 Age-distribution dynamics and aging indexes. Demography 34(4): 551-563 .
Coale, A.J., and S.C. Watkins, eds. 1986 The Decline of Fertility in Europe . Princeton : Princeton University Press .
, , and 1991 Old-age mortality patterns in low-mortality countries: An evaluation of population and death data at advanced ages, 1950 to the present. Population Bulletin of the United Nations 30: 23-60 .
1996 Population Projections of the United States, by Age, Sex, Race and Hispanic Origin: 1995 to 2050 . U.S. Bureau of the Census, Current Population Reports, Series P25-1130. Washington, DC : U.S. Government Printing Office .
, and 1991 Age misreporting and its effects on adult mortality estimates in Latin America. Population Bulletin of the United Nations 31/32: 1-16 .
1995 Projection de la population yotale pour la France metropolitaine: Base RP90, horizons 1990-2050, Demographie-Societe 44 . Paris : INSEE .
2000 World depopulation. Last one turn off the lights. The Milken Institute Review First Quarter: 37-48 .
, , , , and 1996 Consistency of age reporting on death certificates and social security records among elderly African Americans. Social Science Research 25: 292-307 .
1994 Can immigration slow U.S. population aging? Journal of Policy Analysis and Management 13(4): 759-768 .
, , , , and 1991 Elements for a theory of the health transition. Health Transition Review 1: 21-38 .
, , and 1999 Old-age Mortality in Germany Prior to and after Reunification. Paper presented during the Third European-American Research Colloquium on Social and Biological Determinants of Longevity, Max Planck Institute for Demographic Research , August, Rostok, Germany .
Page 62
, , and 1999 Looking beyond the household: Intergenerational perspectives on living kin and contacts with kin in Great Britain. Population Trends 97: 19-27 .
, , and 1988 Projecting the older population of the United States: Lessons from the past and prospects for the future. Milbank Quarterly 66: 283-308 .
, , and 2000 Age reporting among white Americans aged 85+: Results of a record linkage study. Demography 37(2): 175-186 .
, and 1998 Deceleration in the age pattern of mortality at older ages. Demography 35(4): 391-412 .
1990 Statistical Yearbook of Japan 1990 . Tokyo : Ministry of Health and Welfare .
1999 Statistical Yearbook of Japan 1999 . Tokyo : Ministry of Health and Welfare .
Jones, G.W., R.M. Douglas, J.C. Caldwell, and R.M. D'Souza, eds. 1997 The Continuing Demographic Transition . Oxford : Clarendon Press .
1994 Development of Oldest-Old Mortality, 1950-1990: Evidence from 28 Developed Countries . Monograph on Population Aging 1. Odense, Denmark : Odense University Press .
1992 A description of the extreme aged population based on improved Medicare enrollment data. Demography 29(4): 565-580 .
, and 1997 Population momentum expresses population aging. Demography 34(4): 421-427 .
, and 1995 Older Workers, Retirement, and Pensions. A Comparative International Chartbook . U.S. Census Bureau Report IPC/95-2RP. Washington, DC : U.S. Government Printing Office .
1996 Aging in Japan: Population Policy Implications . Institute of Population Problems Reprint Series 25. Tokyo : Ministry of Health and Welfare .
, and 1999 Centenarians in the United States . U.S. Census Bureau Current Population Reports P23-199. Washington, DC : U.S. Government Printing Office .
1991 Demographic impact of post-war migration in selected OECD countries. In Migration: The Demographic Aspects , pp. 15-26 . Paris : Organization for Economic Cooperation and Development .
1994 The formal demography of population aging, transfers, and the economic life cycle. In Demography of Aging . Committee on Population. L.G. Martin and S.H. Preston, eds. Commission on Behavioral and Social Sciences and Education. Washington, DC : National Academy Press .
, and 2000 Evaluating the Performance of the Lee-Carter Mortality Forecasts. Available: http://www.demog.berkeley.edu [February 28, 2001].
, and 1998 Population Forecasting for Fiscal Planning: Issues and Innovations. Available: http://www.demog.berkeley.edu [February 28, 2001].
Page 63
2000 Europe's demographic issues: Fertility, household formation and replacement migration. In United Nations Expert Group Meeting on Policy Responses to Population Ageing and Population Decline , pp. 20/1-20/40 . ESA/P/WP.163. New York : United Nations Department of Economic and Social Affairs .
, , and 1988 Are Immigrants Substitutes for Births? IPD Working Paper 1988-3. Brussels : Interuniversity Program in Demography .
, , , and 1992 Trends in cancer mortality sex ratios in Europe, 1950-1989. World Health Statistics Quarterly 45(1): 117-164 .
1990 Mortality Trends in the ECE Region: Prospects and Implications . United Nations Economic Commission for Europe Seminar on Demographic and Economic Consequences and Implications of Changing Population Age Structures, Ottawa, 24-28 September. Report CES/SEM.28/R.36. Geneva : United Nations .
1995 The lung cancer epidemic in developed countries. In Adult Mortality in Developed Countries: From Description to Explanation , A.D. Lopez, G. Caselli, and T. Valkonen, eds. Oxford : Clarendon Press .
Lopez, A.D, G. Caselli, and T. Valkonen, eds. 1995 Adult Mortality in Developed Countries: From Description to Explanation . Oxford : Clarendon Press .
, , and 1998 Expert-based probabilistic population projections. Population and Development Review 24(Supplement): 139-155 .
, , and 1993 The scientific and policy needs for improved health forecasting models for elderly populations. In Forecasting the Health of Elderly Populations , K.G. Manton, B.H. Singer, and R.M. Suzman, eds. New York : Springer-Verlag .
, and 1999 Social Determinants of Health . Oxford : Oxford University Press .
1979 The Role of Medicine: Dream, Mirage, or Nemesis? Princeton : Princeton University Press .
, and 1999 Mortality Trends at Older and Oldest Ages in France Since 1950. Paper presented at the Third European-American Colloquium on Social and Biological Determinants of Longevity, 1-7 August, Rostock, Germany .
1993 Lifespan . New York : Simon & Schuster .
Murray, C.J.L., and A.D. Lopez, eds. 1996 The Global Burden of Disease . Geneva : World Health Organization .
1996 Comparative mortality trends among older persons in developed countries. In Health and Mortality Among Elderly Populations , G. Caselli and A.D. Lopez, eds. Oxford : Clarendon Press .
, and 1987 The rate of population aging: New views of epidemiologic transitions. In Aging: The Universal Human Experience , G.L. Maddox and E.W. Busse, eds. New York : Springer .
Page 64
2000 Beyond Six Billion: Forecasting the World's Population . Committee on Population. J. Bongaarts and R.A. Bulatao, eds. Commission on Behavioral and Social Sciences and Education. Washington, DC : National Academy Press .
, , , , and 1991 Trading off longer life for worsening health. Journal of Aging and Health 3(2): 194-216 .
1998 Health in the Americas . Scientific Publication No. 569, Volume I. Washington, DC : Pan American Health Organization .
1999 Gray dawn: The global aging crisis. Foreign Affairs 78(1): 42-55 .
, and 1995 Aging trends-Singapore. Journal of Cross-Cultural Gerontology 10(4): 349-356 .
, , , and 1999 Estimates of the worldwide mortality from 25 cancers in 1990. International Journal of Cancer 83(1): 18-29 .
1986 The relation between actual and intrinsic growth rates. Population Studies 40: 343-351 .
, and 1991 Fatal Years: Child Mortality in Late Nineteenth-Century America . Princeton : Princeton University Press .
, and 1994 Socioeconomic differences in adult mortality and health status. In Demography of Aging . Committee on Population. L.G. Martin and S.H. Preston, eds. Commission on Behavioral and Social Sciences and Education. Washington, DC : National Academy Press .
, and 1991 Mortality Transition and Cause of Death Structure in Asia. Paper prepared for the International Union for the Scientific Study of Population Seminar on Causes and Prevention of Adult Mortality in Developing Countries, October, Santiago, Chile .
1990 Trends and future prospects of the female overlife by regions in Europe. Statistical Journal of the United Nations Economic Commission for Europe 7: 13-25 .
1996 Cross pressures on middle-aged adults: A broader view. Journal of Gerontology: Social Sciences 51B(6): S271-273 .
, and 1999 Focus on HIV/AIDS in the developing world. In World Population Profile: 1998 , T.M. McDevitt. U.S. Census Bureau Report WP/98. Washington, DC : U.S. Government Printing Office .
1992 Echo effects on aging of past vital-rate fluctuations in the ECE region. In Demographic Causes and Consequences of Population Aging , G.J. Stolnitz, ed. Economic Studies No. 3. New York : United Nations .
Suzman, R.M., D.P. Willis, and K.G. Manton, eds. 1992 The Oldest Old . New York : Oxford University Press .
1997 Health and Vital Statistics. General Health Statistics 1996 . Taipei : Executive Yuan .
Page 65
1976 Population Dynamics. Causes and Consequences of World Demographic Change . New York : Random House .
1993 Measurement of Adult Mortality in Less Developed Countries: A Comparative Review . Technical Papers (53). Bethesda, MD : International Institute for Vital Registration and Statistics .
1988 Sex differentials in survivorship in the developing world: Levels, regional patterns and demographic determinants. Population Bulletin of the United Nations 25: 51-64 .
1999 World Population Prospects . The 1998 Revision, ST/ESA/SER.A/177. New York : United Nations Department of Economic and Social Affairs .
2000a Replacement Migration . ESA/P/WP.160. New York : United Nations Department of Social and Economic Affairs .
2000b United Nations Expert Group Meeting on Policy Responses to Population Ageing and Population Decline . ESA/P/WP.163. New York : United Nations Department of Economic and Social Affairs .
2000 International Data Base. Available: http://www.census.gov/ipc/www/idbnew.html [February 28, 2001]. in An Aging World 2001 . Washington, DC : U.S. Government Printing Office . press
, , , , , , , , , , , , , and 1998 Biodemographic trajectories of longevity. Science 280(May 8): 855-860 .
, and 1995 The emergence and proliferation of centenarians. In Exceptional Longevity: From Prehistory to the Present , B. Jeune and J.W. Vaupel, eds. Monograph on Population Aging 2. Odense, Denmark : Odense University Press .
, , , and 2000 Increase of maximum life-span in Sweden, 1861-1999. Science 289: 2366-2368 .
1998 World Health Statistics Annual 1996 . Geneva : World Health Organization .


