
Page 207
9
Population, Consumption, and Land Use in the Pearl River Delta, Guangdong Province
Zhao Shidong, Chinese Academy of Sciences; Zeng Yi, Peking University; Bai Wanqi, Chinese Academy of Sciences; Lu Jiehua, Peking University; Qi Wenhu, Chinese Academy of Sciences; Liu Guiping, Peking University; Zhang Taolin, Chinese Academy of Sciences; Qin Mingzhou, Henan University; Jiang Leiwen, Peking University
A densely populated region in southeastern China, the Pearl River Delta has undergone dramatic changes in its population, land use, and environmental quality, stemming from its rapid economic development and urbanization. This chapter begins by describing the physical conditions, demography, land use, and environmental quality of the region, as well as the methodology used to evaluate the interactions among them. A set of research findings on the nature of these interactions, corroborated by the use of extensive empirical data, follows.
THE PEARL RIVER DELTA: A DESCRIPTION
Physical Conditions
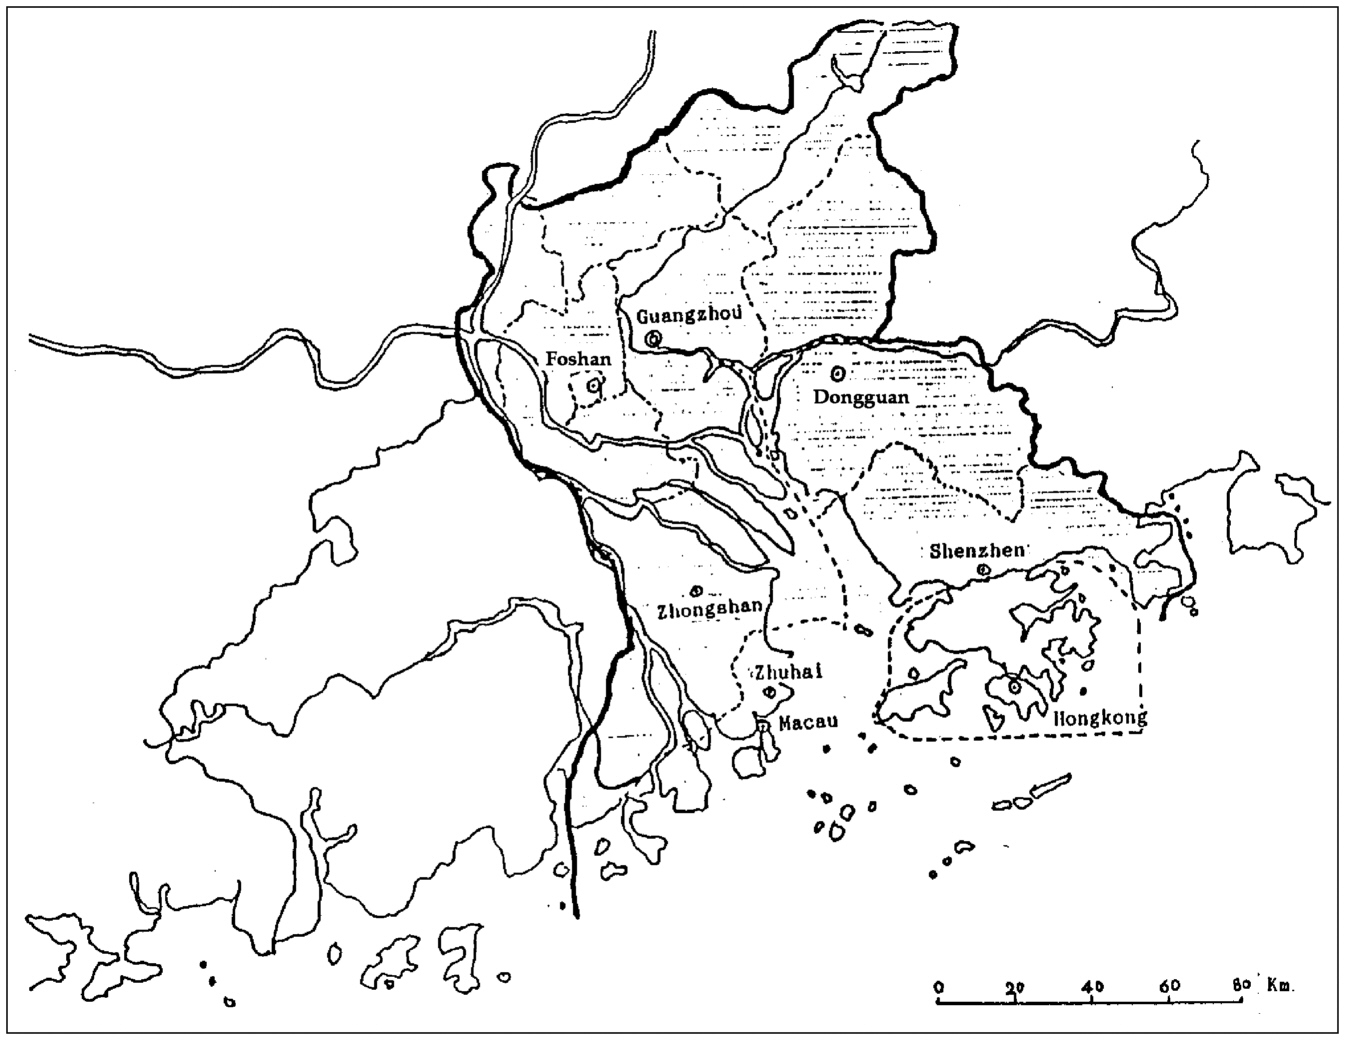
The Pearl River Delta, situated in southern China's Guangdong Province, is formed by alluvium delivered from the West, North, and East Rivers. Located in the subtropical monsoon zone, the region has an annual average temperature of 22°C, annual precipitation of 1,714 millimeters, and annual sunshine of 1,990-2,300 hours. Various landforms are found in the Delta: wetland, estuary, lowland, plain, dryland, and upland hills. The specific region examined in this chapter is in the central part of the Pearl River Delta, which covers 17,219 square kilometers. The region is made up of 13 counties and cities distributed among six municipalities that lie on either side of the Pearl River estuary (see Figure 9-1 and Table 9-1).
This study covers the period before Hong Kong was reunited with the rest of China, and thus Hong Kong is not explicitly studied here.
Page 208
~ enlarge ~
FIGURE 9-1 Pearl River Delta, Guangdong Province.
Nevertheless, Hong Kong has always been a key part of the ecological region of the Pearl River Delta and frequently a destination for out-migrants from the region. With the socioeconomic reforms beginning in 1978, Hong Kong's investments in and influence on the study area increased dramatically.
Demographics
The Pearl River Delta is one of the most populated areas of China. In 1995 its permanent population density was 743 persons per square kilo-
|
Municipality |
County/City |
|
Dongguan |
Dongguan City |
|
Foshan |
Foshan City, Nanhai City, Shunde City |
|
Guangzhou |
Conghua City, Guangzhou City, Huadu City, Panyu City, Zengcheng City |
|
Shenzhen |
Shenzhen City |
|
Zhongshan |
Zhongshan City |
|
Zhuhai |
Zhuhai City, Doumen County |
Page 209
|
1960–1970 |
1970–1980 |
1980–1990 |
|
|
Pearl River Delta |
19.70 |
17.10 |
35.20 |
|
Guangdong Province |
26.25 |
19.28 |
21.41 |
|
China |
29.41 |
15.81 |
15.83 |
SOURCES: Selected Statistical Yearbooks for subregions, Guangdong Province, and China, 1960–1991.
meter, as compared with 378 for all of Guangdong Province and 126 for China as a whole. The total permanent population of the Delta region has grown at a substantially faster rate than populations elsewhere in China ( Table 9-2). From 1960 to 1970 all three areas shown in Table 9-2 experienced high population growth. Smaller increases in the permanent population were evident during 1970–1980, until a one-child policy, launched in the early 1980s, led to a decline in birth rates nationwide.
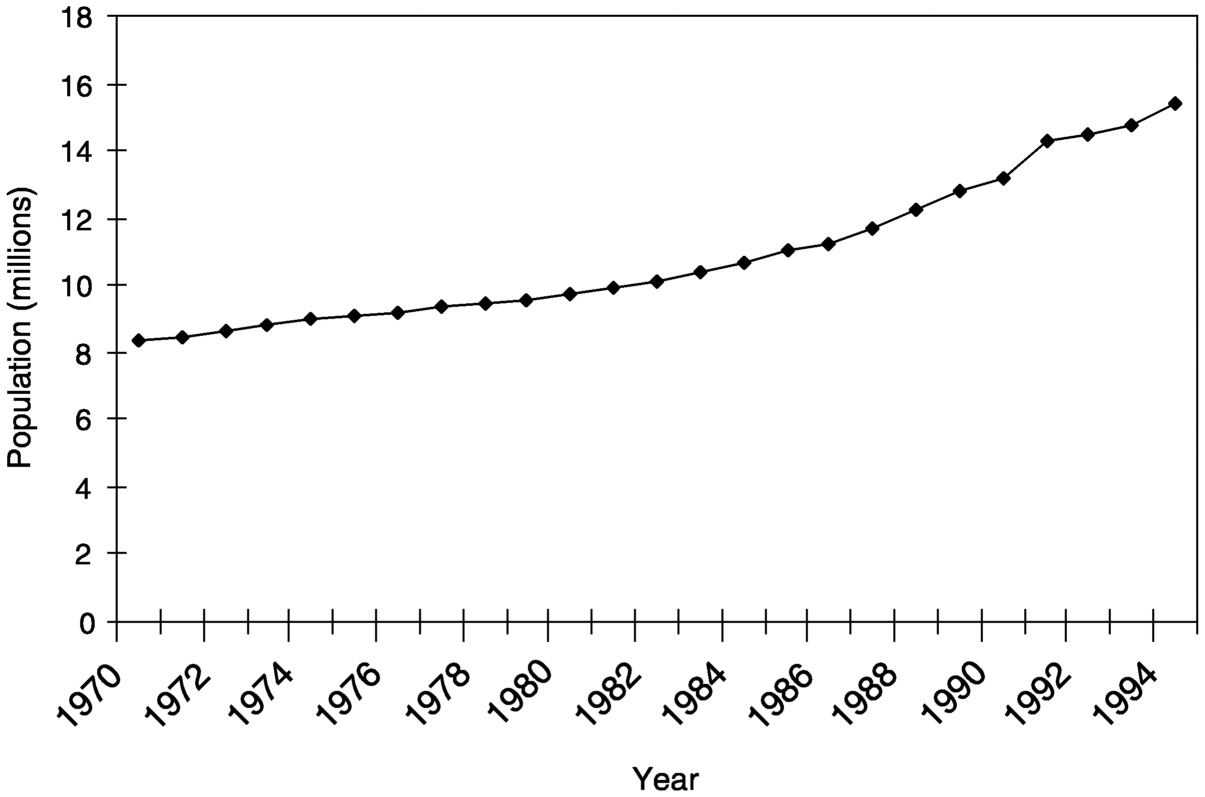
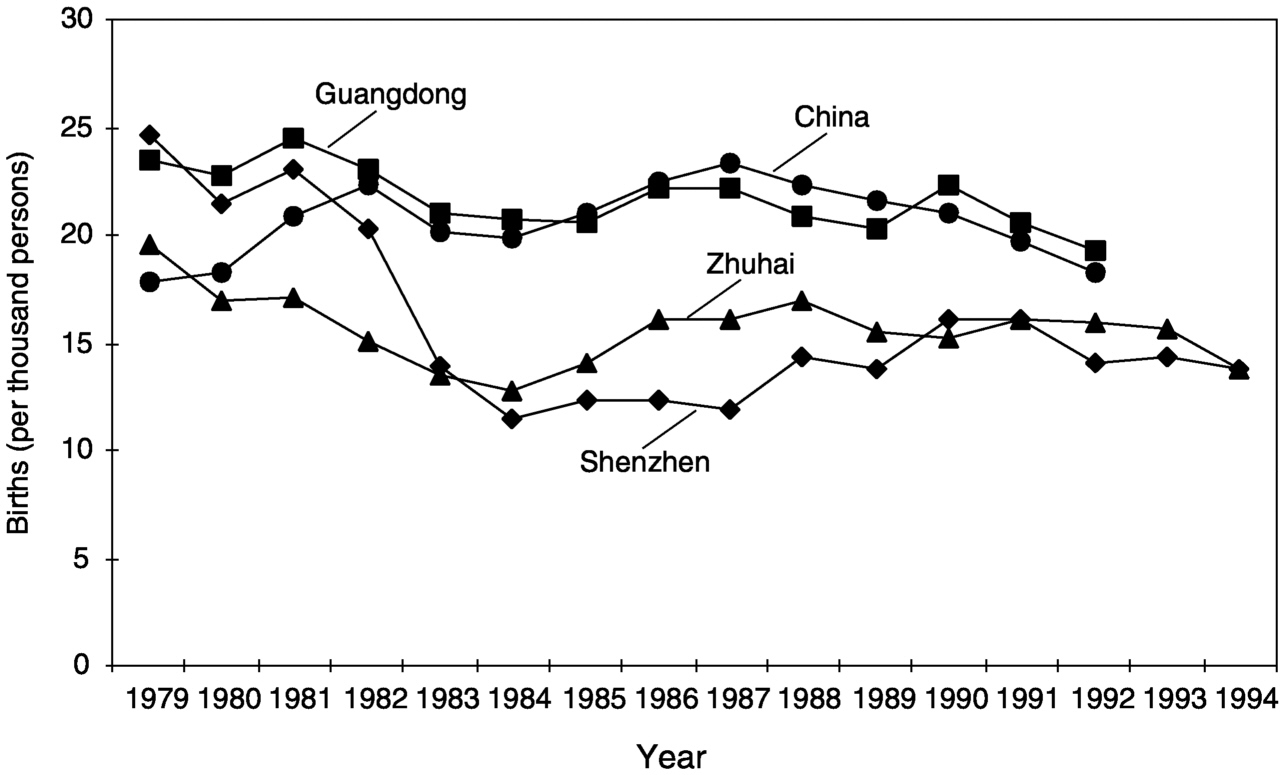
Overall, the population of the Pearl River Delta has grown considerably over the last two decades ( Figure 9-2), but this growth cannot be attributed to natural increase because the crude birth rate in the Delta area is below those at the provincial and national levels ( Figure 9-3). The natural growth rate (the difference between the crude birth rate and crude death rate) of the Delta area also is lower than those for Guangdong Province and China as a whole, and a declining population growth rate might have been expected because of implementation of the one-child policy.
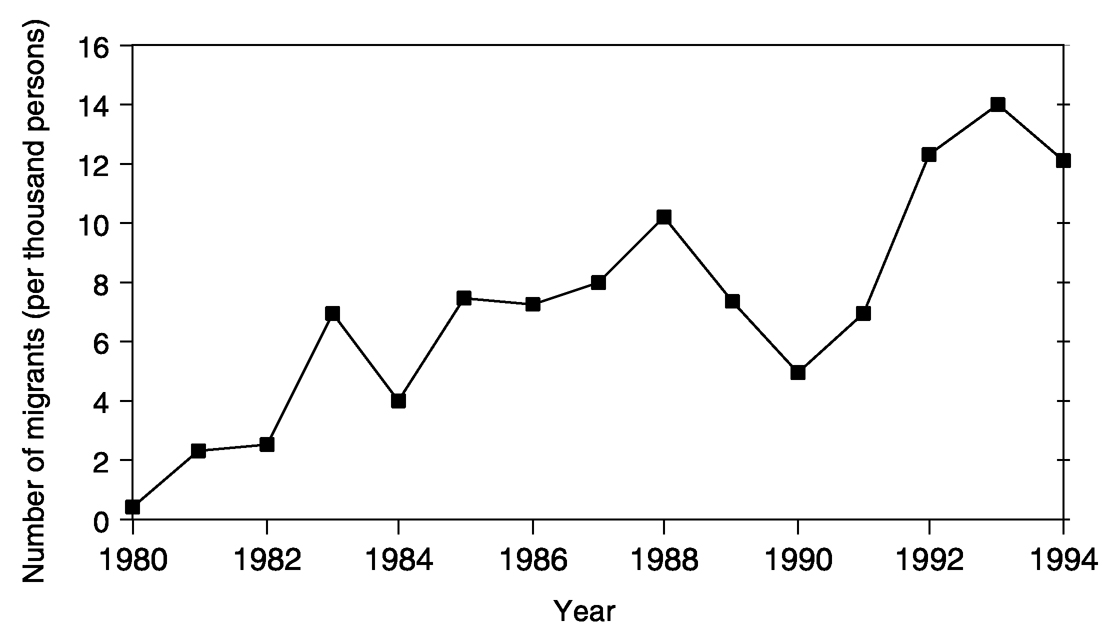
The Delta region owes its rapid population growth mainly to massive in-migration (see the net migration rates for 1980–1994 in Figure 9-4). Of the Chinese provinces, Guangdong has one of the highest net in-migration rates, and this rate is considerably higher in the Delta region than in the province as a whole. Within the region, the more industrialized subregions attract the most migrants. For example, the cities of Zhuhai and Shenzhen, two of the special economic zones1 located in the Delta, have the greatest relative gain in in-migration, more than 10 times the average
1The towns of Shenzhen and Zhuhai were redefined as cities in 1979 and a year later were established among China's first special economic zones (SEZ) by Chinese leader Deng Xiaoping. The special economic zones were implemented by the Communist government as a virtual laboratory for experimentation with a free market economy. These zones, which operate under an entirely different economic premise than that of the mainland, emphasize exports and are intended to serve as an attractive environment for foreign direct investment through favorable tax incentives. When the special economic zones were first established, the majority of the new businesses that settled in Shenzhen and Zhuhai were Hong Kong-and Macao-based enterprises drawn to the zones to take advantage of, among many other things, the abundance of low-wage labor and the customs-free industrial environment.
Page 210
FIGURE 9-2 Total population, Pearl River Delta, 1970–1994. SOURCES: Selected Statistical Yearbooks for subregions of Pearl River Delta, 1970–1995. NOTE: Total population includes only persons registered in the Pearl River Delta and excludes the floating population registered in other places.
~ enlarge ~
FIGURE 9-3 Crude birth rate, China, Guangdong Province, Shenzhen City, and Zhuhai City, 1979–1994. SOURCES: Yao Xinwu and Yinhua. 1994. Basic Data of China's Population. Beijing: China Population Press; Statistical Yearbooks for Shenzhen and Zhuhai.
~ enlarge ~
Page 211
FIGURE 9-4 Net migration rate, Pearl River Delta, 1980–1994. SOURCES: Selected Yearbooks for subregions of Pearl River Delta, 1980–1995.
~ enlarge ~
level of Guangdong. By contrast, Guangzhou, Foshan, and Zhongshan have experienced a medium gain in in-migration, more than five times the average level of Guangdong, and Dongguan has experienced the smallest gain, similar to that for Guangdong.
Population growth statistics are calculated on the basis of numbers of permanent residents, but China also has a “floating” population living away from their permanent residence (this phenomenon is described more fully later in this chapter and in Chapter 8). In the Delta area the floating population has been increasing because of the rapidly growing job market there. In 1995, for example, the floating population of the Delta made up more than half of the floating population of Guangdong Province ( Table 9-3). Thus if this massive temporary population is taken into account, the population growth in the Delta area has been dramatic indeed—a 74.3 percent increase from 1986 to 1995. In 1995 the population density of the Delta area was 1,173 persons per square kilometer, compared with 439 persons per square kilometer in Guangdong Province as a whole.
|
Subregion |
Ratio of Floating to Permanent Population (percent) |
|
Guangdong Province |
10.7 |
|
Guangzhou City |
33.1 |
|
Shenzhen City |
108.4 |
|
Zhuhai City |
30.8 |
|
Foshan City |
23.2 |
|
Dongguan City |
39.4 |
|
Zhongshan City |
6.0 |
SOURCE: 1% Sampling Census of 1995 in Guangdong. 1997. Beijing: China Statistical Press.
Page 212
Urbanization also is occurring at a rapid pace, but in China it is difficult to measure because of the ambiguous definition of the term and frequent changes in the stated boundaries of urban areas (Ma Xia, 1988; Zeng Yi and Vaupel, 1989). Three indicators of urbanization are used here to describe the process in the Pearl River Delta. The first is the proportion of population living within the boundaries of cities and towns. By this measure, which is the official definition used by the Chinese statistical system, the urban population of the Delta area more than doubled from 1982 to 1990, rising from 32 percent to 70 percent of the total permanent population. A considerable portion of this tremendous increase, however, resulted from the redrawing of administrative boundaries. Thus some suburban residents who were actually engaged in agricultural activities were counted as belonging to the urban population.
The second indicator is the nonagricultural workforce. It increased from about 45 percent of the total workforce in 1982 to about 80 percent in 1995. This indicator also overestimates the true level of urbanization, however, because some people who engaged in nonagricultural work lived in rural areas where there has been rapid growth in rural enterprises.
The third indicator is the proportion of persons who are officially registered as members of nonagricultural households. Among the total permanent residents of the Delta area, this proportion increased from about 36 percent in 1980 to about 52 percent in 1995. Because the government strictly controls nonagricultural household registration, some people who have lived in urban areas for many years and have worked in nonagricultural activities still have not been given nonagricultural household registration status. Thus this indicator can be said to underestimate the true level of urbanization in the Delta.
Land Use Change
Historically the Pearl River Delta was an important grain-growing region of China, and farming played a dominant role in basic land use patterns until the 1980s. In the decades that followed, however, economic reform policies greatly changed the region's social and economic conditions and, in turn, its land use patterns (see Table 9-4).
In 1973 the proportion of farmland to total area was 33.1 percent, dropping to 31.6 percent in 1982, only a slight decline. Farming thus still played a dominant role. Over the next 13 years, however, the proportion of farmland dropped, to 17.6 percent of total land area in 1995. In the meantime, the proportion of urban/built-up land increased from 2.4 percent in 1973 to 15.7 percent in 1995. Because most of the farmland and urban areas are situated in the flatlands of the region, it is logical to conclude that most of the expansion of urban areas has taken place at the expense of farmland. Increases in land devoted to gardens and forests are
Page 213
|
Land Use |
1973 |
1982 |
1995 |
|
Farmland |
33.1 |
31.6 |
17.6 |
|
Garden |
4.9 |
3.0 |
16.1 |
|
Forestland |
29.6 |
32.3 |
37.0 |
|
Grassland |
12.3 |
3.03 |
0.2 |
|
Urban/built-up |
2.4 |
7.5 |
15.7 |
|
Water |
12.6 |
16.8 |
12.8 |
|
Unused land |
5.0 |
5.80 |
0.7 |
NOTE: According to China's land classification system, garden land is planted in perennial crops such as orchard crops and tea; farmland is used to produce grain, vegetables, and cash crops; and forestland is devoted to cultivated and natural forests.
SOURCES: The data for 1973 are from Landsat MMS and for 1995 from TM images; the 1982 data are from a field survey.
tied to declines in grassland, because most of the grassland, gardens, and forests are located on mountain slopes and hillsides.
Urban and built-up land now makes up a significant proportion of the Delta region, thanks largely to the ongoing industrial development and infrastructure construction in the area ( Figure 9-5). The unique location of the Pearl River Delta, with its proximity to neighboring Hong Kong and Macao, have made it a major area for foreign investment, particularly in industry.
From 1950 to 1995, farmland in the Delta region dropped from 550,000 hectares to 310,000 hectares. The change in farmland can be divided into two periods: the period before 1980 when farmland decreased relatively slowly, and the period after 1980 and particularly after 1990, when the rate of decline was more significant ( Figure 9-5).
FIGURE 9-5 Urban/built-up areas and farmland, Pearl River Delta, 1960–1995. SOURCES: Urban/built-up: data for 1973 and 1995 are from Landsat images; data for 1982 and 1990 are from field surveys. Farmland data from Statistical Yearbooks from every city.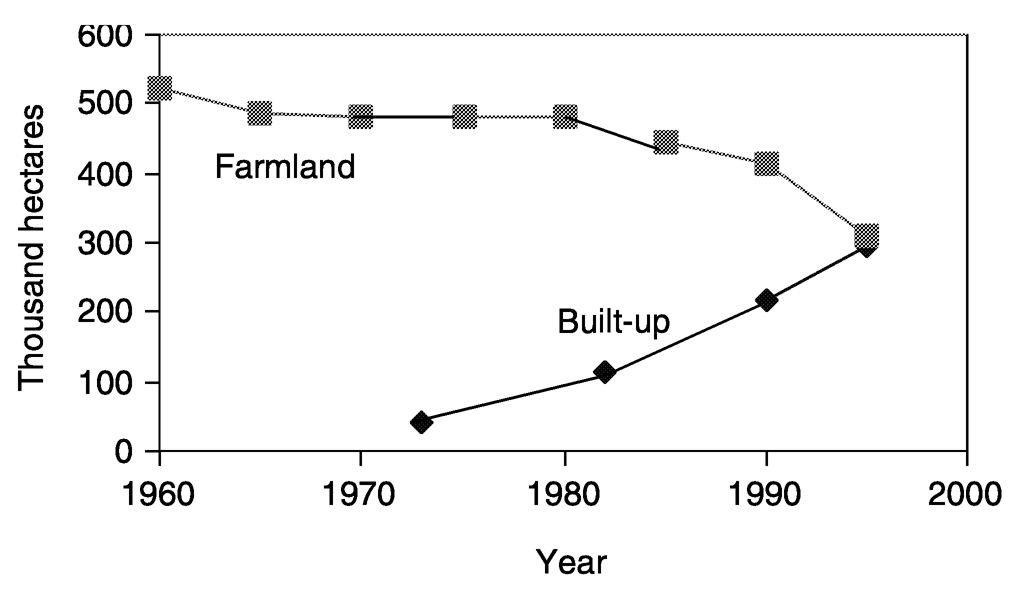
~ enlarge ~
Page 214
As for urban growth, the urban area of the special economic zone of Shenzhen, for example, increased from only 2.9 square kilometers in 1979 to 84 square kilometers in 1994. As the Delta area entered the 1980s, the pace increased for all kinds of nonagricultural construction (communications, housing, factories, and recreation). The highway system also expanded—by 82 percent from 1980 to 1994, reaching 0.6 kilometers per square kilometer. These changes were mostly at the expense of farmland.
Environmental Quality
Since the late 1970s, when China began to implement socioeconomic reforms and its Open Door Policy, rapid growth in the Delta area has served to raise the standard of living. This growth, however, has been accompanied by environmental pollution.
The total amount of wastewater discharged in the Delta area more than doubled from 1986 to 1995. Nonindustrial consumers generated 41.7 percent of total wastewater in 1986, rising to 66.4 percent in 1994. The capacity for processing wastewater has lagged far behind the increased output (Tang Yonglun, 1995). The proportion of wastewater processed up to industrial discharge standards decreased from 30 percent in 1986 to 21 percent in 1994.
The volume of automobile and factory emissions in the Delta area more than tripled from 1986 to 1995, and the volume of sulfur dioxide released into the atmosphere is estimated to be about 24 times higher than the average for China as a whole. In response to these problems, the government has stepped up its efforts to limit the discharge of air pollution emissions. Thus the proportion of treated industrial emissions increased from 50 percent in 1986 to 87.2 percent in 1995 in Guangdong Province as a whole, and from 47 percent to about 93.1 percent in the Delta area over the same period. Nevertheless, air pollution in the Delta worsened because of the large increase in the total quantity of emissions.
DATA AND METHODOLOGY
This study of a portion of the Pearl River Delta is based on an investigation of the historic record of land use change and an analysis of the factors driving such change (for more on these “driving factors,” see Chapter 8). From this investigation and analysis, several research findings were developed. Data generated by a geographic information system (GIS) were used to test these findings. Additional research findings on the process of land use change emerged from an examination of historical records and physical background information. Statistical data were used to test and validate these findings.
This study used multiple time-series data for the years 1950–1995 at the regional (entire study area) and subregional levels. The data used
Page 215
fell into two categories: official statistics and independent survey data. The statistical bureaus of the provincial and local governments provided official data for 1950–1995 on major land use categories such as farmland, water, and forestland. They also provided demographic data on literacy (by sex) and social and economic factors such as gross domestic product (GDP), per capita GDP, farmer income, and total consumption expenses.
Very detailed demographic data on each municipality and some townships were provided by the national population censuses conducted in 1982 and 1990. The censuses included many categories of population variables, such as urban population, rural population, family size, fertility rate, infant mortality, life expectancy, rural to urban migration, and literacy. In addition, two detailed surveys of land use in the Pearl River Delta dating from 1982 and 1990 were available. The major land use types, based on the Chinese land use classification, were: farmland, forestland, garden, grassland, built-up, roads and railroads, water bodies, and unused land. These survey data were more detailed than the official statistical data. Finally, several special field surveys on land quality have been conducted since the 1960s. Sixteen major soil types were observed continually in the Delta region from 1960 to 1980. The National Soil Survey of China, carried out during 1981–1983, and the field survey of 1996 provided detailed information on land quality at scales of 1:10,000 and 1:400,000.
AN ANALYSIS OF LAND USE CHANGE
Finding 1: Population growth, in particular migration and increases in the floating population, is at once a cause and a consequence of land use change in the Pearl River Delta.
The new economic policy put in place for the Pearl River Delta and the corresponding loosening of the regulations for migration provided opportunities that attracted a large floating population. Farmland was cleared to provide space for industry and for housing for the migrants. Thus population growth and land use change were both responses to the new economic model, and neither would have been possible without the other. Industries were built in response to market demands. The demand for labor exceeded local supply, and the new migrants required further and more extensive conversion of land for housing.
As a result, in the Delta total farmland has dropped as total population has increased ( Figure 9-6). Overall, as net migration rates rose in the Delta between 1980 and 1994, farmland decreased (see Figure 9-7), despite the increasing local consumption of farm products.
Since economic reform was implemented in China in 1978 (see Chapter 8), the country has had a “floating” population—that is, laborers who leave their registered permanent residence for less than half a year to
Page 216
FIGURE 9-6 Farmland and total population, Pearl River Delta, 1980–1994. SOURCES: Selected Statistical Yearbooks for subregions of Pearl River Delta, 1980–1995.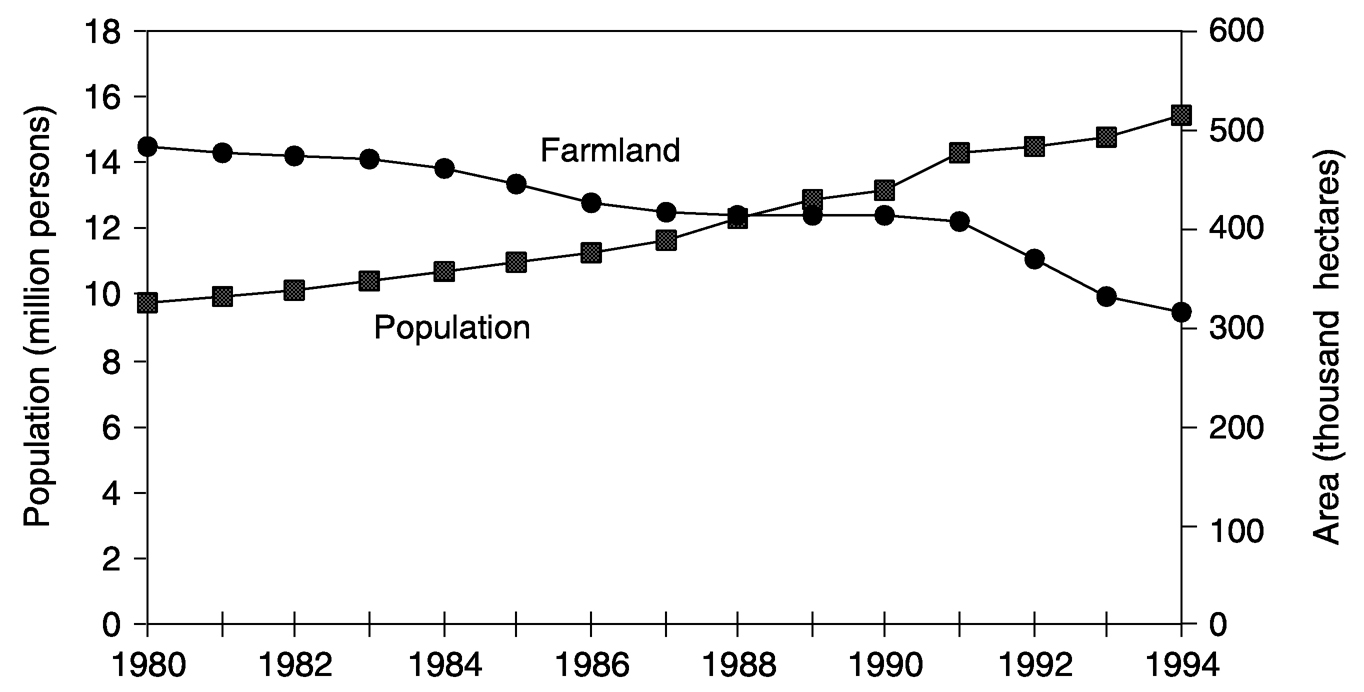
~ enlarge ~
work elsewhere in China.2 In the 1990s this population was estimated to be 100 million a year. Most moved temporarily into coastal regions such as the Pearl River Delta. The growing floating population in the Delta has been accompanied by an ever-greater demand for land. The temporary population needs space for housing which in turn requires expansion of the urban infrastructure into the surrounding farmland.
Intensified land use has been a significant consequence of changes in land use in the Pearl River Delta. In urban areas intensification has taken the form of significant increases in population density since 1980 ( Table 9-5) and production. Indeed, the economic output per unit of land has increased dramatically; the gross domestic product of Delta cities increased from 6.7 billion yuan in 1980 to 233.3 billion yuan in 1995.
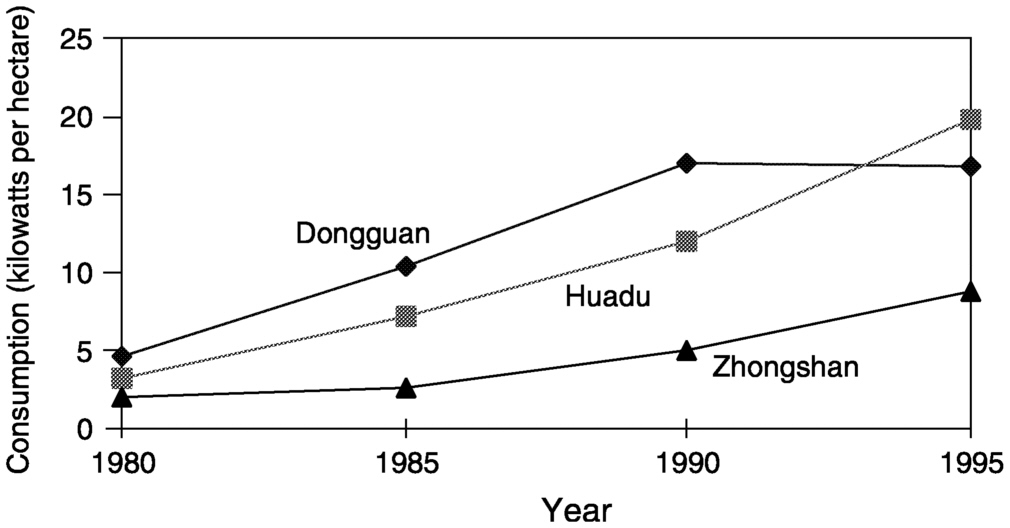
Intensified land use also is evident in agriculture, where more farmland must be converted to nonagricultural uses to make room for urbanization. To compensate for the loss of farmland, farmers must increase yields per unit of farmland, which in turn requires higher inputs of technology, capital, and labor. For example, since 1980 agricultural intensification in Shenzhen and Dongguan has generally increased grain yields per unit of farmland ( Figure 9-8). An important indicator of technological input is the gross power consumption of the machinery used in agricultural production such as tractors and pumps. This indicator increased by.
2This phenomenon is explained more fully in Chapter 8. The difference between a member of the floating population and a migrant is that the member of the floating population does not change his or her household registration and the migrant does.
Page 217
FIGURE 9-7 Farmland and net migration rate, Pearl River Delta, 1980–1994. SOURCES: Selected Statistical Yearbooks for subregions of Pearl River Delta, 1980–1995.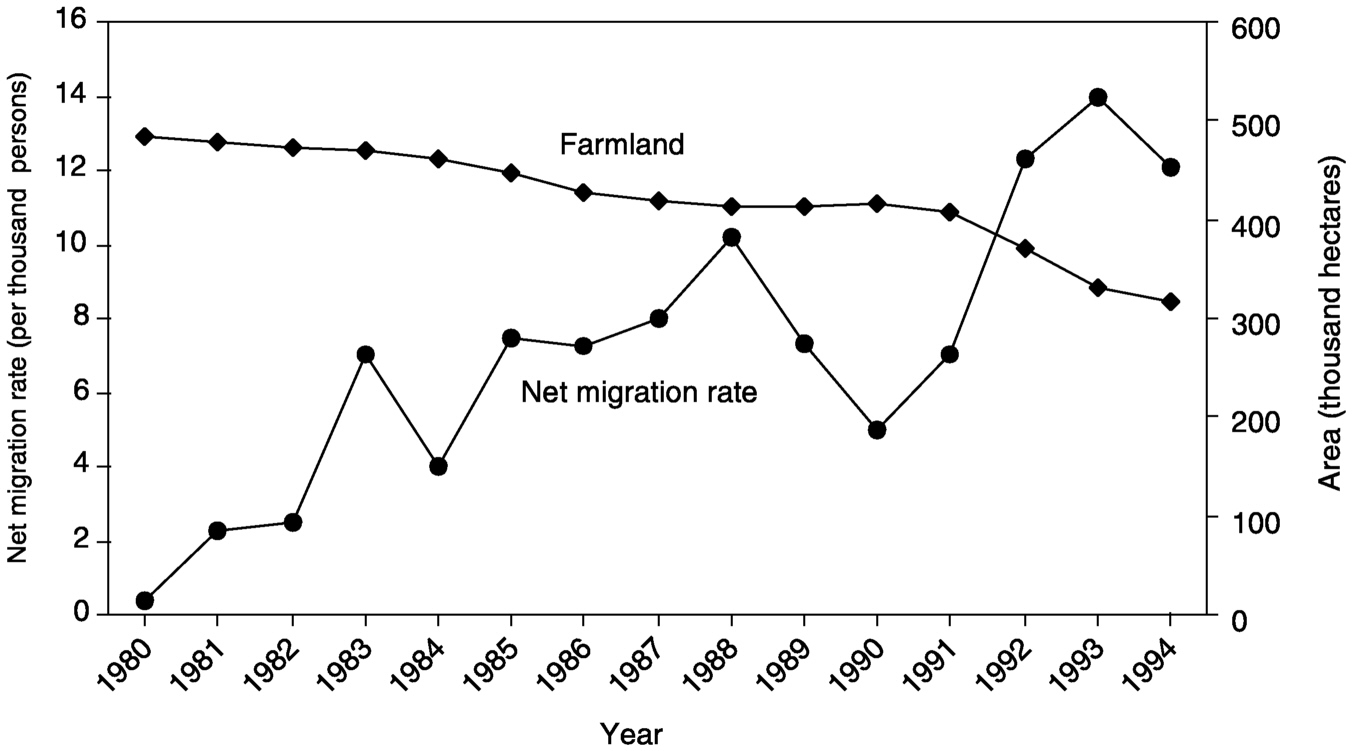
~ enlarge ~
a factor greater than four from 1980 to 1995 in much of the Delta area ( Figure 9-9)
Finding 2: In the Pearl River Delta changes in consumption levels caused by the economic growth have led to changes in land use in cities and changes in crop production in rural areas.
At the early stages of economic development beginning in 1978, the local production of goods and services served mainly to supply local demand. Later, when production surpassed local demand and the economy became fully open, local products were not only consumed within the region, but also exported through interregional, interprovincial, and international trade.
|
Municipality |
1980 |
1985 |
1990 |
1995 |
|
Dongguan |
457 |
490 |
535 |
587 |
|
Foshan |
921 |
988 |
1,089 |
1,219 |
|
Guangzhou |
675 |
733 |
799 |
870 |
|
Shenzhen |
165 |
436 |
1,000 |
1,709 |
|
Zhongshan |
600 |
630 |
683 |
744 |
|
Zhuhai |
231 |
260 |
318 |
400 |
SOURCES: Statistical Yearbooks of Dongguan, Foshan, Guangzhou, Shenzhen, Zhongshan, and Zhuhai.
Page 218
FIGURE 9-8 Unit area grain yield, Dongguan and Shenzhen, 1949–1996. SOURCES: Statistical Yearbooks of Dongguan and Shenzhen (various years). NOTE: Grain yield per unit farmland is a weighted average of various grains. In the Delta area it mainly reflects rice production.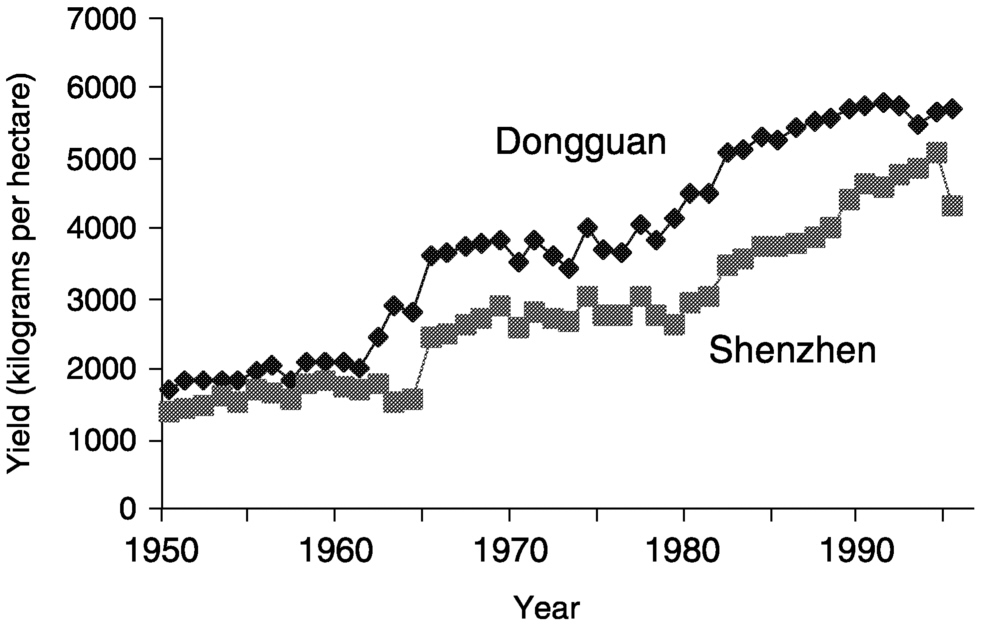
~ enlarge ~
This trade set in motion a process of dramatic shifts in consumption in the region. Among them, the increased population growth and wealth resulting from rising production and trade caused a significant change in the regional housing structure. For example, the per capita floor space in Guangzhou City remained constant from 1965 to 1980, at only 3–4 square meters. But by 1995 per capita floor space was about three times that of the 1960s and 1970s ( Figure 9-10), even though the population continued to grow. This development stemmed in part from rising incomes and in
~ enlarge ~
FIGURE 9-9 Gross power consumption of agricultural machinery per hectare of farmland, Dongguan, Huadu, and Zhongshan, 1980–1995. SOURCES: Statistical Yearbooks of Dongguan, Huadu, and Zhongshan (various years).
Page 219
FIGURE 9-10 Per capita residential floor space, Guangzhou City, 1965–1995. SOURCE: Statistical Yearbook of Guangdong, 1996.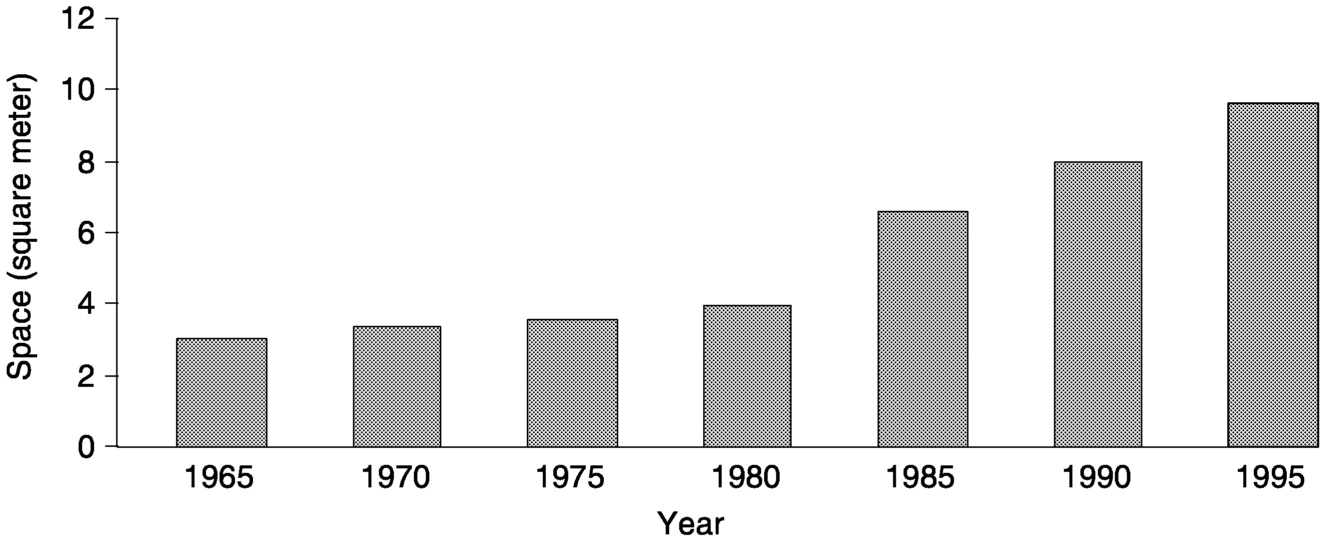
~ enlarge ~
part from government reform of the distribution system and encouragement of a free housing market.
Indeed, the government implemented special policies to foster housing development. One government housing reform policy allowed diversification of housing construction. As a result, not only governments and state-owned enterprises but also private real estate companies can now invest in housing development.
The expansion of green space in urban areas is another example of the changes in land use brought by economic development. In Guangzhou, known as the “dragon head” of economic development in Pearl River Delta and the whole of China as well, the municipal government allocates a portion of its large fiscal budget to the development and maintenance of green space—lawns, parks, artificial lakes, and squares ( Figure 9-11). In
FIGURE 9-11 Per capita open space and parkland, Guangzhou City, 1990–1995. SOURCE: Statistical Yearbook of Guangdong, 1996.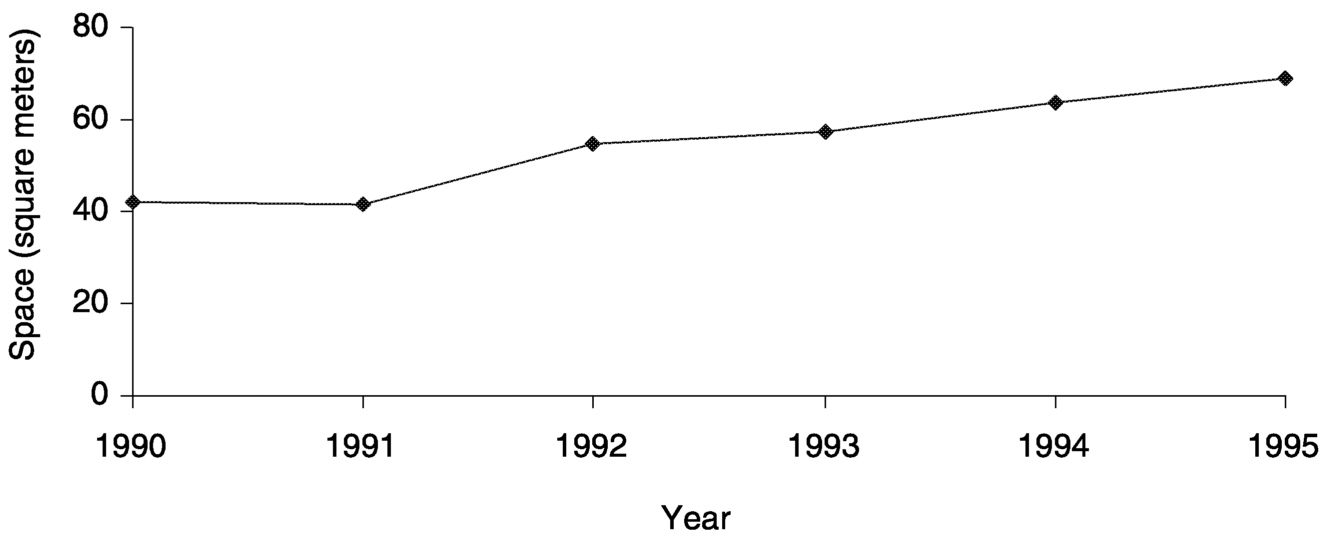
~ enlarge ~
Page 220
|
Food Product (kilograms) |
Average Annual Consumption per Capita |
||||
|
1978 |
1980 |
1985 |
1990 |
1995 |
|
|
Grain |
176.4 |
153.53 |
118.7 |
116.48 |
87.94 |
|
Vegetables |
147.36 |
136.54 |
95.05 |
100.7 |
102.71 |
|
Food oil |
3.36 |
3.88 |
4.09 |
4.45 |
6.98 |
|
Meat |
21.96 |
26 |
23.57 |
24.8 |
22.89 |
|
Poultry |
3.96 |
4.51 |
6.72 |
8.41 |
14.38 |
|
Fish |
11.2 |
14.48 |
16.41 |
17.38 |
20.31 |
|
Wine |
1.44 |
1.91 |
3.17 |
3.2 |
3.21 |
SOURCE: Statistical Yearbook of Guangdong Province, 1997, p. 228.
fact, the citizens of Guangzhou pressure government urban planners to develop such areas.
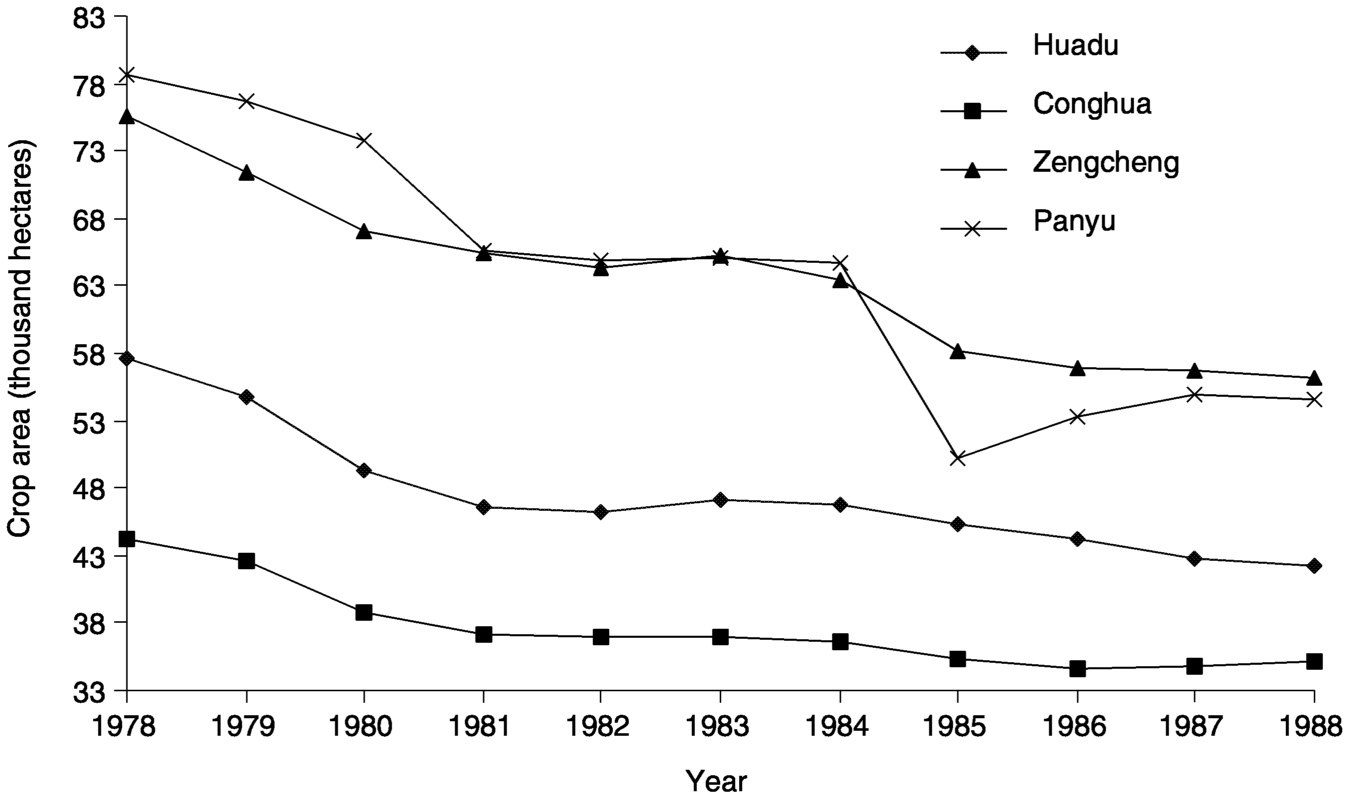
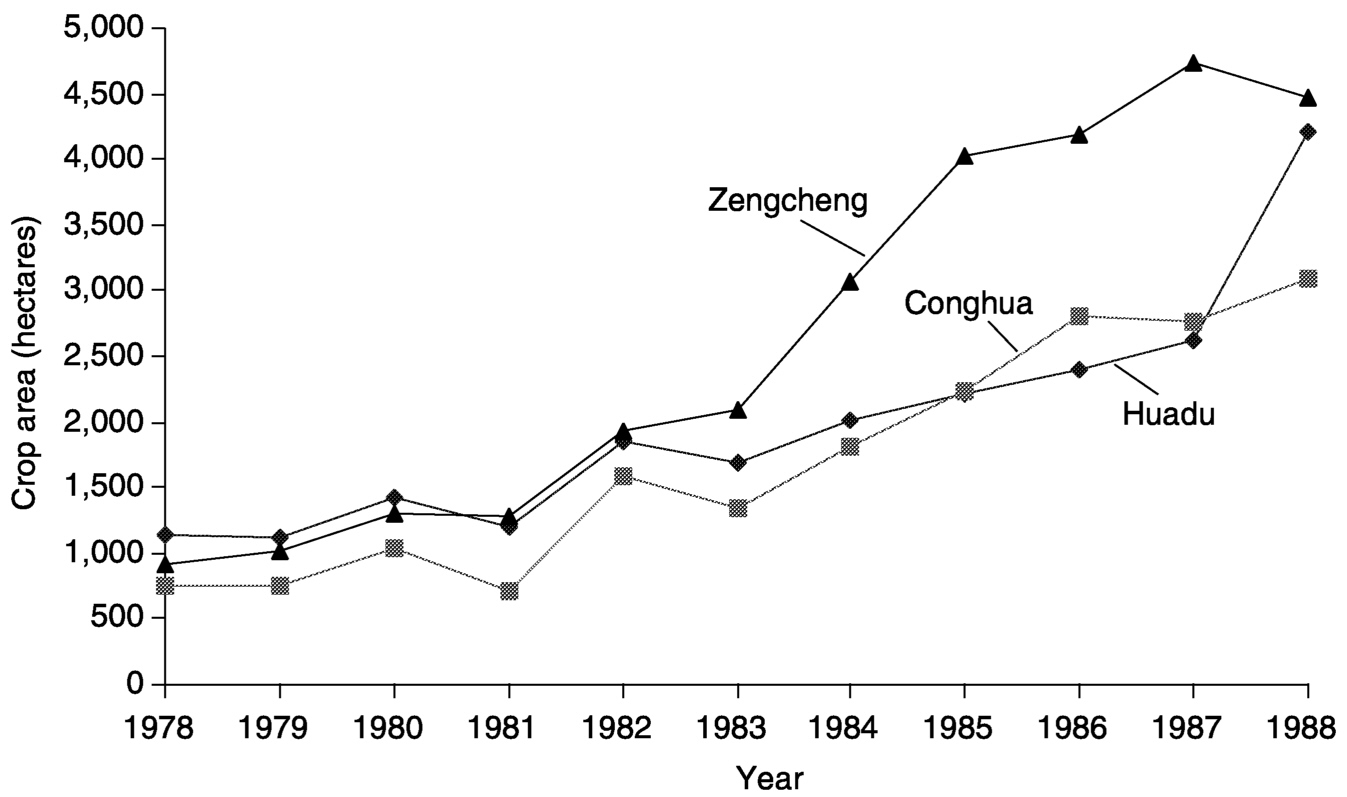
Changes in diet and crop production offer additional evidence of shifts in consumption. Residents of urban areas now consume less grain than in previous years. In 1978 per capita grain consumption in urban areas of Ghangdong Province was 176 kilograms, falling to 88 kilograms by 1995 (see Table 9-6). Likewise, per capita vegetable consumption decreased over the same period—from 147 kilograms in 1978 to 103 kilograms in 1995. This decreased consumption of vegetables and grains was offset by higher consumption of oil, meat, poultry, and fish. Meanwhile, the portion of farmland devoted to grain crops in four counties of Guangdong Province fell from 1978 to 1988 ( Figure 9-12), while the portion of farmland devoted to vegetable crops increased, despite falling consumption ( Figure 9-13).
The changing patterns of local food consumption mask two key factors associated with the shifts in crop production. First, grains and vegetables were being increasingly fed to animals to produce meat and other animal-related products such as milk. For example, in the urban areas of Guangzhou City per capita consumption of vegetables decreased, but the amount of farmland devoted to vegetable crops increased substantially in the suburbs because large portions of the crops were used to feed pigs, ducks, chickens, milk goats, milk cows, and many other animals. The second factor is that farmers were increasingly able to export their products outside the region. Thus a large proportion of vegetable production was not consumed by local people, but rather sold to other areas. Illustrating this trend, from 1978 to 1988 in the counties of Huadu, Conghua, Zengcheng, and Panyu,3 land devoted to grain crops decreased ( Figure
3Because of a lack of data, it is hard to show the complete picture of changes in cropping patterns in the Delta region. Huadu, Conghua, Zengcheng, and Panyu, all counties in the municipality of Gangzhou, were selected to illustrate patterns of farmland use.
Page 221
~ enlarge ~
FIGURE 9-12 Grain crop areas, Huadu, Conghua, Zengcheng, and Panyu counties, 1978–1988. SOURCE: The Forty Years of Ji'an Prefecture, Ji'an Prefecture Statistics, 1988.
~ enlarge ~
FIGURE 9-13 Vegetable land, Huadu, Conghua, and Zengcheng counties, 1978–1988. SOURCES: Guangdong Statistical Bureau. 1988. The Forty Years of Guangdong. Beijing: China Statistical Press.
Page 222
9-12), while more and more farmland was shifted to production of cash crops and vegetables (see Figure 9-13).
Finding 3: The economic reform policies introduced in 1978 and known as the Open Door Policy greatly influenced the patterns of land use in the Pearl River Delta, although their impacts on land use differed over time.
Beginning in the 1980s, the Chinese central government decided to implement a variety of policies that would build Shenzhen and Zhuhai into an exporting industry base. Before the economic reforms, Shenzhen and Zhuhai were relatively small agricultural and fishing villages; after the reforms they became large metropolitan areas with millions of residents. As further evidence of its growth, Shenzhen had a built-up area of 58,507 hectares in 1990 compared with only 10,814 hectares in 1982.
The reform policies included: (1) very low or even no taxation on investments in the Delta, particularly when the industry benefiting from the investment was essential for advanced technology; (2) very low rental prices on farmland used for business site construction; and (3) extension of the right to enterprises to recruit and dismiss employees. These policies had large impacts on land use in Pearl River Delta—among them, a reduction in agricultural land.
The Open Door Policy greatly stimulated productivity in the Pearl River Delta. Living standards in the area improved substantially, leading to a rise in overall consumption levels and changes in consumption patterns. With the transition in market patterns, land use in cities continued to change, and in agricultural areas land was shifted from grain to cash crops.
The flexible spatial mobility policy allowed people to seek the economic opportunities available in the Pearl River Delta region. As a result, Shenzhen saw its floating population grow from 10,000 in 1980 to 600,000 in 1989. With the rapid increase of this population, housing construction was accelerated and grew from 0.17 million square meters in 1980 to 1.69 million square meters in 1989.
In the 1990s the pressure of population growth on the land, particularly that produced by the in-migrant and floating populations, began to attract more attention from governments at all levels. The result was development of a special policy for the floating population. In Shenzhen City, for example, the local government began to control the size of the floating population by requiring special registration forms. By the mid–1990s this measure had stabilized the growth of the floating population, although some undocumented migrants remained in the city.
Finding 4: Soil quality in the Pearl River Delta improved during periods of sustainable land use, but it has been degraded in some areas by improper land use.
Page 223
Soil quality in the Pearl River Delta has undergone complicated processes of change in the last decades, particularly paddy soil which has a long history and a broad range of quality in the Pearl River Delta. The soils in the case study area can be divided into 16 groups according to their location and texture. Half of the area is covered with lateritic red soil (udic andisols) and 38.55 percent with paddy soil (stagnic anthrosols) (Lu Faxi, 1988; Guangdong Institute of Soil Science, 1988).
Many of the factors that have influenced soil quality in the region over the past two decades are associated with the changing population and consumption patterns. For example, soil quality improved from 1981 to 1996 in most areas as farmers began to shift cropland to orchards and other garden lands in order to maximize economic benefits and attain more sustainable land use. Generally, soil quality was improved because the garden land received higher inputs of farmyard manure and more intensive management than the cropland.
Prior to 1978, farmers applied few chemical fertilizers to the land. Soils with a cultivation history of over 100 years, however, tended to receive higher inputs of organic matter and more management than did soils with a shorter cultivation history. The “older” soils thus were better protected from degradation. Between 1978 and 1980 chemical fertilizer applications in general soared as the economic reform and Open Door policies were implemented. After 1981, shifts in land use pattern were associated with the development of two kinds of fertilizer regimes revolving around chemical fertilizers and farmyard manure ( Table 9-7). Under the chemical fertilizer regime, the lack of soil organic matter in the soil prohibited the restoration of soil fertility and soil quality generally degraded. Under the farmyard manure regime fertility and soil quality improved. Increased inputs of farmyard manure in order to raise levels of organic matter and total nitrogen accompanied the shift of cropland, including paddy field and uplands, to garden land or vegetable land. Organic matter values also rose when paddy fields were converted to orchard or fallow land, because organic matter decomposes more readily in orchard land than in the paddy field (Qin Mingzhou, 1997).
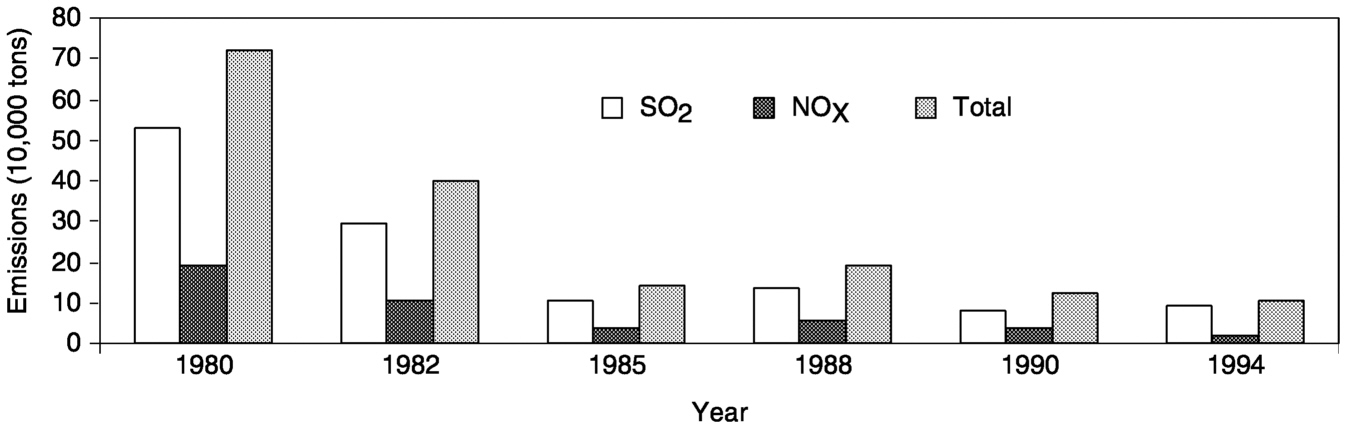
Soil acidification in the Pearl River Delta declined after a peak in 1980. The many new township enterprises that had emerged in the region had been emitting large quantities of sulfur dioxide and nitrogen oxide into the air, acidifying the soil. But the introduction of stringent regulations led to a decline in the emissions from these enterprises after 1980 and in turn to a decline in soil acidification ( Figure 9-14).
Finding 5: The urbanization policy adopted in the Pearl River Delta alleviated to some extent the population pressures on urban areas by encouraging the rapid development of small towns so they could absorb many of the surplus rural laborers who otherwise would have settled in the larger urban centers.
Page 224
|
Year |
Paddy |
Upland |
Orchard/Garden |
Vegetable Land |
||||
|
Farmyard Manure |
Chemical Fertilizer |
Farmyard Manure |
Chemical Fertilizer |
Farmyard Manure |
Chemical Fertilizer |
Farmyard Manure |
Chemical Fertilizer |
|
|
1989 |
226.50 |
1,111.05 |
169.05 |
4,151.40 |
2,038.35 |
3,434.40 |
1,525.05 |
2,787.45 |
|
1992 |
160.05 |
1,243.95 |
19.50 |
3,388.50 |
1,171.35 |
3,345.30 |
2,147.10 |
3,930.00 |
|
1994 |
82.50 |
1,757.85 |
6.45 |
3,940.80 |
545.70 |
4,659.60 |
5,422.50 |
7,200.00 |
SOURCE: Cost investigation of agricultural products in Guangzhou, 1989–1995, Guangzhou Price Bureau (systematized by Qin Mingzhou).
Page 225
~ enlarge ~
FIGURE 9-14 Sulfur dioxide (SO2) and nitrogen oxide (NOX) emissions, Pearl River Delta, 1980–1994. SOURCE: Environment Bulletin of Guangdong Province, 1990 and 1995. Calculations by Qin Mingzhou.
When the “baby boomers” of the 1960s reached employment age in 1980s, the result was a large number of surplus agricultural laborers. The amount of arable land had not increased, but agricultural productivity had gone up in response to reforms and intensification, so that a smaller number of laborers was required to produce the same agricultural output ( Table 9-8).
During the early stages of this agricultural labor transition, surplus agricultural laborers moved to the big cities to find jobs. Job opportunities were available for some, but those with low education and skill levels in a time of rapid economic development found it difficult to find work. At the same time, cities faced the problem of providing in-migrants with
|
Year |
Agricultural Production (kilograms) |
|||||
|
Grain |
Peanuts |
Sugarcane |
Vegetables |
Fruits |
Fish |
|
|
1950 |
858 |
7 |
126 |
304 |
76 |
10 |
|
1952 |
937 |
9 |
314 |
338 |
76 |
11 |
|
1957 |
926 |
11 |
978 |
554 |
99 |
14 |
|
1965 |
1,234 |
24 |
1,139 |
497 |
76 |
21 |
|
1978 |
953 |
29 |
1,152 |
478 |
44 |
27 |
|
1980 |
1,126 |
39 |
1,274 |
429 |
61 |
29 |
|
1985 |
1,197 |
53 |
2,536 |
810 |
182 |
66 |
|
1987 |
1,247 |
46 |
1,842 |
1,066 |
371 |
78 |
|
1988 |
1,191 |
46 |
1,839 |
1,291 |
360 |
83 |
|
1990 |
1,250 |
40 |
2,160 |
1,340 |
330 |
90 |
|
1995 |
1,090 |
30 |
840 |
2,400 |
350 |
90 |
SOURCE: The Forty Years of Guangzhou (1949–1988). 1989. Beijing: China Statistical Press, p. 311.
Page 226
adequate public transportation, housing, medical care, education, and living environments. How to provide surplus agricultural laborers with employment opportunities thus became an important issue.
In response to this problem, China adopted the strategy of limiting the expansion of large cities by developing medium and small cities, as well as small towns. Governments at various levels encouraged surplus agricultural laborers to stay in small towns and set up factories and small firms and gave favorable treatment to both domestic and foreign investments aimed at creating employment in small towns for surplus agricultural laborers. Stimulated by those favorable policies, township enterprises developed rapidly in the Pearl River Delta, and today they account for a large percentage of the total economic growth ( Table 9-9). In 1996 township industries absorbed 1.1 million working people.
Overall, the result of the urbanization policy in the Pearl River Delta has been a rapid population growth rate for small towns, whereas the populations of big cities such as Guangzhou have increased much less rapidly. The township population in Guangdong Province grew from 6.88 million in 1985 to 40.80 million in 1990, almost a sixfold increase. By contrast, the population of Guangzhou municipality increased by less than twofold, from 3.9 million to 6.3 million.
Finding 6: Since the early 1980s, environmental quality has deteriorated in many parts of the Pearl River Delta, particularly in some townships. Yet the case of Zhuhai City suggests that rapid economic growth accompanied by massive inmigration does not necessarily result in severe environmental degradation.
Rapid economic and population growth have led to serious environmental problems in the Delta region—among other things, high levels of air pollution and large quantities of wastewater and industrial waste residue. Some industries—particularly iron ore, pig iron, raw coal, calcium sulfate ore, phosphate fertilizer, cement, and calcium sulfate—produce considerable quantities of solid and liquid waste. In addition, paper manufacturing poses one of the greatest pollution threats, and wooden furniture manufacturing results in significant loss of local forests. Many industries, however, are reluctant to allocate financial resources toward improving the environment.
|
1980 |
1985 |
1990 |
1995 |
1996 |
|
|
Enterprises |
97 |
687 |
1,197 |
1,447 |
1,450 |
|
Employees |
2,049 |
4,015 |
6,583 |
10,721 |
11,186 |
SOURCE: Statistical Yearbook of Guangdong Province, 1997, p. 273.
Page 227
Does rapid economic growth unavoidably result in severe environmental pollution? The answer is “not necessarily” based on a comparative analysis of Zhuhai and the other five municipalities that, with Zhuhai, make up the Pearl River Delta. Zhuhai was an underdeveloped rural county before 1979, when, administratively, it became a municipality. As one of the first four special economic zones designated by the central government, Zhuhai has since August 1980 enjoyed special policies for stimulating economic growth.
Table 9-10 compares economic, population, farmland, and environmental pollution indicators for Zhuhai with those for the other five municipalities in the Delta area. According to the table, the economic growth rate of Zhuhai has been higher than the average for the other five municipalities. Zhuhai greatly benefits from being a special economic zone, whereas of the other municipalities, only Shenzhen benefits from that special status. The permanent population of Zhuhai is only 600,000; the other municipalities range in population from more than 1 million to several million. Zhuhai, however, is one of the fastest-growing municipalities, and its floating population is rising rapidly. Also important, compared with cities in the other municipalities, Zhuhai City has a comparatively higher proportion of light industry to heavy industry, which generally leads to lower levels of pollution.
On all indices measuring environmental pollution, the Zhuhai municipality performed better than the other five municipalities taken together. For example, during 1990–1995 in Zhuhai the average wastewater, air pollution emissions, and waste residue per capita were about 16.4, 15.3, and 53.4 percent lower, respectively, than the corresponding averages for the other five municipalities. The overall air pollution index in Zhuhai was 44.3 percent lower. Field observations suggest that Zhuhai's better performance in environmental protection was the result of several policy commitments.
First, the government of Zhuhai municipality has strongly emphasized the strategic importance of protecting the environment, and all city planning, construction, and economic development programs are expected to conform to high environmental standards.
Second, the government has established and implemented laws aimed at protecting the environment. For example, the policy “Eight Decrees of Environmental Protection” announced by the People's Congress and the municipal government forbids the establishment of any factory that does not have an effective facility for keeping the level of pollution below the required standard; prohibits noise levels in residential areas that exceed 45 decibels; and sets limits on automobile exhaust emissions. This legislation not only strictly defines what is forbidden in order to prevent pollution, but also explicitly states what must be done to protect the environment—for example, the standards that must be met for drinking water
Page 228
|
Zhuhai |
Other Five Municipalities |
|
|
1. Economic growth per capita (yuan) |
||
|
GDP, average 1990–1995 |
11,690 |
8,080 |
|
Total growth rate (percent) |
256.3 |
190.3 |
|
Industrial + agricultural prodn., average 1990–1995 |
18,980 |
15,370 |
|
Total growth rate (percent) |
305.7 |
226.4 |
|
Government revenue, average 1990–1995 |
1,075 |
789 |
|
Total growth rate (percent) |
143.5 |
112.2 |
|
Residents' bank balances, average 1990–1995 |
6,360 |
5,590 |
|
Total growth rate (percent) |
375.9 |
261.3 |
|
2. Population growth |
||
|
Annual growth rate of permanent residents, 1980–1995 (percent) |
3.64 |
1.78 |
|
Annual growth rate of total population, 1986–1995 (percent) |
7.88 |
4.88 |
|
3. Farmland |
||
|
Decrease in farmland per capita, 1986–1995 (percent) |
−63.89 |
−59.95 |
|
4. Indices of environmental pollution |
||
|
Wastewater per capita, average 1990–1994 (tonnes) |
70.35 |
84.14 |
|
Air emissions per capita, average 1990–1994 (cubic meters) |
10,074.7 |
15,564.1 |
|
Waste residue per capita, average 1990–1994 (tonnes) |
70.139 |
0.298 |
|
Air pollution index, average 1991–1995 |
||
|
Sulfur dioxide |
0.27 |
0.658 |
|
Nitrogen oxide |
0.56 |
0.736 |
|
Floating materials in the air |
0.42 |
0.798 |
|
Ash fall |
0.59 |
1.114 |
|
Total |
1.84 |
3.306 |
|
Index of seawater pollution at junction of river and sea, average 1991–1995 |
1.48 |
1.75 |
|
Noise index, average 1991–1995 |
||
|
Road |
71.32 |
73.348 |
|
Residential community |
58.66 |
60.528 |
NOTES: (1) Total growth rate (percent) is computed as the difference of the indices between 1995 and 1990 divided by the index in 1990 and multiplied by 100; (2) total population includes floating population and permanent residents; (3) index of seawater pollution at the junction of river and sea for five other municipalities includes only Guangzhou and Shenzhen.
Page 229
and the discharge of waste materials. Also under this policy, each enterprise must deposit a certain sum of money in a fund managed by the Environmental Protection Bureau. If the enterprise then passes the environmental protection examination at the end of the year, the sum is returned along with an additional financial reward. If not, the money is not returned and a fine is imposed.
Third, the government has invested substantially in increasing the capacity of the Zhuhai municipality to process wastewater, air pollution, and solid waste, and it has established a sophisticated environmental protection network and environmental protection offices at various administrative levels, right down to the townships and neighborhood committees. One or two environmental managers are appointed in every village and enterprise.
Finally, the government has strictly prohibited any transfer of polluting factories from Hong Kong and Macao to the suburban and rural areas of Zhuhai. More than 90 applications for the transfer of such factories have been rejected.
All these steps have been effective at curbing pollution in the Zhuhai municipality. But an indirect result has been a sharp increase in population, attracted by a growing economy and protected environment. Clearly, the impact might be different if neighboring jurisdictions were to adopt similar regulations; the air quality might improve, but economic effects might be negative if polluting industries were prohibited throughout the region. Nevertheless, the example of Zhuhai shows that under certain conditions population, development, and environment can be positively related.
CONCLUSION
This analysis has revealed that policy shifts by the Chinese government have been the primary factors driving changes in population, land use, and consumption patterns in the Pearl River Delta. Various economic reform policies since 1978—including the establishment of special economic zones, a favorable investment environment, and favorable regulations—have fostered the emergence and growth of the region's manufacturing base and export-oriented economy. This transformation in turn has attracted millions of migrants and members of the floating workforce to the region. In the 1980s, increases in agricultural productivity, accompanied by the coming of age of the population surge of the 1960s, resulted in an influx of larger numbers of young surplus agricultural laborers into the Pearl River Delta. In response, the government adopted urbanization policies to encourage the growth of small towns in remote areas and satellite towns around the big cities to absorb most of the surplus labor.
This rapid population growth and the government policies for development of the region that inspired them have served as key forces driving
Page 230
changes in land use in the region. These changes have been characterized by the conversion of agricultural land into nonagricultural land and a trend toward more intensified use of land in both rural and urban areas.
Rapid economic development accompanied by dramatic population growth and changes in land use have had a great impact on the environment of the Pearl River Delta. Before 1978, environmental quality in the Delta area was fairly good because of the relatively small size of the population and low industrialization levels. But since the mid-1980s, in-migration, accelerating industrialization, and land use change have led to obvious environmental degradation. Nevertheless, rapid economic growth does not necessarily result in massive degradation of the environment. As this study found in the municipality of Zhuhai, government policies can significantly ameliorate pollution levels.
REFERENCES
. 1988 . Assessment and District Division of Soil Resource Utilization of Agriculture in Pearl River Delta. Guangzhou Branch of Popular Science Press of China .
Lu Faxi. ed. 1988 . Soil in Pearl River Delta. Beijing : Environment Science and Technology Press of China .
. 1997 . Amount and quality changes in the process of red soil resource development in South China. Postdoctoral report, Institute of Soil Science, Chinese Academy of Sciences, pp. 5–30 .
. 1988 . Criterion for urban-rural classification and the level of urban development. Population and Economics (in Chinese) 6: 29–33 .
. 1995 . Approach on macro distribution of ecological environment of Pearl River Delta Economic Zone. Guangdong Development Herald, No. 4.
, and . 1989 . Impact of urbanization and delayed childbearing on population growth and aging in China. Population and Development Review 15: 425-445 .


