
Page 131
Panel III:
Stimulating R&D Investment
INTRODUCTION
David Finifter
College of William & Mary
David Finifter, Director of the Thomas Jefferson Program for Public Policy at the College of William and Mary, said he had worked on evaluation of industry technology programs, particularly SBIR. Today's proceedings make it clear that the ATP has advanced the art of program evaluation to an encouraging degree. As a case in point, he introduced Maryann Feldman of Johns Hopkins University, who presented an assessment of the added value of ATP awards.
ASSESSING THE ATP: HALO EFFECTS AND ADDED VALUE
Maryann Feldman
Johns Hopkins University
Dr. Feldman began by urging that we should reconsider government R&D programs. The literature generally treats such programs as procurement programs, and this approach does not apply neatly to the ATP. 15 The literature generally treats
15 See Paul A. David, Bronwyn H. Hall, and Andrew A. Toole, “Is Public R&D a Complement or Substitute for Private R&D? A Review of the Econometric Evidence,” Research Policy, 29(4-5):497-529, 2000. See also T. J. Klette, J. Møen, and Z. Grileches, “Do Subsidies to Commercial R&D Reduce Market Failures? Microeconomic Evaluation Studies,” Research Policy 29(4-5):471-495, 2000.
Page 132
government as the main customer or as having regulatory power to approve technology use. It treats the phenomenon of government spending “crowding out” private spending by analyzing programs that mainly address government needs. 16 The literature has also looked at subsidies for R&D through tax incentives. 17
These approaches may be adequate for most of the research programs of the Department of Defense, the Department of Energy, or the Department of Health and Human Services.
None of them is satisfactory in assessing the ATP. In this program the government is more of a partner than a customer, and there are strong incentives to cooperate, share information, and undertake early-stage R&D.
The ATP has the following critical characteristics that differentiate it from the other government R&D programs:
-
a focus on developing the economic benefit of early stage, high-risk, enabling innovative civilian technologies;
-
an emphasis on the formation of partnerships and consortia;
-
a rigorous, competitive selection process with an independent evaluation of the project's technical merit, commercial worthiness, and potential for broad-based economic benefits; and
-
debriefings for those who apply but are not selected.
To learn about the impacts of these differences on ATP applicants, Dr. Feldman surveyed the 1998 applicants (both winners and non-winners), seeking answers to two questions:
-
Does the ATP application process reward risky, broad-based research projects?
-
Does the ATP award encourage subsequent investment by private investors?
The short answer to both of these questions is “yes.” This finding is supported by a substantial research project involving a survey of 240 companies, including winners and non-winners.
The 1998 ATP Competition
In the 1998 competition, 502 proposals were submitted, involving 822 organizations. Of these, 79 proposals (about 16 percent), representing 168 participating organizations, were selected for awards. Joint ventures accounted for 27 of the awards, with 116 member organizations in all. There were 52 single-company awards.
16 See D. Guellec and B. von Pottelsbughe, “The Impact of Public R&D Expenditures in Business R&D,” paper presented to NBER Summer Institute, July 2000.
17 See Bronwyn H. Hall and J. van Reenen, “How Effective are Fiscal Incentives for R&D? A New Review of the Evidence,” Research Policy, 29(4-5):449-469, 2000.
Page 133
The survey, in 1999, attempted to contact all awardees and unsuccessful applicants. The overall response rate of 60 percent was achieved (81 percent of the firms with awards and 50 percent of unsuccessful applicants), for a total sample size of 241. For each participant in the survey, Dr. Feldman said she and her colleagues matched the responses with ATP's technical and business/economic assessments of proposal quality.
Survey Results
When asked, “Was the ATP review and selection process fair?” 81 percent of the sample, that is, 95 percent of the awardees and, surprisingly, 67 percent of the non-winners answered “Yes.” This result is encouraging.
When asked “Do you plan to apply to ATP in the future?” again more than two-thirds of the respondents answered in the affirmative ( Table 1).
Does the ATP Application Process Provide Value to Applicants that do not Receive Awards?
The ATP program is intended to help unsuccessful applicants by providing information on proposal deficiencies and selection criteria. Unsuccessful applications may request debriefings by the technical and business specialists who serve on review boards. Our survey found that 82 percent of the non-winners in 1998 requested and received debriefing; of these, 73 percent found that feedback beneficial.
Does the ATP Encourage Wider Collaboration?
The ATP is intended to encourage collaboration. To test this claim, we asked all participants whether they had partners and, if so, whether their partners were new partners or entities with which they had previously collaborated. The responses suggest that half of the applicants were collaborating for the first time with their most important partners ( Table 2).
|
Plan To Apply in the Future? |
Percentage, by Award Status |
||
|
Awardees |
Non-Awardees |
All Applicants |
|
|
Definitely/Very likely |
82 |
59 |
70 |
|
Undecided |
15 |
12 |
13 |
|
Not very likely/Definitely not |
4 |
29 |
17 |
Page 134
|
Collaboration Status |
Percentage, by Award Status |
||
|
Awardees |
Non-Winners |
All Applicants |
|
|
Have research partners for this project |
83 |
80 |
82 |
|
First-time collaboration with most important partner |
59 |
43 |
50 |
Does the ATP Reward High-Risk, Enabling Technologies?
The survey found evidence suggesting that the ATP awards tend to support risky research projects addressing enabling technologies. Awardees were more likely than non-winners to propose R&D projects that were new to their firms. They were also more likely to collaborate with new partners. They tended to express much greater willingness to share research results with other firms, and to have broader, stronger linkages to other businesses. Companies that are well connected with other companies generate greater knowledge spillovers.
Other Findings
The survey found no significant differences between winners and non-winners that would be correlated with prior experience and success with the ATP. Nor did the effort spent on preparing proposals differ significant between the two groups. On average the companies spent about $20,000 on their proposals, with no significant difference between winners and non-winners. Applicants do seem to be more likely to win if their proposals are in certain technical areas, notably biotechnology and electronics.
To What Extent Did Non-Winners Continue to Pursue the Technologies Proposedto the ATP?
When asked one year after the results of the 1998 competition were announced, more than 60 percent of them had not pursued the project further ( Table 3). In
|
Extent of Follow-Up Activity |
Percentage |
|
Did not proceed with the project at all |
61.4 |
|
Began project on a much smaller scale |
16.4 |
|
Began project on a somewhat smaller scale |
11.7 |
|
Began project at about the same scale as proposed to ATP |
5.3 |
|
Began project at somewhat larger scale |
2.9 |
|
Began project on a much larger scale |
0.6 |
|
Refused to answer, or don't know |
1.8 |
Page 135
fact, 49 of the companies surveyed had either gone out of business (23 companies) or the proposed principal investigators had left (26 companies). This finding tends to confirms the riskiness of the projects proposed, since private investors could not be found. About 40 percent continued the project at the same or smaller scale, and about 4 percent pursued it at a larger or much larger scale (i.e., ultimately securing venture capital funding).
Of those non-winning firms that survived, about 40 percent were still working on the project with the same partners ( Table 4).
Also of interest is the companies' willingness to seek other funding sources and their success in obtaining it. Here there is a significant difference between winners and non-winners. Nearly half of non-winners applied for funding from other sources, and only 25 percent of the winners. Also telling is the success rate of these applications; nearly three-fourths of the winners were successful, but only one-third of the non-winners.
Awards Serve as Quality Signals
This difference in success rates suggests that ATP awards are signals of quality for private investors and other funding sources. To test this suggestion, we asked companies about the sources of funding to which they applied. Some 39 percent of them had applied to venture capital investors, and 26 percent of these investments were contingent on funding from ATP. State and local programs (to which 39 percent of companies had applied) were even more inclined to make funding contingent on ATP grants (43 percent of the cases). About two-thirds of the companies had applied for funds from other sources, but only 19 percent of these applications had been contingent on ATP funding.
Influences On the Firm's Ability to Attract Financing From Non-ATP Sources for its Technologies
Using multiple regression analysis, my colleagues and I sought to identify the qualities that led to success in seeking funding from other sources. We tested four characteristics:
-
firm-specific characteristics, such as the size and age of the entity;
-
linkages to universities and other types of organizations;
-
the technology field; and, most importantly,
|
Extent of Continuing Collaboration with Partners |
Percentage |
|
No longer working with any research partner |
32 |
|
Still collaborating on R&D project proposed to ATP |
40 |
|
Working together on other activities |
28 |
Page 136
-
the extent to which ATP funding itself serves as a certification of quality and commercial value for a technology.
The preliminary results of this analysis confirm the certification effect of the awards and the positive impact of close ties to universities, specifically:
-
ATP funding significantly increases the likelihood of attracting additional external funding—and also increases the amount of that funding; and
-
close ties to other organizations was also significantly associated with the ability to attract additional funding.
Overview of Results
The results of this study suggest that, as intended, ATP promotes new collaboration among awardee firms and partnerships with universities and government research institutions. Awardee companies express greater willingness than non-winners to share research results with other firms; this reinforces the precompetitive nature of the selected projects.
Reflecting the program's goals, our analysis shows that
-
ATP winners have higher quality technologies and stronger business plans with greater potential economic impacts;
-
ATP winners are far more willing to share information on the results of their research;
-
ATP winners take greater risks, starting entirely new R&D inquiries with new partners; and
-
underscoring the importance of the awards and the high-risk nature of the technologies, most non-winners do not pursue the ATP proposed technologies by themselves.
CHEAP GAS? JOINT VENTURES AND FUEL-EFFICIENCY
Mark A. Ehlen
National Institute of Standards and Technology
Dr. Ehlen introduced himself as an engineer and economist in the Office of Applied Economics, part of the NIST Building and Fire Research Laboratory. His office had been commissioned by ATP to perform an economic analysis of the ATP Flow-Control Machining project, a joint venture lead by Extrude Hone, a small manufacturing-process developer in Pennsylvania.
In his presentation, he said he would first outline the structure of the joint venture, discuss the process technologies developed, and then review the results
Page 137
from the economic analysis of the technologies as used in their first application, in the automotive industry.
A University-Industry Joint Venture
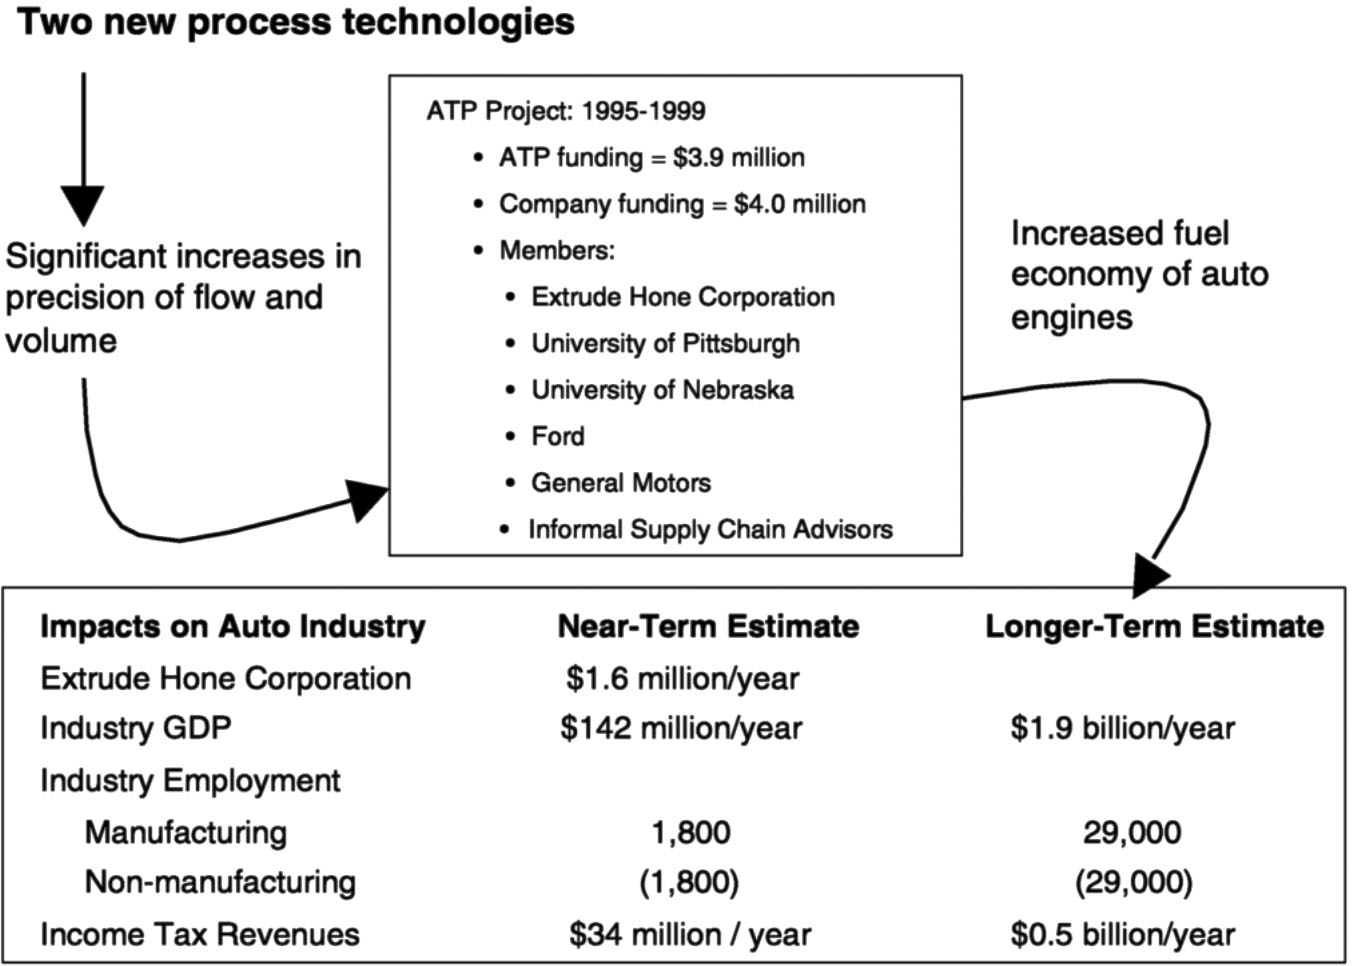
The Flow-Control Machining project is a good example of a vertically integrated joint venture containing the research and business components necessary to both develop a new enabling technology and embody it in a real product, namely a car. The joint venture ran from 1995 to 1999; the analysis began in 1998 and was therefore assessing the potential economic impact of a technology that had yet to be applied.
The joint venture was led by Extrude Hone, a small machine tool company located near Pittsburgh, PA. It built the joint venture by first teaming with the University of Pittsburgh and the University of Nebraska, for technical expertise. It then called on two end-users, the Ford Motor Company and General Motors. Finally, it assembled an informal group of advisors, consisting of experts in materials, casting, and engine design. The joint venture's application to ATP was selected for an award of $3.9 million, matched by $4 million from members of the joint venture.
Technologies
Flow-control machining is a novel approach to machining complex metal parts to shapes that are smoother and perform more precisely. The technology has potentially wide application in the automotive, aerospace, and medical industries. A single application was chosen as a target for the project: the intake manifolds and intake ports of automobile engines. (See Larry Rhoades' presentation below.)
In the air-handling parts of engines, precise flow and volume control can pay great dividends in fuel efficiency and power, for example, by reducing turbulence and imbalances in intake air. The joint venture was to develop automated techniques, using neural-network feedback systems and acoustic emissions detection, for machining metal parts to precise levels of flow and volume, thereby significantly increasing overall performance of a machine such as an automobile engine.
Economic Analysis
The economic assessment began with a careful market analysis of automobile supply and demand, market competition, and the EPA's fuel-efficiency regulations. It was evident from this analysis that the most likely initial application of the flow-control machining technology was among the automakers' largest and lowest fuel-economy vehicles, which yield the manufacturers high profits. Current production of these vehicles is limited by Corporate Average Fuel Economy (CAFE) standards, which mandate minimum levels of fleet fuel economy. Higher
Page 138
fuel efficiency in these models would allow further production of these profitable vehicles while satisfying CAFE, making implementation very attractive to manufacturers.
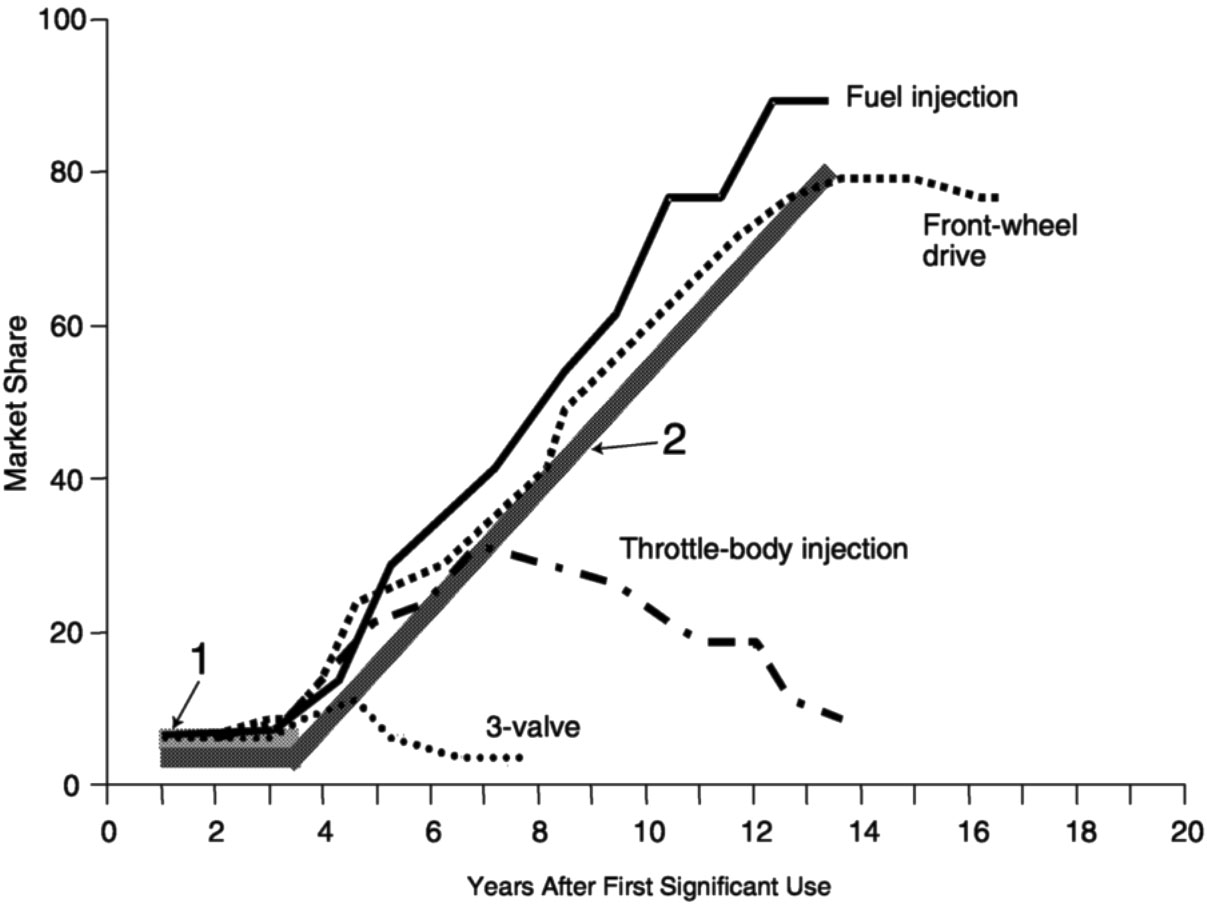
To estimate the extent and the duration of market penetration, we reviewed the history of the penetration of other fuel-efficiency technologies, illustrated in Figure 1. Fuel injection, for example, achieved 80 percent market share over a period of 15 years; front-wheel drive has had a similar history of penetration. The three-valve engine, on the other hand, lasted for only about 7 years, with a maximum penetration of 5 percent, and eventually dwindled in use.
We concluded that there is an initial five-year period during which a fuel-efficiency technology has a high chance of being adopted. After that, adoption is much less certain. We modeled then two scenarios: an initial five-year adoption on the equivalent of a single production line; and a longer-term adoption, like that of front-wheel drive or fuel injection.
In both scenarios we assumed that the new flow-machining technologies would improve automobile fuel efficiency by 6 percent (as estimated by Extrude Hone). In the first (short-term) scenario, the direct benefit to Extrude Hone is about $1.6 million. The benefits to the economy are much greater: gross domestic product (GDP) expands by an estimated $143 million, an additional 3,600 jobs
~ enlarge ~
FIGURE 1 Market penetration of earlier automotive technologies that improve fuel-efficiency
Page 139
Assuming that penetration followed the second (longer-term) trajectory, we estimate that the technologies increase GDP by $1.9 billion, create 58,000 new jobs, and add $0.5 billion in tax revenues. Figure 2 outlines the simulated economic impacts of these two scenarios.
These results were found to be conservative to variations in the following external conditions:
-
increases in CAFE requirements;
-
changes in consumer preference;
-
the existence of competing technologies;
-
the realized fuel efficiency gains; and
-
other broad applications of the two processes.
Interestingly enough, the market penetration does not depend much on rising gasoline prices; of late, car buyers are more concerned about safety and options than about fuel economy.
~ enlarge ~
FIGURE 2 Forecast economic impacts of short- and long-term market penetrations of flow-control machining
Page 140
DESIGN FREEDOMS AND ENHANCED VALUE
Larry Rhoades
Extrude Hone Corporation
Extrude Hone Corporation, said Larry Rhoades, is dedicated to developing and implementing advanced manufacturing processes, including non-traditional machining, finishing, and measurement technologies. We view our mission as efficiently moving research onto the factory floor.
The company has 250 employees worldwide, including 170 at its headquarters in Irwin, Pennsylvania, but we have an eye on world markets, since 55 percent of our sales are made overseas. The scope of our technology encompasses the following areas:
-
abrasive flow machining, finishing, and deburring;
-
electrochemical machining and deburring;
-
surface-edge dimensional measurement;
-
ultrasonic machining and orbital polishing; and
-
solid free-form manufacturing of metal tools and parts.
Each of the processes enhances the performance of a product; it does not simply make it cheaper. Our goal in developing manufacturing processes is to achieve processes that offer greater design freedoms to manufacturers. We serve an extraordinarily broad range of industrial demands, including dies and molds; aerospace engine components; ultra-pure devices for medical, pharmaceutical, food, and semiconductor applications; diesel engine manufacturing; and automotive manufacturing in general.
The automotive manufacturing market represents about one-third of the market for machine tools in this country, but it is a challenging market to those who would introduce process innovations. It is an industry that does not welcome risk.
Consequently, we generally begin by introducing new technology in the aerospace market, which has traditionally been led by military aircraft turbine engines. Their advanced materials are nearly un-machinable, their designs characteristics are nearly non-negotiable, and they are manufactured using very strange processes. For these reasons, that industry tolerates processes that do not quite “work.” It is a nurturing environment, in which a process can be refined and improved and perfected, and eventually—once it is perfect—make the transition to the diesel engine market and then to the broader automotive industry.
Ordinarily the transition from the complex geometries and difficult materials of the aerospace industry to the high-volume production of the automobile industry takes 10 to 20 years—or, in “Dot.com” parlance, 40 to 80 Web years. With our ATP project we made the transition from high-performance, low-volume aerospace to the high-volume production of the automotive industry in one giant leap.
Page 141
This transition, in fact, might not have been possible at all if it had not been for the ATP project, because the automobile industry is normally so difficult to penetrate.
Two ATP Projects
The common theme of all our activities is to widen the design freedoms of manufacturers. The theme is illustrated by the technologies pursued in our two ATP projects:
-
Flow-Control Machining, and
-
3D Printing.
Flow-Control Machining
The technology we developed in our first ATP project involves passing an abrasive putty compound through the internal passages of an ordinary cast and machined part, which enables us to control the shape and smoothness of areas of the part that normally cannot be reached with ordinary machine tools. The project tackled two critical features of internal combustion engines.
-
Smoothing the surfaces of the intake ports, through which the air enters the cylinder head. By lowering turbulence within the flow passage, this makes the engine breathe more easily, and increases both the mass and entry velocity of the air drawn into the combustion chamber, providing a more complete and leaner fuel/air mixture and, consequently, more efficient and cleaner combustion.
-
Second, precisely “sizing” the volume of the combustion chamber cavities on the cylinder heads to provide the optimal compression ratio. This offers about 2-3 percent higher fuel efficiency, as well as higher power.
With these two effects, it would be possible to custom-tune standard engines for particular performance goals and conditions of use (such as climate). Automobile manufacturers would have more flexibility if they could tune each car to its environment.
The initial application was a Ford 2.5 liter engine used in the SVT version of the Ford Contour. We moved from there to the engine that powers the Cobra—the premier Ford label. We also will have a Chrysler product out within six months. The industry's approval of this process, including Ford's participation (and Ford's acceptance of any warranty implications) was a strong signal of the industry's approval. Through the ATP project we were able to prove the technology, scale it up, and insert it into the industry in a single step. The challenge now is to install the process throughout the industry.
Page 142
3D Printing Process forDirect Fabrication of Automotive Tooling
The second project involves a new process of component fabrication from metal powder, which is assembled, layer by layer—almost particle by particle—into complex part configurations, which can be sent and received over the Internet. The technology is based on that of an inkjet printer, and the process, invented at MIT, is akin to rapid prototyping processes. Instead of making prototypes, however, it makes actual functional parts.
In building up the parts in this way, the materials used in different areas of the component can be varied in porosity, density, and other characteristics. We can currently make parts at a speed of a quarter of a liter per hour. With the ATP funded effort, this will be about 20 times that speed. Custom-made parts, formed at distributed locations, opens the possibility of installing a machine in your neighborhood, or even in your basement that could make specific parts as needed for your car appliance or even that mantle clock that's been in the family for six generations. The logistics of distribution can be revolutionized. Materials can be recycled or otherwise controlled at the point of assembly.
For manufactures, the design freedoms offered by this approach include
-
selective porosity;
-
reduced assembly;
-
new materials;
-
electronic information exchange; and
-
intricately complex geometries, which allows designers, for example, to create internal conformal cooling lines in metal tooling to reduce molding cycle times.
In addition, this technique reduces time, cuts waste, and allows more flexible scheduling. This four-year project involves a joint venture headed by Extrude Hone, with General Motors as an unfunded partner and MIT and Cobra Tool as subcontractors.
Moving Beyond the Traditional R&D Strategy
Both these projects permit manufacturers to enhance the value of their products. This reverses the traditional industrial R&D strategy, of translating customers' desires and government regulations into product designs, which are then given to manufacturing engineers to devise appropriate production processes. Markets are moving too fast for that now. These ATP awards are examples of a new model, which involves designing processes and products together, through a process of mutual feedback.
It is important to keep in mind that the entire U.S. machine tool industry, in aggregate, would equal in annual revenues less than the smallest of the Fortune
Page 143
200 companies. Yet these small companies shoulder the responsibility for R&D and innovation that drives a sizable part of the world's economy. Machine tool builders are the source of most process innovation in manufacturing. These innovations have tremendous value to our customers, and to consumers everywhere. Yet, as Mark Ehlen explained earlier, only a tiny percentage of the value created through these innovations is returned to the machine tool companies that developed them. Filling that gap—between the huge spillover benefits of innovation in production processes and the tiny returns to those who make the investments—offers great economic leverage to a program like the ATP.
QUESTIONS FROM THE AUDIENCE
Bernard Gelb of the Congressional Research Service asked Maryann Feldman about her statistical controls in the survey she had reported on. The 50 percent response rate for the companies not selected for ATP grants is quite good, but was there any control for self-selection in comparing responses of winners and non-winners in as much as the firms themselves choose whether to respond?
She answered that there are no obvious signs of bias. For example, no clearly skewed pattern of geographical distribution or technologies addressed appears in the two groups. Furthermore, she suspected, unsuccessful proponents would seem to have particular incentives to criticize the program. (Many, in fact, did take the opportunity to offer critiques). But the researchers have no way to control statistically for such possible bias, so it remains an open question.
Dr. Wessner asked Dr. Feldman to elaborate on criticisms offered by the respondents. She answered that although most participants (73 percent) had found the debriefings helpful, and 29 percent of the non-winners said that they would not consider ever applying again.
One participant recounted an early proposal in NSF to evaluate the SBIR selection process by surveying the winners and comparing their responses to those of the runners-up. It foundered on the unwillingness of agencies' overtaxed selection personnel to identify the runners-up.
Among the private sector applicants there is a similar problem, Dr. Feldman said. Many of the successful applicants failed to respond to her survey because they were too busy working on their technologies.
Bill Long of Performance Research asked Larry Rhoades whether it is typical of his industry to capture only 1 percent of the total value created by a new innovation, as documented by Mark Ehlen's study of the Flow Control Machining project.
“Our ability to harness the value created in a manufacturing process is constrained,” Mr. Rhoades said. Because the typical company is small compared with its major customers, its negotiating leverage is limited. Second, these companies need dozens of specific applications to make a new process pay for itself, and distributing the costs across these many customers is difficult. One way to
Page 144
improve the return, by as much as an order of magnitude, is to provide production services with these new processes as well as equipment. The auto industry, for example, is not good at installing and refining new processes, and small, nimble companies can offer a valued service in that way. On the other hand, he observed, we have both a responsibility and an incentive to pursue widespread application. And to create the greatest possible benefit to the U.S. economy.
Bill Long suggested to Maryann Feldman that they should consider surveying companies that have not applied to ATP. Doing so would strengthen the case for concluding that ATP projects fund technologies that would not be able to attract private capital—that the program does not compete with private funding sources.
We have considered that strongly, Dr. Feldman replied, but we have no way to construct such a sample. We have data on our companies' funding histories before applying to ATP but not on companies that have never applied. In this connection, Dr. Wessner suggested that David Morgenthaler's observations be taken into account. As a past president of the National Venture Capital Association and a leading figure in that industry, his view that there is little, if any, overlap should be kept in mind.
Lewis Branscomb suggested that Dr. Feldman's team approach venture capital firms for information on firms that they fund. The funding histories of those companies might be compared with reference to their ATP participation and other relevant factors.
Yes, said Dr. Feldman, but such a retrospective study—relying as it must on people's recollections—would introduce its own biases. Still, some statistical approach to the non-participating companies would be valuable.


