
3
Current Methods for Estimating Eligibility and Full-Funding Participation
Each year the Food and Nutrition Service (FNS) develops estimates of the numbers of people in the nation who are eligible for WIC and who would participate in the program if it is fully funded. These estimates are used to develop the annual budget request for the program and to estimate coverage rates—the ratio of participants to number of people estimated to be eligible. With bipartisan support of the goal to serve all who are eligible and who want to participate in WIC, the accuracy of these estimates is crucial to informing budgetary decisions.1 In this chapter, we briefly describe the methods used to make the estimates. An FNS publication (U.S. Department of Agriculture, 1999a) provides greater detail on currently used methods.
ESTIMATES OF THE NUMBER OF FULLY ELIGIBLE PERSONS
Estimates of the number of persons eligible for the WIC program are produced separately for each category of eligibility. Estimates of the number of infants who are eligible are especially important in the process because the number of income eligible pregnant and postpartum women is derived from the estimated number of income eligible infants. Thus, estimates of income eligible infants and children are referred to as the “core” estimates.
Income Eligibility Estimation Methods
The March Demographic Supplement of the Current Population Survey (CPS) is used to estimate the number of infants and children living in families with annual incomes below 185 percent of poverty, defined by the U.S. Department of Health and Human Services poverty guidelines according to their family size.2 Available eligibility estimates lag behind the budget process considerably. Calendar year 1999 estimates, based on the 2000 CPS, are the most recent available for the first stages of the FY 2003 budget process. Over the course of the budget approval process, the 2001 CPS data may become available (covering calendar year 2000) and may be used in the estimations for the 2003 budget. Thus, the estimates of numbers of participants will always be a few years behind.
In assessing family income in the eligibility determination process, states can adopt either the income guidelines for the Free and Reduced Price School Lunch Program or the income guidelines for free or reduced price health care programs. In general, the following income sources are counted under both guidelines: earnings, unemployment compensation, workers’ compensation, Social Security, Supplemental Security Income, public assistance, veterans’ payments, survivor benefits, disability benefits, pensions or retirement income, interest, dividends, rents, royalties and estates and trusts, education assistance, alimony, child support, financial aid from outside the household, and other income. If the free and reduced price health care definition is used, the following sources of income are excluded for determining eligibility: the value of in-kind housing and other in-kind benefits and payments or benefits provided under certain federal programs (e.g., some of the smaller social programs such the Low Income Home Energy Assistance Program, the value of benefits from the Free and Reduced Price School Lunch Program, and payments to members of various Indian tribes) (see Food and Nutrition Service Instruction 803–3, 1988). For the purposes of estimating eligibility, current FNS methods use annual census money income to define income.3 Family is defined using the Census Bureau’s family definition—that is, a group of two people or
more related by birth, marriage, or adoption and residing together, including related subfamily members. Estimation issues surrounding these definitions are discussed later in the report.
The number of income eligible pregnant women is estimated based on the estimated number of income eligible infants. The estimated number of infants is multiplied by 0.75 to account for the pregnancy lasting for 9 months of a year. The number of births is assumed to be constant over the time period between when the estimates of infants are made and the 9 months prior to the birth of the infant.
The numbers of breastfeeding and nonbreastfeeding postpartum women are also estimated based on the core estimates of income eligible infants. To obtain estimates of both of these groups, the estimates of income eligible infants is first adjusted downward slightly to account for multiple births and infant deaths. (The number of income eligible infants is multiplied by 0.9844.)4 The methodology then adjusts for the percentage of women who breastfeed and the duration of breastfeeding. These adjustment factors, based on data from the 1988 National Maternal and Infant Health Survey (NMIHS), are used in combination with life table methods to estimate the duration of breastfeeding among women, adjusting for age and income. The adjustment rate used to obtain the number of women who do not breastfeed and are less than 6 months postpartum is 0.374 (or 37.4 percent) and 0.171 (or 17.1 percent) for the number who breastfeed and are less than 12 months postpartum.
Adjunctive Eligibility Estimation Methods
In estimating income eligibility for each of the categories, only a modest adjustment is made for infants and children who may be eligible for WIC because they are adjunctively eligible through participation in the Medicaid, Food Stamp, or Temporary Assistance for Needy Families
(TANF) programs, and no adjustment is made for pregnant and postpartum women who may be adjunctively eligible.5 However, it is possible that many people are eligible for these programs who would not otherwise be eligible for WIC because of differences in eligibility rules (as we discuss later in Chapter 4).
Methods for Estimating Full Eligibility
Once the estimates of income eligible people for each eligibility category are made, adjustments for the percentage of people who are at nutritional risk are made for each category to obtain the number of fully eligible people. The adjustment factors are based on estimates of the percentage of income eligible people who are at nutritional risk from the WIC Evaluation Study I (U.S. Department of Agriculture, 1987).
ESTIMATION OF FULL-FUNDING PARTICIPATION
Once the estimates of the number of fully eligible people are made, the numbers are adjusted downward to account for the fact that some who are eligible do not participate. Past practice in making this adjustment has been to assume that participation rates for WIC would mirror participation rates for the Food Stamp Program for children age 0 to 4 years. Until recently, participation rates for these programs from the late 1980s were used as a guideline for adjusting the eligibility estimates, meaning that roughly 80 percent of eligible people were estimated to participate. This adjustment was criticized for being out of date and lower than what actual participation rates for the Food Stamp Program were during that period (Greenstein et al., 1997). Beginning with the 1995 estimates and the FY 1998 budget report, the U.S. Department of Agriculture (USDA) has not
used the 80 percent participation assumption, but rather, has made budget requests with a goal of serving 7.5 million participants. This practice has been criticized as being arbitrary and not supported by data (U.S. House of Representatives, 1998).
COVERAGE RATES AND PREDICTION ERROR
Coverage rates are used as a tool for evaluating the program’s performance and assessing how reasonable the budget requests were ex post. Coverage rates are defined as the ratio of the monthly average number of participants receiving WIC over a calendar year to the average monthly number of individuals estimated to be fully eligible for WIC over the calendar year. The average monthly number of participants comes from administrative records. The denominator is the eligibility estimates derived from the March CPS that covers the calendar year in question. The FNS has provided the panel with their estimates of coverage rates by eligibility category from 1993 to 1999. The corresponding coverage rates for the four types of participants are presented in Table 3–1.
TABLE 3–1 Coverage Rates of Infants, Postpartum and Pregnant Women, and Young Children
|
Year |
Infants |
Postpartum Women |
Pregnant Women |
Children |
|
1993 |
97.8 |
78.9 |
52.3 |
48.0 |
|
1994 |
111.0 |
101.2 |
59.0 |
56.9 |
|
1995 |
109.4 |
105.3 |
58.0 |
64.4 |
|
1996 |
113.8 |
117.2 |
62.0 |
69.5 |
|
1997 |
121.7 |
121.7 |
69.1 |
74.5 |
|
1998a |
127.7 |
127.4 |
72.9 |
74.4 |
|
1999a |
130.4 |
130.1 |
72.4 |
76.0 |
|
NOTE: Coverage rates are defined as the average monthly number of WIC participants (from administrative data) divided by the estimated number of eligible people (from the CPS) for each category for a given year. aThe coverage rate estimates for 1998 and 1999 are unofficial USDA estimates provided to the panel to show what the estimates would be using the existing methodology for those two years. |
||||
The table shows that for all eligibility categories, coverage rates have been generally increasing over the 1990s. Pregnant women and children have had the lowest coverage rates, which were both about 50 percent in 1993 and increased to 72 percent for pregnant women and 76 percent for children in 1999. Coverage rates for infants over the entire period have been very high. In 1993, coverage rates were almost 100 percent (98.3) and more recently in 1999 they were well over this mark at 130 percent. The most dramatic increases in coverage rates between 1993 and 1999 were for postpartum women, whose coverage rates have increased almost 65 percent, and for children whose coverage rates increased almost 60 percent. Coverage rates from postpartum women jumped considerably between 1993 and 1994 (from 78.4 to 101.2 percent) and have steadily increased since then.
Coverage rates for postpartum women and infants that are now well over 100 percent raise concerns. The Survey and Investigations Staff of the House Appropriation Committee writes, “The discrepancy between USDA eligible estimates and actual enrollment figures raises the question of whether the estimates are flawed or whether ineligible persons are participating in the program” (U.S. House of Representatives, 1998:i).6 It is the panel’s charge to focus on the former question—that is, whether the estimates of eligibility (and full-funding participation numbers based on these eligibility estimates) are flawed and can be improved.
The accuracy of the estimates of eligibility and participation have real implications for WIC program funding and for alternative uses of funding. On one hand, underestimating eligibility and participation may result in waiting lists of people who are eligible and want to participate but may not be given benefits. On the other hand, if estimates are too high, then funds for other programs or spending priorities could possibly have been greater.
An element of uncertainty is inherent to the process of forecasting budgetary needs for the upcoming year. A lag between the time the data
are collected and made available for use and the time period for which the predictions are being made will always exist, although one hopes that it is small. Economic, policy, demographic, and cultural conditions could change in such a way that the numbers of persons who are eligible and likely to participate change. Program outreach efforts could be successful in bringing greater percentages of eligible people into a WIC office to apply for benefits.
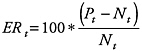
As a tool to evaluate how good the predictions of participation have been each year, we define a prediction error rate and estimate it for recent years. This error rate measures how well the estimated number of people eligible and likely to participate in a year compared with actual counts of participants from administrative data for that year. If Nt is the average monthly number of participants in year t (from administrative data) and Pt is the predicted number of participants for the same year (based on the estimates of the number of eligible people), then the prediction error rate for year t (ERt) will be
To estimate the number of fully eligible participants, we multiplied the estimated number of fully eligible people for each category by 0.80, following FNS methods of assuming an 80 percent participation rate. This methodology did not account for differential participation rates by eligibility category. Since 1997 the FNS has not used this method to arrive at the number of likely participants for developing budget requests but has instead budgeted with a goal of serving 7.5 million participants. To calculate prediction error rates for a given year, the estimated number of participants for a given year are matched to the actual number of participants for that year. For example, the fiscal year 2000 estimates used 1997 CPS data. These data were matched with 1997 counts of actual participants to calculate the prediction error for 1997.
We note the difference and relationship between the coverage rates and prediction error rates. The coverage rates are measures of the percentage of the eligible population covered (or served) by the program. Prediction error rates are a measure of how close the estimated number of participants is to the actual number of participants. These two measures correlate in that both are computed using eligibility estimates. For example, high prediction error rates may reflect an understatement of eligibility because the
estimated number of participants is based on the estimated number of eligibles. Since the estimated number of eligibles is the denominator for the coverage rate, high prediction error rates could be reflected in high coverage rates if the number of estimated eligibles is underestimated. However, these two may not be related. For example, if the assumption about the rate for which eligible people participate is incorrect, high prediction error rates will result, but they may not be reflected in the coverage rate estimates because the eligibility estimates are correct.
Table 3–2 presents the panel’s calculation of prediction errors overall and by eligibility category for recent years. Examining the prediction error rates for the total number of participants, we see that the FNS estimates are very close to the actual number of people who participated. Using 3-year-old CPS data, the total prediction error rates range in absolute value from 10.7 percent in 1996 to an almost zero error rate of 0.2 percent in 1998. The accuracy of these numbers is not due, however, to good predictions of the number of participants for each eligibility category. The total prediction errors are achieved by overestimating the number of participating pregnant women and children and underestimating the number of participating infants and postpartum women. In years prior to 1998, the FNS
TABLE 3–2 Prediction Error Rate (in percent) by Year and Eligibility Category
methodology overstated the total number of participants because errors in predicting the number of pregnant women and children were larger in absolute value than the errors in predicting postpartum women and infants. For example, in 1996, the number of children predicted to participate was overestimated by 28.6 percent and the number of pregnant women predicted to participate was overestimated by 44.5 percent. This is in comparison to an underestimation of 21.6 percent for infants and 23.1 percent of postpartum women. In recent years, prediction error rates for pregnant women and children have fallen in magnitude, while error rates for postpartum women and infants have risen. For example, in 1999, the numbers of children and pregnant women participants were overestimated by 19.6 and 21.3 percent, respectively, but the numbers of infants and postpartum women were underestimated by 31.8 and 32.9 percent, respectively, that year.
The figures shown in Tables 3–1 and 3–2 exemplify the wide variation in coverage rates and prediction error rates by category of eligibility. In general, coverage rates have been increasing over recent years. However, prediction error rates have been decreasing (in absolute value) for pregnant women and children but increasing for infants and postpartum women.


