
REDUCING SEDIMENTATION RATES IN HARBOR FACILITIES
Ray B.Krone
Department of Civil Engineering
University of California, Davis
Unbearably high sedimentation rates are experienced in old harbors, where water depths have been increased over the years to accommodate deeper-draft ships, and in recently developed harbors where the possibility of high sedimentation rates was not considered in the harbor design. In these unfortunate circumstances, large investments in physical facilities have already been made and the operator is often faced not only with the onerous costs of maintenance dredging, but also with increasingly costly sediment disposal options. The pressing need to reduce sedimentation rates in such facilities, combined with high costs of significantly modifying an existing installation to effect reductions, pose difficult challenges to harbor engineers.
There are two basic strategies for reducing sedimentation rates in harbors: keep the sediment from entering harbor facilities, or keep it moving through the facilities. Implementing these strategies usually requires knowledge of sediment transport processes, sources, physical character, and hydraulic conditions during periods when sedimentation occurs. This information is required in sufficient detail to assess the effectiveness of a proposed remedy.
This symposium is concerned with fine sediments that accumulate in tidal waters. A brief description of the relevant transport processes of these sediments is presented so that methods of implementing the strategies can then be explained. A few examples of installations of remedial works are presented to illustrate the approaches. Every problem should be regarded as unique, however, and each solution will depend on application of the principles presented—there are few “handbook” solutions to sedimentation problems.
COHESIVE SEDIMENT TRANSPORT
Fine sediments are soil materials that have eroded from land, usually from the local drainage, and are carried by runoff waters to the estuary. The particles are transported in suspension in runoff waters, usually as dispersed particles of clay and silt and possibly organic matter. When such particles enter an estuary and the seawater
salinity rises to from 1–3 g/liter (Ariathuari, 1974; Krone, 1962), the suspended particles become cohesive: they can stick to one another if they are caused to collide in a modestly stressful environment. Most of the water volume of typical estuaries have salinities greater than a few grams per liter. These fine particles can be regarded as cohesive throughout most of an estuary.
Collisions of suspended particles result from thermal motions of water molecules that jiggle small suspended particles continuously, differences in settling velocities of suspended particles, and velocity gradients. Collisions of suspended particles that are slightly displaced from one another in velocity gradients are by far the most prevalent in estuaries. Collisions due to thermal motions and differential settling velocities create loose, weak aggregates that are easily dispersed in velocity gradients. Velocity gradient aggregation, however, produces denser, stronger aggregates that will resist at least the velocity gradient under which they were formed.
The frequency of collisions on each suspended particle by any of the three mechanisms increases with the number of particles per unit volume, so concentration is important in determining the rate of aggregation. The frequency of collisions increases in proportion to the velocity gradient; however, as the increasing gradient begins to impose stresses on the aggregate that exceed the strength of the bond between the colliding particles, fewer collisions result in aggregation. At higher gradients aggregates are broken apart. Aggregates may be dispersed and form new aggregates repeatedly as the suspended particles experience changing velocity gradients in an estuary.
Aggregates of suspended particles often contain millions of individual clay and silt particles. If such aggregates are dense, their settling velocities are orders of magnitude greater than their individual particles. The settling velocity depends on the history of the aggregate. Fortunately, the history of the immediate past is most important, and under some conditions the settling velocity can be estimated from the suspended solids concentration (Krone, 1962 and 1984).
Aggregates that fall to the bed of a channel, basin, or berth and stick there either remain and contribute to continuing accumulation or are torn loose by subsequent hydraulic shear stress. There is no bed load. These cohesive particles are either stuck to the bed or are suspended. The strength of aggregate adhesion to a bed depends primarily on the mineral composition of the aggregates and the structural arrangements of particles in the aggregates.
Whether a settling aggregate sticks to the bed or remains suspended depends on the hydraulic bed shear stress. If the shear stress is greater than a critical stress, only a fraction of the suspended material will deposit. If the bed shear stress is less than the critical shear stress, the rate of deposition of aggregates is given by,
(1)
where h is the depth of the vertically mixed suspension, C is the suspended solids concentration, Ws is the settling velocity of the aggregates, τ is the bed shear stress, and τcr, which can be estimated from the cation exchange capacity of the sediment, is the critical stress for deposition. The expression in parentheses is the probability that the aggregate will stick. The product WsC, the flux of particles settling to the bed, becomes a function of time when aggregation is rapid, and the relation becomes more complicated. The important points, however, are the flux of sediment to the bed depends on the concentration of suspended sediment and the settling velocity of the aggregates, and that the probability of sticking to the bed depends on the bed shear stress.
At concentrations above about 10 g/liter, the settling velocity of aggregates is hindered by the interference the particles cause to the escape of the water that they are displacing. A sharp interface develops at the top of the settling particles as particles in such suspensions settle in quiet water, producing the “fluid mud” that is often seen on fathometer traces as a ghost bottom above the more pronounced bottom trace. Fluid muds appear at slack water. The depositing aggregates at the bottom of the fluid mud layer are crushed as overburden accumulates, making the lower portion of the deposit stronger than the aggregates from which it was formed and more able to resist resuspension by subsequent strengths of flow (Krone, 1972).
The higher density of a fluid mud suspension inhibits upward mixing during subsequent stronger flows, and high concentrations of suspended solids near the bed may persist for some time. The higher densities of near-bed waters in a mixing zone of an estuary due to salinity can further inhibit upward mixing. High concentrations of suspended sediment are often found near the bed in mixing zones.
Erosion of a sediment bed occurs when the applied bed stress exceeds the bonds of individual particles and tears them off one by one as “surface erosion” (Arulanandan et al., 1975). When still higher stresses exceed the bulk shear strength of the sediment to some depth, the sediment is almost instantly suspended to that depth. This process is called “bulk erosion” (Krone, 1962; Parchure, 1975) and is the most important mechanism in estuaries. Typically, a thin deposit formed at times near slack water can be resuspended when the bed stress increases during the strength of flow.
It is already apparent that three factors that strongly affect net deposition rates in estuaries are suspended sediment concentration, velocity gradients, and bed shear stress. Implementing the strategies for reducing sedimentation in harbors consists of modifying one or more of these basic factors.
KEEPING SUSPENDED SEDIMENT OUT OF FACILITIES
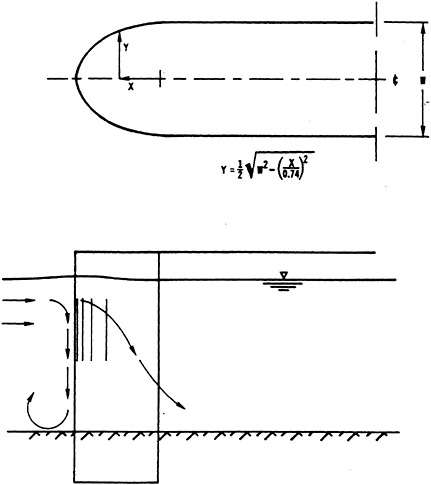
The most common implementation of this strategy consists of a wall, such as a harbor enclosure, with an entrance that admits water having the lowest concentration of suspended solids. For example, harbors
located in shallow mud flat areas, where a turning or mooring basin is dredged to provide the harbor, often fill rapidly with sediment that is suspended on the mud flats by wind-generated waves. A tight enclosure around the basin, with a single opening in deeper water, can be used to reduce the inflow of waters laden with high concentrations of sediment. The important considerations in designing such enclosures are that the wall be tight, that the waters entering with rising tides have the lowest available suspended sediment concentration, and that the circulation of waters entering through the entrance be minimized. There should be only one entrance, and a baffle at the entrance is sometimes required to minimize circulation inside of the enclosure.
Walls are also used where a channel enters a bay and crosses shallow areas to deeper water to reduce the flow of sediment-laden waters across or into the channel. Here again, the effectiveness of a wall depends on the wall being tight and extending sufficiently to admit waters having reduced suspended sediment concentrations.
The importance of making the wall tight for sediment control can not be overemphasized: even a relatively small slot can allow the passage of large amounts of water containing high concentrations of suspended sediment into an enclosure. The quiet waters in the basin promote deposition from such flows. Two common ways that these circumstances develop are failure by a designer or a construction contractor to understand the need for a tight enclosure, and erosion of mud from the base of a wall by wave action or currents.
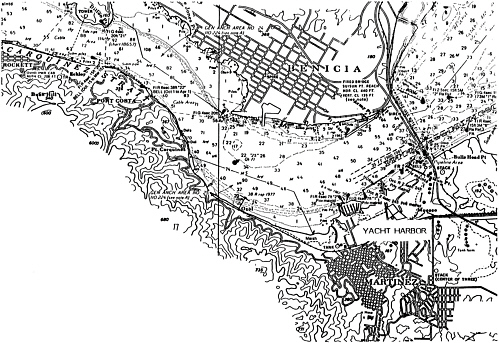
An example was provided by the small-craft harbor enclosure at Benicia, California. The location is on Carquinez Strait in the upper San Francisco Bay system. The major drainage to the system is located upstream, and San Pablo Bay is located immediately downstream. Large amounts of suspended sediment are discharged through Carquinez Strait during winter months. Much of this discharge is deposited in San Pablo Bay, resuspending the deposited material and supplying it to the tidal circulation of the waters passing through Carquinez Strait. Large amounts of suspended sediment pass through Carquinez Strait during winter, spring, and summer months.
A map showing the region of the harbor (Figure 1) shows shallow areas on either side of the strait. The small-craft harbor is located at the bottom. The harbor was created by dredging a basin in the mud next to an unused ferry pier, and a breakwater was constructed across the outer channel side of the basin by driving peeled log piles in two staggered rows as close together as possible. This construction was permeable to tidal flows. The unused ferry pier had spaced vertical timbers between the piles to break waves, but there was no other obstruction for waters flowing from the adjacent mud flat across the dredged basin and out through the permeable breakwater. The contractor observed a very rapid rate of sedimentation during construction and left the job without completing it. The basin filled 8 ft in less than two years. Sealing the walls (aluminum sheet was most economical) and installing a baffle in the entrance to prevent internal circulation reduced the deposition rate to less than 6 in. per year.
Walls are useful where waters containing high concentrations of suspended sediment can be excluded from a facility. An open entrance is feasible in tidal waters when it can be placed so that waters having low concentrations of suspended sediment are admitted. Otherwise a lock is required. At present one such lock in the San Francisco Bay system has been operating since 1966, another will be built when funds become available, and a third is planned.
Walls are typically pile-supported timber walls, sheet pile walls, or rock dikes. Walls are expensive to build and maintain, especially for large harbors. In many installations walls serve also as breakwaters, which aids in their justification, however.
KEEPING SEDIMENT MOVING THROUGH FACILITIES
This strategy consists of minimizing the rate of deposition and maximizing the erosion in the channel, basin, or berth by reducing local velocity gradients, where possible, and maximizing bed shear at the strength of flow. A remedial measure often does both simultaneously.
As described above, aggregation of suspended sediment is promoted by the presence of velocity gradients. Sediment-laden waters that pass through piling are subject to vortex formation in the lee of every pile. These vortices extend from the bed to the water surface, so that the entire flow through the piles is subjected to increased velocity gradients. Suspended aggregates coalesce in these down-current vortices and the suspended sediment particles have increased settling velocities. The flux of sediment to the bed down current from the piling is greatly enhanced.
At the same time the vortices dissipate energy, reducing the velocities and the bed shear stress in the region in the lee of the piling so that a greater portion of the settling aggregates stick to the bed. Estuaries the world over have old pile-supported wharves placed at an angle to the current, and deposition nearby is rapid. Most modern harbors have marginal wharves or quays.
The deleterious effect of piles on sedimentation rates can be minimized by aligning rows of piles in the direction of the prevailing currents, and by minimizing the number of piles supporting the structure.
A similar situation results from steep banks of turning basins and channels that are cut across the prevailing current. Flows from the shallower waters over the bank and into the deepened cut develop large eddies, with nearly horizontal axes, in the deepened basin or channel. As in the case with piles, the eddies promote aggregation and dissipate the strength of near-bed flows, both of which promote rapid deposition in the cut. The slope of the upstream and downstream banks can be reduced to 1 vertical on 10 horizontal or flatter to prevent the formation of eddies. Such flat slopes are easily formed by dredging steps with 2 ft risers and 20 to 40 ft treads. Sedimentation will fill the bank side of the treads to form a smooth slope.
The Richmond Long wharf provides an example where altering the slope of the turning basin reduced sedimentation rates. Patterns of deposition near the banks of the basin are shown in Figure 2. Rapid sedimentation occurred in the approach basin near the south bank and at the berths along the south end of the wharf. Current measurements showed that flood flows across the shallow areas south and east of the facility entered the basin across the south bank and through the piling of the wharf. Revised bank slopes that were recommended after physical model studies are shown in Figure 3. Modification of the banks virtually eliminated deposition in the approach basin. Deposition continues at the berths, however, where sediment-laden flows from the shallow areas pass through the wharf piling.
Similar deposition occurs in channels that have steep banks and are aligned at an angle to the prevailing currents. Alignment of channels with the prevailing currents as much as possible or providing flat channel slopes, especially where potentially eroding currents can remove newly deposited sediment, also minimizes such deposition.
Marginal wharves, particularly wide platforms supported on piles, have a unique problem. In estuaries where there are large amounts of suspended sediment in motion, sediment accumulates among the piles and creates a mound under the platform. The piles and the mound obstruct the flow of water through the piling and present a blunt upstream end of the wharf to the current. The blunt end deflects the current away from the face of the wharf, and sediment accumulates along the face.
An illustration of this phenomenon is provided by the Union Oil Company wharf at Oleum, California. This wharf is located in eastern San Pablo Bay at the west end of Carquinez Strait, as shown in Figure 4. Strong ebb currents flow from the strait past this wharf. Nevertheless, shoaling is a problem at the face of the wharf and along the landward side.
A hydrographic survey of the bed near the wharf is presented in Figure 5. Regions of scour flaring away from the faces of the wharf show the deflection of the stronger currents by the blunt upstream end of the wharf, while the area near the face of the wharf is shallower. Obviously, the currents are strong enough to remove any deposition that might occur during times of slack currents; sediment accumulates because these currents are deflected away from the face of the wharf.
Scouring observed around bridge piers suggested a remedy. Such scour occurs because the upstream end of bridge piers obstruct the current, creating an elevation of the water surface near the stagnation point where the kinetic energy of the flow is converted to potential energy. This local potential energy creates a downward current at the upstream pier end, and the higher velocity waters on either side of the stagnation point are deflected downward and along the sides of the pier. The requirements appear to be a blunt upstream end gradually curving toward the side of the pier. A small-scale hydraulic model study showed that a vertical wall (Figure 6) provides optimum currents along the face of a wharf (Lee, 1972). With this wall in place, currents in the model immediately adjacent to the face of the wharf were twice those that occurred with the blunt end, increasing the bed shear stress by a factor of four.

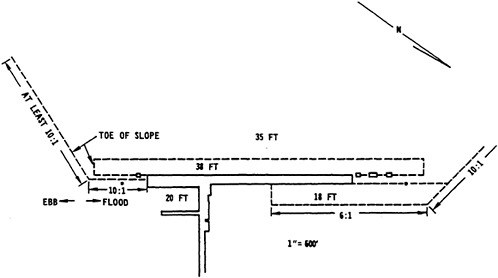
FIGURE 3 Recommended slopes for banks of dredged cuts.
Union Oil Company opted to continue dredging, rather than install the end, and I have not had an opportunity to install such an end on a marginal wharf. It has been used with success on three marina enclosures, however, to maintain water depths along the channel face of the enclosure and across the marina entrance. It has the added advantage of reducing surface currents at the entrance and creating a smooth transition from the higher velocity currents outside of the enclosure to the quiet waters within. An example is presented in Figure 7.
These harbors have demonstrated the value of the transition, but one taught a costly lesson. The wall was undercut along its face by the strong near-bed currents, allowing waters having high suspended solids into the enclosure. The wall must penetrate sufficiently far into the bed so that scour along the wall does not undercut it. Alternatively, the bed along the wall at the upstream end can be armored. Additional research is needed to define the distribution of bed shear stress near such appurtenances.
CONCLUSIONS
These examples illustrate methods of implementing sedimentation control strategies. They are based on fundamental aspects of cohesive sediment transport processes: the control of suspended sediment concentration, aggregate settling velocities, and bed shear stress. Application of these methods to a particular problem requires detailed characterization of the site. Current measurements, hydrographic surveys, measurements of sediment properties, and sometimes numerical
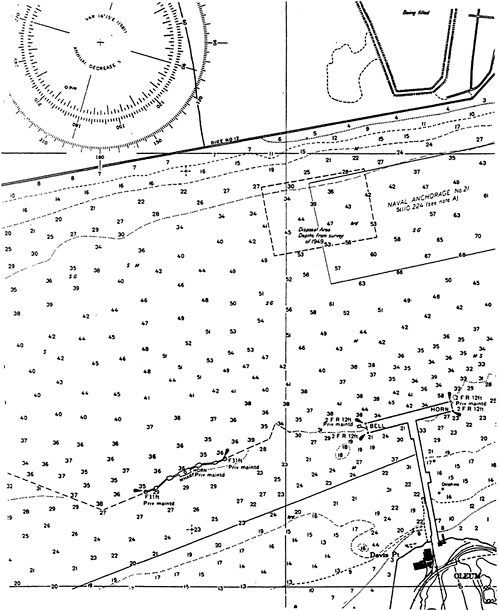
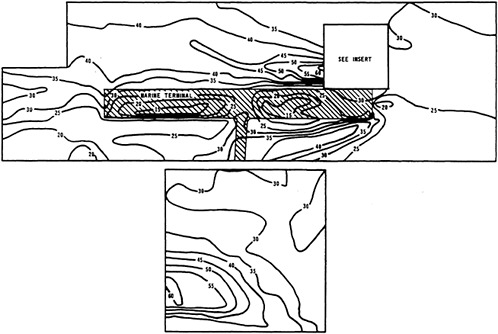
FIGURE 5 Erosion patterns at the Oleum Terminal.
or physical model studies, are required in nearly every application for estimating the benefits of a harbor modification and for the design of successful remedies.
These remarks should not be construed to mean that there are always feasible remedies. We all know of examples that indicate the only way to significantly reduce maintenance dredging costs is to relocate the facility. Perhaps the most important conclusion is that new facilities should be designed at the outset to minimize accumulation of sediment.
REFERENCES
Ariathuari, C.R. 1974. A finite element model for sediment transport in estuaries. Ph.D. Thesis. University of California, Davis.
Arulanandan, K., P.Loganathan, and R.B.Krone. 1975. Pore and eroding fluid influences on surface erosion of soil. J. Geotech. Engr. Div. ASCE Proc. Paper 11078. 101(GT1):51–66.
Krone, R.B. 1962. Flume studies of the transport of sediment in estuarial shoaling processes. Hydr. Engr. Lab. and Sanitary Engr. Lab., University of California, Berkeley.
Krone, R.B. 1972. A field study of flocculation as a factor in estuarial shoaling processes. Tech. Bull. 19, Committee on Tidal Hydraulics, U.S. Army Corps of Engineers. Pp. 1–113; Appendix 1–263.
Krone, R.B. 1984. The significance of aggregate properties to transport processes. Pp. 66–84 in Estuarine Cohesive Sediment Dynamics, A.J.Mehta, ed. New York: Springer-Verlag.
Lee, D.C. 1972. Wharf pier configuration for the reduction of sedimentation. M.S. Thesis, University of California, Davis.
Mehta, A.J., T.M.Parchure, J.G.Dixit, and C.R.Ariathurai. 1982. Resuspension potential of deposited cohesive sediment beds. Pp. 591–609 in Estuarine Comparisons, V.S.Kennedy, ed. New York: Academic Press.
Parchure, T.M. 1975. Erosional behavior of deposited cohesive sediments. Ph.D. Dissertation, University of Florida.
CONTROLLING SEDIMENTATION IN HARBOR BERTHING AREAS USING SCOUR JET ARRAY SYSTEMS
James A.Bailard
Naval Civil Engineering Laboratory
Removal of unwanted sedimentation from harbor berthing areas has become increasingly costly for the U.S. Navy. Two trends have contributed to this cost increase: increasing ship drafts have led to deeper project depths with an attendant increase in sedimentation rates, and new environmental restrictions have reduced the availability of economical dredged material disposal sites. The resulting rise in dredge related costs has made conventional dredging less attractive in harbors with high rates of sedimentation.
Over the past ten years, the Naval Facilities Engineering Command and the Office of Naval Research have funded research and development of alternative methods for controlling unwanted sedimentation in estuarine harbors. Scripps Institution of Oceanography has played an important role in identifying and validating new sedimentation control concepts. The Naval Civil Engineering Laboratory is currently involved in the engineering development of several more promising concepts.
The Navy’s R&D program has produced four methods for reducing sedimentation in estuarine harbors: the scour jet array, the barrier curtain, the vortex foil array, and dynamic flushing. These methods are based on resuspension of newly deposited flocculated clay sediments, or exclusion of sediment influx to an area.
The scour jet array concept uses the resuspension principle and has been particularly effective in controlling sedimentation in berthing areas with high rates of sedimentation. A scour jet array consists of a series of horizontal, near-bottom water jets that are activated with each ebbing tide. The scouring action of the jet discharge acts to resuspend newly deposited sediment forming a tear drop-shaped pattern in front of the jet. Ebbing tidal currents carry the resuspended sediment away from the berth, dispersing it throughout the estuary. Scour jet arrays can be of two types: a spatial array with jets distributed across the bottom of a berthing area, and a linear array with jets distributed along one side of a berthing area. This paper provides an overview of the development of the scour jet array concept, including discussions of cohesive sedimentation processes, scour jet dynamics, and system siting criteria.
COHESIVE SEDIMENTATION AND SCOUR JET DYNAMICS
Estuarine sedimentation commonly consists of flocculated clay particles. These particles are transported to the estuary by rivers in a largely dispersed state. Upon contacting saline estuarine water, the particles undergo flocculation forming larger diameter aggregates. The resulting increase in settling velocity acts to concentrate the sediment near the bottom, often forming a layer of fluid mud. This fluid mud is moved about by tidal currents, eventually settling in areas of quiet water (e.g., a berthing area). There, it undergoes consolidation, increasing in density and resistance to scour.
Field studies have shown that the rate of sedimentation in a harbor is highly variable. Spatial variations are caused by differences in the tidal circulation within a harbor and by the presence of structures, which obstruct the flow. Temporal variations are caused by seasonal and short-term variations in suspended sediment concentration and discrete water properties. In general, the highest rates of sedimentation occur in berthing areas and other areas of quiet water.
Consolidation of a newly settled fluid mud occurs very rapidly. Initially the layer is very mobile, having a density of about 10 g/liter and exhibiting a threshold stress of a few (1–5) dynes/cm2. If left undisturbed, the layer will rapidly consolidate, achieving a density of 300–400 g/liter in a few weeks time. At this density, the mud is no longer mobile, requiring substantially higher stresses to erode. Because the consolidation process occurs so rapidly, a scour jet array system is most effective when operated during each tidal cycle.
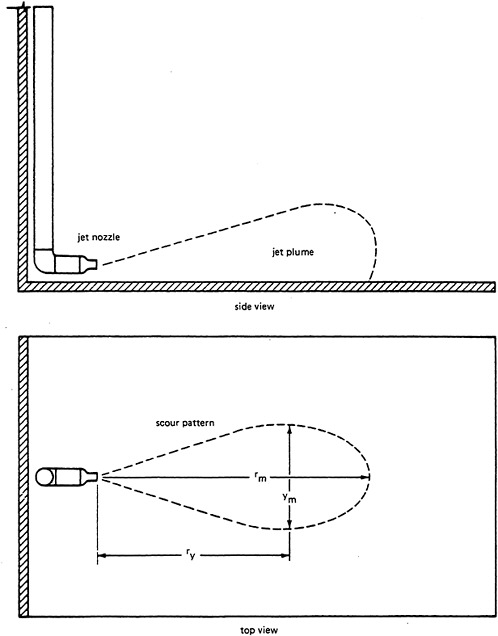
The scour jet array concept was first conceived by Van Dorn et al. (1977). Subsequent laboratory tests (Jenkins et al., 1981) showed that the maximum scour distance rm associated with a horizontal, near-bottom jet can be described as
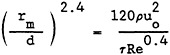
(1)
where τ=the sediment threshold stress, uo=the jet discharge velocity, d=the jet diameter, ρ=the fluid density, and Re=the Reynolds number of the jet. The scour pattern for a horizontal, near-bottom jet is teardrop in shape with a width approximately one-third its length (Figure 1). Changing the orientation of the jet alters the shape of the scour pattern. For example, elevating the jet and handling it downward will cause the scour pattern to become more rounded in shape (Bailard and Camperman, 1983). Elevating the jet alone narrows the scour pattern and displaces it away from the jet nozzle.
Tidal currents can have a significant effect on the scouring characteristics of a jet. Laboratory tests at the Naval Civil Engineering Laboratory have shown that a cross current decreases the range of a scour jet, while a following current increases its range.
Counter currents have the most pronounced effect, significantly reducing the range of a scour jet. The effects of both jet orientation and tidal currents must be carefully considered in designing a scour jet array system.
DEVELOPMENT HISTORY
MINSY Spatial Jet Array
The scour jet array concept has undergone a gradual evolution as a result of a series of field tests conducted at Mare Island Naval Shipyard (MINSY), Vallejo, California. The first scour jet array system to be tested was a spatial jet configuration (Van Dorn et al., 1978). This system was tested in one of six cul-de-sac berths located along the western bank of Mare island Strait (Figure 2). The spatial array consisted of 70, 2-cm diameter jets distributed across an area of the bottom 34 m by 20 m (Figure 3). The jets were evenly distributed in sets of 7 along 10 branch pipes, connected in pairs to a central manifold pipe. The array was powered by a 101 liter/sec (1,600 gpm), deck-mounted, centrifugal pump having a total discharge head of 67 m (220 ft). Ten pneumatic pinch valves, located at the base of each branch leg, were used to control the flow rate to each branch leg.
Figure 4 contains a block diagram of the control system, which consisted of an electronic logic circuit coupled to an electro-mechanical timing circuit. The pneumatic pinch valves were opened and closed via a series of cam-actuated solenoid valves. A tide (pressure) sensor was used to detect the system starting time. During operation, pump intake pressure, discharge pressure, and power consumption were monitored by the control system. In the event of a malfunction, the system was automatically shut down, activating an alarm circuit.
The spatial scour jet array system was operated twice daily for four months beginning in February 1977. The system duty cycle consisted of the following sequence of events. Commencing approximately two hours before high tide (i.e., the start of ebb flow near the bottom), the pump was started and the flow directed to the innermost pair of jet legs. After seven minutes, the flow was directed to the next pair of legs, and so on until all of the jets had been sequenced. At this point, the pump was turned off and the system placed at standby until the next tidal cycle.
The sequencing of the jets was designed to sweep any newly deposited sediment into Mare Island Strait. The 7.1 liter/sec flow rate passing through each jet had been estimated to provide a 100 percent overlap of scour patterns between adjacent jets. This estimate was based on an assumed sediment threshold stress of 1 dyne/cm2. Field tests, however, showed that a shear stress of about 5 dynes/cm2 was needed to prevent gradual deposition. As a result, the scour pattern for each jet was significantly reduced, allowing small mounds of sediment to form between individual jets.
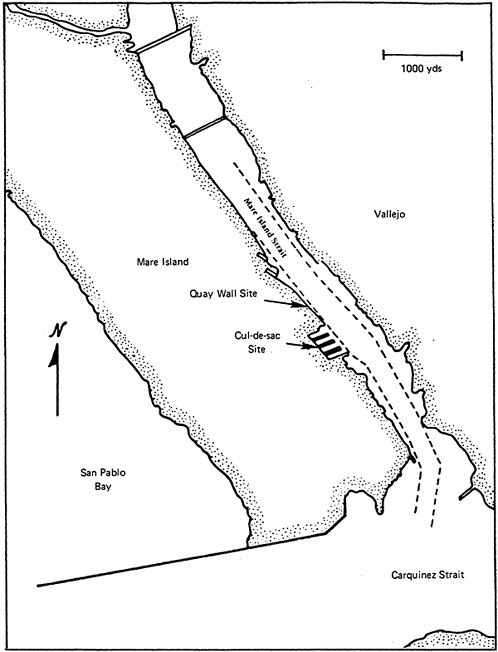
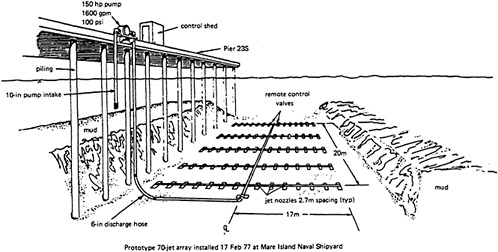
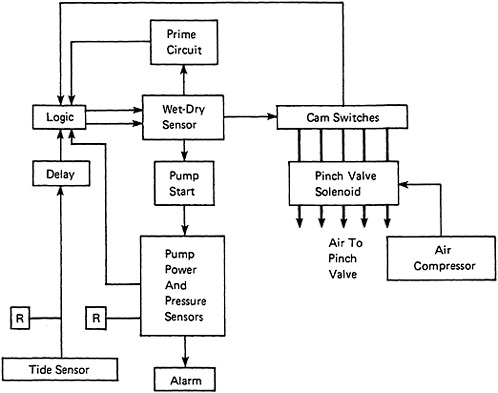
Figure 5 shows a plot of the spatial scour jet array performance relative to an adjacent control area. During the test period, the control area experienced approximately 0.5 m of sedimentation, while the test area exhibited no measureable sedimentation (except for the above mentioned mounds).
MINSY Linear Jet Array
The linear array is an alternate configuration for a scour jet array system that is particularly well suited to parallel berthing geometries. Figure 6 shows a schematic representation of a linear scour jet array that was tested along a section of a 700 m-long quay wall on the west side of Mare Island Strait (Figure 2). The linear jet array consisted of ten equally-spaced jets distributed over 63 m of berth (Jenkins et al., 1981). The jets were short-coupled to individual pneumatic pinch valves, which were connected to a common
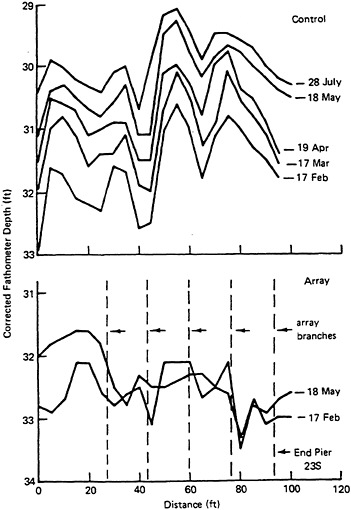
FIGURE 5 Survey profiles of the spatial scour jet array site (bottom) and the adjacent control site (top).
manifold pipe. The manifold pipe was connected to the deck-mounted centrifugal pump via a single riser pipe.
The 7.3 cm diameter jets were located 2.5 m above project depth (−10.7 m MLLW) and angled downward 20 degrees from horizontal. Elevating the jets above the bottom was necessary to avoid interfering with a rubble-rock toe located at the base of the quay wall. The downward angle of the jets provided a continuous scour pattern beginning at the outer edge of the rock toe. The linear scour jet array system used the same centrifugal pump, pinch valves, and control system as the spatial array.
The linear scour jet array was operated for 18 months beginning in May 1979. During this time, the system duty cycle consisted of the following steps. At the commencement of ebb tidal flow, the pump was started and the discharge directed to the northernmost jet in the array. After 12 minutes, the flow was redirected to the next jet, and so on until all of the jets had been activated. The pump was then turned off, and the system placed on standby until the next tidal cycle.
Figure 7 shows a plot of the scour performance of the linear array during a two-month test period. The uppermost profile line shows that the test area shoaled approximately 0.6m during the month prior to the start of the test. The bottom profile line shows that after two months of operation, sedimentation had been prevented out to a distance of 21 m from the face of the quay wall.
The above tests provided data relating to component reliability and system performance, and lead to significant findings. After about four months of operation, the rubber liners in the pneumatic pinch valves began to fail. This caused significant downtime for the linear jet array system, since divers were required to service the valves. Priming the deck-mounted centrifugal pump was a periodic problem due to loss of integrity of the pump seals. The PVC pipe that was used in both jet arrays was found to be brittle and subject to cracking. Finally, the electro-mechanical control system was found to be cumbersome and unreliable. These findings led to a number of design improvements in subsequent scour jet array designs.
MINSY Linear Jet Array Test Bed
The above tests served to validate the technical feasibility of the scour jet array concept. These tests, however, left a number of questions unanswered relating to system design and performance:
-
Is the laboratory-derived shear stress distrubution (Eq. 1) valid at prototype scales?
-
What is the optimum shear stress for scouring newly deposited fluid mud as well as partially consolidated mud?
-
Is reliable operation achievable using off-the-shelf components?
-
What are the effects of tidal currents on scour jet performance.
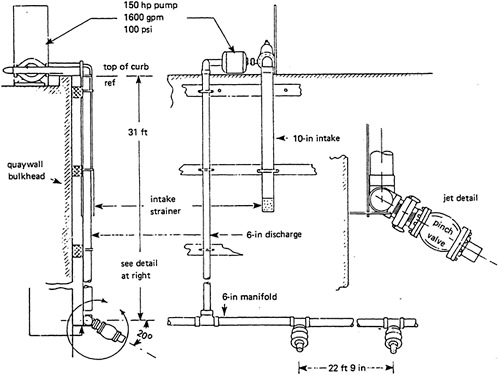
FIGURE 6 Schematic diagram of linear scour jet array system.
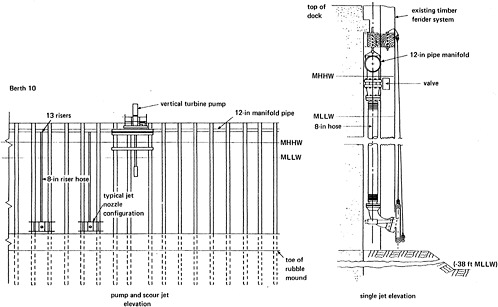
A test bed linear jet array was designed by the Naval Civil Engineering Laboratory to answer these questions. The test bed is currently being installed at a quay wall berth at MINSY. Referring to Figure 8, the test bed array consists of 13 jets, spanning a distance of 70 m. The jet array will be powered by a 285 liter/sec (4,500 gpm) verticle turbine pump having a discharge head of 27 m (90 ft). The jets are connected to the pump via individual riser hoses leading to a common manifold pipe. Flow to the jets is controlled by pneumatic-actuated butterfly valves, connected to the top of each riser hose. Both the valves and the manifold paip are located above water allowing easy accessibility. Additional design features include quick coupling fiberglass pipe, a micro-processor based control system, and retractable jet support beams. The latter feature represents an important design improvement because it eliminates the need for divers during installation or maintenance.
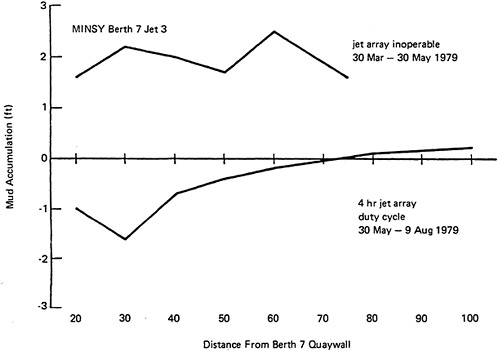
FIGURE 7 Observed sedimentation at linear scour jet array site. Top profile is when the system was inoperable; bottom profile is when the system was in operation.
The test bed array will be used to systematically evaluate variations in jet geometry. A total of three jet diameters, three jet angles, three jet elevations, and three jet discharge rates will be evaluated. The maximum design scour distance is 23 m using a design threshold stress of 6 dynes/cm2. Although designed as a test bed, the jet array incorporates all of the elements of a prorotype system, providing the opportunity for comprehensive operational testing. The test bed scour jet array system will be operated for three years beginning September 1986.
SITING CRITERIA AND SYSTEM ECONOMICS
The primary criterion for siting a scour jet array system is to place it where there is sufficient tidal circulation to carry the resuspended sediment away from the site. In areas having minimal tidal circulation, there may be some economic advantage to moving the
unwanted sedimentation from one area of the harbor to another; however, the full economic benefit occurs when resuspended sediment is carried completely out of the area.
Spatial scour jet arrays can be used to maintain a large area of berth free from sedimentation. By sequencing the jet action from the rear of the berth foward, a spatial array can be used to carry sediment of a cul-de-sac berth into an ebbing tidal channel. In contrast, a linear scour jet array is best used in a parallel berthing configuration, with the berth located along one side of a tidal channel.
The maximum practical scour distance for a single jet (about 30 m) is controlled by economics. For greater scour distances, a spatial array should be considered. For either spatial or linear arrays, optimal dimensioning of system components requires a careful balancing of capital and operating costs.
Currently, the cost for a modest-sized linear jet array (e.g., the MINSY test bed array) is about $10,000 per jet. In general, the benchmark for judging the economic viability of a scour jet array system is the conventional dredging cost per unit area of berth. This cost is computed as the product of the unit dredging cost ($/m3) and the annual shoaling rate (m/yr). Bailard (1980) found that for linear jet arrays, a dredging cost of about $8/m2 was needed to justify construction of a modest-sized system. The current dredging cost of MINSY is about $20/m2.
For the Navy, direct dredging costs are only one element of the decision criteria. Additional cost considerations include increased wear on ship cooling systems due to the ingestion of sediment, temporary loss of berth usage due to dredging or inadequate water depth, emergency dredging cost, and permitting costs. Another consideration, which sometimes becomes overriding, is the added risk of grounding associated with conventional dredging of areas having high rates of sedimentation.
REFERENCES
Bailard, J.A. 1980. A design procedure for a scour jet array. Naval Civil Engineering Laboratory Technical Note No. N-1589. 47 pp.
Bailard, J.A. and J.M.Camperman. 1983. A design for a test bed scour jet array for Mare Island Naval Shipyard. Naval Civil Engineering Laboratory Technical Report No. R-899. 31 pp.
Jenkins, S.A., D.L.Inman, R.W.Harris, and S.S.McElmury. 1977. The evaluation of sediment management procedures, Phase IV–VI. Final Report, 1978–1980. Scripps Institution of Oceanography Reference Series No. 81–22. 204 pp.
Van Dorn, W.G., D.L.Inman, R.W.Harris, and S.S.McElmury. 1977. The evaluation of sediment management procedures, Phase II. Final Report, 1975–76. Scripps Institution of Oceanography Reference Series No. 77–10. 107 pp.
Van Dorn, W.G., D.L.Inman, R.W.Harris, and S.S.McElmury. 1978. The evaluation of sediment management procedures, Phase III. Final Report, 1976–77. Scripps Institution of Oceanography Reference Series No. 78–18. 50 pp.
PASSIVE REMEDIAL SEDIMENTATION CONTROL IN PARALLEL BERTHS AND CHANNELS
Scott A.Jenkins
Scripps Institution of Oceanography
Artificial deepening of rivers and channels through dredging leads to an increase vertically in the channel cross section. Although providing sufficient depth for deep draft ships, this practice has an adverse consequence: it reduces the vertical velocity gradients as the available tidal flux and river discharge is spread over the depth increase. Diminished vertical gradients reduce the current-induced shear stresses acting on the fluid/sediment interface. When bottom stresses no longer exceed the threshold erosion stress τc of the sediment bed, then fine silts and clays which floculate and settle are no longer mobilized by current action. The dredged bottom then shoals, often rapidly, after series of storms and runoff as shown in Figure 1. The density of the shoaled infill material is substantially less than the more compacted undredged soils beneath, as indicated by the horizons of interstitial water within the infill. Therefore, the threshold erosion stress of the infill material is substantially less than the undredged basement layers of the bed. Shoaling of infill material continues until some steady state bottom elevation, Z=Zc, is established at which bottom stresses are sufficiently intense to balance the smaller threshold erosion stress of these new soils.
When turbulence generated by a structure locally increases bottom stresses, scour is typically observed (Collins, 1980). Figure 2 shows how vertical eddies (Schlichting, 1968) give rise to vertical advection away from the bottom in opposition to the settling velocities of flocs and aggregated fine sediments. The combined action of turbulent shear stresses to erode the bottom and vertical advection to flux mobilized sediments away from the bottom is accountable for a net erosion flux of about 23,000 m3 annually on the downstream side of this bridge. This determination was made from undredged bathymetry in this area before and after bridge construction according to relations defining the erosion flux.
Clearly it is impractical to obstruct harbors and navigation channels with vertical turbulence generating structures as found on the bridge example. However, a wing is also a very efficient vortex generator which imparts a net vertical deflection to the trailing wake due to the induced velocity (Prandtl and Tietjens, 1934; Glauert, 1948). If the wing produces lift downward then by action/reaction the
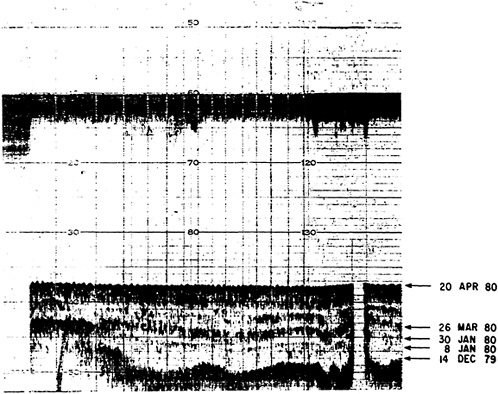
FIGURE 1 Echogram taken with 40 kHz of a dredged channel bottom at Mare Island Naval Shipyard (MINSY). Post dredging survey was taken December 14, 1979.
wake is accelerated vertically upward creating an upwash field. By mooring wings within a cord length of the bottom, the induced velocity field may be brought to act directly upon the fluid/sediment interface. In this mooring configuration the wings present a sufficiently low profile to stay within the keel clearance gap on the bottom of overdredged channels, thereby avoiding ship collision. By deploying wings in mass arrays like a flock of birds (as shown in Figure 3) large areas may be influenced by the combined induced velocities of many individual wings. This reduces the need for excessively large wings that require large moorings. As the induced velocity field trailing an array of wings begins to decay downstream, a second array could be placed to resuspend the settling sediments mobilized by the first array. With cascades of wing arrays along a channel, it should be possible to keep fine sediments suspended until they have bypassed harbor areas and reached either the sea or channels where strong natural currents maintain a sufficiently deep-scouring channel.
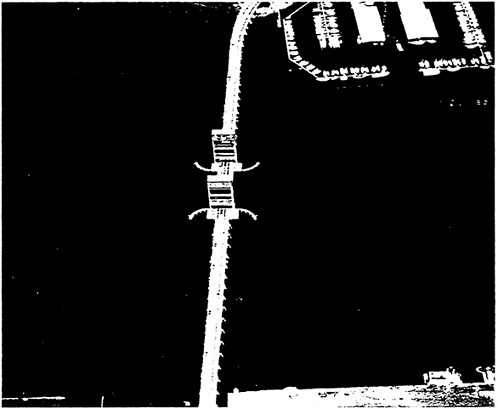
FIGURE 2 Sediment raised to the surface in the wakes shed from support piles on the Bascule Bridge. The location of this bridge across Mare Island Strait is shown in Figure 10.
FORMULATING THE WING-BED INTERACTION
For simplicity, consider a dredged estuarine channel as a flat, isotropic, cohesive sediment bed acted upon by a two-dimensional turbulent flow. The fluid/sediment interface is ambiguous due to a layer of settled floc lying over the consolidated bed. Consequently there is a continuous increase in bulk density (mass of sediment per unit sample volume) as one transits through the fluid across the fluid/sediment interface into the bed, as shown schematically in Figure 4. There is, however, a dynamic destination as one transits from the fluid to the bed. The fluid will not support shear stress at equilibrium. On the other hand, the cohesive sedimentary bed behaves as a viscoplastic with a yield stress. When an applied shear stress exceeds the yield stress, the cohesive bed will deform at a rate proportional to the difference between applied and yield stress. Applied stress less than yield stress results in no failure, but rather the
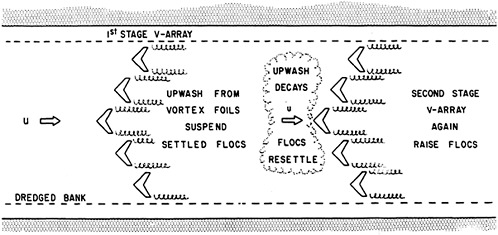
FIGURE 3 Schematic representation of cascades of wing arrays to maintain dredged channels.
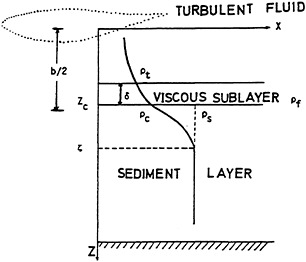
FIGURE 4 Schematic of the fluid/sediment interface for the wing-bed interaction problem.
bed will simply store elastic strain energy. The yield stress is a function of the sediment bulk density ρ (Miznot, 1968). Therefore we shall define the fluid/sediment interface as that level Z=Zc where the bulk density has risen to some critical value ρc such that the resulting fluid/sediment slurry just begins to develop a yield stress τ=τc that obeys the relation due to Miznot (1968) wherein
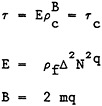
(1)
Here ρf is the bulk density in the flock layer of viscous sublayer where the fluid sediment slurry will still not support any shear stresses. Miznot finds that for a wide sample of cohesive soils (1) m is about 5; (2) n varies from 10−1 to 10−15; (3) q is 1/4; and (4) Δ is unity if τc is less than 15 dynes/cm2. Because of these empirical relationships the average yield stress at the fluid sediment interface may be expressed in terms of the friction velocity u*. of the turbulent flow acting above, or
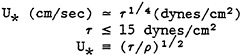
(2)
Below the fluid/sediment interface Z=Zc, there is a progressive Increase in bulk density with depth until a saturation value of ρ=ρs is achieved in the consolidated portion of the bed below some level z=ξ. This saturation value is approximately invariant with time. Lambermont and Lebon (1978) gave parabolic density distribution over this portion of the bed
(3)
which is consistent with the two boundary conditions
(4)
and
(5)
Sediment transport within the bed between Z=Zc and Z=ξ may be expressed independent of the vertical component of the barycentric velocity within the bed (Lambermont and Lebon, 1978). Therefore, sediment transport is governed here according to the following from Fick’s law:
(6)
where ![]() is the diffusion coefficient, Ks is the sedimentation coefficient and g is the acceleration of gravity. Eq. 6 is subject to the boundary conditions imposed by Eqs. 4 and 5.
is the diffusion coefficient, Ks is the sedimentation coefficient and g is the acceleration of gravity. Eq. 6 is subject to the boundary conditions imposed by Eqs. 4 and 5.
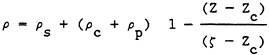
Above the fluid/sediment interface Z=Zc, the bulk density decays through the flock layer to some threshold valud ρt, where the turbulent logarithmic velocity profile begins, or
(7)
where δ is the thickness of the viscous sublayer as a function of the friction velocity
within this floc layer region, the fluid motion is assumed to behave as a laminar viscous sublayer. Accordingly the sediment transport is governed here by the Fickian form of the continuity equation, where
(8)
Here ![]() is the diffusivity, Wo is the settling velocity of the flocs which varies with floc size and therefore salinity, and ω is the vertical component of the fluids velocity induced by the wing. Eq. 8 is subject to the boundary conditions imposed by Eqs. 4 and 7.
is the diffusivity, Wo is the settling velocity of the flocs which varies with floc size and therefore salinity, and ω is the vertical component of the fluids velocity induced by the wing. Eq. 8 is subject to the boundary conditions imposed by Eqs. 4 and 7.
The sediment transport equation for the bed Eq. 6 and for the floc layer Eq. 8 are coupled through a common boundary condition Eq. 4 which is evaluated at an unknown position Z=Zc. Therefore, an additional condition must be imposed at Z→Zc. That condition will require that the mass flux across the fluid sediment interface Q is continuous or
(9)
where the normal component of mass flux out of the bed is deduced from Eq. 6 and written
Therefore the dynamic boundary condition at the fluid sediment interface may be expressed as
(10)
From the preceding formulation of the boundary value problem in the neighborhood of the fluid sediment interface, it is concluded that the wing can effect the fluxes of sediment only through inducing a vertical component of fluid velocity ω within the floe layer, Zc≥Z≥δ. This of course is conditional on the presence of some applied stress in excess of the yield stress at Z=Zc. The induced velocity field due to a lifting body placed a distance b/2 from a plane boundary is found by the method of images (Figure 5). This problem is equivalent to the induced velocity of an unstaggered biplane solved by Prandtl (1919) if the circulation Γ of each wing is made equal and opposite. Let the wing be assumed to be uniformly loaded so that Γ=constant over a span y=2σ. Fix the coordinate system with its origin in the center of the wing at a distance Z=b/2 above the fluid sediment interface as shown in Figure 4. Make the vertical axis o–z positive downward with O–X parallel to the bed and positive in the downstream direction. Let the axis O–Y be tranverse to u and parallel to the bed along the span of the wing. For the present let the wing span Y=2σ be large compared with all other length scales. Therefore, to lowest order the induced velocity will be constant across the wing span and vary according to
(11)
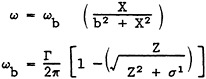
With Eq. 11 to specify the wing induced vertical velocity in the floc layer, Eq. 8 can be solved subject to Eqs. 4 and 7 to evaluate the vertical sediment mass fluz Q(Zc) at the bottom of the floc layer, or
(12)
We define the erosion flux Q according to Lambermont and Lebon (1978). Invoking the dynamic boundary condition (Eq. 10), the mass of sediment entering the floc layer from the bed across the fluid sediment interface may be written
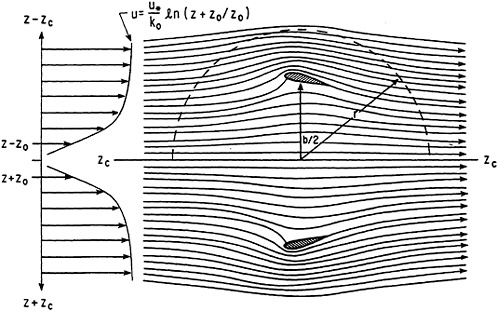
FIGURE 5 Schematic of the image problem for the induced velocity of a wing near the bed.
(13)
Solving Eq. 6 subject to Eqs. 4 and 5, making use of Eq. 3 gives
Therefore the steady erosion flux due to the presence of a wing at distance b/2 above Zc is
(14)
It is found that the erosion flux depends only upon one variable of the cohesive bed, namely the yield stress as represented by ρc. All parameters are constant for a given sediment type. On the other hand, the erosion flux is increased by the presence of the wing. This enhanced erosion decreases with increasing distance downstream x→∞, but increases with the circulation generated by the wing section, with the wing span σ, or decreases with the mooring distance b/2 above the bottom. The latter two are restricted by practical limitations of the wing mooring system. Therefore, the circulation Γ developed by the wing section is the only remaining free parameter to maximize in order to achieve maximum erosion fluxes, since the induced velocity is a linear function of the circulation
OPTIMAL WING SECTION
The circulation Γ around the wing section is related to the section lift coefficient CL by
(15)
Hence, maximization of the circulation is equivalent to maximization of the section lift coefficient for any given mean turbulent flow u over the sedimentary bed. It is also found that the circulation will grow with increasing cord length C favoring large wings. However, wing size is ultimately constrained by the mooring system limitations.
From Eqs. 14 and 15 it is concluded that maximization of erosion flux is equivalent to the lift maximization problem. This problem has been successfully addressed in aerodynamics by Wortmann (1955) and
Liebeck (1973). Their methods have been adopted here to account for the presence of a plane fluid/sediment boundary and the turbulence damping effect of the sediment in the external flow.
The lift maximization problem is carried foward using curvilinear boundary coordinates with the origin at the trailing edge of one of the two section surfaces (Figure 6). Let S be the tangential curvilinear coordinate and n be the normal component. Beginning from S=0 at the trailing edge and proceeding forward around the wing section, we pass through the stagnation point Sp at the leading edge where the velocity u(s) vanishes. The stagnation point permits the lift coefficient to be represented in curvilinear coordinates by two normalized integrals for each surface according to
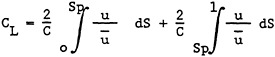
(16)
From the calculus of variations it can be shown that lift maximization is achieved by minimizing the first integral in Eq. 16 (since S is positive in the direction of u), and maximizing the second integral. In both cases there are constraints.
The minimum value for the first normalized integral in Eq. 16 would correspond to zero velocity or complete stagnation between S=0 and S=Sp. This is not entirely possible because the modified Kutta condition must be imposed at the trailing edge S=0. Due to the shedding of the wing boundary layer into the wake, the velocity at the trailing edge must assume some non-zero value which is identical for either wing surface at S=0.
The maximum value of the second normalized integral in Eq. 16 is achieved by obtaining the largest possible u between S=Sp and S=1. This is limited by the degree of pressure recovery that the wing boundary layer will tolerate without separating, while decelerating from a maximum velocity uo to the modified Kutta velocity at the trailing edge ute. Pressure recovery is parameterized by the pressure recovery coefficient ![]() where
where
(17)
From the work of Wortmann (1955) and Liebeck (1973) it is clear that the greatest pressure recoveries are obtained for a turbulent wing boundary layer. This is due to higher kinetic energy available to overcome adverse pressure in a turbulent boundary layer. The pressure recovery equation used by Liebeck was derived from Stratford (1959).
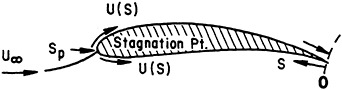
FIGURE 6 Curvilinear coordinate convention for the lift maximization problem as shown for a down-washing wing.
Here, his analysis is modified to incorporate the effects of the sediment in specifying the inner region of the turbulent boundary layer from mixing length theory (Schlichting, 1968). Accordingly, the mixing length ℓ is specified in terms of
(18)
where Ko is von Karaman’s constant and a(ρf) is the mixing length damping factor as a function of the sediment bulk density in the floc layer. Both a(ρf) and ρf will depend upon the mooring distance above the bottom b/2 according to the bulk density profile through the floc layer (Figure 4). With Eq. 18 the joint condition between the inner and outer region of Stratford’s analysis is modified to
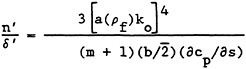
(19)
where δ′ is the thickness of the wing boundary layer and m varies slightly with Reynolds number, but is about 7.
With Eqs. 18 and 19 the modified pressure recovery equations are written
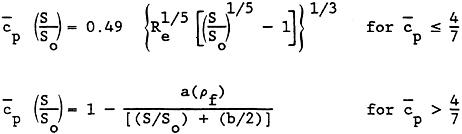
(20)
where So is the position of the velocity maximum uo and Re is the Reynolds number based on the mooring distance
With Eq. 20, an optimal velocity distribution is constructed by solving cp for u(S) according to Eq. 17. The inverse calculation for the physical shape corresponding to that optimal velocity distribution is then calculated according to James (1971). Not every shape so derived is physically meaningful. When the velocity maximum between S=Sp and S=1 is specified too small, then often a double-entrant shape is found, where the two section surfaces intersect before the trailing edge. In addition, the parameters a(ρf) and b/2 constrain the steepness of the pressure recovery curve through the matching requirement in the neighborhood of cp=4/7. Consequently, the velocity distribution must be modified through an iterative sequence until a satisfactory shape is recovered.
Following the above procedure, a high-lift wing section was designed for flow conditions anticipated in a subsequent field test. The design mooring distance was made 0.25 cord lengths, the minimum value that still avoids excessive ground effects. The design Reynolds number was chosen as 105 based on anticipated bottom currents of about 0.5 knots. A value for a(ρf)=0.23 was appropriate to the 20-micron size suspended floc particles. The high lift section derived for these values is plotted in Figure 7.
EXPERIMENTAL RESULTS
To evaluate the characteristics of the high lift section in Figure 7, a series of laboratory measurements of the lift-drag polar were performed in the Fleishman stratified flow channel at the Scripps Institution of Oceanography. Two-dimensional wing sections were cut from styrofoam using a hot wire, and fitted with strain gauges in a bridge circuit arrangement. To reproduce the design Reynolds number of 105, the flow channel was operated at 1 m/sec or 1.95 knots using a test section with a 40 cm cord length. Four independent series of force measurements were conducted using mooring distances that ranged from the minimum design value of b/2=0.25C to b/2=0.625C. The
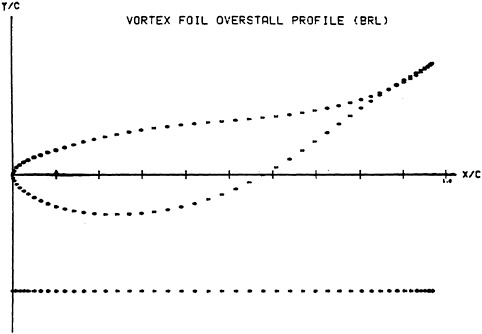
FIGURE 7 Optimal wing section specific to flow and sediment conditions in Mare Island Strait.
angle of attack was varied in 2° increments for each series from α=−16° to α=+24°. The position of the wing boundary layer separation point was observed on the upper and lower surfaces using dye injection through ports integral in the test section.
The measured lift-drag polar (CL vs. DD), lift curve (DL vs. α), moment curve (Cm vs. α), and separation curve (X/c vs. α) are plotted in composite in Figure 8. These results were obtained for an upwashing wing, wherein the suction side of the wing section faces the channel bed. We observed a maximum lift coefficient derived from lift acting downward of −1.2. We further observed only a small improvement in this value, b/c=0.5. This indicates that the design mooring distance is acceptably large without compromising the maximum lift through the ground effects. The section stalls above angles of attack of 10° and separates simultaneously over the entire pressure recovery region aft of the velocity maximum. This indicates that the profile is truly optimal in the high lift sense by maintaining the boundary layer on the verge of separation throughout pressure recovery. The section continues to maintain a moderately high lift coefficient after stalling until an angle of attack of about 16°. Throughout the changes in angle of attack, the pitching moment coefficient remains small and approximately constant.
Following the lift-drag polar measurements, a series of laboratory resuspension experiments were conducted using a cohesionless model sediment scaled by the Shields parameter N where
In subsequent field experiments a threshold yield stress of 1 dyne/cm2 was anticipated for 20-micron sized flocs. This equates to a Shields parameter of N=0.27. In the laboratory, keypunch holds from computer cards soaked in water will be disturbed from rest on the bottom by a threshold stress of 1 dyne/cm2. However, the immersed density of these cohesionless particles is slight, (ρs−ρ) ![]() 0.13 −0.19 gm/cm3. Therefore a prototype Shields parameter was obtained by selecting keypunch hole sizes of 2–3 mm.
0.13 −0.19 gm/cm3. Therefore a prototype Shields parameter was obtained by selecting keypunch hole sizes of 2–3 mm.
A variety of wing plan forms and angles of attack were tested for their efficiency at resuspending the model sediment. It was learned that the largest amounts of resuspended model sediment resulted from wing models which had swept-back leading edges and which were operated with their suction surface partially stalled at 12° to 15° angles of attack. A probable interpretation of this result is that the leading edge vortex filament due to sweepback and the bound vortex due to separated flow both augment the circulation and add additional turbulent mixing to the wake.
Guided by the qualitative results of the laboratory resuspension experiments, a prototype wing and mooring system for field deployment was designed (Figure 9). Eqs. 14 and 15 argue in favor of the largest possible wings for any given wing section design. However, the load rating of the mooring arrangement places the ultimate limitation on wing dimensions.
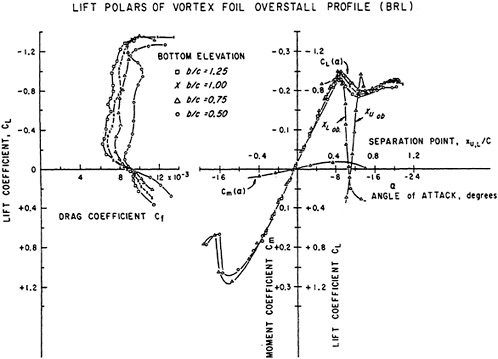
FIGURE 8 Experimental lift-drag polars measured for the optimal wing sections in Figure 6 in a laboratory flow channel at Reynolds number Re=105.
A single-point tether mooring was chosen for simplicity and maximum compliance to directionally periodic flows. By proper positioning of the mooring point in relation to the centers of buoyancy and dynamic pressure, a single-point mooring allows the wing to execute stable flights in periodic current flow. The sweepback of the wing makes such stable flights possible by allowing the hydrodynamic center of pressure to be placed ahead of the center of buoyancy through proper wing-plan form geometry. In this way, buoyancy can be used to perform the work of a tail on a bird or airplane in balancing the lift-induced pitching moment to maintain a constant angle of attack. The constant pitching moment coefficient measured for the wing section in Figure 7 is particularly advantageous in this regard.
The mechanical anchor system for mooring the wings in fixed arrays is detailed in Figure 9. It consists of a screw earth anchor on a 10–15 ft long shaft extension which is turned by diver manipulation through the soft upper layers of the cohesive bed, and is seated in the hard undredged soils beneath. An assembly with four vertical shear

plates and a horizontal settling plate is free to slide up and down the anchor extension, but float on the soft fluid mud horizon of the upper portion of the bed where the bulk density is approximately equal to ρc. The wing is moored directly to the settling place. The net of the wing buoyancy and the immersed weight of the settling plate is adjusted to float the settling plate near Zc. The mechanical linkage between the wing and settling plate consists of sealed automotive needle bearings from an axle, and an adjustable worm gear bolted to the wing. The worm gear permits final adjustments in the position of the mooring point in order to maintain the desired 12° to 15° angle of attack. Such adjustments are periodically necessary due to trim changes from biofouling or water absorption. As the bottom is 0eroded by the action of the wing, the level of Zc at which the settling plate floats are lowered. Since the wing is connected directly to the settling plate, it too is lowered by the same increment. The anchor extension shaft passes through a clearance hole in the wing. In this way the wing continually maintains its design mooring distance b/2 in spite of changes in the bottom level.
In pull tests with a dynamometer, the mooring system in Figure 9 was determined to have a capacity for a 2,500 lb vertical loading. Due to the sensitive military nature of the study area (see Figure 11), a 4:1 design safety margin was required. Therefore, static buoyancy of the wings was restricted to about 625 lbs. This limited the final wing dimensions to a 20 ft span with a 5 ft root cord length and a 3 ft tip cord length.
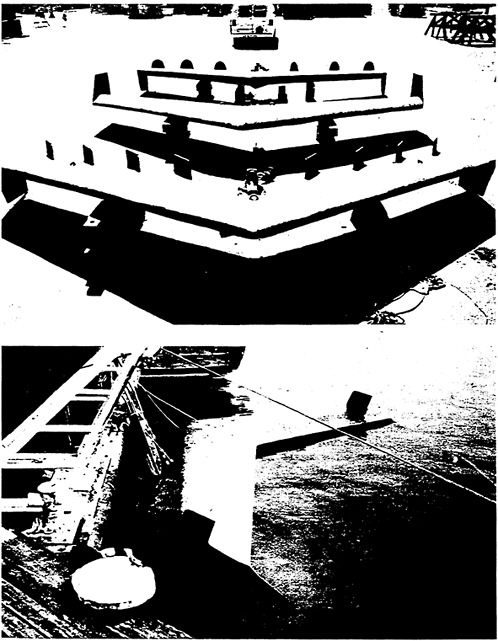
The wings were constructed from 8–12 lbs/ft3 density urethane foam in injection molds. Each wing displaces about 2,500 lbs of water. Therefore, they were ballasted and reinforced to a dry weight of 1,875 lbs using a steel rebarr infrastructure to achieve the design static buoyancy of 625 lbs. The suction side of the finished wings is shown in Figure 10a, the pressure side in Figure 10b. The boundary layer control fences were retrofitted to the suction side to delay merging of the trailing vortex filaments.
Field deployments of a small array of wings were performed at Mare Island Naval Shipyard (Figure 11). A study area of 100×100 ft was authorized adjacent to the dry docks just beyond the dredged channel boundary. Generally the bottom in the study area slopes downward toward the channel beginning at −23 ft MLLW near the toe of the concrete quay wall to −35 ft MLLW at the channel boundary line. When dredged prior to installation of the array, the study area had an approximately flat bottom at −30 ft MLLW which rose abruptly forming a mud bank directly adjacent to the quay wall. The dredged bottom contours for several range lines across the study area are found in Figure 12 as dotted profile lines.
Between November 1982 and November 1983, 3 to 5 wings were maintained inside the study area. Occasionally some of these were removed for brief periods to retrofit boundary layer control fences and remove biofouling. Two wings were eventually lost due to mooring failures. Within the control areas indicated in Figure 11, between 8 and 10 ft of shoaling was observed. Figure 12 gives the final bottom
contours across the study area at the end of the study period in November 1983. Figure 13 shows an echogram along the axis of the array parallel to the current. Two conclusions are apparent. First, the wings are locally 100 percent effective at preventing shoaling of the dredged bottom, otherwise they would have become buried beneath the sedimentation that has obviously occurred everywhere else. Second, from the scour trail evidenced on both sides of the array, there is some erosion flux which persists for a considerable distance downstream. That erosion flux decays with increasing distance downstream as previously anticipated from Eq. 14. The total erosion flux calculated from the volume of the scour trail over the length of the study period is 1,066 yd3/yr.
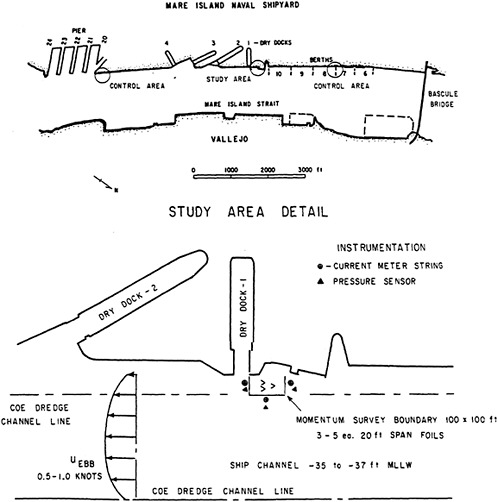
FIGURE 11 Site plan for the wing experiments at Mare Island Naval Shipyard.
During the first two months of the study period, all wings in the array were the upwashing type with dynamic lift acting vertically downward against the buoyancy. However, the scour trail was somewhat limited in downstream extent. Since upwash field is directed away from the bottom it was concluded that the resulting shear stress may fall below the critical erosion stress within a short distance downstream. Eq. 14 is valid only for shear stresses that equal or exceed the critical erosion stress. Consequently the array was modified by turning over the solitary wing leading the array in Figure 12 to direct turbulent downwash against the bottom. The result was a dramatic increase in the downstream extent of the scour trail as presently shown in Figure 12.
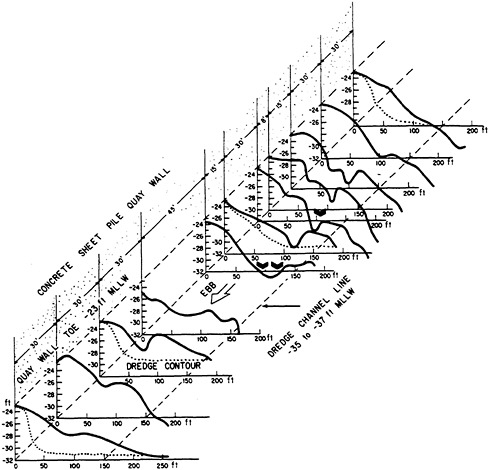
FIGURE 12 Initial and final bottom contours resulting from wing arrays maintained for a period of one year.
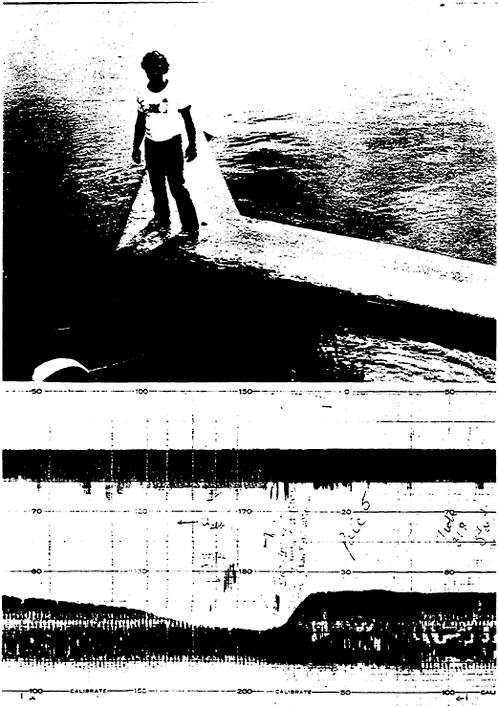
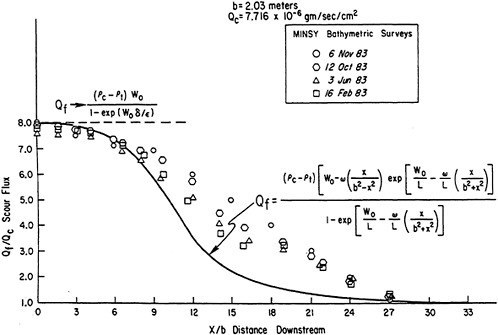
FIGURE 14 Comparison of the measured or theoretical erosion flux in the downstream direction.
The downstream extent of erosion flux for the modified array was measured from successive volumetric calculations deduced from four separate bathymetric surveys over the duration of the test. The results are plotted in Figure 14 and compared against the theoretical erosion flux calculated from Eq. 14. Here the distance downstream from the array is made nondimensional with respect to the mooring elevation b while the erosion flux has been normalized by the critical erosion flux Qc at which zero net shoaling occurs, that is when
We find that the closest agreement with theory was observed for the first survey on February 16, 1983. The theory predicts both the near-field and far-field erosion fluxes with acceptable accuracy. The total downstream extent of zero net shoaling Qf/Qc−1, was about 60 m. However, the intermediate erosion fluxes for the later surveys showed more of a linear than an exponential decay with increasing distance downstream. This higher-than-expected intermediate range erosion flux was possibly the result of erosion on the side walls of the scour trail which grew in extent as the duration of the test increased. The theoretical result of Eq. 14 was based on the assumption of a flat bottom.
There is an additional hydraulic action performed by an array of wings during the flooding phase of the tide. The action of creating lift also introduces additional dissipation through induced drag. The additional bottom friction per unit area introduced by the presence of the wing may be expressed in terms of the drag coefficient CD
(21)
where ![]()
is the two-dimensional section drag coefficient found in Figure 8 and n is a factor that increases with aspect ratio and mooring distance. The rate of dissipation due to this additional bottom friction presented by each wing per unit area is
(22)
where F is the strain on the mooring and Θ is the angle of the mooring relative to the direction of the mean current u. This dissipation acts to impede the salt wedge circulation. If a sufficient density of wing arrays were placed in estuarine channels then it may be possible to arrest the salt wedge prematurely and thereby avoid the numerous problems created by saline intrusion into inland waterways.
To examine the engineering feasibility of this approach, an energy flux survey was conducted around a moored wing as shown in Figure 11. The wing was fitted with a strain gauge and tilt meter on the mooring. A pressure sensor and two-axis current meter were deployed at the centerline of the wing, at both the leading and trailing edges.
If (p∞, U∞, w∞) represent the static pressure and the horizontal and vertical velocities at the upstream survey line, and if (po, uo, wo) are the corresponding terms at the wing trailing edge, then the dissipation rate per unit area of the wing doing work against the salt wedge will be found to be
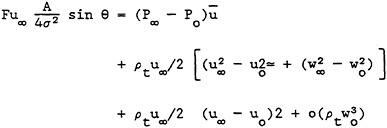
(23)
Figure 15 gives the time series and spectra for the left- and right-hand sides of the measured terms in Eq. 23. FUSN is the left-hand side for Eq. 23 obtained by multiplying the dissipation rate of the instrumented wing multiplied by 3, the total number of wings in the array at the time. (All three wings were upwashing types.) UCBE is the sum of all terms appearing on the right-hand side of Eq. 23. The
time series each represent 2,048 sec of data, or 34 min total record length. Many of the observed current and load oscillations are due to eddies shed from moored ships both on the upstream and downstream ends of the study area. We observe that the two spectra and time series are almost identical, despite what was admittedly a very coarse wake-rake of only three sensors. Estimating the depth of the salt wedge to be 5 m during this record, for which the mean current was 25 cm/sec, it is concluded that each unit area of wing removes 2.9 percent of the salt wedge energy flux through a unit area of stream cross section.
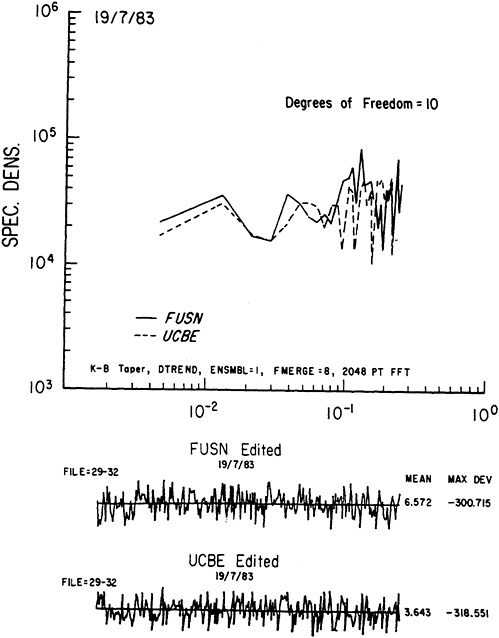
FIGURE 15 Spectra and time series of the dissipation rate functions from Eq. 23.
CONCLUSIONS
-
Downwashing wings are required to achieve a critical erosion stress.
-
Upwashing wings increase the erosion flux.
-
The erosion flux is maximized by maximizing the lift and dimensions of each wing.
-
The moored wing arrays do dissipative work against the salt wedge. The rate of dissipation increases as the lift coefficient squared for the individual wings in the array.
ACKNOWLEDGMENTS
The author is indebted to Dr. E.A.Silva for his support of this work through the Office of Naval Research, Code 421.
This paper is the result of laboratory and field experiments conducted by Mr. Jim Palmer, Mr. Joe Wasyl and Mr. David Skelly from the Center for Coastal Studies, Scripps Institution of Oceanography, in cooperation with Mare Island Naval Shipyard divers and Public Works Department. The author wishes to acknowledge their outstanding performance and support and thank them for a job well done.
REFERENCES
Collins, T.J. 1980. Investigating bridge scour. Railway Trade and Structure 76(4).
James, R.M. 1971. A new look at two-dimensional incompressible airfoil theory. Douglas Aircraft Company, Report No. MCD JO918/01, Long Beach, CA.
Lambermont, J. and G.Lebon. 1978. Erosion of cohesive soils. J. Hydraul. Res. 16(1):27–44.
Liebeck, R.H. 1973. A class of airfoils designed for high lift in incompressible flow. J. Aircraft 10:610–617.
Miznot, C. 1968. Etude des proprietes physiques de differents sediments tres fins et de leur comportement sous des actions hydrodynamiques. La Horrible Blanche 7:591.
Prandtl, L. 1919. Tragflugeltheorie. Gottingen Nachrichten.
Prandtl, L. and O.G.Tietjens. 1934. Applied Hydro and Aeromechanics. New York: Dover Publications. 311 pp.
Schlichting, H. 1968. Boundary Layer Theory. New York: McGraw-Hill. 748 pp.
Slavert, H. 1948. The Elements of Aerofoil and Airscrew Theory. New York: Cambridge University Press. 232 pp.
Stratford, B.S. 1959. The prediction of separation of the turbulent boundary layer. J. Fluid Mech. 5:1–16.
Wortmann, F.X. 1955. Ein Beitrag zum Entwurf von Laminarprofilen fur Segelflugzeuge und Hubschrauber, Z. Flugwiss, 3.


