
4
Habitat Mapping and Distribution of Fishing Effort

Chapter 3 describes the remarkable similarity across studies of the observed effects from fishing with mobile gear. Most studies have covered small areas and have focused on acute effects, but a few studies have addressed chronic effects, and they have found the same patterns (reduced habitat complexity, shifts in community composition, reduced diversity). More information is needed before the small-scale response patterns can be used to make quantitative estimates of ecosystem effects and recovery times. Two fundamental data needs for scaling the observed effects of trawling and dredging on marine habitats to the ecosystem level are the type and magnitude of the effects of specific gear on different habitats, and the spatial and temporal extent of fishing activity.
Although precautionary approaches can be implemented using existing data, the goal is to have sufficient information to support tactical decisionmaking. In most areas, mapping of habitats and fishing effort has been done at a relatively large scale compared to the smaller scale at which ecological effects are described. Dredge and trawl fishing grounds cover hundreds of square kilometers, but most study areas are <1 km2. Because of that spatial mismatch, estimates based on existing data could either overestimate or underestimate the actual effects of mobile fishing gear.
HABITAT
In Chapter 1, habitat is defined as the environment necessary to support, directly or indirectly, the life processes of the resident organisms. Fish require a broad diversity of habitat processes to survive, grow and reproduce. Typically, physical features have been used as a primary criterion for classifying habitats (Allee et al., 2000) and for characterizing the locale of many research studies on the effects of fishing (Chapter 3). But biologic features, including the composition of biologic communities, are equally important when evaluating the effect of altered habitats on fish populations.
Fishing with bottom trawls or dredges takes place with varying intensity in state and federal waters adjacent to every U.S. coastal state. Most bottom fishing takes place on the continental shelf and upper slope in water depths of less than 500 m, although some extends as deep as 2000 m. The seafloor affected, or potentially affected, by mobile bottom-tending fishing gear includes a wide range of habitats, from relatively featureless sandy and muddy bottoms to highly structured seagrass beds and coral reefs. Because the effects of trawling and dredging are not the same in all habitats, it is essential to know the spatial distribution of habitat types in areas where bottom fishing occurs.
HABITAT CLASSIFICATION
Classification of habitat requires a system that uses common terminology and is adopted uniformly by federal, state, and local agencies. A logical and consistent classification of the environment provides the basis for evaluating the extent and significance of disturbance in each habitat type. There is a great need for habitat maps for fishery management, but no systematic maps of large regions currently exist. Some moderately large areas (several hundred square miles) have been mapped recently (see for example, Reynolds et al., 2001; Val-
entine et al., 2001; Wakefield et al., 1998) but even these are small relative to the areas involved in many fishery management decisions. In general, habitat maps have been compiled only on an ad hoc basis for small areas. This is due partly to the lack of an accepted classification scheme for seafloor habitats in the United States.
Several classification systems have been proposed (Allee et al., 2000; International Council for the Exploration of the Sea, 2001; Roff and Taylor, 2000). These systems are hierarchical: they start at a large scale (1000 km) consisting of permanent physical features and scale down to microhabitat. Each system includes enduring physical features of the environment, such as bottom relief, substrate, temperature, stratification, and exposure. Natural physical features are relatively stable over time and can be measured with broad-scale surveys. Physical features alone, however, do not define habitat. Biologic features, the presence of seagrass beds, kelp forests, and coral reefs, for example, also define habitats.
World Wildlife Fund Canada has sought to apply the concepts of terrestrial habitat mapping to Canadian marine waters (Roff and Taylor, 2000). The Canadian classification scheme is based on enduring physical features of the environment. It is especially important to use physical features compatible with broad-scale surveys in Canada and the United States because of the very long coastlines. The rationale is to delineate relationships between biologic community composition and physical variables that can be measured more readily over large areas. This World Wildlife Fund approach has been used to identify representative and distinctive habitats off the coast of Nova Scotia, and it is being used by the Conservation Law Foundation to characterize habitats in the Gulf of Maine.
A parallel approach has been taken to map and classify marine habitats in European waters. The European Nature Information System (EUNIS) has been developed for the European Environment Agency (International Council for the Exploration of the Sea, 2001). European marine habitats are defined by geographic, abiotic, and biotic features, whether entirely natural or partially modified. This broader definition recognizes that habitats can be defined by biogenic features and that marine habitats have been shaped by human activities (e.g., artificial reefs and shipwrecks). The EUNIS classification has five hierarchical levels (Box 4.1).
The difference between the Canadian and European
|
Box 4.1 European Nature Information System Classification The European Environmental Agency has been developing a common parameter habitat classification framework for marine and terrestrial systems. This forms an integral part of EUNIS. The marine component was derived from the BioMar project (Connor et al., 1997) and has five basic levels, based on the following criteria: 1) marine and coastal habitats versus freshwater and terrestrial habitats, 2) depth zone, 3) substrate type, 4) biologic features, and 5) dominant species. Because of differences in biotic communities, the ecotypes used in Levels 4 and 5 are not broad enough to account for the diversity of marine habitats present in U.S. waters. The general features of this classification system are consistent with those developed for the United States (Allee et al., 2000). |
approaches is largely in available data. In part because of the more uniform geography of European waters, habitats have been mapped more thoroughly, allowing more detailed classification. The U.S. situation is more similar to Canada because the United States has an extensive coastline that encompasses an even greater variety of habitat types. Mapping the entire U.S. exclusive economic zone even by substrate type (EUNIS Level 3) is not possible with existing data. Habitats in the U.S. exclusive economic zone range from arctic to tropical, making it difficult to construct a standardized classification scheme for all habitats. Spatial management is at the km2 scale and requires mapping of sediment type (EUNIS Level 3). Although the ecological effects of bottom fishing have been documented at the scale of square meters (EUNIS Levels 4 and 5) concerns about anthropogenic effects are at the much larger scales of ecological communities. Therefore, the International Council for the Exploration of the Sea Working Group on Ecosystem Effects of Fishing Activities recommended identification of habitats influenced by human activity and inclusion of biologic characteristics in the EUNIS classification system.
In the United States, two relatively broad marine
habitat classification schemes have been proposed. Greene et al. (1999) proposed a system based heavily on geophysical remote sensing and involving a hierarchy of habitat feature scales. The system does not address shallow marine habitats (<30 m). It was developed specifically for rockfish habitats in 30–300 m of water along the west coast of North America, but could be adapted for characterizing other habitats. Recently, a committee sponsored by the Ecological Society of America and the National Oceanic and Atmospheric Administration’s Office of Habitat Conservation (Allee et al., 2000) developed a comprehensive marine habitat classification system for U.S. waters. This hierarchical system encompasses all marine habitats and attempts to allow practical classification of habitats at gross to fine scales, depending on the resolution of the available data. Although broadly similar to the EUNIS system (Allee et al., 2000), the new system considers many more habitat types. It differentiates photic from aphotic environments, considers water column habitats, makes a distinction between marine habitats that are associated with a continental mass and those that are not, and emphasizes depth zones and exposure to wind and wave energy. Anthropogenic disturbances are taken into account using “local modifiers” at the finest level of the classification. Because this classification system is relatively new, it has not received much attention. But it is a promising beginning for the wide variety of marine habitats in U.S. waters, although the system needs to be tested, discussed, and modified by the broader scientific and management community.
The next three sections describe how benthic habitats can be characterized by bathymetry, geologic structures, and biogenic substrates (i.e., the plant and animal structure). This is followed by a description of the value of a geographic information system (GIS) for assembling habitat information and by a discussion of the importance of scale in defining and mapping habitat. Appendix C gives a brief discussion of tools used in mapping habitats.
BATHYMETRY
The basic seafloor map is a water-depth or bathymetry map, which shows the shape of the seafloor. These usually are made acoustically, from individual soundings, continuous lines of soundings, or wide swaths of soundings. A map can display the bathymetric information as numbers at the locations of each sounding, as contours delineating zones of equal depth, or as a shaded-relief image. The bathymetry of virtually the entire shelf of the U.S. has been mapped at a scale of 1:250,000 with 2 m contours (National Geophysical Data Center, 2002). Locally, particularly in harbors and approaches, greater detail is available. In a few areas, particularly where there are large recreational fisheries, rudimentary substrate maps (National Geophysical Data Center, 2002), which show bottom type overlain on the bathymetry, have been published at a scale of 1:100,000 and a contour interval of 2 m. Higher resolution maps also have been made in many estuaries, bays, and nearshore areas by various federal and state agencies, academic institutions, and private companies with local interests (such as mining, pollution studies, coastal erosion research or mitigation). There are detailed bathymetric maps for some offshore areas of special interest, such as the National Marine Sanctuaries (Figures 4.1 and 4.2). However, for most of the continental shelf where most federally regulated fishing activity occurs, bathymetric maps with 2 m contours offer the highest resolution available. This scale is insufficient for some fishery management purposes because some features (e.g., ledges, boulders, depressions) with relief much less than 2 m can be significant habitats for fishes.
GEOLOGIC STRUCTURE AND SUBSTRATE
The geologic character of the seafloor (texture, morphology, composition, thickness of sediment substrates; distribution of hard bottom; lithology of rock outcrops) defines marine habitats and influence what organisms will live in an area. For example, sessile organisms cannot attach to a fine-grained mud substrate, and burrowing organisms might not be able to maintain their burrows in loose sand. Karstic limestone, with its craggy, dissolved formations, provides ample hiding places for organisms of many sizes; massive quartz sandstone beds might not. Mapping the geologic character of the seabed requires a suite of data types. Sidescan-sonar imagery can suggest the areal extent of bottom types, but samples of the sediments and rocks are necessary to determine what the bottom types are and to analyze the texture and composition of the substrate. Seismic-reflection sub-bottom profiles are used to assess the thickness of sedimentary deposits and the geometry of subsurface strata.
Several large databases of marine sediment texture are maintained by federal agencies (U.S. Geological Survey, Minerals Management Service, and National
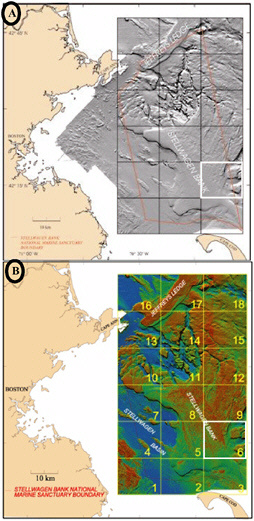
FIGURE 4.1 Bathymetry and backscatter maps from multibeam-sonar data. Multibeam mapping tools make it possible to collect high-resolution bathymetric data over large areas of the seafloor more rapidly than was possible in the past with older single beam systems. The data shown here cover approximately 1,300 square nautical miles of seafloor off Boston, Massachusetts and took about 55 24-hour days of survey time to complete. (A) displays the morphology of the seafloor as though it were illuminated by a light shining down from the north. (B) displays the intensity of the signal that is reflected back to the instrument. Higher intensities are shown in red and correspond to more reflective sediments such as sand and gravel or rocky outcrops. Blue represents lower backscatter and corresponds to less-reflective fine-grained sediments, such as silt and clay. The area labeled "6" is shown expanded in Figure 4.2 (modified from Valentine et al., 2001 and Butman et al., in press).
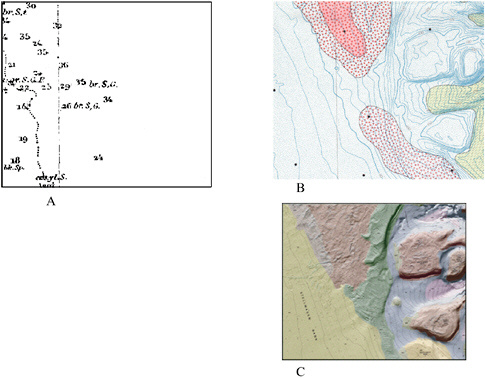
FIGURE 4.2 Progression of knowledge of seafloor at Stellwagen Bank, Area 6 (see Figure 4.1 for location). (A) shows the widely spaced soundings obtained by lead line in 1855,when Stellwagen Bank was discovered. Annotations are also made concerning the substrate type (e.g., S for sand, G for gravel). Sediment samples were probably obtained by putting wax on the lead weight which was lowered to measure the water depth. The bathymetry shown in (B) is based on closely spaced lines of acoustic soundings (Schlee et al., 1973). Substrate type is shown as colored areas but much interpolation between sediment samples (black dots) has been done. (C) shows the same area, with highly detailed multibeam bathymetry and the substrate types shown in color are based on a combination of numerous sediment samples, sidescan-sonar data, and bottom photo and video data (Valentine et al., in press).
Geophysical Data Center). Some also include composition and other descriptive or analytical data. In some areas, the databases can provide a large-scale estimate of substrate types, but the distribution of existing sediment samples is highly variable. Some areas, such as the Atlantic continental shelf, have been systematically sampled approximately every 10 nautical miles (Poppe and Polloni, 2000). Smaller areas such as Long Island Sound, can have a mile or less between samples (Figure 4.3). Other areas, such as large parts of the Bering Shelf, have not been sampled at all. It should be noted that even for areas with relatively closely spaced
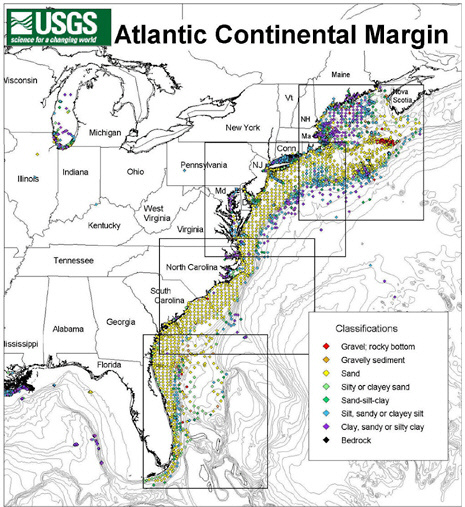
samples, the sampling density may not adequately characterize the bottom. Gravel substrate, for example, is more difficult to sample than finer-grained sediments, so it is often underrepresented and sediment texture says nothing about hardbottom or rock outcrops.
Many smaller studies of specific areas have been carried out by federal and state agencies and academic institutions. As is the case with bathymetric data, greater detail is available for nearshore areas, bays, and estuaries; less for the continental shelf; and very little for the continental slope.
GEOGRAPHIC INFORMATION SYSTEM
Significant amounts of data exist that are useful for fishery management, such as the distribution and frequency of trawling, bathymetry, and substrate composition and texture. These data reside in a variety of places, are not always easy to access, and often are highly variable both within and between regions.
GIS has become the standard way to represent geospatial data (i.e., any data that has a position associated with it). GIS does digitally what scientists have long done with tracing paper or clear acetate—it allows layers of information to be overlaid in various combinations so that relationships between the different data sets can be seen. Many types of data useful to fishery management are appropriate for use in GIS: bathymetry, substrate composition or texture, habitat types, current speed and direction, catch and effort data, species distributions, and bottom photographs. Because GIS allows the user to expand or contract the field of view, data of various resolutions can be used together more effectively. This is very important in fishery management because the resolution of available data varies widely and because, as discussed above, different resolutions might be appropriate to address different issues.
Because the marine waters of the United States include a wide range of habitats, fishery management issues differ regionally. Differences in the seafloor geology and regional climate result in different species assemblages and lead to different fishing practices. Specific management questions require higher resolution data of one type in one area and lower resolution elsewhere. In an ideal world, we might create uniform, high-resolution habitat maps of all U.S. continental shelf areas, but limitations of technology, time, and funding make that impractical, if not impossible.
This dilemma can be addressed by constructing a standard system for habitat classification and by compiling all relevant existing data into a single, readily available GIS format. This will allow managers to make the best use of existing data and to see where data gaps exist. Fishing effort data superimposed on habitat maps, for example, would help identify regions where more study is needed or where problems could arise. Presentation of data sets of differing scales is not a problem in GIS: The user can zoom in where the data density warrants a close-up view or zoom out for a regional view. As new data become available they can be added.
QUESTIONS OF SCALE
The scale at which an area is studied is critical to the eventual utility of the outcomes (products, maps, data) of the study. For example, an issue involving larvae in benthic infaunal structures must be addressed with more detailed information than does one involving schools of fish that aggregate in a broad depth range. Conversely, sediment samples to “ground truth” kilometer-wide areas of differing backscatter in a sidescan mosaic need not be spaced every 10 m. In choosing an appropriate scale for mapping, three interrelated issues must be addressed:
-
What is the purpose of the map? What questions are you trying to answer? What attributes of habitat influence the distribution and abundance of the species of interest? Do you need to know precise locations of objects (e.g., gravel, coral, artificial reefs) and if so, how big are they? Would it suffice to know that an area is composed of gravel, and know the extent of that area, but not whether the gravel is mostly boulders, cobbles or pebbles?
-
How homogeneous, or patchy, are the things to be mapped? This might not be known before you begin to map, but usually some indication— anecdotal information, a detailed map of a small portion of the area to be mapped, a few bottom photographs—is available or can be obtained before a commitment to a mapping plan is made.
-
Is the technology or approach to be used appropriate to the scale of information needed? There is no one right way to map the seafloor. If you need to know about hazards to navigation, you must have bathymetry. If you need to know the distribution of gravel substrate, bathymetry alone will be of little help. Sidescan or multibeam back
-
scatter data and bottom sampling would give this information. If you also need to know the abundance of particular sessile organisms that form important components of habitat (sponges, coral), you will need to add photographic or video data.
Obviously, the scale needed for various data types will vary from region to region and from issue to issue. Characteristics of the substrate are more homogeneous in some areas than in others.
DISTRIBUTION AND INTENSITY OF FISHING EFFORT
The second component of geographic-based information required for assessing the effects of trawling and dredging is the spatial distribution and intensity of fishing effort. As described earlier, potential changes at the ecosystem level caused by trawling or dredging are a function of the extent and distribution of fishing activities in various habitats.
To give some appreciation of the scale of trawling and dredging effects in terms of frequency and area covered, rough approximations of the relative intensity of effort in the fishery management regions are presented in Table 4.1. These estimates are based on data provided by the various state and federal fishery management agencies and make several assumptions regarding the areas swept, the estimated total fishing area, and the total number of trawl or dredge tows, as described below.
There is considerable regional variation in the collection of data on bottom trawling and dredging activities conducted on the continental shelf and slope off the U.S. Coast. Depending on the region and the fishery this information is collected either by the National Marine Fisheries Service or by state agencies. During the latter part of the past decade, trawl fishing effort was documented in statistical blocks that encompassed about 231,200 nautical square miles of the continental shelf and slope. A statistical block (or reporting region) defines a geographic area that is used for reporting the location and duration of individual trawl tows during a given time period. The statistical block may be based on a grid or other feature, and often varies in size among regions (Table 4.1). Trawl fishing effort, as monitored by various national and international fisheries agencies, is normally defined as the number and duration of tows (drags) made in a particular area (statistical block or region), over a specified period. Effort data is frequently reported as the number of tows per area, along with information on tow duration. In the Gulf of Mexico and along the northeastern Atlantic seaboard, the trawl effort is reported as the number of 24-hour fishing days (excluding steaming time). In the Pacific regions the number of tows and the associated towing time is logged. The regional differences in gear and in effort reporting methods and the variation in the geographic resolution of the effort data make exact comparisons among regions unrealistic. Furthermore, the estimates in Table 4.1 of the total number of tows have been extrapolated in all areas from observer data, log books, shore side vessel sampling, and other sources.
For a given area or region it is nevertheless possible to calculate the potential area swept by dragged gear using the sum of the approximate area covered by individual tows. This calculation provides an upper estimate of the coverage of a reporting area by trawl or dredge gear, or assuming that the individual tows are evenly distributed throughout the area. However, some tows in a statistical block may overlap or be concentrated in one portion of the reporting area (Figure 4.4). If tows are clustered in a fraction of the statistical block, the swept area will be smaller, but the intensity of effort will be higher in the subarea where fishing is concentrated.
Because effort data have not been collected continuously, it is impossible to compare regions for any given year. However, data collection at various times during the 1990s for four of the six fishery management regions with significant trawl or dredge fisheries has allowed the trawl and dredge effort to be mapped by statistical reporting areas for that period. Appendix B contains detailed descriptions and maps of the bottom trawl and dredge effort data for major fisheries. The swept area estimates in Table 4.1 are based on the intensity of effort in defined statistical areas in the fishery management regions based on available data. Even though the existing effort data precludes precise comparisons, estimates of the frequency of effort per unit area suggest that, at times during the 1990s, the highest intensity of trawling occurred in the Gulf of Mexico and New England.
In response to the collapse of the groundfish stocks in New England, managers instituted effort controls and closed three large areas to trawl and dredge gear in 1994. In 1999, a fraction of the closed areas were opened for limited scallop dredging when surveys indicated that the closed areas contained abundant beds
TABLE 4.1 Estimated Fishing Density by Region
|
Region |
Total Statistical Blocks Fished |
Block Area (nm2) |
Total Area Fished (TAF) (nm2) |
Total Tows |
Swept Area (nm2) |
Percentage TAF Swept/ Year |
Percentage of Statistical Blocks Swept More Than Once/Year |
Gear Type |
Observed Years |
|
New Englanda |
561 |
71.7 |
40,168 |
NA |
46,193 |
115 |
56 |
bottom trawl |
1993 |
|
Mid-Atlanticb |
44 |
704.7 |
31,007 |
NA |
11,925 |
38 |
5 |
bottom trawl |
1985 |
|
Southeast U.S. |
NA |
NA |
NA |
NA |
NA |
NA |
NA |
NA |
NA |
|
Gulf of Mexicoc |
210 |
variable |
78,629 |
902,885 |
200,588 |
255 |
57 |
shrimp trawl |
1998–1999 |
|
Alaska |
|||||||||
|
Bering Sead |
3,791 |
7.3 |
27,632 |
17,688 |
15,724 |
57 |
<2 |
bottom trawl |
1998–2000 |
|
Aleutian Islandse |
711 |
7.3 |
5,168 |
3,650 |
2,974 |
58 |
3 |
bottom trawl |
1998–2000 |
|
Gulf of Alaskaf |
1,553 |
7.3 |
11,320 |
8,640 |
5,120 |
45 |
1 |
bottom trawl |
1998–2000 |
|
West Coast |
|||||||||
|
Californiag |
264 |
78.3 |
20,671 |
15,535 |
6,902 |
33 |
14 |
bottom trawl |
1994–1996 |
|
Oregon & Washingtong |
373 |
71.7 |
26,744 |
11,487 |
5,104 |
19 |
5 |
bottom trawl |
1998–1999 |
|
Oregon & Washingtonh |
143 |
71.7 |
10,253 |
10,108 |
2,246 |
22 |
5 |
shrimp trawl |
1997–1999 |
|
Oregon & Washington |
373 |
71.7 |
26,744 |
21,595 |
7,350 |
27 |
NA |
bottom & shrimp trawl |
1997–1999 |
|
aData from Pilskaln et al. (1998) and NMFS data from 1991–1993. bData from Churchill (1989) and NMFS data from 1991–1993. cAssumes 5 tows/fishing day, door spread of 150 ft., and 9 nm/tow. dAssumes observed tows equal 0.75 actual tows, door spread of 600 ft., and 9 nm/tow; total tow distributed proportionally to observed tows. eAssumes observed tows equal 0.75 actual tows, door spread of 550 ft., and 9 nm/tow; total tow distributed proportionally to observed tows. fAssumes observed tows equal 0.40 actual tows, door spread of 400 ft., and 9 nm/tow; total tow distributed proportionally to observed tows. gAssumes door spread of 300 ft. and 9 nm/tow. hAssumes door spread of 150 ft. and 9 nm/tow. NOTE: Relative intensity of trawling between regions based on assumptions regarding area swept, estimated total fishing area, and total number of trawl tows (used with permission from Natural Resource Consultants). NA indicates that data were not available. |
|||||||||
of large scallops (Box 6.2). However, the only fishing effort data available for that region were collected before the areas were closed. In 1993, estimates of the percentage of statistical areas swept in New England waters indicated that the effort in some areas could have swept the grounds more than four times a year, and the effort in many statistical cells resulted in swept area estimates exceeding 100 percent of the block area.
Bottom trawling off the southeastern United States and in the Gulf of Mexico is for the most part concentrated in waters <20 m deep and close to shore. Trawling in the Pacific, North Pacific, and New England regions is directed primarily at groundfish and pandalid shrimps; bottom trawling in the Gulf of Mexico and off the southeastern states is directed primarily at various warmwater shrimp species, with some seasonal effort directed at crabs or scallops. The fishing gear used to harvest shrimp is lighter than that used for most groundfish.
Data from the Gulf of Mexico show the average number of 24-hour fishing days in the region exceeded 200,000 annually from 1991 to 1999, averaging more than 4 million fishing hours per year. The data strongly suggest that the number of bottom trawl hauls per year (assuming five tows per 24-hour fishing day) in many of the statistical areas exceeded the bottom trawl effort off Alaskan coast, the contiguous Pacific states, or the New England region. The relatively large total area fished given in Table 4.1 for the Gulf of Mexico is partially an artifact of the division of the Gulf into 21 large fishing areas, some of which have very little effort. If the data were resolved into smaller statistical blocks, the total area fished would be much smaller and the percentage of the area swept per year would be
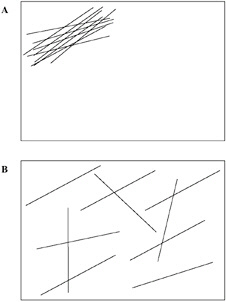
FIGURE 4.4 A) Trawl tracks concentrated in a favored fishing spot. B) Trawl tracks distributed throughout a reporting block.
higher in some blocks and lower in others. Local scientists have estimated that, from 1991 to 1999, some subareas in the Gulf of Mexico may have been swept more than 70 times a year.
In Alaska, the closure of several large areas has restricted trawling to a smaller portion of the total shelf and upper slope area. For example, in 1999–2000 trawling occurred in only 14 percent of the 702,898 km2 area comprising the Bering Sea shelf and upper slope (National Marine Fisheries Service, 2001a). During the same period, 13 percent of the Gulf of Alaska waters (total area, 310,757 km2) and 30 percent of the Aleutian Islands waters (total area, 59,124 km2) were fished with bottom trawl or dredge gear. Currently, about 310,500 km2 are closed year round to trawl gear in state and federal waters off Alaska (Figure 4.5).
The amount of bottom trawling declined significantly off Alaska, Oregon, Washington, and in the Gulf of Mexico between the early 1990s and later in the decade (Figure B.38). Although the effort data have not been collected in recent years, this pattern is also likely for bottom trawling off the Atlantic coast as a result of more restrictive regulations during the late 1990s. Reductions in effort have followed declines in stock levels, closure of areas to trawling, and other management measures (Pacific Fishery Management Council, 2000).
Socioeconomic data are important in the evaluation of management alternatives that shift effort, gear, or fishing location. Selected fleet characteristics, including the number of vessels, crew sizes, and landed catch value for each fishery in each region of the United States, are summarized in Table 4.2. Trawl and dredge gears catch the majority of the food fish landed in the United States, and the fisheries employ thousands of people at sea and shoreside, including those who work in support services in coastal communities. The summary in Table 4.2 represents the best estimates based on existing data, but there is considerable variation in the availability and type of data collected for the different regions.
Because of the heterogeneity within and among fisheries, the costs and benefits of different management options will be borne differentially by fishery participants and their communities. For example, the economic consequences of gear modifications will be significantly different for small vessel, lower volume fisheries than for larger operations. Also, area closures have disparate effects on fishing communities and fishery participants, depending on the size and proximity of the closures and the characteristics of the fleet. Area closures can create safety problems as well as economic change, especially for smaller or less seaworthy vessels that must travel to more distant fishing grounds. It is important to acknowledge, however, that management alternatives also must be evaluated in terms of broader societal values and goals.
REGIONAL FISHERIES
New England: Maine to Connecticut
Fishery Descriptions: Groundfish Trawl, Northern Shrimp Trawl, Scallop Trawl, Scallop Dredge, and Clam Dredge
Trawling has been a dominant fishing method in the New England region for nearly a century. For many
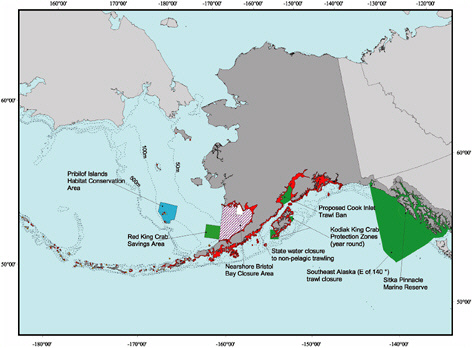
FIGURE 4.5 Year-round trawl closures areas in Alaska (Coon, 2001).
years, trawlers working the continental shelf from New York north to the Grand Banks made most of the nation’s groundfish landings. The region is known for catches of cod, haddock, various flounders, and redfishes. The groundfish trawl fishery historically has been particularly important to New Bedford, Gloucester, and Chatham, Massachusetts; Portland, Maine; and Point Judith, Rhode Island (Aguirre International, 1996). These ports are home to highly specialized fleets. There were 748 federally permitted groundfish trawlers in the northeast to mid-Atlantic region (Maine to Cape Hatteras, North Carolina) in 1999. Trawling for northern shrimp also occurs seasonally in the Gulf of Maine, and there are 175 federally permitted vessels in that fishery.
The scallop fishery in 2000 was the most valuable in the region. New Bedford is a major scallop port, producing 55 percent of scallops landed in the New England and mid-Atlantic regions (New England Fishery Management Council, 2000). There were 278 federally permitted scallop dredge vessels in the northeast region in 1999, and most of the permit holders have home ports in Massachusetts. Scallops are dredged and trawled; dredging accounts for approximately 80 percent of all landings from Connecticut to Virginia and is favored over trawling in New England. The fishery is seasonal: 90 percent of landings occur from June to November, regulated through a combination of trip limits and days-at-sea. Most scallopers participate in other fisheries, for monkfish, squid, dog-fish, quahog, and summer flounder.
TABLE 4.2 Characterization of Trawl and Dredge Fisheries by Region
|
Catch |
||||||
|
Region |
Fishery |
Pounds |
Ex Vessel Value |
Crew Size |
Number of Vessels |
Vessel Size |
|
New England: Maine to Connecticut |
Groundfish trawl |
178,582,212 |
$132,230,808 |
2.1–6.6a (1) |
748 (2) |
45-100 ft. (2) or <5–>150 GRT (1) |
|
Northern shrimp trawl |
3,483,277 |
$3,194,151 |
2.0–3.2b (1) |
175c (1) |
< 5–150 GRT (1) |
|
|
Scallop trawl |
48,280 |
$79,649 |
|
|
|
|
|
Scallop dredge |
23,543,729 |
$86,312,085 |
2–7 (1, 3) |
278 (1) |
5–>150 GRT (1) |
|
|
Clam dredge |
20,193,963 |
$10,927,752 |
2.6–4.7c (1) |
40 (1) |
5–>150 GRT (1) |
|
|
Other mobile bottom gear |
10,347,590 |
$4,622,331 |
|
|
|
|
|
Mid Atlantic: New York to Virginiad |
Finfish bottom trawl |
72,755,587 |
$35,573,699 |
2.2–7.5d (1) |
|
5–>150 GRT (1) |
|
Scallop trawl |
837,156 |
$3,665,629 |
|
|
|
|
|
Scallop dredge |
2,787,196 |
$11,627,885 |
2–7 (1, 3) |
278 (1) |
5–>150 GRT (1) |
|
|
Clam dredgee |
66,476,284 |
$32,749,880 |
3.0–4.7d (1) |
40 (1) |
|
|
|
Other mobile bottom gearf |
1,798,008 |
$2,492,792 |
|
|
|
|
|
South Atlantic: North Carolina to Eastern Florida |
Shrimp trawl |
31,854,928 |
$77,802,322 |
3g |
2,400 (5) |
50–70 ft. (5) |
|
|
|
|
3–4h (4) |
401 in 2000 and 133 in 1999 (4) |
60–79 ft. (4) |
|
|
Calico scallop trawl |
1,557,751 |
$1,724,468 |
2–6 (6) |
26 fulltime and 40–50 parttime (6) |
65–100 ft. (6) |
|
|
Finfish bottom trawl |
10,601,327 |
$7,395,026 |
|
|
|
|
|
Gulf of Mexico: Western Florida to Texas |
Shrimp trawl |
208,740,073 |
$439,654,593 |
1–3 (7) |
3,598 (offshore) |
25–85 ft. |
|
Calico scallop trawl |
2,022,918 |
$1,721,757 |
|
|
56 ft. (mean) |
|
|
Finfish bottom trawl |
8,271,722 |
$921,578 |
|
|
|
|
|
Pacific: California, Oregon, and Washington |
Shrimp trawl |
29,979,426 |
$17,964,667 |
2–3 (OR) (8) |
83i (CA) (9), 121 (OR), and 14 (WA) (10) |
45–85 ft. (8, 11) |
|
Groundfish trawl |
269,144,143 |
$58,877,066 |
2–3 (12) |
397 (13) (in 1997) |
63 ft. (mean) (in 1997) |
|
|
North Pacific: Alaska |
Finfish bottom trawlj (14) |
875,266,000 |
$103,800,000 |
3–16 |
202k |
56–155 ft.l |
|
Scallop dredge (15) |
837,934 |
$2,982,760 |
|
10 |
90 ft. (mean) |
|
|
Shrimp beam and otter trawlm (10) |
2,306,689 |
$859,133 |
|
21 beam and 5 otter (15) |
|
|
|
NOTE: The data have been aggregated from various sources and represent values for the 1999 fisheries unless otherwise indicated. Differences in data collection by local management agencies limit regional comparisons. For example, vessel size is measured by length in some areas and tonnage in others. These data are presented to provide the reader with an overview of the variety of trawl and dredge fisheries that operate in the United States. GRT means gross registered tons. SOURCES: Landings by gear type for 1999 were taken from the NMFS commercial fisheries statistics database unless otherwise indicated (www.st.nmfs.gov/st1/commercial/landings/annual_landings.html). 1 = National Marine Fisheries Service, 2001b; 2 = Aguirre International, 1996; 3 = New England Fishery Management Council, 2000; 4 = South Atlantic Fishery Management Council, 2001; 5 = South Atlantic Fishery Management Council, 1996; 6 = South Atlantic Fishery Management Council, 2000; 7 = Thomas et al., 1995; 8 = Good et al., 1987; 9 = Thomson, 2001; 10 = Pacific States Marine Fisheries Commission, 1999; 11 = Leet et al., 1992; 12 = Pacific States Marine Fisheries Commission, 1998; 13 = Radtke and Davis, 2000; 14 = Hiatt et al., 2001; 15 = Alaska Department of Fish and Game, 2002. |
||||||
Effort Distribution and Intensity
Fishing effort in the New England region was analyzed based on port agent interviews and port landings, for the period 1991–1993. The effort data for various regions of the U.S. are reported in detail in Appendix B. During the early 1990s extensive areas of the continental shelf, extending east from 71°W longitude and including all of southern New England, Georges Bank, and the Gulf of Maine, were heavily trawled. In 1993, the 0.5° statistical blocks used for reporting effort were swept 2–4+ times by bottom trawls. On average, 56 percent of the region was swept more than once a year by trawl fishing gear. Analysis of similar data for the scallop dredge fishery indicates that effort is lower than in the trawl fishery, although scallop dredges cover an extensive area (Figure B.4). Effort data for this region in the late 1990s are unavailable, so it is not possible to analyze the effect of the area closures and effort reductions on the swept area estimates.
Mid-Atlantic: New York to Virginia
Fishery Descriptions: Mixed Finfish Trawl, Scallop Trawl, Scallop Dredge, Surf Clam Dredge, Winter Blue Crab Dredge (Estuarine), and Oyster and Clam Dredge (Estuarine)
Many areas of the mid-Atlantic region were fished before the 20th century. The region, often called the Middle Atlantic Bight, extends from Cape Hatteras to Cape Cod. Included are many large rivers and the Chesapeake Bay, the largest sheltered body of saltwater in the United States. The width of the continental shelf in this region varies from 30 miles in the south to 150 miles in the north. Most of the region’s fisheries are relatively close inshore and include oyster, clam, crab, and menhaden. Trawling also occurs in this region for groundfish, scallops, and shrimp.
In mid-Atlantic estuarine waters, dredges are used to catch clams, oysters, conch, and crabs. Scallops and clams are the most economically important of the mobile bottom gear fisheries in the region; clams because of the high volume landed and scallops because of their high market value. Many scallopers in this region work part-time (New England Fishery Management Council, 2000). Unlike the New England fishery, in the mid-Atlantic region, scallop landings from trawling almost equal those from dredging. There are major scalloping areas offshore from the Delmarva Peninsula and the New York Bight that are second only to Georges Bank. Norfolk, Virginia accounts for 24 percent of landings from Connecticut to Virginia; Cape May, New Jersey accounts for 9 percent. Scallops fishing in the mid-Atlantic region is managed jointly with the New England Council, falling under the same days-at-sea and trip limit regulations. As in New England, the mid-Atlantic fishery is seasonal. About 80 percent of landings occur from May to August, so fishermen work in other fisheries to stay employed year round.
Trawling for groundfish is an important part of the local economy in many mid-Atlantic communities. In 1998, groundfish accounted for 86.8 percent of landed value in Freeport, New York; 74 percent in Shinnecock and Hampton Bays, New York; 59.9 percent in Montauk, New York; 50 percent in Belford, New Jersey; and 70
percent in Cape May, New Jersey (McCay and Cieri, 2000).
The surf clam and ocean quahog fisheries have operated under an individual transferable quota system since 1991. Since the 1970s, vessel sizes have increased steadily, and the number of vessels has decreased. There were 40 federally permitted vessels in the fishery in 1999. There are generally two ownership patterns: independent and processor owned (McCay and Creed, 1990). Independent vessels are based primarily in New Jersey. The largest processor fleets are in Maryland and Virginia.
Effort Distribution and Intensity
Fishing effort in the mid-Atlantic region was analyzed based on port agent interviews and port landings for 1991–1993. Details are reported in Appendix B. It appears that extensive areas of the mid-Atlantic continental shelf region were lightly trawled during this period as compared with the New England region. In 1985, 95 percent of the 0.5° statistical blocks were swept less than once a year by bottom trawls, and, on average, only 12 percent of the region’s seabed was swept in 1985. Analysis of similar data for the scallop dredge fishery indicates that the effort also was considerably less intense than in New England; no statistical areas were swept more than once a year.
South Atlantic: North Carolina to Eastern Florida
Fishery Descriptions: Shrimp Trawl (Estuarine and Coastal), Crab and Fish Trawl (Estuarine), Rock Shrimp Trawl, Clam Dredge, and Calico Scallop Trawl
The South Atlantic region extends from North Carolina to the Florida Keys. Although this region is extensively trawled, almost all of the effort is carried out within shallow, inshore state waters and frequently within the sheltered waters of estuaries. For example, the North Carolina estuarine area is the largest of any in the Atlantic states, including more than 2.1 million acres of open water and almost 200,000 acres of wet-lands. The protected inshore system is shallow, with an average depth of 3–4 m and otter trawls are used to catch shrimp and crab in North Carolina’s estuaries. Between the Civil War and World War I, shrimp were caught with dip nets and seines. The first otter trawls were brought to the region in 1912. As early as 1925 more than 300 North Carolina fishermen were engaged in the shrimp trawl fishery. It currently has more than 2000 participants. Close to 70 percent of the shrimp caught in or off North Carolina are taken in estuarine waters. Penaeid shrimp species are the region’s most important mobile bottom gear fishery in terms of landings, employment, and ex-vessel value. South Carolina and Georgia fishermen primarily land white shrimp and have modified their trawls to fish off the bottom.
The Florida fishery is concentrated in the northeastern part of the state. It targets brown shrimp in the summer and white shrimp in the fall and winter. Most of the shrimping effort occurs in state waters (three miles on the east coast and nine miles on the west coast of Florida). Roller frame trawls are used to catch juvenile shrimp in seagrass beds to supply the recreational fishery with live bait. Rock shrimp and calico scallops also are trawled. Primary fishing grounds are hard sand, shell, and hash, but sometimes include corals. To reduce habitat damage to submerged corals, the South Atlantic Fisheries Management Council has recently expanded the habitat areas of particular concern for the Oculina Banks (South Atlantic Fishery Management Council, 2001) excluding trawling in this area. Additionally, the Council proposed a limited entry program for rock shrimp vessels. The rock shrimp season is from July through October, and most participants also fish for penaeid shrimp.
Historically, South Atlantic scallopers have used both dredges and trawls, although the fishery has been a trawl fishery exclusively since 1973 (South Atlantic Fishery Management Council, 2000). A directed fishery has been difficult to maintain because of fluctuating landings: some areas are productive one year and depleted the next. Consequently, with the exception of eastern Florida, scalloping historically has been a secondary fishery for bay shrimpers. Employment varies widely depending on stock abundance. In a good year, the income derived from scalloping can be as high as 75 percent of fishing-related income. There is currently one processor vessel. Virtually all landings occur in Florida, although fishermen and boats are concentrated in Florida and North Carolina.
Effort Distribution and Intensity
Quantifying the distribution and intensity of the mobile bottom contact fishing gear effort in the South Atlantic region is difficult because of the lack of comprehensive data (Appendix B). Most of the trawling and dredging occurs in state waters, if it occurs at all,
and each state uses different methods of data collection, if and when data are available. Recently, this region has agreed to develop standardized reporting methods for trawling in both state and federal fisheries. In one 1995 data set from North Carolina, a localized, special inshore shrimp management area was documented to be swept more than 4 times by shrimp trawl gear. Most of the continental shelf off the North Carolina shore is hard rocky bottom inhabited by the snapper–grouper complex of fishes, but because North Carolina regulations prohibit trawl and dredge fishing vessels from possessing fish in this complex no effort is reported in this area.
Gulf of Mexico: Western Florida to Texas
Fishery Descriptions: Shrimp Trawl, Oyster Dredge (Estuarine), and Calico Scallop
Although there have been small-scale trawl fisheries targeting fish for food and industrial purposes in the Gulf, almost all bottom trawling currently is directed at various species of shrimp. Trawling is reported to have begun in the Gulf of Mexico around 1915, when shrimp seines were rapidly replaced with trawls (Shapiro, 1971). Following the introduction of trawling in the region, shrimp fisheries spread rapidly and by 1950 became Gulf-wide (Sheridan, 2001). Today, Texas, Louisiana, and Florida are home to largest shrimp fleets in the region (Adams, 1996). The Gulf shrimp fleet consists of relatively small boats, the average being 20 m. On average, captains have worked for more than 20 years in the fishery and almost half hire at least one relative as crew (Thomas et al., 1995). They work an average of nine months a year, making six trips a month, thereby specializing in shrimping (Thomas et al., 1995). In addition to the large directed shrimp fishery in the Gulf, there is also directed trawl and dredge fishing for scallops. All scallops are landed in Florida.
Effort Distribution and Intensity
The Gulf of Mexico trawling effort almost exclusively targets shrimp (Appendix B). The shrimp trawl fleet operates extensively throughout the Gulf, from nearshore to water depths of 90 m. The major areas of concentrated effort are middle depths off Florida, middle depths off Mississippi and Alabama, shallow depths off Louisiana (west Delta), and shallow and mid-depths off west Texas. During the 1990s, the shrimp fleet is reported to have averaged 204,000 24-hour fishing days, or about 4.9 million hours per year. For the period 1998–1999, this equates to the fished areas being swept more than 2.55 times annually, with 57 percent of the area being swept more than once annually. Comparing the periods 1991–1993 and 1998–1999, shrimp trawl effort has declined 41 percent, but it is reported that some localized areas in the Gulf of Mexico are swept 37–75 times per year.
Pacific: California, Oregon, and Washington
Fishery Descriptions: Finfish Trawl (Sablefish, Flatfish, Whiting, and Rockfish), Shrimp Trawl, and Sea Cucumber Trawl (California)
The trawl fisheries off California, Oregon, and Washington began early in the 20th century, generally in areas close to large population centers, such as Los Angeles, San Francisco, Portland, and Seattle. They have historically been conducted along the narrow continental shelf region that extends 20–30 miles off shore. The early fisheries were carried out in the shallow regions at depths of less than 100 m, but fishing extended into deeper waters as vessel size and horsepower increased, fishing methods and navigational aids improved, and the markets for a diversity of species expanded. Currently, most trawling occurs on the continental shelf at depths ranging from 15 m to more than 1000, with the vast majority between 15 m and 500 m.
Along the western U.S. coast, shoreside groundfish landings increased by 12 percent from 108,500 metric tons to 121,500 metric tons during 1983–1999, while shoreside ex-vessel revenues (in 1999 dollars) decreased by 47 percent from $100.2 million to $52.9 million (Pacific Fishery Management Council, 2000). These divergent trends were primarily the result of an increase in the landings of low-value Pacific whiting and a decrease in landings of high-value species, such as rockfish and flatfish. The abundance of many of the many groundfish stocks, with the exception of whiting, declined in the 1990s, and more restrictive fishery management measures have been imposed in an attempt to rebuild these groundfish stocks.
Groundfish yield both the highest value and the most landings for the mobile bottom gear fisheries. It operates under a limited-entry system and is managed with a combination of control strategies including trip limits and area closures. From the time that limited entry was instituted in 1994 through 2000, the trawl fleet declined
by about 15 percent. The fleet is diverse in fishing patterns and in economic characteristics.
Oregon’s Trawl Fisheries
In 1998, Oregon’s commercial groundfish landings totaled 90,298 m, with an ex-vessel value of $23 million (Pacific States Marine Fishery Commission, unpublished report). Pacific whiting constituted 81 percent of these landings, with the remainder consisting mainly of flatfish, rockfish, and sablefish. The groundfish fishery is important to coastal communities, particularly Newport and Coos Bay.
The Oregon shrimp fishery is an important trawl fishery. Landings have cycled between 5 million and 10 million pounds (early 1970s, mid 1980s, late 1990s) and 45 million to 57 million pounds (late 1970s, late 1980s to early 1990s) since the late 1960s. Most harvests are taken off the central and northern Oregon coast, and shrimp landings are particularly important to the ports of Astoria and Tillamook.
Washington’s Trawl Fisheries
In Washington State the seafood industry is important to several areas, mainly Ballard, Port Townsend, and Anacortes. There has been growth in the factory trawler sector that participates in the Alaska fishery as well as in whiting fisheries. Factory trawlers primarily home port in the Seattle area, and the smaller groundfish vessels come from other ports in northern Puget Sound. About 95 percent of the groundfish catch (by weight) for the Washington State fleet comes from Alaskan waters, mostly from the trawl fisheries (Natural Resource Consultants, 1999).
California’s Trawl Fisheries
California’s trawl fisheries began using the otter trawl in 1946 (Starr et al., 1998) and grew substantially after passage of the Magnuson-Stevens Act. Although groundfish landings have declined since 1981, they accounted for the state’s highest average annual ex-vessel revenue by species group for the period 1995– 1999 (Thomson, 2001). Together, shrimp and prawn ranked sixth and seventh in annual average revenue and weight landed for the same period. The minor sea cucumber fishery, located in southern California, accounts for a small proportion of California’s fishery landings and revenues.
Patterns of fishery participation and dependence vary within and across California’s three regions (Thomson, 2001). Thomson (2001) reports that an annual average of 29, 41, and 11 vessels participated solely in the groundfish trawl fishery in Northern, Central, and Southern California, respectively, between 1995 and 1999. Other fisheries in which groundfish trawl fishery participants take part include shrimp, prawn trawl, or crab pot fisheries in Northern and Central California. Trawl fisheries in Southern California are seldom pursued in combination with other gear types (Thomson, 2001). Mobility among regions, and in many cases among states, is critical to many California fishermen. For example, shrimp trawlers in Northern California earn more revenue from their out-of-state landings than their California landings (Thomson, 2001).
These characteristics of the California fisheries help explain the variability typical in fishing operations within and among fisheries. They also aid the consideration of opportunities, constraints, and potential responses to fishery management action. Those vessels that work a single fishery or gear, for example, could be less able to adapt to gear modification or reallocation of allowable catch to other gear types. Those who focus their effort in a single region are more vulnerable to local area or species closures than are those who fish in multiple regions. Operations that are more geographically diversified can intensify effort in one location if others are closed. Finally, although detailed information is lacking, bottom trawling supports not only the fishing operations—vessels and skippers, crews, and families—but also the people and businesses in coastal communities that receive and process their fish and provide support services (fuel, equipment, repair, and maintenance).
The groundfish fishery has recently been subject to severe regulatory restrictions that have widened the gap between harvest capacity and available harvest, thereby creating economic hardship for fishery participants, fishing households, and communities and greatly complicating monitoring and management of the fishery (Thomson, 2001).
Effort Distribution and Intensity
Information about the trawling effort off the coasts of California, Oregon, and Washington was provided by Natural Resources Consultants, the California Department of Fish and Game, the Oregon Department of Fish and Wildlife, and the Washington Department
of Fish and Wildlife. Data from Oregon and Washington cover the periods 1991–1993 and 1998–1999; those from California cover 1994–1996. The major bottom trawled grounds in Washington were off Cape Flattery and to the southwest and from Westport to the Columbia River. The grounds off southern Washington were fished relatively heavily by vessels from Washington and Oregon ports. Off Oregon, the trawl fisheries are concentrated off major fishing ports such as Astoria, Newport, and Coos Bay. Important trawl grounds off California are, for the most part, found from Monterey north to the Oregon border, with relatively intense fishing between Santa Cruz and San Francisco and between Cape Mendocino and Crescent City. Two relatively heavily fished sites are also reported off Grover City and Ventura in southern California. State regulations prohibit trawling in state waters (3 nautical meters from shore) and on the continental shelf south of El Segundo to the Mexican Border; however, some trawling occurs on offshore banks in Southern California.
The intensity of trawling off the contiguous west coast states appears relatively similar for the three states, with slightly higher effort occurring off Oregon. (Note that the years for which data have been summarized for Washington, Oregon, and California differ.) The average number of tows per year off California from 1994 to 1996 was 15,535. It is estimated that there was a 60 percent reduction in effort between the early and late 1990s, because of declines in the abundance of target species and the subsequent Pacific Fishery Management Council reductions in quotas and fishing time. It is estimated that, during the mid 1990s, an average of 15 percent of the California shelf and slope area fished was swept more than once a year; 85 percent was swept less than once a year. Off the coasts of Oregon and Washington, during the late 1990s, 6 percent of the continental shelf and slope area fished was swept more than once a year; 94 percent was swept less than once a year (Figures B.35 and B.36).
A significant trawl effort also occurs off the three Pacific coast states for pink shrimp. The most intense fishing effort occurs off Oregon in the vicinity of Coos Bay, between Seaside and Garaibaldi, and off Pacific City. On average, about 10,000 shrimp tows per year were reported for areas off Oregon and Washington between 1997 and 1999.
North Pacific: Alaska
Fishery Descriptions: Finfish Bottom Trawl (Flounder, Yellow Fin Sole, Rock Sole, Rockfish, Atka Mackerel, and Cod), Scallop Fishery Dredge, and Shrimp Trawl (Otter and Beam)
The continental shelf and slope region off the coast of Alaskan coast constitutes one of the most extensive fishing grounds in the world. Bottom trawling in the Bering Sea began in 1929 with a Japanese exploratory operation; commercial operations began during the 1930s and early 1940s. Although these activities were terminated during World War II, they began again in the early 1950s (Alverson et al., 1964).
In the late 1950s, a large Soviet fleet entered the Bering Sea. Between 1960 and 1970, distant water bottom trawl fishing operations, conducted by several nations, intensely fished the Bering Sea and Gulf of Alaska. By the 1970s, foreign operations dominated bottom fishing on the continental shelf and slope in the Bering Sea and Gulf of Alaska. Domestic bottom trawling began with joint ventures in the Bering Sea in 1978 after passage of the Magnuson-Stevens Act in 1976. U.S. trawl activities in the Bering Sea and Gulf of Alaska grew rapidly during the 1980s, and, by the end of the decade, they had displaced foreign fisheries.
The most important trawl fisheries in Alaska in terms of total ex-vessel value, landings, and employment are for groundfish, which constituted 51 percent of the ex-vessel value for Alaskan fisheries in 2000. Bottom trawling provided 21 percent of the ex-vessel value—the major species are Pacific cod and flatfish (Hiatt et al., 2001). Pollock is the major groundfish species caught by trawl gear as measured by weight (71 percent in 2000) and value (65 percent in 2000), but in 1990 most of the catch (88 percent) was allocated to pelagic gear and by 1996 only 2 percent of the catch was caught by bottom trawl. In 1999, the use of bottom trawl gear was prohibited in the pollock fishery. Therefore, the pollock fishery is not included in this analysis.
In 1998, fishing cooperatives were introduced that use contractual agreements to manage catch and bycatch allocations between fishery sectors. The groundfish fleet is divided into catcher vessels and
catcher processors, and in 1999, the catch is almost evenly divided between the two sectors (National Marine Fisheries Service, 2001c). There are 202 catcher vessels, most 18–37 m long (Hiatt and Terry, 1999). These vessels must carry the National Marine Fisheries Service observers 30 percent of the time. There are 40 catcher–processors ranging from 41 m to 130 m—most are longer than 54 m—that have 100 percent observer coverage (Hiatt and Terry, 1999). There are three “mother ships” that are longer than 133 m. Ownership of the groundfishing fleet is mixed; some vessels are owned by individuals, some by limited partnerships, and others by processing companies.
The state of Alaska manages the weathervane scallop fishery under the auspices of a federal fishery management plan that implements a license limitation program. The fishery is prosecuted by catcher– processor vessels that, with the exception of a few small vessels in Cook Inlet, are required to carry observers. The state of Alaska also manages shrimp fisheries throughout state and federal waters. Catches are taken mostly by otter trawl, beam trawl, and pot gear. The open-access shrimp fisheries currently have few participants because of low shrimp abundance, except in Southeast Alaska where more stable fisheries under a state-run limited entry program have sustained higher participation.
Effort Distribution and Intensity
The analysis of the intensity and distribution of fishing effort in the North Pacific was divided into three areas: the Bering Sea, the Gulf of Alaska, and the Aleutian Islands. The effort data include only trawl tows sampled by observers. Observer coverage includes 100 percent of the vessels longer than 38 m, and 30 percent of the 22–41 m vessels. Data were unavailable for vessels less than 22 m. Although the database is not complete, it is roughly representative of the spatial distribution and temporal changes in intensity.
Bottom trawling in the Bering Sea during the early 1990s was most intense on the slope and shelf area north of the Aleutian Islands and the Alaska peninsula in the vicinity of Unimak Island, east of the Pribilof Islands, west of Bristol Bay, and off Cape Constantine (Appendix B). Large areas of the Bering Sea appear to have no trawling activity because of closed management areas, less productive fishing grounds, or unobserved tows. Both the spatial extent and the intensity of fishing effort decreased significantly in the 1990s. Between 1998 and 2000, 57 percent of the total area monitored was swept annually by bottom trawl gear; less than 2 percent of the area was swept more than once a year. The Gulf of Alaska experienced considerably less trawling activity than did the Bering Sea during the 1990s, and there were significant reductions in the geographic extent and the intensity of trawling in the Gulf of Alaska. The number of observed tows in the region was reduced by about half because of management area closures and because of general reductions in fishing effort associated with fisheries management. Bottom trawling off the Aleutian Islands extends from Unimak Island to 168°E longitude. The intensity of trawling was relatively light compared with the Bering Sea during the 1990s, and there was about a 40 percent reduction in observed effort during that decade.
CONCLUSION
Domestic trawl and dredge fisheries are conducted along most of the continental shelf and slope adjacent to the United States, although the level of fishing effort, and hence the amount of area affected, varies widely by region and by the spatial distribution of the fishing grounds. Groundfish trawls dominate the Alaska, Pacific coast, and New England fisheries; shrimp trawling is the major fishery in the Gulf of Mexico and in the coastal southeast Atlantic.
Over the past decade, management measures in some regions have closed areas to dragged gear to reduce gear conflicts, bycatch, or fishing mortality. Severe stock declines in some trawl and dredge fisheries have resulted in an overall reduction in bottom fishing effort. Although some areas of New England and the Gulf of Mexico are swept frequently, much of the continental shelf and slope area is trawled infrequently (less than one tow per year) if at all.


