
3
Data on System Performance: Trends and Case Studies
As explained in Chapter 1, the committee relied on four kinds of information to support its conclusions: aggregate trends and projections regarding traffic volumes, infrastructure development, and system performance; case studies of freight projects and planning efforts; interviews with participants in the freight transportation industries; and a review of the conclusions of past studies of related transportation policy questions. Findings from the first three of these sources are summarized in this chapter; conclusions from the review of past studies were presented in Chapter 2.
TRENDS IN TRAFFIC, INFRASTRUCTURE, AND PERFORMANCE
Historical data on freight traffic, infrastructure development, and freight transportation system performance are summarized in the sections below. The presentation is organized in seven topical areas: highway trends; railroad industry trends; problems related to congestion at freight terminals and border crossings; the long lead times and rising costs of infrastructure projects; trends in congestion in urban areas, especially on facilities shared by passengers and freight; trends in other freight modes; and underlying trends in productivity, finance, and technology. The first five of these topics parallel the perceived developments identified in Chapter 1 as having been instrumental in shaping industry and public views on freight capacity problems. The degree of consistency of the aggre-
gate trend data with these perceptions and the extent to which the data support judgments about the nature and severity of freight capacity problems are examined in this section.
The public policy questions regarding freight capacity are whether public investment in additional capacity is justified, public infrastructure is efficiently managed, and government policies are hindering private-sector investment and management. The answers to these questions depend on whether total costs would be lower at a different scale of the physical plant or with different management practices. Therefore, performance measures are required that indicate the costs of capacity constraints and hence the benefits of expansion (which may include reduced congestion, lower freight rates, or lower accident or environmental costs). Performance measures that could be useful for this purpose include carrier costs and prices and shipper delays. Some performance data are presented below, but readily available information is limited.
Trend data on traffic and investment are, by themselves, insufficient as guides to policy. For example, a declining ratio of capital stock in an industry to the output of the industry does not necessarily indicate that the rate of investment is too low, but may rather reflect productivity growth.
A further inadequacy of the aggregate data is that capacity constraints in transportation systems typically are local. The average link at an average time period may be operating well below capacity even if the performance of the system as a whole is hampered by problems at local bottlenecks during peak periods. Local problems can have a severe impact on a network transportation system such as an airline or a railroad. Problems at a hub airport or rail center can quickly spread hundreds or thousands of miles from the source. (Trucking is less vulnerable to such cascading impacts.) Another consequence of the local character of capacity problems is that severe congestion in a few of the culturally and politically most important urban areas (New York, Los Angeles, and Washington, D.C.) may bias the views of opinion makers and the public regarding the scope of problems. The case studies presented later in this chapter illustrate some of these local circumstances.
Highway Spending and Traffic Growth
Perhaps more than any other development, the perception that highway traffic growth has outstripped the ability to provide roads has given rise to concern among transportation professionals and the public that current trends in transportation capacity are unsustainable. Roads are shared by trucks and cars, so it is impossible to separate highway freight capacity from the question of overall system capacity for serving all vehicles.
Trucking is the major freight mode in terms of expenditures in the United States. According to estimates by the Eno Foundation, 81 percent of domestic intercity freight transportation expenditures in 1999
were for trucking, and trucks carried 27 percent of intercity ton-miles (Wilson 2001, 7, 12). In 1999, combination trucks accounted for 5 percent of vehicle-miles traveled (VMT) on all roads and 17 percent on rural Interstates (Figure 3-1) (FHWA 2000a, Table VM1). Highway engineers estimate that a large truck has approximately the same effect on traffic operations as two cars, so large trucks account for about 30 percent of all passenger-car equivalents on rural Interstates.
Capital Expenditures, Capital Stock, and Traffic
From the late 1940s to the 1960s, real capital expenditures for highways grew at least as fast as did highway travel; but since that time, while VMT has steadily grown, the long-run trend in real capital expenditures appears nearly flat (Figure 3-2). Capital expenditures on public roads in 1999 were $59.5 billion, VMT was 2.7 trillion, and VMT for combination trucks was 132 billion (FHWA 2000a).
A more relevant question for performance is whether the stock of highways, rather than the rate of capital expenditures, is expanding in pace with traffic. A constant rate of capital expenditures can yield growth in capacity if assets are long-lived. Data on road-miles or lane-miles can serve as approximate physical measures of the capital stock of highways (although roads vary greatly in their traffic-bearing capabilities). These physical measures of highway capacity appear to be flattening in the past
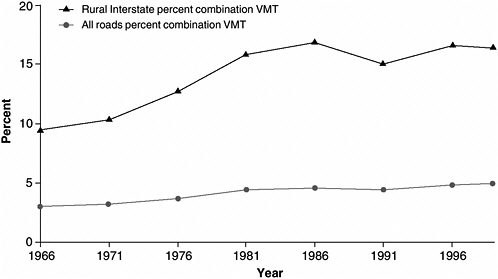
FIGURE 3-1 Combination truck share of traffic. (SOURCE: FHWA various years.)
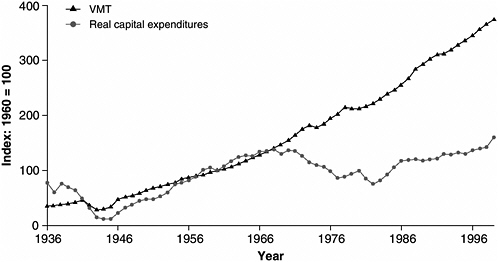
FIGURE 3-2 Highway capital expenditures and vehicle-miles traveled. (SOURCES: FHWA 1987–2000; BEA 1998, 159; BEA 2000, 132.)
decade, after nearly three decades of rapid postwar expansion. For example, mileage of limited-access divided highways grew rapidly during the peak years of Interstate highway system construction; mileage is still growing but much more slowly compared with the 1960s and 1970s (Figure 3-3).
An economic measure of the capital stock of highways is estimated by the Commerce Department’s Bureau of Economic Analysis (BEA). It is defined as the replacement cost of all past capital expenditures less depreciation, in constant dollars. The BEA measure of capital stock, published only since 1985, exhibits more rapid growth than do the data for road miles. BEA estimates that capital expenditures have been considerably exceeding depreciation (Figure 3-4). Much highway capital expenditure today—for example, projects to widen roads, improve roadway geometry, or improve traffic control—increases capacity but is not reflected in gross indicators of physical capacity like road-miles. Between 1985 and 2001, average annual growth rates were 2.8 percent for VMT on all roads, 2.0 percent for BEA capital stock, and 0.7 percent for miles of limited-access highways.
Another estimate of highway capital stock, produced by the Federal Highway Administration (FHWA) using a definition somewhat different from that of the BEA estimates, indicates that productive capital stock grew at an annual rate of 1.7 percent from 1985 to 1995, 1.3 percent from 1975 to 1985, and 5.1 percent from 1955 to 1975 (Fraumeni 1999).
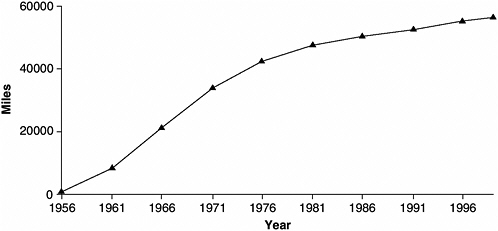
FIGURE 3-3 Miles of limited-access divided highway. (SOURCE: FHWA 1987–2000.)
Performance
As noted above, a declining ratio of roadway stock to travel does not in itself demonstrate that more rapid expansion of the system is called for. The system may have been larger than necessary in earlier decades, or the declining ratio may represent productivity growth rather than a decline in the level of service. The overall pattern of a declining ratio of capital to output does not seem to be rare in U.S. industry; the trend in the rail industry has been parallel, as shown in the next section, and another
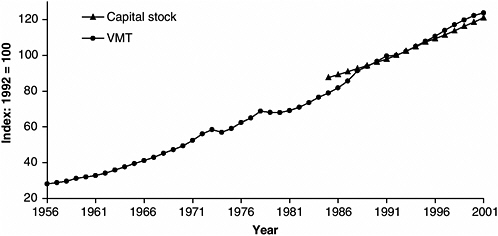
FIGURE 3-4 Net capital stock of highways and streets; annual vehicle-miles. (SOURCES: FHWA various years; Katz and Herman 1997, Table 12; Lally 2002, Table 12.)
network industry, electric utilities, shows a similar trend (Figure 3-5). The electric utility industry, like the railroads, has recently experienced a severe temporary regional supply disruption, which has stimulated debate about the adequacy of capacity and the need for government intervention. In both industries, more productive use of capacity in recent decades has benefited the public, but it may have increased vulnerability to disruptions caused by extraordinary external circumstances.
There is evidence that highways are becoming more productive, in part because of changes in users’ behavior. Traffic engineers have discovered that roads today maintain free-flowing traffic conditions while carrying traffic volumes that would have resulted in slow-speed or stop-and-go traffic conditions according to traffic models calibrated in earlier decades. The data suggest that a freeway can today carry perhaps 15 percent greater peak traffic volume before speed slows to 80 percent of free-flow speed, compared with the 1960s (TRB 1996, 64, 142). Apparently drivers, as they become more accustomed to high-speed, high-traffic-density driving, are learning to make more efficient use of the available road space. Changes in the dimensions and performance of vehicles may also be affecting the relationship of speed to traffic density. Improved traffic management has the potential to significantly increase the effective capacity of existing roads, but the most powerful techniques have as yet seen little application.
Data on time trends in performance of the entire highway system are sparse, and forecasting future performance has proven to be difficult. A 1987 study of urban freeway congestion estimated an annual cost of 1.2
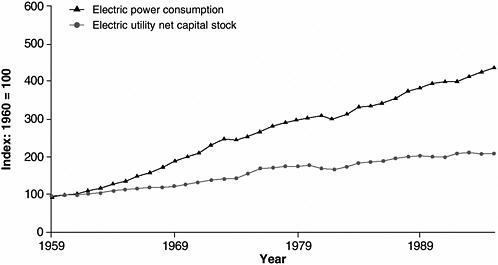
FIGURE 3-5 Electric power consumption and utility capital stock. (SOURCES: Katz and Herman 1997, Table 4; EIA 2002, Table 8.5.)
billion vehicle-hours of delay, and projected a 5.6 percent annual rate of growth of vehicle-miles of congested travel on urban freeways through 2005, compared with a projected 1.9 percent rate for all vehicle-miles (Lindley 1987). However, a 1997 FHWA analysis found that the fraction of daily peak-hour vehicle-miles of travel on urban Interstates that takes place in congested conditions was fairly constant between 1990 and 1995 (Figure 3-6), while total urban Interstate travel grew at 4.1 percent annually during the period.
Projections
Projections of total and combination truck VMT typically predict lower rates of growth in the next decades than occurred during the 1990s. On the supply side, highway capital expenditures for the next few years may be projected on the basis of the size of the federal-aid program enacted periodically by Congress, if it is assumed that the ratio of state to federal expenditures remains constant (Figure 3-7). The 1998 program provided for moderate spending growth through 2003, and preliminary proposals for the successor legislation also call for increases.
FHWA produces a biennial projection of national highway capital spending requirements based on a benefit–cost analysis, using its HERS (Highway Economic Requirements System) model. The model employs a sample of road segments, reported to FHWA by the states, with information on traffic, geometry, and state of repair of each sample segment; and a set of cost factors to allow projections of infrastructure and user costs for
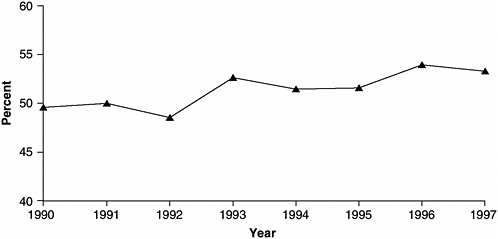
FIGURE 3-6 Percent of peak-hour travel that occurs under congested conditions, urban Interstates. (SOURCES: FHWA 1997a; FHWA 2000d, Exhibit 4-5.)
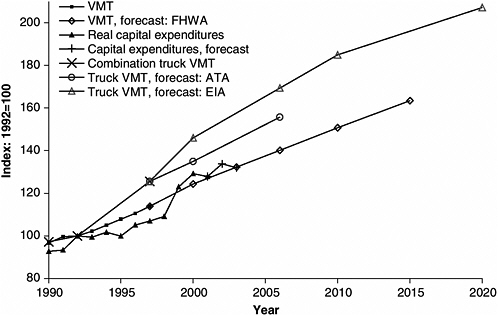
FIGURE 3-7 Forecasts: VMT, combination VMT, capital expenditures. (SOURCES: VMT: FHWA various years, Table VM-1; real capital expenditures: FHWA various years, Table HF10 and BEA 2001, 133; combination truckVMT: FHWA various years, Table VM-1; truck VMT, forecast: EIA: EIA 1999, Table 55, heavy trucks; truck VMT, forecast: ATA: ATA 2000.)
each segment for specified assumptions about future road improvements and traffic growth. Given a forecast of traffic and a budget, the model computes the most cost-effective highway improvements. The DOT model has two major shortcomings. First, it does not support comparisons of highway expansions with congestion pricing or other demand management alternatives. Therefore, the model overlooks attractive policy alternatives in many instances. Second, it does not incorporate a network model. Consequently, the estimate of benefits from expansion of a highway link does not change if a decision is made to simultaneously expand a substitute or complementary link. Necessary revisions to DOT models to make them more useful for planning are identified in Chapter 4.
The most recent projections using this model (Figure 3-8) assume VMT growth of about 2.2 percent annually, depending on the level of investment. FHWA estimates that a highway capital spending program in which projects were carried out in order of cost-effectiveness and the level of spending was just sufficient to maintain present physical conditions of pavements and bridges would require annual capital expenditures averaging $57 billion (in 1997 dollars) over the period 1998–2017, a rate
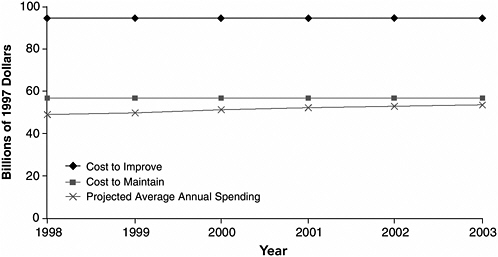
FIGURE 3-8 Projected annual highway capital spending versus cost to maintain physical conditions and cost of all cost-effective improvements. (SOURCE: FHWA 2000d, ES-13.)
of spending 16 percent above the actual 1997 level. In this scenario, the average benefit–cost ratio of all projects carried out (other than bridge projects) is 6.1. If all projects with a benefit–cost ratio greater than 1 were carried out, FHWA estimates that annual spending would be $94 billion, 93 percent greater than the 1997 level, and the average benefit–cost ratio of all projects would be 3.7 (FHWA 2000d, ES.13–ES.15, 7.15–7.18, 9.5).
Summary
Although the picture that can be formed from aggregate trends is necessarily incomplete, as emphasized earlier, the data suggest a more complicated situation than the simple conclusion that the nation is near to running out of highway capacity. Real highway capital spending slumped severely in the 1970s but recovered afterwards, spurred by larger federal-aid programs. The stock of highway capital is growing, although not as fast as VMT. Although the available data on highway performance are inadequate, they do not demonstrate widespread deterioration. Nonetheless, DOT economic analysis indicates that at current funding levels many opportunities for high-payoff, mobility-improving projects are being missed.
Railroad Infrastructure Downsizing and Service Disruptions
Capital Expenditures and Traffic
In 1999, railroads carried 37 percent of intercity freight ton-miles in the United States and rail revenues accounted for 10 percent of expenditures
for domestic intercity freight services (Wilson 2001, 7, 12). The recent history of the development of the railroads differs markedly from that of highways and trucking. Rail freight traffic grew slowly, and the rate of real capital expenditures declined in the post–World War II period through the 1970s. Since the end of most economic regulation of the industry in 1980, traffic growth has accelerated, and spending for roadway and structures has grown more rapidly than traffic (Figure 3-9). In 1999, capital expenditures for roadway and structures by Class I railroads (the largest U.S. railroads, accounting for 91 percent of rail freight revenues) were $4.4 billion, and the number of ton-miles was 1.4 trillion (AAR 2000).
The mileage of track owned by Class I railroads has contracted throughout this period (Figure 3-10). Some of the decline shown in the figure reflects divestitures of track to small regional and shortline railroads, which operated 29 percent of road-miles in use in 1999. Rail roadway operated by all U.S. railroads declined from 181,000 miles in 1987 to 171,000 miles in 1999 (AAR 2000, 3; AAR 1988, 2). Much of the reduction in mileage since World War II was the result of the decline in passenger service. Technology also has played a role; for example, computerized traffic management has increased effective capacity. Patterns differ by region: in the East and Midwest after World War II, multiple independent railroads operated redundant mainlines and branchlines. The South had fewer carriers and less duplication, and far fewer multiple-track lines, and the West was largely single-tracked. From the 1960s, the
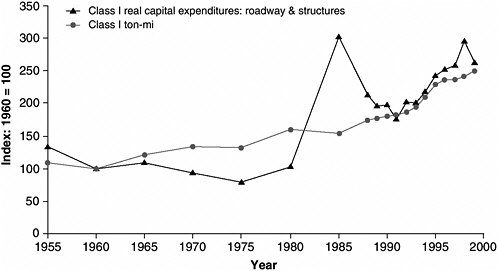
FIGURE 3-9 Class I railroad roadway and structures capital expenditures and ton-miles. (SOURCES: AAR 1999; AAR 2000; BEA 2000, 132.)
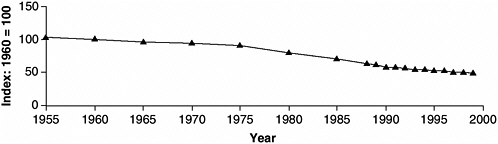
FIGURE 3-10 Track-miles owned, Class I railroads. (SOURCES: AAR 1999; AAR 2000.)
South and West were growing and rail traffic was generally on the rise. Growth on a large single-tracked system led to congestion problems in the West in the 1980s at the same time that track was being removed from the East and Midwest. Thus, it would be an oversimplification to ascribe any present capacity problems to rail infrastructure downsizing. Most of the downsizing occurred in the Northeast, where traffic growth has been relatively modest.
According to BEA estimates, the strong rate of capital spending for new roadway and structures has not kept pace with depreciation and retirements, so the real net capital stock of all U.S. railroads has declined (Figure 3-11). Trends in rail roadway and structures spending and net
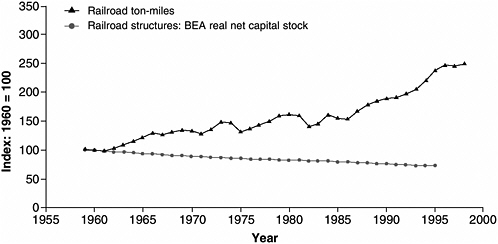
FIGURE 3-11 Railroad structures net capital stock and ton-miles (all railroads). (SOURCES: Katz and Herman 1997, Table 4; Wilson 2001.)
stock are presented here as measures more directly related to long-term capacity than are equipment spending and stocks, and for comparability with the highway capital trends presented above. Short-term capacity problems often are related to equipment availability.
The capital stock and investment trends are consistent with the view that the railroad industry had substantial excess capacity in 1980 and has since been shedding uneconomic capacity while maintaining and upgrading the best-performing components of the network. By some accounts, the period of systemwide downsizing came to an end within the past few years, and the railroads now face the need for expansion if they are to serve expected demand growth (Machalaba 1998).
Like highways, railroads carry both passengers and freight. Traffic is overwhelmingly freight: annual Amtrak car-miles are 1 percent of freight car-miles (AAR 2000, 34, 77). Nonetheless, requirements for freight traffic to share track with intercity and commuter passenger trains are a significant capacity constraint in some locations.
Performance
Available measures of railroad performance also are consistent with this view. A physical measure of performance, average train speed, showed improvement from 1980 to 1992 and then declined (Figure 3-12). This is suggestive of a capacity problem, although many other factors can influence the performance of this measure. Railroads report that speeds have largely recovered since the postmerger problems of the 1990s were resolved. Average revenue per ton-mile in constant dollars (i.e., average price) has been declining for many decades (Figure 3-13). This price trend presumably reflects the combined effects of productivity growth, excess capacity, and deregulation. Recently the rate of decline may have slowed compared with that in the preceding decade, although a pronounced price
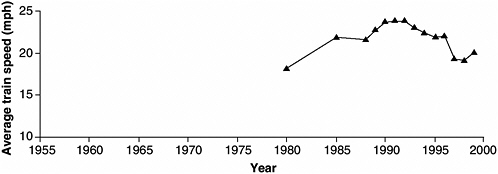
FIGURE 3-12 Average train speed, Class I railroads. (SOURCES: AAR 1999, 37, 38; AAR 2000, 37, 38.)
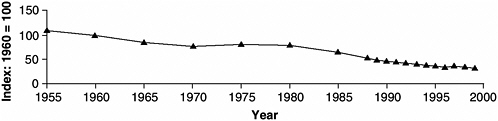
FIGURE 3-13 Average revenue per ton-mile, Class I railroads (constant dollars). (SOURCE: AAR 2000.)
rise, such as might be expected to accompany a capacity crunch, does not appear in the aggregate data.
The railroads’ operating income grew throughout the 1990s, a trend not inconsistent with tightening capacity (Figure 3-14). However, according to some analysts, the rate of return is insufficient to attract the capital that would be needed to develop new lines of business to the railroads and serve expected growth of established lines (Machalaba 1998; Ellis 2000). A low rate of return would presage further contraction, rather than capacity expansion.
The trends in railroad output, capital stock, and average revenue suggest strong productivity growth; that is, the railroads are getting more and more service out of existing facilities. Caution is required in interpreting trends in ratios of outputs to inputs for railroads, as for any transportation sector, because ton-miles is a very approximate measure of physical output. Rail costs depend on the mix of traffic among bulk commodities, general merchandise, and intermodal containers, since these lines of business demand different services. One careful estimate of rail industry productivity indicates that multifactor productivity grew by
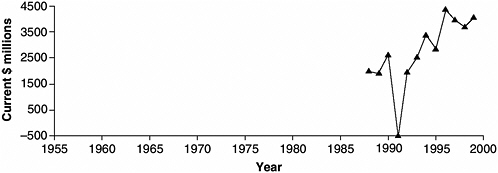
FIGURE 3-14 Net railway operating income, Class I railroads. (SOURCE: AAR 2000.)
4.5 percent annually in the decade after deregulation, twice as fast as during the preceding decade and faster than in other freight sectors or in the economy as a whole during the 1980s (Gordon 1992). However, apparently no available rail productivity measure does a thorough job of taking into account changes in output and input quality (Oum et al. 1999).
Projections
Two recent forecasts predict strong growth in rail traffic in the coming decades, although neither appears to explicitly take into account any capacity constraint (Figure 3-15). A forecast of freight traffic for all modes for the American Trucking Associations, with gross domestic product (GDP) growth of 3.3 percent annually for 2000–2008, predicts rail tonnage will grow at 1.3 percent annually from 1998 through 2008, compared with 1.7 percent for total freight tonnage (ATA 2000); this implies a rail ton-mile growth rate of 1.5 percent annually. A forecast of the Department of Energy’s Energy Information Administration, on the basis of assumed GDP growth averaging 3.0 percent annually from 1999 through 2020, predicts rail ton-mile growth of 1.9 percent annually over the period (EIA 2000, 138).
Service Disruptions
No recent event has brought greater public scrutiny of the national freight transportation system than the service disruptions that occurred following the 1996 merger of the Union Pacific (UP) and Southern Pacific (SP) Railroads. For the purposes of this study, these events as well as the service disturbances following the 1999 Conrail breakup are
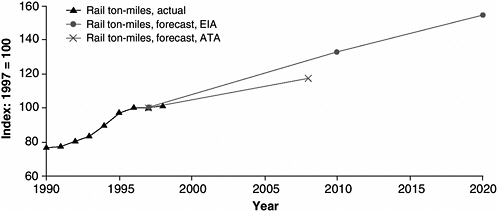
FIGURE 3-15 Railroad ton-mile forecasts. (SOURCES: ATA 2000, 19; EIA 2000, 138; Wilson 2001.)
relevant only insofar as they may indicate underlying long-run capacity problems. A General Accounting Office (GAO) report described the Union Pacific episode as follows:
In the summer of 1997, during implementation of the Union Pacific/Southern Pacific merger, rail lines in the Houston/Gulf Coast area became severely congested, and freight shipments in some areas came to a complete halt. As the problem spread, many grain shippers experienced delays in railcar deliveries of 30 days or more, while some grain shippers in Texas did not receive railcars for up to 3 months. Transit times for movements of wheat from Kansas to the Gulf of Mexico in some cases exceeded 30 days—four to five times longer than normal. In late 1997, the [Surface Transportation] Board determined that the service breakdown, which had a broad impact throughout the western United States, constituted an emergency and among other things, ordered Union Pacific to temporarily release its Houston area shippers from their service contracts so that they could use other railroads serving Houston, and to cooperate with other carriers in the region that could accept Union Pacific traffic for movement, to help ease the gridlock. (GAO 1999, 67)
By December 1998, UP announced that its operations had returned to normal (GAO 1999, 84). The Surface Transportation Board and industry officials reported to GAO that they regarded the service breakdown as an aberration, related more to prior deficiencies at SP, including substantial deferred maintenance, than to the merger itself (GAO 1999, 67, 72). Nonetheless, when Conrail was split up between the CSX and Norfolk Southern (NS) railroads in 1999, disruptions again occurred, although not on the scale of events following the UP/SP merger. Shippers reported delays of shipments and unavailability of service (Larson and Spraggins 2000). Major intermodal customers, including United Parcel Service, suspended some use of the railroads (Lang 2000). The service failures were attributed mainly to problems of integrating separate operations, and especially to information system failures.
Most observers concluded that the postmerger rail service disruptions were exceptional events rather than indicators of long-run capacity problems, and the railroads report that they have largely put merger-related service problems behind them. However, it is plausible that availability of capacity will reduce risks of disruptions and that tight capacity may aggravate disruptions once they occur. Rail mainlines today typically operate at high utilization levels compared with past practices. The eastern railroads reportedly relied on the region’s older facilities, now in the hands of shortline railroads, to alleviate operating problems after the
Conrail breakup, and had made important capacity enhancements leading up to the breakup that probably averted more severe difficulties (Phillips 1999).
Summary
Do the data support the view that traffic on the nation’s mainline railroads is nearing maximum capacity? As noted previously, capacity constraints are localized in time and space, so aggregate trends cannot be definitive tests. However, most trends are consistent with a condition of tightening capacity: long-run contraction of the extent of the network, the declining net capital stock measure in spite of historically high rates of industry capital expenditures, rising profits, slowing train speed, and sporadic service failures. In spite of these trends, freight rates, driven mainly by productivity gains, continue to fall, and rates of return remain modest. These last two trends suggest the possibility that the industry may contract further before it reaches a sustainable scale.
Growing Congestion at Terminals and Border Crossings
The scope of terminal capacity issues is broad: it can be defined to encompass the internal adequacy of the terminal facilities themselves (e.g., the capacity of ports to load and unload ships and of rail terminals to handle rail cars) as well as the capacity of intermodal connections to the terminals (e.g., access by rail and truck to ports, and truck access to rail yards). Data indicating the performance of all these components are fragmentary. The issue of terminal capacity received attention in the 1990s because of the growth of international trade and intermodal freight traffic, and because of intent to facilitate development of intermodal transportation that Congress expressed in the 1991 surface transportation act (ISTEA).
The professed federal commitment to an intermodal approach to freight transportation policy has been put into practice largely through a focus on congestion at terminals and other local bottlenecks, such as border crossings. When in 1995 DOT undertook to develop ties to the private sector to jointly address freight problems through its National Freight Partnership, the group’s initial priorities were two terminal areas (the Southern California ports and Alameda Corridor project, and rail interchange in Chicago) and two border crossings (El Paso and Laredo, Texas) (FHWA 1997b). The most recent federal surface transportation act (TEA-21 of 1998) created two aid programs aimed at these bottlenecks: the Corridors and Borders program and Transportation Infrastructure Finance and Innovation Act (FHWA 1998). Following congressional directives in ISTEA and subsequent legislation, DOT and the states have
been engaged in an effort to identify important road connections between terminals and major through highways, to make them eligible for federalaid funding, and to assess their condition and investment needs. A Federal Highway Administrator explained the philosophy behind this program emphasis as follows: “Freight flows rapidly across our system but then comes to a virtual stop as vehicles come off exit ramps out to congested, narrow streets with multiple stoplights leading to our seaports, airports, rail terminals and stations, and major manufacturing facilities. If we focus on less than 2 percent of the system, we can significantly increase productivity” (Smallen 1998).
As part of its intermodal connectors program, in 2000 DOT completed an inventory of roads serving as intermodal freight connectors. These were defined as the most important secondary roads carrying truck traffic between freight terminals and major highways. By DOT’s definitions, 1,200 miles of such connectors were identified, connecting 250 ports, 200 rail terminals, 100 airports, and 60 pipeline heads to the National Highway System. DOT found that $1.5 billion of improvements were carried out or planned for 1996–2000 on these roads, $250,000 per mile per year, although much of the spending was concentrated on a few projects (DOT 2000; FHWA 2000b).
The DOT study acknowledged that data are insufficient to judge the adequacy of these roads or the funding levels devoted to their improvement (DOT 2000, 4). This finding is significant, since it means that the case for devoting more funding to the connectors has not yet been made. At issue is whether earmarking a portion of transportation funds, at the federal or state level, for improvements to the connectors would yield greater public benefits than allowing the states to choose transportation uses for the funds.
To illustrate the demands on port waterside facilities, Figure 3-16 shows the trends in tonnage of U.S. waterborne commerce (excluding inland waterway traffic but including domestic Great Lakes and coastwise tonnage), as well as historical and projected capital expenditures by public port authorities. The aggregate data are not very illuminating because tonnage is dominated by a few bulk commodities, especially petroleum. Port authority capital spending has been accelerating, although to gain a complete picture, the capital expenditures of private-sector terminal operators, shipping companies, railroads, state governments, and others would have to be included.
Examination of trends by port or by region, or, to the extent that expenditures can be allocated, by type of commodity (e.g., bulk versus container), would be necessary to give a clear indication of the relationship between capital expenditures and traffic. Figure 3-17 shows historical and projected volumes for one category of cargo in one region: loaded containers in international trade handled in the Ports of Los Angeles and Long
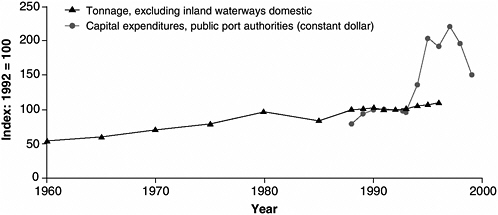
FIGURE 3-16 U.S. port authority capital expenditures and waterborne commerce tonnage. (SOURCES: MARAD 1990–1997; MARAD 2000b; BEA 2000, 132.)
Beach. Growth in this traffic at these ports was nearly 10 percent annually in the 1990s and is expected to continue at a more moderate rate, providing port and landside facilities continue to expand (SCAG 2000, 78). These ports handle 30 percent of U.S. ocean container traffic.
While growth of some categories of freight at certain ports has been remarkable, there is some evidence that the waterside facilities of the U.S. port system as a whole are at present not capacity-constrained. Ocean cargo has a choice of ports on all U.S. coasts, and cargoes can bypass landside congestion out of busy west coast ports by sailing directly to the east
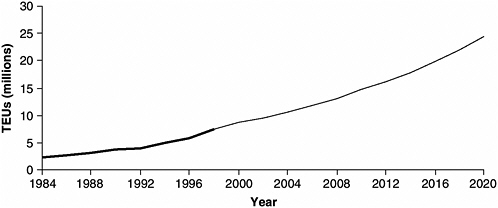
FIGURE 3-17 Container volume, Ports of Los Angeles and Long Beach (1984–1998 historical; 1999–2020 projected). (SOURCE: SCAG 2000.)
coast (Phillips 2000; Gillis and Damas 1998). One indication of capacity conditions is port pricing practices. Competition among ports and the leverage that ocean carriers can exert in negotiating port leases and service fees have depressed the rates charged at many U.S. ports to a level below costs (MARAD 1998, 47–48). Although port operating revenues have increased in the past decade and more ports are becoming self-sufficient, many ports still rely on various forms of public aid to break even. The depressed pricing and reliance on subsidies both are suggestive of over-capacity. Some apparent port waterside excess capacity probably reflects landside capacity constraints. Poor landside access may be discouraging use of some ports that have low utilization of waterside capacity.
Border crossings, although they are not terminals, are analogous physical choke points in the freight system. Growth in international trade has put strains on border crossing facilities. As one illustration, truck border crossings between Mexico and Texas increased 220 percent from 1990 to 2000 (Texas Center for Border Economic and Enterprise Development 2001). Congestion and delays for truck and rail traffic at U.S. land border crossings have been frequent. Delays are the consequence of physical infrastructure limitations as well as of the complexities of customs and immigration proceedings at borders.
Long Lead Times and Rising Costs of Infrastructure Projects
Public-sector construction projects for highways or other transportation infrastructure typically require 5 to 15 years to plan and complete. In U.S. urban areas, examples of billion-dollar infrastructure projects with 20-year delivery times can be cited, and projects costing in the hundreds of millions of dollars are no longer rare (GAO 1997; GAO 1998). Among the factors that have added to the uncertainties and costs of infrastructure development are the following:
-
Increasing population density and urbanization. The population of U.S. urban areas has grown by 75 million since 1960, when Interstate highway construction was first reaching full speed. Urban land is valuable, and the spillover effects of infrastructure are more objectionable in cities.
-
Stronger environmental regulations, which primarily reflect greater value placed on environmental quality by the public.
-
Greater emphasis on safety, which has necessitated upgrading of design standards.
-
More intensive use. Traffic volumes and truck loads on a typical road are much greater today than in earlier decades.
Systematic data on trends in project delivery times and costs are not available. Construction cost indexes reflect unit costs but not the
effects of changes in preconstruction project development costs or design standards. The following anecdotal data indicate the nature of the problem:
-
In a recent survey, state transportation officials reported that projects in which delays caused by federally required environmental reviews retard completion by 1 to 2 years occur with regularity [TransTech Management (forthcoming)].
-
DOT data reported to Congress on the environmental review process for highway and transit projects show that the average time required to process environmental documents for major federal-aid highway projects was 2 years in the 1970s, 4 years in the 1980s, and peaked at 5 years 10 months in 1999. DOT reported that its efforts to streamline reviews according to legislative directives had reduced the average to 5 years 2 months by 2001 (DOT 2002).
-
A review of large transportation infrastructure projects worldwide found that among 41 U.S. and European projects with costs mostly in the range of $100 million to several billion dollars, the median cost overrun of completed projects was 50 percent compared with preconstruction estimates, in constant prices (Skamris and Flyvbjerg 1996).
-
A GAO review of eight U.S. public-sector transportation projects, costing from $300 million to $11 billion each and including highway, freight rail, and transit projects, found that most, but not all, were experiencing significant cost or schedule overruns (GAO 1998).
-
Another GAO study, of environmental reviews of airport expansion projects, found that most major U.S. airports are operating at or near capacity and that balancing airport operation with environmental protection has become much more difficult in the past decade, which increases the time and cost of airport development. GAO concluded that poor coordination and communication among federal agencies and between the federal government and airports make compliance with requirements for environmental review of expansion projects more difficult. According to an operator survey, environmental issues were the most common cause of project delays in the preceding 5 years. One-fourth of major airports reported canceling or indefinitely postponing expansion projects in the past 10 years because of environmental issues (GAO 2000).
-
A comparison of the development of two toll roads in California, SR-91 in Orange County and SR-125 in San Diego County, concluded that environmental reviews added 6 years to the schedule for SR-125 compared with SR-91, which did not require an environmental impact statement because the new lanes were being added to the median of an existing freeway. Project development and engineering for the 12-mile SR-125 toll road required 9 years (Lockwood et al. 2000).
Of course, processing delays may be the price of achieving desired environmental outcomes. Still, state officials see curtailing the growth of project delivery times as essential to their ability to control the costs of future infrastructure expansion. The attention of the states and the federal government has recently been focused on the issue of environmental streamlining, that is, efforts to reduce the time and cost of environmental regulatory reviews of transportation projects (DOT 2002).
The consequences of lengthening project delivery times and rising costs are that the adjustment of infrastructure to changing markets will be slow, development decisions must be based on highly uncertain long-term forecasts, and investments become more risky. Changes in practices and policies that reduced delivery time, cost, and risk would greatly reduce the difficulty of efficiently matching capacity to traffic demand. The Interstate 81 and Upper Mississippi navigation case studies in this chapter illustrate these issues.
Urban Congestion and Passenger–Freight Conflicts
Most major freight nodes (ports, airports, and railheads) and the origins and destinations of most shipments are in cities. Freight must compete with passenger traffic for use of transport facilities and with all other land uses for space for expansion. Once again, data that isolate trends in the freight impacts of urban congestion are not available, so the problem must be demonstrated anecdotally.
The Freight Action Strategy (FAST) Corridor project in Seattle, described in one of the case studies below, is representative of urban competition between freight traffic and other activities. Conflicts between freight traffic at the Seattle region’s ports and other road traffic, as well as other community impacts of port traffic in a major city, impose strong constraints on port development. The Alameda Corridor port access project in Los Angeles has its origins, in part, in the same set of issues; that is, the new rail link to the ports was considered necessary not only to increase physical capacity but also to reduce the impacts of port traffic on residents, automobile travelers, and other businesses (Shaw 1992, 26–54; GAO 1998, 33–34).
The GAO survey of airport operators described in the preceding section shows that airports face an analogous challenge: operators reported that noise pollution is the most important environmental problem they face and constitutes one of the principle constraints on expansion. The growing importance of environmental constraints is driven by growing populations near airports.
The Alameda Corridor project, which involves eliminating some surface rail lines, illustrates how pressure grows to displace freight traffic when urban freight–passenger conflicts worsen. Other examples of
this process are proposals for various forms of urban truck bans or restrictions (Shaw 1992, 49–50). In aviation, an official of the authority operating Boston’s Logan Airport proposed in 2001 that consideration be given to adopting a Northeast airports regional plan that would allocate traffic among the airports, reserving Logan for long-distance passenger traffic and moving short-range and cargo operations to other regional airports (Krause 2001). Similarly, freight railroads often have been obliged to cede access to local commuter trains. The American Public Transportation Association in 2001 supported a legislative proposal that would allow local governments to petition the federal Surface Transportation Board to gain access to track when they failed to reach agreement with the railroad (AASHTO 2001).
Chicago is the setting for some of the most challenging problems involving urban freight–passenger conflicts. All the major North American railroads interchange traffic in the urban area. As a component of these interline exchanges, 1.2 million containers annually are hauled by trucks over city streets and expressways (Prince 2001). These highway interchanges are significant for the performance of the nationwide intermodal container transportation system and the costs of intermodal to shippers and the community.
The growth of intermodal will aggravate the problem concentration of truck traffic near terminals. The most important constraint on intermodal growth in the future may be the difficulty of expanding terminal capacity in urban areas (Prince 2001, 68). As one additional illustration of this problem, NS reportedly required 10 years to negotiate arrangements with local government to construct an intermodal terminal at Austell, Georgia, to serve as its Atlanta hub. The main point of contention was local residents’ concern about truck traffic (Gallagher 2001).
Trends in Other Modes
The trends described above have been emphasized because of their visibility and because they affect the largest freight modes. However, two other infrastructure systems utilized for freight, inland waterways and aviation facilities, have experienced performance problems related to tight capacity.
Inland Waterways and Ports
Inland waterways (rivers, canals, and the Intracoastal Waterway, but excluding the Great Lakes and oceangoing coastwise shipping) carry 11 percent of domestic intercity ton-miles but account for only 1 percent of freight expenditures (Wilson 2001, 7, 12), making the system the cheapest freight mode in terms of average transportation cost per ton-mile.
Farm products, coal, and petroleum products make up two-thirds of ton-miles. Traffic (in ton-miles) has grown steadily at close to 3 percent annually in recent decades (Figure 3-18), while tons have grown at about 1 percent annually. Annual federal capital expenditures have been variable, as Congress has enacted authorizations at irregular intervals (Figure 3-18). The U.S. Army Corps of Engineers (USACE) estimates that federal expenditures account for at most half of all capital expenditures related to the waterways, since terminals and equipment are privately owned (USACE 1997, ES-4). USACE periodically produces forecasts of expected traffic growth by commodity and by segment of the waterways, which depend on assumed growth rates of the economy as a whole and individual sectors as well as export forecasts. The projections call for overall growth of 0.8 to 1.6 percent annually to 2010 (USACE 1997, ES-13).
Potential capacity-related problems on the inland waterways include the aging of facilities and peak-period congestion at certain locks. The median age of all lock chambers is 35 years (USACE 1997, 2-4). USACE maintains detailed data on lock performance. Average delays have been rising slightly in spite of recent elimination of some bottlenecks. Average delay is 6 hours at the most congested locks and much longer during peaks (USACE 1997, 2-18). The case study on Upper Mississippi planning below illustrates waterway capacity issues.
Air Freight
The U.S. aviation system experiences recurring congestion in airport flight operations, airport landside connections, and the air traffic con-
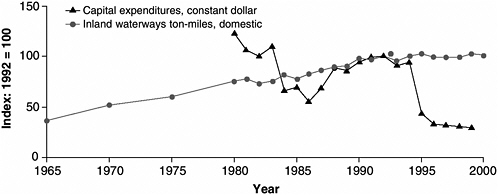
FIGURE 3-18 Inland waterways: federal government capital expenditures and ton-miles. (SOURCES: USACE 1997, Table 4-1; USACE 2001, Table 1-9; USACE 2002, 12; BEA 2001, 121; Wilson 2001, 12.)
trol system. All three kinds of congestion represent constraints on the development of air freight. Freight and passenger air traffic grew much faster than overall economic activity throughout most of the 1990s. Annual growth rates from 1993 to 2000 were 4.3 percent for revenue passenger-miles on U.S. carriers, 5.1 percent for U.S. air carrier domestic freight revenue ton-miles, and 10.1 percent for U.S. air carrier international freight revenue ton-miles (FAA 2001a, I-2). As a consequence, by the end of the decade delays had worsened at most major airports (FAA 2001a, I-4). The Federal Aviation Administration (FAA) monitors the frequency of flight operation delays that are caused by air traffic control congestion. In 2000, at the 31 busiest U.S. airports, the median fraction of flight operations (takeoffs and landings) delayed more than 15 minutes by air traffic control was under 2 percent. The most frequent delays were at La Guardia (16 percent of operations) and Newark (8 percent) (FAA 2001b). These delays may not directly affect air freight flight operations, which can be scheduled in off-peak periods; however, as the section above on urban freight-passenger conflicts describes, a consequence of growing congestion at shared facilities tends to be the crowding out of freight.
U.S. carriers in 1999 produced 14 billion revenue ton-miles of domestic air freight services. International traffic of U.S. carriers was also 14 billion ton-miles (FAA 2001a, Table I-2R). Air freight is less than 0.5 percent of all U.S. domestic freight ton-miles and accounts for 5 percent of expenditures for domestic intercity freight (Wilson 2001, 7, 12). FAA forecasts that freight ton-miles on U.S. carriers will double between 2000 and 2012, an average annual growth rate of 5.8 percent. The forecast shows U.S. carrier passenger-miles growing at 4.7 percent annually over the period (FAA 2001a, Table I-2R). The challenges that airport authorities face in expanding runway capacity to respond to traffic growth are described in the sections above on lead times for infrastructure projects and urban conflicts. Proposals that have been made for reform of FAA’s air traffic control function to allow more efficient traffic management are described in Chapter 2.
Trends in Underlying Forces
The prominent trends that were described above represent the most visible concerns of the past decade. To put them in context, the committee examined certain more fundamental developments. These include freight transportation industry productivity and output, which are measures of overall industry performance; public infrastructure finance, which is one of the key determinants of the performance of public-sector transportation activities; and technological and social developments, which are the drivers of long-run change.
Productivity and Output
In recent decades, freight outperformed the economy as a whole. Output per hour, adjusted for quality change, grew by 4.3 percent/year between 1980 and 1995 in railroads and by 1.9 percent/year in trucking, compared with 0.7 percent/year in all of business. But by the mid-1990s, productivity growth was slowing in freight transportation and accelerating in the economy as a whole: growth between 1995 and 1998 was 3.6 percent/year in rail, 1.3 percent/year in trucking, and 2.2 percent/ year in all business (BLS 2002). Freight productivity growth in the 1980s may be attributed primarily to deregulation and new infrastructure; the slowing in the 1990s may reflect the impact of the five trends identified above.
It would be a misconception to view freight as an “old economy” industry of diminishing importance. Rail and truck ton-miles per real dollar of gross domestic product, after declining by nearly half from 1950 to 1987, rose 12 percent by 1998. One possible interpretation of this trend is that the decline in the postwar years reflected the decline in relative importance of the extractive industries and heavy manufacturing, while the growth since the 1980s may reflect, at least in part, the growing importance of trade in the economy.
Finance
In spite of endorsements of the principle of user fee finance by successive administrations and congresses and by state transportation agencies, there has been no pronounced trend in favor of user fees to finance public-sector construction and operation or in favor of reliance on the market mechanism for managing public-sector transportation facilities. A modest fuel tax on inland waterway users was introduced in 1986, but harbor maintenance lost user fee finance in 1997. Federal rules have blocked airport efforts to rationalize pricing. By FHWA definitions, the ratio of highway user fee collections to spending declined from 78 percent in 1970 to 68 percent in 1998. When decisions are not market driven and subsidies are available, expansion of public infrastructure capacity beyond the economically justified level is a threat to efficiency. As one example, U.S. port authorities’ current and projected capital spending is at the rate of $1.6 billion/year, twice the rate of the 1990– 1995 period. Excluding the Southern California ports, most of the planned spending is to be financed from sources other than port revenues; yet most ports would have difficulty increasing revenues because of intense competition, a circumstance indicating overcapacity. Conversely, on some heavily used components of public-sector infrastructure, imposition or increase of user fees could readily finance high-return capacity investments.
Technological and Social Developments
Improvements in equipment and infrastructure design and successful applications of information technology to operations and management have been continuous processes throughout recent decades. Advances in the management of transportation and logistics are a form of technological progress. Economic deregulation after 1980 was a stimulus to these innovations. Better logistics management lowers costs by reducing inventory and allowing suppliers to respond quickly and precisely to changes in the market.
One prominent aspect of these organizational developments has been the growth of rail intermodal, the carriage of road trailers and containers on railcars. The new service options and competition created by intermodal service stimulate efficiency and reduce costs. The railroads carried more than 9 million containers and trailers in 1999, and rail intermodal loadings grew 4.4 percent annually during the 1990s. Rail intermodal is seen as an opportunity to relieve pressure on overburdened highways and reduce external costs of freight transportation. However, growth will be inhibited in the future by capacity constraints on the rail system, and the potential to displace trucking is limited: rail intermodal traffic is today roughly equivalent to 8 percent of the volume of combination truck traffic; if it doubles in the next decade (nearly twice its growth rate in the 1990s), it will still amount to only about 10 percent of combination truck traffic.
Freight transportation companies are not responsible for certain costs of their activities and therefore do not have incentive to control them. These include costs of congestion on public rights-of-way, air and noise pollution, accident losses for which carriers are not liable, and environmental costs of infrastructure construction. Recent decades have seen substantial reductions in pollutant emission rates and accident rates per unit of freight services, but freight traffic volume and the population exposed to pollution have increased, so total costs probably are increasing. Also, possibly as the result of increased wealth and urbanization, the public may value environmental quality more highly today than at earlier times.
Interpreting the Trends
Historical trends are interesting only if they provide some insight into the future. For now, insights must rely more on judgment than on quantitative forecasts. Structural models with the network detail and reliability that would be required to reduce the risks of long-run public-sector investment decisions are not available, and their development would require substantial effort. For example, congestion is probably an important determinant of regional or metropolitan population dispersion, but existing forecasts will not reflect this feedback. The state of the art of forecasting suggests
that public policy should seek to increase the flexibility of the transportation system to respond to developments that cannot be reliably foreseen.
Nonetheless, the trends described above support some conclusions about the likely future evolution of the freight system. An assessment and qualitative predictions about developments over the next few decades are presented in Chapter 4 in the section Prospects for Freight Capacity.
CASE STUDIES
Because aggregate trend data are insufficient as indicators of the adequacy of capacity, the committee also examined individual system components as case studies to provide a more concrete understanding of freight supply problems and insight into the institutional setting of project-level decision making. The cases were Virginia’s 20-year plan for expanding capacity on I-81, a major truck corridor; plans of USACE to expand lock capacity on the Upper Mississippi River; the FAST Corridor port access project in Washington State; the Florida Freight Stakeholders Task Force, a body charged with advising the Florida Department of Transportation on freight issues, including capital expenditure decisions; and PrePass, a public– private system to automate certain trucking regulatory enforcement functions. The Virginia and Upper Mississippi River cases each involve efforts of a government agency to expand capacity on a mainline route that it owns and operates. The Florida and Washington cases are efforts to foster public–private cooperation in identifying and resolving terminal access problems in local areas. PrePass illustrates the potential of information technology to increase the effective capacity of transportation systems.
The case studies alone are too few in number to support definite conclusions about the sources of obstacles to efficient provision of freight capacity. However, they point to hypotheses about this question deserving closer examination.
Virginia Interstate 81 Widening Project
I-81, an Interstate highway running from southwest to northeast through Virginia, is a major truck route. The state has a plan for several billion dollars in improvements to the highway in the next 20 years to accommodate expected traffic growth. The state studied construction of exclusive truck lanes as part of the project, but rejected that option. The NS has a parallel route on which it believes there is potential for growth of container and general merchandise traffic. During the Conrail breakup proceedings, the railroad stated that it could divert some I-81 traffic from truck to rail. There may be a connection between the level of state investment in upgrading I-81 and the railroad’s willingness to invest in building up rail service. The railroad has proposed to the state that it consider
providing public funding for improvements on the rail route as a lower-cost alternative to accommodating more freight traffic on the highway.
This case illustrates several of the public policy issues related to freight capacity that were identified in Chapter 2. I-81 is a major intercity highway freight artery facing capacity constraints in the future if no action is taken. At issue is whether resources will be available for increasing capacity on such routes, how environmental impacts or local community objections may affect the feasibility of expansion, and what alternatives have been recognized for responding to traffic growth. The case constitutes a test of the prospects for multimodal corridor planning because of the consideration given to the possibility of publicly financed expansion of rail capacity as a supplement or alternative to highway capacity expansion.
Highway Facility
I-81 extends 325 miles in Virginia, running northeast to southwest along the Appalachians. The route continues to Harrisburg and Syracuse to the north and terminates at its junction with I-40 near Knoxville, with direct Interstate connections throughout the Southeast. The Virginia portion, completed in 1969, is four lanes except for one short six-lane section. The route in Virginia is not heavily urban; the largest city traversed is Roanoke (population 120,000).
Annual average daily travel (AADT) over most sections of I-81 in Virginia in 1997 ranged from 30,000 to 60,000 vehicles per day (counting both directions), with an average over all sections of about 40,000. Tractor-semitrailers accounted for 25 percent of vehicles on average (VDOT 1999a), or more than 10,000 vehicles per day. Traffic studies show that, in estimating the capacity of a highway, a tractor-semitrailer is equivalent to approximately two passenger cars; therefore tractor-semitrailers are consuming about 40 percent of the utilized capacity. For comparison, AADT averaged over all Interstates in the United States in 1997 was 20,000 vehicles per day and average volume of combination vehicles (predominantly tractor-semitrailers) was 3,500 vehicles per day, 17 percent of the total.
The greatest one-way peak-hour volume among 18 locations for which the state provided traffic data is 2,720 vehicles per hour (1,360 per lane); typical peak-hour volume on the route is 1,600 vehicles per hour in each direction, or 800 vehicles per hour per lane. Traffic slows appreciably at about 1,800 vehicles per hour per lane on Interstates. With these peak volumes, and in the absence of large cities, serious recurrent congestion on the route should be uncommon.
The state conducted a survey of truck drivers at I-81 truck stops in 1997 (VDOT 1997). It found that tractor-semitrailer traffic is predomi-
nantly Interstate: half of all trips have an origin or destination within Virginia, Tennessee, North Carolina, or Pennsylvania, and half have an origin or destination outside these four states. (The survey might have undercounted intrastate trucks if local operators make less use of truck stops on the Interstate.) Commodities are diverse: according to the drivers’ responses, general freight and household goods are 34 percent of loads, food and agricultural commodities 18 percent, and construction materials 13 percent.
In 1971, 2 years after the route was fully open in Virginia, AADT (averaging three sites for which data are available) was 11,300 and tractor-semitrailer volume was 1,700 vehicles per day (15 percent of the total). From 1971 to 1997, AADT grew at an average annual rate of 4.8 percent and tractor-semitrailer volume at 6.4 percent.
Traffic Forecasts
The Virginia Department of Transportation (VDOT) traffic forecast used in its study of highway expansion requirements predicted that AADT would increase by 100 percent from 1997 to 2020, equivalent to a 3 percent annual growth rate. The tractor-semitrailer share of total traffic is forecast to remain constant. Peak-hour volume on the busiest segment in the forecast is 5,150 vehicles per hour in one direction, exceeding the capacity of the present highway. Tractor-semitrailer volume would exceed 1,000 vehicles per hour in one direction during the peak hour on the busiest section.
One of the important considerations for the purposes of this case study is the degree to which the state’s highway expansion plans are driven by the growth of truck traffic. As noted above, tractor-semitrailers account for 40 percent of the utilized capacity on the route, today and in the forecast for 2020. If there were no growth in tractor-semitrailer traffic between 1997 and 2020 and automobile traffic grew according to the state’s forecast, peak-hour passenger-car-equivalent volume in 2020 would be about 85 percent of the volume in the state’s present forecast and projected peak traffic on the most heavily traveled segments would exceed capacity. (Trucks constitute a smaller fraction of traffic at peak hours than throughout the day.) Therefore, eliminating growth in truck traffic might not greatly change the state’s assessment of the need for highway expansion.
While some aspects of the state’s forecast might be debatable, it is noteworthy that the forecast does not play as critical a role in decision making in this case as in the Upper Mississippi case. Construction of highway improvements will be staged over many relatively small projects over a period of years. For example, the $2.6 billion FY 2000 Virginia state highway program budget included $28 million of engineering studies for improvements on four short sections and two interchanges on the highway (VDOT 1999b), and two construction projects are under way.
The State’s Plan
In 1997 VDOT was directed by the Commonwealth Transportation Board to develop a plan for improvements on I-81 in the state to accommodate expected traffic growth. VDOT reported its recommendation in December 1998, which called for widening the route to at least six lanes, with eight lanes near four cities, and interchange improvements. It concluded that the widening would be essential to accommodate forecast traffic in 2020. The estimated cost for all recommended improvements was $3.4 billion (VDOT 1999c). VDOT also recommended construction priorities. The project would be staged over 20 years. As noted, the Board has approved the next stage of engineering studies for several segments and the start of construction.
At the direction of the state legislature, VDOT also studied the option of constructing a separate exclusive truck facility along the I-81 right-of-way. The analysis questioned whether a separate facility would be justifiable. The design considered was two truck-only lanes in each direction (because provision for passing would be essential) plus separate truck lanes on some interchanges. The estimated cost of the separate truck facility was $2.5 billion. The facility would require substantial right-of-way acquisition (apparently more than the recommended widening, which involves adding only one lane in each direction), increasing the potential for environmental damage and local community disruption. Most important, if a separate truck facility were constructed and automobiles were left with four lanes, automobile travelers would still experience significantly degraded levels of service by 2020. That is, the truck-only lanes would not solve the underlying problem. Finally, the study concluded that the recommended design would be safer than the separate truck facility option. The analysis apparently did not estimate cost savings from not having to accommodate large trucks in the automobile-only lanes or any perceived service improvements to motorists from the absence of trucks (other than reduced congestion delay).
In early 2002, a consortium of construction companies made a proposal to the state, following procedures in Virginia’s 1995 Public–Private Transportation Act, to widen the highway and add dedicated truck lanes to be financed by truck tolls. The proposal was taken under consideration by the state (Truckinginfo.com 2002; Laurio 2002).
NS’s Shenandoah Corridor Route
A secondary mainline route of the NS lies parallel to I-81 and its connecting Interstates, from Harrisburg through Roanoke and Knoxville to Birmingham and New Orleans. It carries virtually no intermodal traffic and only a very limited volume of merchandise traffic.
Historically, the route was little used for through rail traffic. Ownership was divided between three companies: the Pennsylvania Railroad operated between the Northeast and Hagerstown, Maryland; the Norfolk and Western between Hagerstown and Bristol, Virginia/Tennessee; and the Southern between Bristol and points in the Southeast and gateways to the Southwest. While these railroads did cooperate on some passenger and bulk commodity services, both the Pennsylvania and the Southern preferred to route most of the merchandise traffic on alternate routes that provided longer hauls and more revenue for them. The 1982 merger of Norfolk and Western and the Southern and the 1999 purchase of Conrail lines by NS finally created a route under single control between the Northeast and the Southeast.
Largely on account of this historic balkanization, there has been only limited investment in the route. Reflecting the difficult terrain involved and the poverty of the South when the railroad was built, the line has many curves and gradients. Always a minor rail route, it did receive minor improvements over the decades, mainly in the form of signaling and a track structure capable of carrying heavy loads. (It is important as a coal route.)
With the Conrail acquisition complete, NS has increased traffic over the route. Both coal and carload merchandise traffic have increased. NS operates a Memphis–Harrisburg service on this line. However, the running times are slow, and the railroad reports that it will utilize alternate, faster north–south routes for the majority of its intermodal volume. Substantial infrastructure improvements would be required to provide the trip times needed to divert traffic from the highway. Curve straightening and other changes are very costly in the region’s mountainous terrain. NS also reports that such investments are unlikely to occur just to support the diversion of additional traffic from the highway. The margins on such traffic make it attractive only if the lengths of haul are long (more than 1,000 miles) or where surplus capacity exists. Neither of these conditions holds for this market.
During the proceedings leading to the Conrail breakup, NS designated this new single-line route the Shenandoah Route and cited it as one of the routes that would spur improved rail service between the Northeast and Southeast. NS stated that it expected to draw significant general merchandise and intermodal freight from trucks to rail service on the route and that it planned $33 million in investment for sidings and for doublestack clearances between Front Royal, Virginia, and Roanoke (Norfolk Southern n.d.).
The Railroad’s Proposal to the State
In August 2000, NS proposed to the state of Virginia that it consider public investment in improvements to the Shenandoah line as an alternative
solution to I-81 congestion problems. State officials from Maryland, North Carolina, Pennsylvania, Tennessee, and West Virginia also participated in discussions with the railroad. As a consequence, the Virginia legislature instructed VDOT to conduct a study, to be completed in 2001, of the feasibility of shifting traffic in the I-81 corridor from highway to rail.
The NS proposal included double-tracking much of the line, upgrading signals, reengineering curves, improving existing yard facilities, and developing intermodal terminals. The improvements would increase capacity and allow higher train speeds, which are requirements for attracting intermodal traffic to the line. The railroad estimated that at least 1,000 heavy trucks per day, and possibly as many as 3,000 per day, could be removed from the Interstate between Harrisburg and Chattanooga, that is, 10 to 30 percent of present heavy truck traffic. The railroad argued that it would be much cheaper to add needed capacity on the rail line than to the highway, especially considering benefits from improved safety and reduced environmental impact (Norfolk Southern 2000a; Norfolk Southern 2000b).
It may be something of an oversimplification of the functioning of the freight system to relate traffic growth on a specific highway to improvements on a specific rail line. A more realistic approach from the state’s point of view might be to consider whether improvements on rail lines throughout a corridor or region could reduce truck traffic on the main roads throughout the region. If rail improvements were successful in developing intermodal freight, then such traffic reductions would be achieved, although the effect of the rail line improvements might be to increase truck traffic in certain locations on roads leading to intermodal terminals.
Policy Issues
FEASIBILITY OF INTERCITY HIGHWAY CAPACITY EXPANSION
The VDOT plan for improvements to I-81 gives some grounds for optimism about the capability of the states to continue to expand highway capacity in response to traffic growth on major intercity truck routes. Although the highway is an older Interstate connecting some of the most densely populated parts of the nation, the state’s initial study indicates that right-of-way for widening will be available and does not identify any insurmountable environmental obstacles. The cost seems not unreasonable: it amounts to about $0.02 per vehicle-mile of travel that will occur on the road during the project’s 20-year schedule, according to the VDOT projections, and the improvements will have a lifetime beyond that 20-year period. The project has low risk in the sense that it can be done in stages, widening those segments earliest on which the immediate benefits would be greatest, and the schedule can be accelerated or retarded in accordance with the growth of traffic.
On the other hand, limitations on the state’s planning approach might raise concern over whether all potentially attractive options have been fully explored. VDOT’s recommendations to the Transportation Board seem to have been based primarily on projections of the date at which congestion on the route will start to become severe. They do not include quantitative estimates of benefits of the proposed improvements or analysis of sensitivity of benefits to uncertainties in traffic projections. The state agency did not explore the possible benefits of coordinated planning with adjoining states along the route of I-81. It was prompted to consider the alternatives of exclusive truck facilities and state-funded rail developments, but did not publish the results of its exclusive truck lanes analysis and did not consider any options involving alternative management and funding approaches to developing the highway. Planning for developing the route is still in preliminary stages, so there will be opportunity for VDOT to conduct more detailed analyses in the future.
Although the state apparently did not consider such alternatives relevant in this project, in some states facility management alternatives to highway expansion are regularly evaluated during project planning. An example is Minnesota, where ramp metering on urban freeways was installed after evaluation indicated that this technique would be preferable to physical expansion.
PUBLIC FUNDING OF RAIL CAPACITY AS AN ALTERNATIVE TO HIGHWAY EXPANSION
As described in Chapter 2, government grants to private freight railroads have occurred, usually on a small scale, for many years in the United States. They have included state rail assistance programs with and without federal support and ad hoc arrangements for single projects. TEA-21 contained a new program for federal rail assistance, the Railroad Rehabilitation and Improvement Financing program, which is to provide loans and loan guarantees to public or private sponsors for development or improvement of rail or intermodal facilities or equipment. The total amount of loans provided or guaranteed is $3.5 billion. This program would institutionalize the kind of federal credit assistance given to the Alameda Corridor port access project in Los Angeles.
Several arguments have been made in support of proposals for rail freight grants. First, it might be cheaper in some circumstances from the standpoint of the government to aid the railroad than to provide the same freight capacity by expanding highways. Such cost savings might be most significant in a densely developed location where right-of-way was more readily available for rail upgrading than for highway expansion.
Second, rail aid might be justified as a means to improve freight mar-
ket efficiency by offsetting subsidies truck operators receive because they do not pay the full cost of the highway service provided to them. As also described in Chapter 2 in the section on the future of user fee finance in state highway programs, the most recent DOT highway cost allocation study estimates that fuel taxes, registration fees, and other user fees paid by truck operators amount to 80 percent of the highway expenditures of all levels of government attributable to trucks, the same as the ratio of fees to costs for all vehicles. The DOT study does not compare fee revenues to costs by class of road. However, one analysis made plausible allocations of fees and costs between urban and rural roads and concluded that in 1975, payments by urban highway users exceeded urban highway expenditures by 13 percent, while on rural roads payments were 30 percent below costs (Meyer and Gómez-Ibáñez 1981, 198–203). Thus, according to these estimates, urban road users subsidize rural users.
Intercity roads include the truck routes that directly compete with railroads. Therefore, a subsidy to rural truck traffic paid by urban highway users would distort modal competition and degrade freight transportation efficiency. The significance of any urban/rural cross subsidy in highway user fees today is unknown. The study cited above is old and compared payments with costs for all vehicles, rather than for trucks alone. The study Paying Our Way (TRB 1996) estimated external costs and subsidies for case studies of individual truck trips. It found that the difference between estimated costs and fees paid varies widely and depends on the characteristics of the truck trip, but no consistent urban/rural bias is apparent in the small number of cases considered.
Because a railroad builds and owns its own track, it bears all the financial risk of misjudging the appropriate scale of infrastructure. Because highways are publicly owned and operated, a trucking company bears relatively little of the analogous risk of over- or under-building of highway infrastructure, even if the highway taxes it pays match the average highway agency costs attributable to it. The railroads argue that the public assumption of this risk also biases freight markets in favor of trucking.
Third, it is argued that rail freight transportation generates lower external costs per ton-mile (air pollution, highway congestion, and external accident costs) than truck and that favoring rail over truck would tend to promote more environmentally benign high-density urban development rather than low-density development. Fourth, the purpose of some large state aid projects has been to improve rail access to seaports, which the states regard as critical drivers of economic development. Finally, state programs to aid shortline railroads are often a means to indirectly aid farmers who use the lines.
Objections to rail aid programs have to do in part with administrative practicality. Would the government be able to discriminate between rail aid proposals that actually had a high chance of producing net benefits and
required government support and proposals that were without merit or that should be left in the private sector? Evidently, the states would have to use sophisticated analysis methods that they do not now possess in order to make such distinctions. Without tight management controls, the risk would be that application for government aid whenever a railroad wished to undertake a capital improvement would become routine, regardless of the merits of each case, and that states would feel obliged to provide aid, as governments do now for sports stadiums, for fear of losing development to rival states. Finally, subsidies limited to capital expenditures would bias railroads toward favoring capital solutions to capacity constraints instead of operating improvements to better utilize existing capacity that might be more cost-effective. Financial discipline would be easier to maintain if the aid program offered only partial grants and required a high level of private contributions.
In cases where the main argument for rail subsidy is the existence of subsidies or high external costs in trucking, an alternative would be for the state to adjust truck taxes to ensure that trucks covered their costs. Shippers would then select the best transportation options on the basis of true costs. The bias of shippers’ decisions would be further reduced if truck taxes were adjusted so that truck operators paid the costs of their use of roads not only on the average but for classes of operations, or, ideally, for individual movements. For example, as noted above, some evidence indicates that urban highway users subsidize rural users. Any subsidy to rural truck travel being paid by urban road users could be eliminated by imposing route-specific fees. If this method was judged to be impractical, the market distortion could be reduced by adjusting registration fees on various classes of trucks and fuel tax rates so that fees generated by rural truck travel in the aggregate more nearly matched the costs of that travel.
Arguments can be put forth that having urban road users subsidize rural travel is a beneficial arrangement, either on economic grounds (i.e., that because of scale economies, efficient charges imposed on rural road users could never finance the level of investment in rural roads that is economically justified) or as a way to make congestion pricing on urban roads more attractive (e.g., Small et al. 1989, 122). However, neither argument is generally accepted or well supported empirically. The growth of traffic and congestion on several important intercity truck routes today suggests that self-financing through marginal cost-based user fees on these routes might be as feasible as on congested urban roads. In any case, it would be possible to maintain a user fee scheme that featured an urban-to-rural subsidy in the aggregate but did not subsidize intercity truck travel.
With regard to relative external costs of the freight modes, the TRB study Paying Our Way found that, although external costs per ton-mile
generally are lower for rail than for truck transportation, marginal external costs as a percentage of freight rates are roughly similar for the two modes. This finding suggests that if all external costs were internalized, the competitive balance between the two modes might not change much (TRB 1996, 94). Finally, it should be noted that if a cost analysis indicated that satisfying projected demand growth on a route by increasing rail capacity would be cheaper than expanding highway capacity, an alternative for the state would be to do nothing rather than to build either highway or rail capacity. If rail is the low-cost alternative for freight traffic and the state charges truckers their true costs and does not provide economically unjustified highway capacity, then private-sector investment in rail expansion ought to be profitable.
Upper Mississippi River Locks
USACE recently conducted a study evaluating proposals for improvements to locks and other navigation facilities on the Upper Mississippi River and its tributary the Illinois River, to allow faster lock traversals of barges and relieve congestion at the locks. The study was controversial, with critics asserting that USACE overestimated shipper benefits from improvements, did not properly evaluate environmental costs, and dismissed traffic control measures and congestion pricing as alternatives to physical expansion (USACE n.d.).
The problems USACE encountered in its efforts to evaluate the improvements and the recommendations of an NRC committee and of others on how evaluations should be done in the future contain lessons that are generally applicable to large, long-lifetime public transportation infrastructure projects. These lessons concern dealing with the risk that arises from uncertain future demand, the necessity of considering operational alternatives to capital improvements, and valuation of environmental impacts.
Waterway System
The waterways in question are operated by USACE and include 28 dams equipped with locks on the Mississippi above St. Louis and nine on the Illinois River, which joins the Mississippi near St. Louis. The locks and dams were constructed by USACE, mostly in the 1930s, to allow navigation of the rivers by vessels with 9-foot drafts (USACE 1997, 2-1–2-16, 4-59–4-60). Freight is carried in barges pushed by towboats. On the Upper Mississippi, a typical tow is a towboat pushing 15 barges, 1,200 feet in length, with a cargo capacity of 22,000 tons. Since all but four of the locks are 600 feet long, the barges in a tow must be disassembled and pushed through by their towboat in two groups at each lockage. A
single lockage requires on the order of an hour (not including time spent waiting in the queue for the tow’s turn at the lock). Processing a tow in two passages doubles this time. The improvement that received the greatest attention in the USACE study was extending the locks to 1,200 feet in length so that 15-barge tows could pass in a single lockage.
Tows on the Upper Mississippi experience substantial delay on account of congestion. A barge might typically expect to experience 30 hours of congestion-induced delay during a 300-hour trip from the Upper Midwest to New Orleans. [Thirty hours is the sum of the average delay at each lock in 1999 (USACE 2000a)]. Substantially reducing this delay would reduce the total cost of the trip by several percent. Savings in tow operators’ costs would, in the long run, be roughly proportional to the reduction in trip time.
As an example, in 1999 at Lock 25, the last 600-foot lock above St. Louis, 84 percent of all tows experienced delay and the average delay for delayed tows was 4.5 hours. Delays at peak times can be much longer. The next lock downstream, below the confluence of the Illinois River—the Melvin Price Locks, a new facility with 1,200-foot lock chambers—handled 75 percent more tonnage with only one-sixth the average delay of Lock 25.
Lock 25 handled 39.5 million tons of freight in 1999. Seventy-one percent was downstream-bound farm products, mostly headed for export from the port of New Orleans. Eight percent of traffic was coal, primarily upstream-bound (USACE 2000b).
Since 1981, towing companies operating on the inland waterways have paid a federal excise tax on fuel. Today the tax is $0.20/gallon (USACE 1997, 5-2), roughly $0.0004/ton-mile for tows on the Upper Mississippi (TRB 1996, 155). Tax revenues, $101 million in 1998 (BTS n.d., Table 3-A), are credited to the Inland Waterways Trust Fund. One-half of construction expenditures for inland waterway improvements are to be from the trust fund. The Inland Waterways Users Board, created by Congress and made up of representatives of primary waterway users and shippers, advises Congress on priorities for trust fund projects. The balance of construction expenditures and all operating and maintenance costs are paid from federal general revenues. USACE operating and maintenance costs in 1995 were $95 million ($0.006/ton-mile) on the Upper Mississippi and $20 million ($0.002/ton-mile) on the Illinois. Capital expenditures averaged more than $100 million annually on the Upper Mississippi from the late 1980s through the mid-1990s (USACE 1997, 4-2–4-26). Congress must authorize all waterway construction projects, which are carried out by USACE.
The justification for subsidized construction and maintenance of freight infrastructure is a policy issue relevant to long-run freight capacity and to this study. However, the USACE evaluation of lock expansions
did not consider any change in this policy, and the NRC committee that reviewed the USACE study regarded the issue as beyond its scope, although that committee’s recommendation that congestion fees be considered as a management tool points toward finance alternatives. A proposal to make waterway users pay all maintenance costs through an increase in the fuel tax was offered to Congress by the administration in 1993 but not enacted (USACE 1997, 5-1). Implicit in USACE’s project evaluation procedure, which values transportation improvements according to waterway users’ willingness to pay, is the assumption that one possible argument for subsidies, the existence of external benefits generated by the waterways, is invalid.
Infrastructure Planning and Operations Issues
On account of the controversy over the USACE study, the U.S. Army asked NRC to review that study’s methods (NRC 2001). USACE had not published a final version of its study, so the NRC committee reviewed drafts and other publicly released preliminary materials. The results of the latest economic evaluation released at the time of the NRC study were that immediate construction of extensions to 1,200 feet for the most congested Mississippi locks and other smaller capital improvements on the Illinois and Mississippi would yield net annual benefits (before considering environmental costs) of $16 million under USACE’s mid-growth traffic projection (USACE 1999). The construction cost would be about $1 billion.
The following observations, which are based on the conclusions of the NRC committee, are relevant to the present study.
BENEFITS ESTIMATION
The basic framework used by USACE for evaluating the benefits of transportation improvements is appropriate. There are two key assumptions in this framework. First, the predominant benefit is the direct benefit to users of the transportation system in the form of reduction in their operating costs. In the Upper Mississippi study, the only significant benefit is the transportation cost reduction caused by the time savings from reduced congestion at locks. Second, the volume of traffic depends on the cost of using the waterway, including the cost of delays. Elastic demand indicates that shippers have alternatives for disposing of their products. If producers have available to them markets and transportation modes that are alternatives to transporting their grain by barge to New Orleans for export, then the benefits of waterway improvements will be lower than if few alternatives existed. Thus the more elastic demand is with respect to congestion costs, the less benefit there would be from expanding the locks.
Although these assumptions may seem elementary, they are not routinely used in transportation project evaluation. This study was the first navigation improvement evaluation in which USACE assumed that demand is not perfectly inelastic. USACE standards have long specified that the value of the improvement to the direct users of the transportation facility is the correct measure of benefits. However, skepticism on the part of USACE officials that this measure actually captures all the important benefits perhaps was a source of some of the controversial assumptions that were made in its study. A USACE internal guidance that was later publicly released states: “There is a need to improve the system. The well being of the Midwest depends on agricultural exports…. If the demand curves, traffic growth projections, and associated variables that the economics model can consider, do not capture the need for navigation improvement, then we have to figure out some other way to do it” (Environmental Defense 2000). The implication of this statement seems to be that the standard benefit measure ignores indirect benefits related to regional development.
However, the implementation of this framework in the USACE study was inadequate because USACE failed to collect the transactions data on shipment origins, destinations, quantities, and prices that are needed to implement a market model. Without data, the benefit estimates rested on unsupported assumptions about transportation supply and demand.
TRAFFIC PROJECTIONS
Traffic on the Upper Mississippi grew strongly for several decades until the mid-1980s, driven in large part by growth in agricultural product exports. Since the mid-1980s, traffic volumes have fluctuated, but the trend is nearly flat. The break in the trend may reflect fundamental changes in the global grain market—in particular, large gains in production efficiency in several regions of the world.
USACE based its evaluations on forecasts of the growth of traffic on the rivers through 2050. The forecasts are unconstrained by supply conditions; that is, they assume that traffic will not be curtailed by increasing congestion on the rivers. (The USACE evaluation model adjusts these projections downward to allow for the effect of congestion.) The forecasts are estimated with historical data through 1992. Low-, mid-, and high-traffic-growth scenarios projected growth averaging 0.7, 1.1, and 1.5 percent annually. By 1999, the forecasts were already substantially above actual traffic and appeared to deviate sharply from the recent trend.
The evaluation of navigation improvements is very sensitive to the rate of traffic growth. Under USACE’s low-growth projection, the November 1999 analysis showed that no major improvements would be justified at least until 2028. USACE’s sensitivity analysis illustrates how
large, indivisible capital projects with long lifetimes are high-risk investments when demand is uncertain.
TRAFFIC MANAGEMENT AND NONCAPITAL ALTERNATIVES
The USACE study, as described in the draft reports, did not fully examine options other than construction for relieving lock congestion. Possible nonstructural measures include traffic management through scheduling of tow movements, systematic use of helper boats (that is, use of a second towboat, either a towboat waiting in the queue or one stationed at the lock, to speed the process of disassembling and reassembling tows for lock passages), and use of congestion fees and tradable lock usage permits.
The NRC committee concluded that the locks are presently not being used efficiently and that lack of traffic management is causing shippers and tow operators to bear needlessly high costs. It recommended that lock performance with improved traffic management, rather than under current inefficient practices, be defined as the baseline from which to evaluate the benefits of major capital improvements. If this rule were applied in the evaluation of capital improvements on other publicly operated modes, in particular highways, it would greatly reduce the apparent benefits of many projects, since users of these modes also suffer from inefficient traffic management.
ENVIRONMENTAL COSTS
USACE spent the majority of the $50 million study budget on studies of the environmental impacts of the incremental changes in waterway traffic volumes that would result from lock improvements (e.g., changes in bank erosion, water turbidity, and fish mortality). However, USACE did not define the relationship between the results of the environmental studies and the process of deciding whether the lock extensions should be built. The study lacked a theoretical framework specifying the scope of relevant environmental impacts and how tradeoffs between environmental impacts and transportation cost savings are to be evaluated. In preliminary results, environmental costs entered only as costs of mitigation measures (for example, habitat replacement projects) without any showing that mitigation measures would offset the estimated impacts.
The NRC committee noted that, in addition to options defined with the sole objective of reducing shipper and carrier costs, USACE could have considered alternatives with the dual goals of enhancing environmental benefits of the rivers while maintaining transportation service. To allow consideration of such options, it recommended that a baseline study be conducted of the cumulative environmental impacts of the present waterway system.
NEED FOR EXTERNAL REVIEW
The NRC committee recommended that USACE studies of waterway navigation system capital improvements and management practices routinely be subject to technical review by outside, independent, interdisciplinary expert groups.
RISK MANAGEMENT
As noted in the discussion of traffic forecasts above, uncertain future demand makes large, indivisible transportation infrastructure projects risky investments. The USACE study evaluated multiple improvements of various kinds at multiple locations on the waterways system that could be staged over a 50-year planning horizon. However, the analysis tended to define alternatives as packages of improvements to be committed to in their entirety at one time. This approach is justified to some extent because of the interdependence of the system components: improving traffic flow at one lock may simply shift congestion to the next lock on the river without reducing trip times. Also, completion of lock construction projects takes many years once the decision to go ahead has been made, so if demand can be foreseen, benefits will be maximized by beginning construction before it materializes. However, the evaluation does not give a clear indication of the extent to which risk might be reduced by a strategy of staging construction and adjusting plans as demand develops.
The NRC committee noted several practices that can reduce the risk of large transportation infrastructure projects, including use of more sophisticated traffic forecasting models based on detailed structural analysis of underlying markets rather than on trend extrapolation; delaying construction until demand is evident; favoring low-capital alternatives and demand management over capital-intensive solutions; and continually monitoring conditions and retaining flexibility to change plans in response to new information.
FAST Corridor Project in Washington
The FAST Corridor in Washington State is a joint activity of the Washington State Department of Transportation (WSDOT) and the Puget Sound Regional Council (PSRC) that focuses on freight mobility in the north–south rail lines connecting Everett to Tacoma. Funded in 1999, Phase I of the FAST Corridor project is a collection of railroad grade crossing and port access improvements. Future phases will address truck-related issues and operational characteristics among roads, railroads, and intermodal facilities (PSRC 1999a; PSRC 1999b). The partnership and funding arrangements of the project, which has been cited frequently as a model of freight planning, are described in this case
study, and the possible impact of the project on port capacity and freight capacity throughout the Puget Sound region is considered.
Past policy studies, including the report of the National Commission on Intermodal Transportation, have asserted that local and state governments do not assign sufficiently high priority to projects important for freight mobility. Four causes for this failure are cited: first, government officials do not understand the needs of freight transportation; second, needed projects are ineligible for funding under the rules of established federal grant programs; third, projects are institutionally complex, involving multiple transport modes and multiple jurisdictions as well as private industries; and finally, certain important freight-related projects that benefit the nation as a whole fail to receive necessary local support on account of negative local impacts. These studies have proposed that if local governments did the right kind of freight planning, incorporating formal arrangements for receiving opinions from local freight carriers and shippers, they would find the high-payoff freight projects they are now missing. The FAST Corridor Project (as well as the Florida Freight Stakeholders Task Force described as the next case) can be viewed as experiments aimed at developing procedures and institutional arrangements to overcome these perceived problems in carrying out local freight projects.
Puget Sound Freight Capacity Issues
The Puget Sound region (Port of Seattle, Port of Tacoma, and Port of Everett) consistently ranks in the top three among U.S. port complexes in volume of container traffic. The majority of cargo tonnage through the ports is containerized. The Puget Sound region ports together rank 20th in cargo tonnage. The region’s container volume is about 30 percent of that of the leading port complex, the Ports of Long Beach and Los Angeles (AAPA 2003). These California ports are carrying out a $2.4 billion project, the Alameda Corridor, to construct a 20-mile rail cargo expressway linking the two ports to rail yards in downtown Los Angeles. The facility will eliminate the grade crossings in the corridor and allow increased speeds for rail traffic moving through the region. Aware of the Alameda Corridor project and its potential to affect competition among west coast ports, Puget Sound region officials see capacity and freight mobility as central to the region’s ability to remain competitive and sustain economic growth.
The U.S. Maritime Administration (MARAD) projects U.S. waterborne trade to more than double by 2020 over 1996 levels (MARAD 2000a), and the Ports of Seattle and Tacoma expect a 50 percent increase in the number of containers over the next decade alone (FHWA 2000c). Freight mobility and port capacity are critically linked to the operational characteristics of the railroads. In addition, new services planned by Amtrak and planned additional regional commuter trains present significant challenges
for rail infrastructure and operations in the region. The increasing cost of rail congestion was one of the primary motivations for the organizing efforts that led to the FAST Corridor project.
Partnership Arrangements: The Freight Mobility Roundtable
Since its inception, the FAST Corridor project has been implemented through partnership agreements among several public and private organizations. FAST participants include Washington State, PSRC, the Port of Tacoma, the Port of Seattle, the Port of Everett, 12 cities, 2 counties, the Burlington Northern Santa Fe Railroad, and the Union Pacific Railroad.
In 1994, PSRC and the public–private Economic Development Council of Seattle and King County, as part of an effort to update the Metropolitan Transportation Plan, founded the Freight Mobility Roundtable. An informal organization, the roundtable is not an authority but a coalition to bring private-sector firms together with public agencies under a common goal of freight mobility. The roundtable’s initial objective was to establish a dialogue between public agencies and the private sector. Its participants included major shippers like Boeing and Weyerhauser, the railroads, the ports, and public agencies (MARAD, the Federal Transit Administration, FHWA, the Federal Railroad Administration, the Department of Defense’s Medium Port Command, WSDOT, PSRC, the Regional Transit Authority, and the Puget Sound Air Pollution Control Agency). For the ports, the issue was competitiveness, driven primarily by their concern over the consequences of the Alameda Corridor and the possibility that the railroads might divert shippers away from the North-west to Los Angeles. For the communities, the issues were increasing delays at intersections, increasing train volumes, pollution, and noise (Roop and Mather 1997, Appendix B). The involvement of the private sector in the planning process reportedly was instrumental in the identification of freight problems and possible solutions. Among the concerns of the private-sector participants were problems in the public decision-making process and operating difficulties due to congestion in the region.
A Regional Freight Mobility Conference in Seattle in September 1994 established the FAST Corridor concept and set up a working group to form a long-term strategy for the corridor. Among its goals were to advance a package of freight projects and integrate freight into other planning decisions (FHWA 2000c). By 1995, the FAST Corridor project framework was incorporated into the regional plan of PSRC. In 1996, local and state participants began working in an interagency team named the FAST Corridor Agency Staff Team, cosponsored by PSRC and the WSDOT Office of Urban Mobility. In 1997, the Freight Mobility Roundtable isolated the highway– rail intersection problem as the freight mobility issue that it wished to attack first and contracted with the Texas Transportation Institute (TTI) to
evaluate highway–rail intersections in the FAST Corridor. The researchers developed a method to evaluate intersection improvement projects intended to balance port-related and community concerns. TTI used a simulation model to predict conflicts between rail and street traffic. Crossings were ranked by balancing port and community concerns using both quantitative and qualitative measures. The goals and measures selected for evaluating each crossing were as follows:
-
Improve general mobility—measured by the proposed grade separation’s ability to reduce vehicle delay, reduce vehicle queuing, and serve as a major cross-corridor arterial or regionally significant route;
-
Increase freight mobility—measured by the amount of truck traffic and the project’s ability to provide operational benefits for rail traffic;
-
Maintain safety—measured by the number of accidents reported by the Federal Railroad Administration at the intersection and the ability of the project to preserve or improve emergency vehicle access;
-
Enhance communities and the environment—measured by community-supplied values for political support, residential displacement, business development, strategic economic value, and vehicle emissions reduction; and
-
Maximize cost-effectiveness—measured by the calculated ratio between capital cost and the potential of the project to reduce vehicle delay.
Weights were assigned to each objective (Table 3-1) and candidate projects were rated accordingly. From the roundtable’s review of this evaluation emerged a 6-year, $470 million package of 12 grade separation projects and three projects for truck access to the ports, each with a distinct funding package, all scheduled for completion by 2004. It must be presumed that negotiations among the participants, as well as participants’ willingness to fund their own projects, determined priorities along with the analysis (Gallagher 2001). To implement the program, each party agreed to a Memorandum of Understanding in 1998, which included the following provisions:
-
Rail congestion and growth in vehicular traffic present challenges for international trade throughout the Puget Sound region.
-
The “FAST Corridor” refers to a series of related but independent projects consistent with the PSRC’s transportation plan.
-
Each selected project is the implementing agency’s responsibility to design and construct.
-
Implementation of each project is dependent on funding authorization by the party responsible for each project.
-
The Memorandum of Understanding does not create any legally enforceable rights or obligations on the part of any of the signatory agencies.
Table 3-1 TTI Project Priority Weighting Criteria (Roop and Mather 1997) Goal Objective Weight Measure
The Memorandum of Understanding thus was an informal, nonbinding framework establishing individually funded and administered, yet related, grade-separation and port access projects under a single label, the FAST Corridor.
After the signing of the Memorandum of Understanding, applications were made and approved for state and federal funding. With state and federal funding secured, each project was then financed under the authority of the lead agency for that particular project. In summary, funding sources are as follows:
|
Amount ($ millions) |
Percentage |
Source |
|
70.9 |
15 |
Lead agency |
|
74.3 |
16 |
TEA-21 Sec. 1118 Corridor Planning and Development Program |
|
44.3 |
9 |
TEA-21 High Priority Earmark |
|
131.6 |
28 |
Freight Mobility Strategic Investment Board (state) |
|
38.7 |
8 |
Ports |
|
18.9 |
4 |
Railroads |
|
91.6 |
19 |
Other sources, including PSRC, cities, counties, other federal |
The single largest project in the FAST Corridor (almost one-third of the total investment) is the $150 million SR-519 Intermodal Project. This project grade-separates SR-519 from the Burlington Northern Santa Fe mainline and provides access ramps among I-90, I-5, and the Port of Seattle waterfront.
The overall FAST Corridor concept includes five elements. The 15 Phase I projects constitute only one element. Other elements include site work at the ports, highway construction and reconstruction, and projects to improve mixed (freight and passenger) rail operations. Phase II is to focus on regional roadway needs. Planning activities are in the very early stages for elements not relating to Phase I, and funding for the later stages is uncertain.
Relation of the Project to Freight Capacity
Freight mobility in the Everett–Seattle–Tacoma Corridor is tied to the operational characteristics of the railroads, and rail performance today is constrained not by passenger-car conflicts but by the condition and capacity of the rail lines (Roop and Mather 1997, Appendix B). The principal direct benefit of the FAST Corridor Phase I projects is reduced local street congestion rather than improved train operations. Among the program’s
grade separation projects, three projects that facilitated rail yard expansions were the only ones among 40 grade crossing projects evaluated that were judged to have significant direct freight mobility benefits. Nonetheless, it is plausible that, as rail freight in the port area grows, interference with street traffic will eventually constrain port traffic growth. The projections indicate that without improvements some crossings would be closed to highway vehicles in excess of 40 percent of the time within 10 years.
The priority assessment of the Phase I projects was not structured to provide benefit–cost evaluations for each project or for the Phase I package. Therefore it is not possible to judge whether the combined benefits of reduced road delay, accidents avoided, and improved rail system functioning are sufficient to justify the $470 million investment, or to compare the return with that of alternative uses of the funds by the contributing governments. From the standpoint of the roundtable participants, fostering a working public–private relationship and allaying community objections to freight traffic growth may be the main benefits. The Phase I package can be seen as a community mitigation action that is “politically essential to any regionwide increase in rail container transshipments to other regions” (Central Puget Sound Region 1999, 37).
The FAST Corridor project is financed primarily by state and local funds and by federal aid that could be used for other purposes within the state if it were not devoted to these projects. The largest benefit of the project is mitigation of congestion, nuisance, and accident costs imposed by port rail traffic on local residents. A closer examination is needed of the fairness and economic efficiency of this financing arrangement, which is the result of the legal assignment of responsibility for rail grade crossings to the road agency rather than to the railroad. Reliance on public funding to mitigate spillovers means that railroads and ports do not fully take into account the public costs of their decisions to expand facilities. It is noteworthy that the Alameda Corridor rail port access project in Los Angeles, a project with goals similar to those of the FAST project, plans to derive the majority of its funding from fees charged to the railroads and from port user-fee revenues. Public expenditures to mitigate harmful side effects of freight traffic growth may well stimulate local residents to ask whether it is really in their best interest to host the freight facilities, considering the negative spillovers, demands for public subsidies, and the facilities’ occupancy of valuable urban property.
Florida Freight Stakeholders Task Force
The 1991 federal surface transportation act (ISTEA), through its declared goal of developing a national intermodal transportation system, appeared to increase program emphasis on using federal aid to address freight
mobility needs. The act also placed greater project selection authority in the hands of local governments and their metropolitan planning organizations (MPOs). Consequently, the freight industry and port authorities saw an urgent need for greater local engagement by freight interests in the transportation planning activities that determine public-sector investment priorities. Local public–private groups were formed in several areas to participate in planning and promote freight-related investments, and a coalition of national trade associations representing carriers, shippers, and port authorities formed the Freight Stakeholders National Network to support local freight advocacy nationwide (Freight Stakeholders National Network 1996).
The premise of these freight advocacy efforts is that local and state governments systematically miss high-payoff freight-related projects when they establish their transportation spending plans. This is the result of ignorance of freight needs or bias in favor of improvements benefiting primarily passengers, or because local governments are unwilling to expend local resources on transportation projects whose benefits are spread regionally or nationally. This case study and the Washington State FAST Corridor case examine the success of local public–private planning initiatives in improving the efficiency of public infrastructure investments.
The Stakeholders Task Force Process
The Florida Freight Stakeholders Task Force, organized as an outcome of the 1998 Governor’s Intermodal Transportation Summit, was charged with identifying and prioritizing freight-related transportation projects for fast-track funding as well as developing recommendations for the Year 2020 Florida Statewide Intermodal System Plan. Task force members represented port and airport authorities, MPOs, state and local government agencies, shippers, carriers, and third-party transportation services (CUTR 1999). The Florida legislature appropriated $10 million for fast-track funding of projects recommended by the task force, as an experiment to see how the new planning approach would work.
The task force contracted with the Center for Urban Transportation Research (CUTR) at the University of South Florida to define a Florida Strategic Freight Network. The resulting network definition includes the Florida intrastate highway system, ports, air freight terminals, rail intermodal terminals, highway freight terminals, and road connections between the Interstates and freight facilities. CUTR also developed eligibility criteria for project funding: projects were to be located on the Strategic Freight Network, facilitate freight movement, and have a ratio of public benefits to public costs greater than one. Finally, CUTR developed a prioritization methodology that rated projects according to the eligibility criteria, stage of development and environmental compliance,
time to completion, current level of service, safety considerations, neighborhood impact, and current freight volume.
Project applications were solicited from task force members, MPOs, ports, and airports. Seventeen projects totaling $101.3 million were identified and prioritized. The final project recommendations, selected to maximize the value of the projects funded, comprised five projects totaling $10 million. The scale of the budget suggests that the activity was seen as a trial.
In addition to developing and demonstrating its project prioritizing method, the task force addressed seven recommendations to the state to improve planning and increase funding for freight infrastructure:
-
Establish the Florida Strategic Freight Network as part of the state’s Intermodal Systems Plan,
-
Adopt the Florida Freight Stakeholders Task Force process for prioritization and selection of future freight projects,
-
. Fund future research and planning studies,
-
Conduct a Florida International Trade and Port Strategy Study to define specific trader corridor strategies and the supporting port investment priorities,
-
Establish a Florida Freight Advisory Council within the Florida Department of Transportation,
-
Establish “freight mobility committees” in the largest MPOs; and
-
Create a Florida Freight Investment Bank to fund freight projects.
Thus the objectives were to find a mechanism for institutionalizing freight-sector input to state transportation planning, to develop a formal process for budgeting and setting priorities for freight-related improvements, and to study freight needs.
Impact of the Task Force
To fully judge the success of the freight task force planning experiment, answers would be needed to three questions: Did the state follow through on the task force recommendations? Did the task force’s project priority assignments actually redirect funding toward projects that otherwise would not have been conducted? Did the projects selected yield higher payoffs than the projects they displaced in state and local transportation programs?
The Florida Strategic Freight Network has been included in the Florida Department of Transportation’s Year 2020 Florida Statewide Intermodal System Plan and is being updated by CUTR for the state. In addition, the network will be the starting point for a planned passenger– freight network, the Strategic Intermodal System. Presumably, inclusion of a facility in this system will tend to elevate the priority of any improve-
ment to that facility in the state’s spending program. However, because this system may be extensive, the average effect on priority rankings may be small. The state has not evaluated the benefit of favoring on-network projects in this way.
The task force went out of existence when it completed its report. However, several continuing state initiatives were affected by its work (FDOT 2000). As a complement to the task force’s efforts, in 1999 the state created the Fast Track Economic Growth Transportation Initiative, under which $59 million was made available for projects in aviation, rail, transit, seaport, space, or intermodal freight and passenger facilities. The task force recommended projects to be funded through this program, and projects were to be evaluated by procedures related to those the task force developed. In 2000, the legislature established the Transportation Outreach Program, which replaced the Fast Track Initiative. The program establishes a mechanism for funding projects according to selection criteria specified in the statute, which were influenced by the task force’s work. The state department of transportation, in support of its 2020 Intermodal Systems Plan, is developing a Florida Freight Network and Linkages Study to address the future of Florida’s trade corridors, project demand, analyze infrastructure needs, and evaluate operational issues relating to freight movement. Finally in 2000, Florida created a new wholly state-funded infrastructure bank with flexible rules regarding the kinds of transportation projects that can be funded, as the task force recommended.
It is likely that the projects selected by the task force eventually would have been programmed as part of the department of transportation’s regular prioritization and funding process. However, it is also likely that the effort has raised the prominence of certain categories of projects of significance for freight mobility and thereby increased these projects’ chances of receiving funding. The task force’s efforts enhanced awareness of freight issues and influenced subsequent executive and legislative policy directives on funding priorities.
It is not possible to ascertain whether the new priorities increase the efficiency of Florida’s transportation capital expenditures. As the task force recommended, $240,000 of its initial $10 million funding was allocated for continuing research on project benefit quantification and related tasks. Such analysis will be necessary before it can be determined whether the diversion of priorities has been beneficial.
PrePass
Automatic clearance systems, which screen trucks on the road and allow trucks that meet certain criteria to bypass enforcement stops, can increase enforcement efficiency in three ways: officers can concentrate their efforts on trucks that are more likely to be in violation; some enforcement func-
tions are automated, reducing their cost; and the cost of enforcement to carriers who obey regulations is reduced.
The most extensive such system in the United States is PrePass, which allows certified commercial vehicles to bypass designated weigh stations and port-of-entry facilities (where states, in addition to weighing, check that trucks entering the state comply with registration, fuel tax reporting, and other state requirements). As a truck that is enrolled in the program approaches a PrePass-equipped station, a transponder in the truck communicates with a terminal at the station, and its weight is checked automatically as it traverses a weigh-in-motion installation. If the computer verifies that the truck’s credentials are in order and its weight is legal, the transponder in the truck displays a green light to the driver and sounds a tone. A red light alerts the driver to pull in to the station.
The PrePass program is administered by a nonprofit corporation jointly governed by motor carriers and the states. It is funded by transaction fees paid by the participating carriers. PrePass began operation in 1995 and has 170,000 vehicles enrolled. It is deployed at 181 sites in 21 states and continues to expand (PrePass n.d.). Another multistate program, Norpass, is in operation in other states, and some states have their own independent systems.
The system’s voluntary public–private structure places certain limits on its application. It is not used to collect tolls, and if a carrier found that information in such a system was causing enforcement officials to single it out for greater scrutiny, it could respond by dropping its enrollment.
PrePass is one example of a technology with broad potential applications (Orban 2000). Already, similar automatic vehicle identification technology is used for toll collection. Extended applications would require enhancement of technical capabilities, greater investment in hardware by industry and public agencies, and new organizational arrangements. Improved enforcement capabilities could actually allow carriers greater freedom of operation with respect to routes, dimensions, and hours restrictions, because enforcement feasibility would become a lesser consideration in the design of regulatory programs.
PrePass and related systems directly affect capacity. Trucks experience less delay; therefore equipment utilization is higher and fewer trucks are on the road at any time. The technique can smooth processing bottlenecks and increase throughput at terminals. The technology allows improved management of the road system by the highway agency in a variety of ways, including more efficient use of personnel and use of more refined and effective fees and regulations.
Conclusions from the Cases
The cases all illustrate how institutional complexities pose great challenges to public officials charged with construction and management of
freight facilities. They suggest some reasons for optimism that progress is being made in overcoming these challenges. Innovation in planning is being attempted; examples are the use in state transportation departments of asset management systems and performance-based planning, which emphasizes performance measurement. More widespread and effective use of these methods is to be encouraged. In addition, transportation agency awareness of freight needs appears to be increasing. However, the cases do not reveal evidence that fundamental questions about the management of public transportation programs are being examined. The cases indicate that government evaluations of projects sometimes are weak; consequently there is inadequate assurance that low-payoff projects are not being selected while high-payoff ones are being overlooked.
Evidently, local and state government transportation agencies sometimes do not have methods for evaluating trade-offs between investments yielding benefits to freight traffic and those yielding predominantly passenger benefits. Local priorities will inevitably be set through political processes involving contending advocacy groups. If freight interests become more involved in this process, priorities will be shifted. Nonetheless, more credible objective analysis of the relative benefits of competing uses of funds would have an impact on decisions. A recent DOT analysis of public funding of freight infrastructure improvements reached the same conclusion: “Planners lack data and tools that they can employ to evaluate a freight project against a non-freight project” (FHWA n.d., 5). Development of improved methods for conducting evaluations that consider options involving alternative transportation modes has recently been a priority in research sponsored by the National Cooperative Highway Research Program and by DOT.
Benefit–cost analysis is necessary for evaluating the freight/nonfreight trade-off. The project evaluations in the Florida and Washington cases included benefit–cost analysis, although the results of the analyses were not heavily weighted in setting priorities and analyses were not highlighted or explained in the most widely distributed public reports of the activities. In general, in state highway programs throughout the United States, evaluation procedures for setting project priorities usually are defined in terms of engineering criteria rather than economic criteria (Hill et al. 2000, 100).
Governments do not, in general, evaluate how alternative funding mechanisms would affect the performance of transportation programs or follow project funding practices that maximize the chance of producing successful projects. Governments often appear to favor capital-intensive solutions over operational improvements. None of the cases selected indicates government interest in reexamining the scope of public involvement in freight transportation.
A common theme in the cases is that obstacles to problem resolution, as well as poor management decisions, often arise from inadequate communication among the private sector (shippers and carriers), government transportation agencies, and general government at the federal, state, and local levels. Intergovernmental communication, as well as public–private communication, evidently is necessary for efficient project execution. Public–private communication cannot be limited to soliciting the advice of interested parties in the private sector. Market transactions also are communications, in which buyers inform producers of their willingness to pay for transportation services. Communication might also be through scientific market surveys for use in project evaluations. The Upper Mississippi case shows that the government planners, although they listened to farm groups, lacked the hard data about present and future demand that they needed to evaluate the proposed capacity expansion.
Finally, PrePass is one example of the potential of technology applications to extend the effective capacity of infrastructure. The possibilities of these kinds of techniques may be just beginning to be realized. However, their success depends on institutional and management reforms in parallel with the opportunities opened by the technology.
INDUSTRY INTERVIEWS
The committee solicited views of shippers, carriers, and port operators, through informal interviews or requests for written comments, as an additional method of identifying freight capacity problems. The interviews were not a systematically conducted survey, so inferences must be limited. Nonetheless, the responses indicate the issues important to the respondents. The responses raised three sets of issues: characteristics of existing capacity constraints, emerging trends that affect those constraints, and potential solutions to existing and emerging problems.
Labor supply was the immediate constraint most commonly identified, especially by motor carriers, who universally reported that qualified drivers are difficult to attract and keep. The interviews took place before the 2001 recession. Carriers believe they could expand sales and handle more freight if they could hire more drivers. Port operators also reported difficulties obtaining certain kinds of skilled workers and cited a need for new training programs to increase the pool of qualified workers available to the industry.
A review of the labor practices of transport personnel in the port industry was called for by a port operator. Port operators identified needs to review and revise work practices that have outlived their original purposes, and to extend marine terminal operating hours to accommodate carriers.
With regard to physical facilities, motor carriers were aware that road capacity is not keeping pace with growth in volume. They also cited the
need for more efficient road operating practices, for example, faster toll collection and measures to reduce delays for weighings.
Port operators noted that lack of available land for expansion is a concern. Respondents expect continued strong growth in trade and therefore believe that it is urgent to plan for new and larger facilities and to secure land for terminals before competing uses block the possibility of expansion.
Respondents frequently cited regulatory constraints on efficient operation and expansion. Motor carriers identified interstate variability in vehicle size and weight limits and hours of service regulations that they regard as impractical and as aggravating the driver shortage. Shippers cited customs delays at ports and at the Mexican border as a substantial inefficiency. Port operators identified environmental regulations governing disposal of dredged material as a serious constraint on capacity expansion.
The emerging trends affecting the adequacy of freight capacity that were most often mentioned mainly relate to continued change in the characteristics of freight demand. Examples are the emergence of e-business, changes in supply chain management practices (including preferences with regard to freight mode, shipment size and frequency, and procurement and inventory strategies), and shippers’ increasingly exacting requirements for reliability and speed. One respondent noted that higher energy prices may profoundly affect the market in the future.
Taken as a whole, the responses illustrate forcefully that physical plant is not the only potential capacity constraint on the freight transportation system. Short-run constraints are more likely to be equipment or labor shortages than shortages of road space or trackage. Reported labor supply concerns presumably reflect upward pressure on the wages that operators must pay to attract qualified employees. Labor and equipment supply are primarily short-run problems that carriers, suppliers, and workers can resolve in the private market. However, public policy concerning education, regulation of workplace conditions, immigration, and rights of foreign carriers to enter the United States will be important for the long-term labor outlook.
REFERENCES
Abbreviations
AAPA American Association of Port Authorities
AAR Association of American Railroads
AASHTO American Association of State Highway and Transportation Officials
ATA American Trucking Associations
BEA Bureau of Economic Analysis
BLS Bureau of Labor Statistics
BTS Bureau of Transportation Statistics
CUTR Center for Urban Transportation Research
DOT U.S. Department of Transportation
EIA Energy Information Administration
FAA Federal Aviation Administration
FDOT Florida Department of Transportation
FHWA Federal Highway Administration
GAO U.S. General Accounting Office
MARAD Maritime Administration
NRC National Research Council
PSRC Puget Sound Regional Council
SCAG Southern California Association of Governments
TRB Transportation Research Board
TTI Texas Transportation Institute
USACE U.S. Army Corps of Engineers
VDOT Virginia Department of Transportation
AAPA. 2003. Port Industry Statistics. www.aapa-ports.org/industryinfo/statistics.htm.
AAR (various years). Railroad Facts. Washington, D.C.
AASHTO. 2001. Bill Introduced to Facilitate Transit Access to Freight Rail Facilities. AASHTO Journal, Vol. 101, No. 31, Aug. 3.
ATA. 2000. U.S. Freight Transportation Forecast to 2008.
BEA. 1998. GDP and Other Major NIPA Series, 1929–91. Survey of Current Business, Aug., pp. 147–166.
BEA. 2000. GDP and Other Major NIPA Series, 1929–2000: I. Survey of Current Business, Aug., pp. 120–139.
BEA. 2001. GDP and Other Major NIPA Series, 1929–2001: I. Survey of Current Business, Aug., pp. 121–140.
BLS. 2002. Industry Labor Productivity and Labor Cost Data Tables. U.S. Department of Labor. www.bls.gov/lpc/iprdata1.htm.
BTS. n.d. Government Transportation Financial Statistics 2001. Washington, D.C. Central Puget Sound Region. 1999. Infrastructure [citation].
CUTR. 1999. 1999 Florida Freight Stakeholders Task Force Report. University of South Florida.
DOT. 2000. NHS Intermodal Freight Connectors: A Report to Congress. Washington, D.C., July.
DOT. 2002. Highway and Transit Environmental Streamlining Progress Summary: Report to Congress. Washington, D.C., Feb.
EIA. 1999. Annual Energy Outlook 1999. U.S. Department of Energy, Washington, D.C.
EIA. 2000. Annual Energy Outlook 2001. U.S. Department of Energy, Washington, D.C., Dec.
EIA. 2002. Annual Energy Review 2001. U.S. Department of Energy, Washington, D.C.
Ellis, E. 2000. On Time Isn’t Good Enough. Trains, July, pp. 14–15. Environmental Defense. 2000. Affidavit of Donald C. Sweeney. Feb. 1. www.environmentaldefense.org/programs/ecosystems/Mississippi/ms_affidavit.html.
FAA. 2001a. FAA Aerospace Forecasts FY 2001–2012. March. www.api.faa.gov/pubs.asp.
FAA. 2001b. Airport Capacity Benchmark Report 2001.
FDOT. 2000. Report on the Status of the Recommendations of the Florida Freight Stakeholders Task Force. Dec.
FHWA. 1997a. 1997 Status of the Nation’s Surface Transportation System: Summary. U.S. Department of Transportation, Washington, D.C.
FHWA. 1997b. Doing It Together. www.itsdocs.fhwa.dot.gov/edldocs/745/r95rth13.htm.
FHWA. 1998. TEA-21 Factsheets. www.fhwa.dot.gov/tea21/factsheets/index.htm.
FHWA. 2000a. Highway Statistics 1999. U.S. Department of Transportation, Washington, D.C.
FHWA. 2000b. NHS Intermodal Connectors Condition and Investment Study. ops.fhwa.dot.gov/freight/present_files/.
FHWA. 2000c. FAST Corridor Case Study.
FHWA. 2000d. 1999 Status of the Nation’s Highways, Bridges, and Transit: Conditions and Performance. U.S. Department of Transportation, Washington, D.C.
FHWA. n.d. Funding and Institutional Options for Freight Infrastructure Improvements. www.ops.fhwa.dot.gov/freight.
FHWA (various years). Highway Statistics. U.S. Department of Transportation, Washington, D.C.
Fraumeni, B.M. 1999. Productive Highway Capital Stock Measures. Federal Highway Administration, Jan. www.fhwa.dot.gov/reports/phcsm/.
Freight Stakeholders National Network. 1996. Improving Freight Mobility: Survey of Metropolitan Planning Organizations. March.
Gallagher, J. 2001. Bully Railroads. Traffic World, Jan. 29, pp. 27–29.
GAO. 1997. Transportation Infrastructure: Managing the Costs of Large-Dollar Highway Projects. Washington, D.C., Feb.
GAO. 1998. Surface Infrastructure: Costs, Financing and Schedules for Large-Dollar Transportation Projects. Washington, D.C., Feb.
GAO. 1999. Railroad Regulation: Changes in Railroad Rates and Service Quality Since 1990. GAO/RCED-99-93. Washington, D.C., April.
GAO. 2000. Aviation and the Environment: Airport Operations and Future Growth Present Environmental Challenges. Washington, D.C., Aug.
Gillis, C., and P. Damas. 1998. Intermodal or All-Water? American Shipper, Oct., pp. 66–70.
Gordon, R.J. 1992. Productivity in the Transportation Sector. In Output Measurement in the Service Sectors (Z. Griliches, ed.), University of Chicago Press, Chicago, Ill., pp. 371–422.
Hill, M.C., B.D. Taylor, A. Weinstein, and M. Wachs. 2000. Assessing the Need for Highways. Transportation Quarterly, Vol. 54, No. 2, Spring, pp. 93–102.
Katz, A., and S. Herman. 1997. Improved Estimates of Fixed Reproducible Tangible Wealth, 1929–1995. Survey of Current Business, May, pp. 69–92.
Krause, K.S. 2001. Boston’s Cargo-less Solution? Traffic World, July 16, pp. 28–29.
Lally, P. 2002. Fixed Assets and Consumer Durable Goods for 1925–2001. Survey of Current Business, Sept., pp. 23–39.
Lang, D. 2000. Railroads Still Falling Short in Bid to Take Truck Freight. Transport Topics, Nov. 13, p. 13.
Larson, P.D., and B.H. Spraggins. 2000. The American Railroad Industry: Twenty Years After Staggers. Transportation Quarterly,Vol. 54, No. 2, Spring, pp. 31–45.
Laurio, A. 2002. Bill on I-81 Truck Tolls Sent to Va. Gov. Warner. Transport Topics, March 11, p. 1.
Lindley, J.A. 1987. Urban Freeway Congestion: Quantification of the Problem and Effectiveness of Potential Solutions. ITE Journal, Jan., pp. 27–32.
Lockwood, S., R. Verma, and M. Schneider. 2000. Public–Private Partnerships in Toll Road Development: An Overview of Global Practices. Transportation Quarterly, Vol. 54, No. 2, Spring, pp. 77–91.
Machalaba, D. 1998. Railroads’ Big Outlays on Infrastructure Are Questioned. Wall Street Journal, April 30, p. B4.
MARAD. 1998. A Report to Congress on the Status of the Public Ports of the United States, 1996–1997. U.S. Department of Transportation, Oct.
MARAD. 2000a. Assessment of the U.S. Marine Transportation System. U.S. Department of Transportation.
MARAD. 2000b. U.S. Port Development Expenditures Report. U.S. Department of Transportation, Dec.
MARAD (various years). A Report to Congress on the Status of the Public Ports of the United States. U.S. Department of Transportation.
Meyer, J.R., and J.A. Gómez-Ibáñez. 1981. Autos, Transit, and Cities .Harvard, Cambridge, Mass.
Norfolk Southern. 2000a. Thoroughbred Paces, Sept.–Oct.
Norfolk Southern. 2000b. Norfolk Southern Network. Aug. 18. www.nscorp.com.
Norfolk Southern. n.d. Backgrounder: The Norfolk Southern Operating Plan. www.nscorp.com.
NRC. 2001. Inland Navigation System Planning: The Upper Mississippi River–Illinois Waterway. National Academy Press, Washington, D.C.
Orban, J.E. 2000. What Have We Learned About ITS for Commercial Vehicle Operations? Status, Challenges, and Benefits of CVISN Level 1 Deployment. In What Have We Learned About Intelligent Transportation Systems (J.M. Sussman, ed.), FHWA, Dec.
Oum, T.H., W.G. Waters II, and C. Yu. 1999. A Survey of Productivity and Efficiency Measurement in Rail Transport. Journal of Transport Economics and Policy, Vol. 33, Part 1, Jan., pp. 9–42.
Phillips, D. 1999. It Could Be Worse, but It Ain’t “Service.” Trains, Sept.
Phillips, D. 2000. With So Much Water, Who Needs Railroads? Trains, Oct., pp. 14–15.
PrePass. n.d. PrePass, a Nationwide Weigh Station Bypass Service. www.prepass.com.
Prince, T. 2001. Chicago Intermodal Problem. American Shipper, Jan., pp. 67–70.
PSRC. 1999a. Fast-Corridor Jumps Forward. Regional View, Jan. www.psrc.org/view.
PSRC. 1999b. The FAST Corridor and the 2001 MTP Update—A Corridor Planning and Action Strategy. Regional View, Sept. www.psrc.org/view.
Roop, S. S., and S. K. Mather. 1997. Development of a Computer Model for Multimodal, Multicriteria Transportation Investment Analysis: Final Report. Summary Report on the Washington State FAST Project. National Cooperative Highway Research Program, Dec.
SCAG. 2000. The State of the Region 2000.
Shaw, P.L. 1992. Seaport–Surface Transportation Access and Urban Transportation Congestion.Working Paper 116. University of California Transportation Center, Berkeley, Aug.
Skamris, M.K., and B. Flyvbjerg. 1996. Accuracy of Traffic Forecasts and Cost Estimates on Large Transportation Projects. In Transportation Research Record 1518, TRB, National Research Council, Washington, D.C., pp. 65–69.
Small, K.A., C. Winston, and C.A. Evans. 1989. Road Work: A New Highway Pricing and Investment Policy. Brookings Institution, Washington, D.C.
Smallen, D. 1998. Intermodal Connectors: NHS Catches Up to the 1990s. Public Roads, May–June.
Texas Center for Border Economic and Enterprise Development. 2001. Border Trade Data. Jan. 4. www.tamiu.edu/coba/txcntr/index.htm.
TransTech Management, Inc. Forthcoming. Environmental Streamlining: A Report on Delays Associated with the Categorical Exclusions and Environmental Assessment Processes.
TRB. 1996. Special Report 246: Paying Our Way: Estimating Marginal Social Costs of Freight Transportation. National Research Council, Washington, D.C.
Truckinginfo.com. 2002. Trucker Lanes Proposed for I-81 in Virginia. Jan. 22. truckinginfo.com/news/news_detail.asp?news_id=45852.
USACE. 1997. 1997 Inland Waterways Review. Sept.
USACE. 1999. Sensitivity Analysis. Presentation to the Governors’ Liaison Committee, Nov. 19.
USACE. n.d. UMR-IWSW System Navigation Study Home Page. www.mvr.usace.army.mil/pdw/nav_study.htm.
USACE. 2000a. Lock Performance Monitoring System Summary by River Basin, January–December 1999. www.wrsc.usace.army.mil/ndc.
USACE. 2000b. Key Lock Report—1999 Monthly Tonnage. www.wrsc.usace.army.mil/ndc.
USACE. 2001. Waterborne Commerce of the United States: Calendar Year 2000: Part 5— National Summaries.
USACE. 2002. Civil Works Programs 2001.
VDOT. 1997. Interstate 81 Trucker Survey Report.
VDOT. 1999a. Route 81 Traffic Data. Oct. 4.
VDOT. 1999b. I-81 Update. Summer.
VDOT. 1999c. I-81 Update. Spring.
Wilson, R.A. 2001. Transportation in America 2000. Eno Foundation.


