
5
Social and Economic Value of Oysters in the Chesapeake Bay
Crassostrea virginica has occupied a prominent position in the ecology and economy of the Chesapeake Bay. In the early colonial period, oysters were so abundant that reefs posed navigational challenges to vessels. Early fisheries supplied food and fill for road construction. Demand grew and harvesting capacity expanded through the end of the 19th century. Oyster harvests peaked in the 1870s and 1880s with the commencement of dredging on deep channel reefs and then began a precipitous decline, falling by nearly 60% between 1880 and 1930. Harvests held fairly stable from 1930 through the late 1950s in Virginia, before collapsing to the present low levels. Maryland harvests held stable for longer, from 1930 through the 1970s, but have since collapsed. Present harvests from Maryland and Virginia are less than 2% of the 1880 harvest. The decline from 1880 through 1930 is consistent with excess harvesting. The subsequent decline seems closely linked to Dermo and MSX, exacerbated by increased salinity levels throughout the bay associated with a sequence of years with below-average precipitation. In addition, elevated levels of tributyltin oxide, agricultural pesticide residues, and other chemical stressors have been implicated in increased morbidity. Kennedy and Breisch (1983) provide a history of Chesapeake Bay oysters from the mid-1800s through the early 1980s.
Economic analyses of the oyster fishery have included studies of the theoretical merits of leased-bottom versus public-bottom management paradigms (Christy, 1964; Agnello and Donnelly, 1975, 1976, 1984; Santopietro and Shabman, 1992a, 1992b), an ex ante evaluation of the
potential consequences of introducing C. gigas (Lipton et al., 1992), estimates of the cost efficiency of relaying for depuration or to reduce morbidity (Easley, 1982; Dunning and Adams, 1995; Keithly and Diop, 2001a, 2001b), the strength of leased-bottom claims as a basis for redress against sources of bioaccumulated toxic compounds (Ajuzie and Altobello, 1997), an evaluation of the role that increased seed prices played in the recent fishery decline (Bosch and Shabman, 1989), a model of the return to investment in research into the causes of recent fishery declines (Bosch and Shabman, 1990), and assessments of the current economic status of the oyster fishery (Lipton and Kirkley, 1994; Kirkley, 1997; Lipton, 2002).
Between 1980 and 2001, oyster production and harvest effort declined throughout the bay; however, production did not fall evenly. As shown in Table 5.1, Maryland produced roughly 2.1 million bushels of oysters in 1980, while Virginia produced 1.1 million bushels.1 By 2001 production from Maryland waters was approximately 348,000 bushels, a decline of approximately 83% from 1980 levels. During the same period, production from Virginia waters declined approximately 98%, to about 23,000 bushels. Virginia’s share of the harvest fell from 34% in 1980 to 6% in 2001. Total production, man-days of labor, number of license holders, estimated average income, and number of processing plants are all below their 1980 levels.
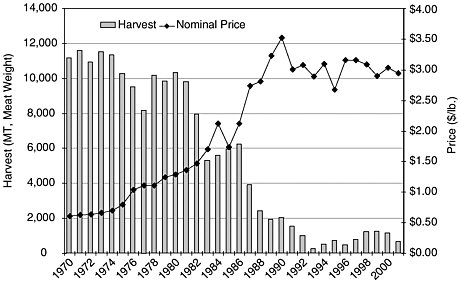
As production declined, the per unit value of oysters increased. The nominal value of a bushel of oysters in 2001 was more than three times the 1975 value (see Figure 5.1). After adjusting for the effect of inflation, it becomes apparent that increases in prices paid to harvesters have not been high enough to offset overall production losses; thus, the total value of the oyster harvest in 2001 was significantly smaller than the 1980 value. For 1980 the total dockside value of the Chesapeake oyster harvest was $29.3 million. In 2001 it was $4.3 million (National Marine Fisheries Service [NMFS], 2003), a drop of more than 85% (see Figure 5.2). When expressed in real terms (2001 dollars), the loss in total dockside value was closer to 93%; a drop from $60.1 million in 1980 to $4.3 million in 2001 dollars. Moreover, as oyster abundance has declined, catch per unit of effort has also declined. The adoption of cost-reducing technological changes has been constrained by regulation, suggesting that the cost per unit landed has increased. Harvester net returns have been caught in the double bind of falling revenues and rising costs. Because oyster harvests declined more precipitously in Virginia than in Maryland, real value fell from $40.6 million to $3.8 million in Maryland and from $19.5 million to
TABLE 5.1 Chesapeake Bay Oyster Statistics for Maryland and Virginia
|
|
Maryland and Virginia |
1995 |
2000 |
2001 |
||
|
SEASON |
1980 |
1985 |
1990 |
|||
|
LANDINGS (BU) |
|
|||||
|
Maryland |
2,111,080 |
1,142,493 |
414,445 |
164,641 |
380,675 |
347,968 |
|
Virginia |
1,074,776 |
627,052 |
162,618 |
55,414 |
22,623 |
22,573 |
|
Virginia Share |
34% |
35% |
28% |
25% |
6% |
6% |
|
Total for Bay |
3,185,856 |
1,769,545 |
577,063 |
220,055 |
403,298 |
370,541 |
|
MAN-DAYS |
|
|||||
|
Maryland |
154,460 |
146,994 |
80,170 |
28,637 |
47,595 |
42,176 |
|
Virginiaa |
|
|||||
|
LICENSE HOLDERS |
|
|||||
|
SELLING OYSTERS |
|
|||||
|
Maryland |
2,246 |
1,807 |
1,156 |
603 |
1,773 |
1,293 |
|
Virginia |
2,622 |
2,081 |
1,782 |
399 |
295 |
320 |
|
Total for Bay |
4,868 |
3,888 |
2,938 |
1,002 |
2,068 |
1,613 |
|
AVERAGE BUSHELS |
|
|||||
|
PER MAN-DAY (BU) |
|
|||||
|
Maryland |
13.7 |
7.8 |
5.2 |
5.7 |
7.9 |
8.3 |
|
Virginiab |
|
|
|
|
3 to 6 |
|
|
ESTMATED INCOME |
|
|||||
|
FROM OYSTERS PER |
|
|||||
|
LICENSE HOLDER |
|
|||||
|
SELLING ($) |
|
|||||
|
Maryland |
7,900 |
9,300 |
8,600 |
5,400 |
4,100 |
5,300 |
|
Virginiac |
3,600 |
3,500 |
2,400 |
2,700 |
1,600 |
1,800 |
|
OYSTER PROCESSING |
|
|||||
|
PLANTS |
|
|||||
|
Maryland |
|
|
20 |
|
|
|
|
Virginia |
|
|
28 |
|
|
|
|
CERTIFIED FACILITIES |
|
|||||
|
Maryland |
|
|||||
|
Shucker Packers |
|
|
|
|
29* |
|
|
Shellstock Shippers |
|
|
|
|
67* |
|
|
Repackers |
|
|
|
|
06* |
|
|
Reshippers |
|
|
|
|
16* |
|
|
Virginia |
|
|||||
|
Shucker Packers |
|
|
|
|
62* |
|
|
Shellstock Shippers |
|
|
|
|
09* |
|
|
Repackers |
|
|
|
|
05* |
|
|
Reshippers |
|
|
|
|
08* |
|
|
*Data from 2002 aVirgina does not track man-days. bThe VMRC estimates Virigina harvest per manday at 3 to 6 bushels. cVirginia income estimates may be biased downward because not all license holders may be selling oysters. SOURCE: Data from J. Wesson, Virginia Marine Resource Commission (VMRC), Newport News, personal communication, 2003; C. Judy, Maryland Department of Natural Resources, Annapolis, personal communication, 2002. |
||||||
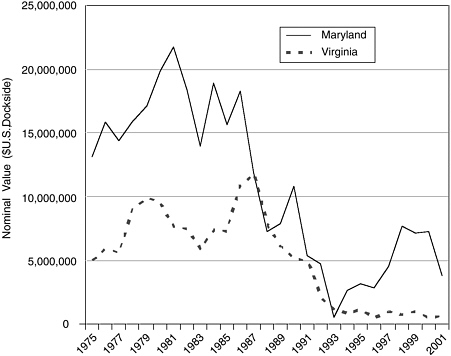
$0.57 million in Virginia, declines of 91% and 97%, respectively (see Figure 5.3) (NMFS, 2003). In 1980 the value of Chesapeake Bay oyster harvests was shared, with 64% going to Maryland and 36% to Virginia. By 2001 the split had shifted such that Maryland’s share increased to 87% and Virginia’s share declined to 13%.
Between 1980 and 2001, effort also declined throughout the bay, but not by as much as production (in relative terms). The number of man-days of effort in Maryland fell 73%, from 154,000 in 1980 to 42,000 in 2001 (Table 5.1). Because the decline in effort has not matched the decline in production, the average number of bushels produced per unit of effort has also fallen. Catch per unit of effort in the Maryland fishery in 2001 was about 39% lower than it was in 1980. Because Virginia does not track the number of man-days of effort for oyster harvests, it is not possible to compare changes in catch per unit effort for Virginia oystermen. Nevertheless, based on reported estimates that Virginia oystermen average 3 to 6 bushels per man-day of effort (J. Wesson, VMRC, Newport News, per-
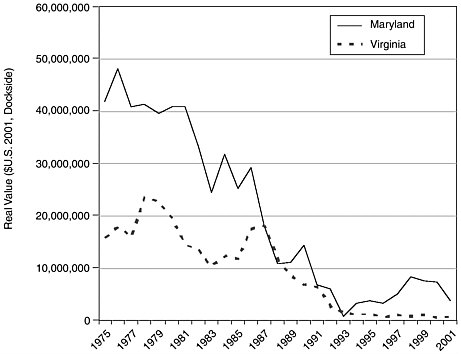
FIGURE 5.3 Real (2001 $U.S.) value of Maryland and Virginia’s C. virginica harvest.
SOURCE: Data from NMFS (2003); U.S. Department of Labor, Bureau of Labor Statistics (2003).
sonal communication, 2003), it is likely that Virginia oystermen catch 25 to 65% less per man-day than their Maryland counterparts.
The number of license holders has dropped 42% in Maryland and 88% in Virginia since 1980. Average revenues per license holder have declined by 50 to 67% from 1980 levels. The average revenue per license holder in Virginia is 25 to 33% of that in Maryland. However, it should be noted that holding a license does not indicate active participation in the fishery. Licenses can be bought to maintain the option of entering the fishery if conditions improve. Since Virginia oyster harvest licenses cost less than $70 in 2001, purchasing a license can be viewed as an inexpensive investment that ensures an option to access the fishery and serves as evidence of interest should the state choose to implement a license limitation program or seek disaster assistance on behalf of oystermen who have been adversely impacted by the decline in oyster populations.
As the Chesapeake oyster harvest has declined, the Gulf of Mexico region has become the dominant source of C. virginica harvested in the United States. In 1950 the gulf accounted for less than 20% of the C. virginica harvest; the gulf region now provides about 90%. In contrast the
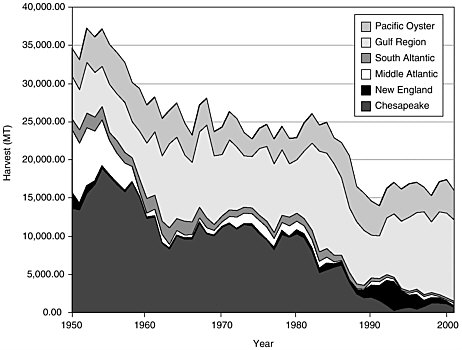
FIGURE 5.4 U.S. C. virginica (by region) and Pacific oyster harvest.
SOURCE: Data from NMFS (2003).
Chesapeake Bay region accounted for only about 6% of the 2001 harvest of C. virginica (see Figure 5.4). When harvests of oysters on the West Coast (primarily nonnative C. gigas) are included, the Chesapeake’s share of the U.S. domestic oyster harvest declines to 4%. Production increases outside the Chesapeake region have helped offset losses in the bay. Although total domestic harvest declined consistently throughout the 1980s, it has gradually increased since 1991. In addition, imports of oysters have generally increased since 1994. In 1994, imports of competing oysters (fresh, frozen, and live, primarily from Canada, excluding smoked and canned) were 1,727 million tons. By 2001 oyster imports had increased to 2,437 million tons (NMFS, 2003; see Figure 5.5a). As a result, in 2001 Chesapeake oysters accounted for only 3% of total oyster supply and have ranged between 1 and 5% of total supply for the past decade. As indicated in Figure 5.5b, total oyster supplies have trended upward, and the real price—the price adjusted to eliminate the effect of inflation—of Chesapeake oysters has trended down over the past decade. Total U.S. oyster supply (including fresh, frozen, and live, excluding smoked and canned) increased from 1991 to 2001 by 15%. At the same time, the real price of Chesapeake Bay oysters declined by 24%, despite the fact that the Chesapeake oyster harvest declined by 55% over the period. The Chesapeake
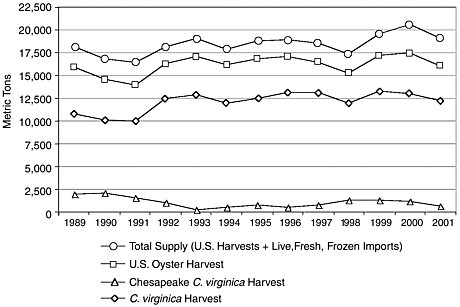
FIGURE 5.5a U.S. Oyster supplies (meat weight).
SOURCE: Data from NMFS (2003).

FIGURE 5.5b Chesapeake oyster real prices and U.S. oyster supply.
SOURCE: Data from NMFS (2003).
Bay has gone from being the dominant source of oysters in the 1950s to providing only about 3% of the present-day supply (including imports).
The economic effects of the decline in Chesapeake Bay oyster production extend beyond just the oystermen themselves. Many Virginia and Maryland processors have begun to rely increasingly on oysters from outside the region to meet their needs. In a survey of processors conducted during 1991, it was found that 31% of Maryland respondents and 53% of Virginia respondents handled Gulf of Mexico oysters. In addition, 20% of Virginia respondents and 8% of those in Maryland also handled oysters from the Pacific. This dependence on oysters from outside the region increased through the 1990s. Although Virginia has a smaller harvest, it has a larger processing sector. NMFS data for 1997 indicate that there were 21 processing and shucking plants in Virginia with 389 employees producing 1,670 million tons of shucked oysters (about 25 times Virginia’s harvest) valued at $16.3 million. In contrast, Maryland had 11 reporting plants with 249 employees producing 546 million tons of shucked oysters (about 10% greater than Maryland’s harvest) valued at $5.4 million (Muth et al., 2000). Between 1974 and 2000, both Maryland and Virginia experienced a 65% drop in the number of oyster-processing plants. In fact, during this period Virginia lost almost as many plants (52) as the total number (58) of plants present in Maryland at the beginning of the period (Lipton, 2002). These losses have affected oystermen, processors, and the people and communities that relied on these processors for employment.
Very little public information is available on the cost efficiency of different aquaculture systems for oyster production. Uncontained systems characteristic of current leased-bottom fisheries require limited capital investment and, consequently, are of lower cost than other production systems. However, uncontained systems are subject to greater losses to siltation and predation. In a comparison of stake and rack production systems, Samonte-Tan and Davis (1998) reported that cost efficiency is dependent on the scale of the production system. While it is often assumed that capital intensity will increase with the scale of production, Samonte-Tan and Davis also found that labor- and capital-intensive rack production was most efficient for small-scale producers, while the comparatively less capital intensive stake production method was most cost efficient for large-scale producers.
MARYLAND AND VIRGINIA STATE SUMMARIES
Despite the decline in the C. virginica fishery, it continues to provide economic and sociocultural value to various stakeholder groups in the region. In this section, economic and sociocultural information for Maryland and Virginia is presented in order to establish a comparative baseline from which to evaluate some of the potential benefits and risks of introducing a triploid or diploid C. ariakensis, into the Chesapeake Bay.
Most of the following discussion focuses on approximately the past 10 years. The selection of this recent time period provides a contemporary picture of the value of the C. virginica oyster fishery. Finally, in discussing the value of the bay oyster fishery based on C. virginica it is important to include both economic and sociocultural data at the industry- or fisherywide and household or community levels.
Maryland
During the 60 years before oyster diseases became a dominant factor in the 1980s, harvests in the Maryland portion of the Chesapeake Bay supported an annual commercial fishery of approximately 2 million bushels (Chesapeake Bay Program, 2002). Since 1993 the average annual harvest has been approximately 233,000 bushels, with the lowest recorded harvest occurring in 1994, followed by a rebound in harvests to 423,000 bushels in 1997, followed by another decline in 2002 to 148,000 bushels. Reports based on small-scale surveys for the 2003 season suggest that the harvest will be very low, perhaps even below the all-time low in 1994. The particularly low harvests in recent years have resulted from increased oyster mortality due to the prevalence of MSX and Dermo associated with elevated salinity occasioned by drought conditions in the
region. For the 1993 to 2002 period, the mean dockside value of C. virginica in Maryland was $4.4 million, with a minimum value of $1.3 million coinciding with the record-setting low harvest in 1994, and the maximum value of $7.8 million coinciding with the largest yearly harvest for this period in 1997. During the 1990s the dockside value of oysters varied between $16 and $27 per bushel (approximately $2.50 to $4.25 per pound meat weight). The mean dockside value per bushel of oysters for the 1993 to 2002 period was $19.30/bushel ($3.00 per pound of meat weight). Although the 2002 to 2003 harvest portends to be the lowest ever, Maryland watermen have received well above average prices of between $25.00 and $45.00 per bushel ($3.85 to $6.90 per pound meat weight), prices that have helped offset their financial losses due to the low harvest amounts. Moreover, the higher prices led some watermen to end crabbing early in the 2002 to 2003 season in order to take advantage of early-season high oyster prices. (The fall 2003 market was depressed, leaving many watermen without markets for their crabs and low bushel prices for those watermen who had markets.)
For the period 1993 to 2002, the average number of man-days of effort in Maryland’s oyster fishery was 35,513, with a minimum of 12,907 and a maximum of 72,516 days corresponding to 1994 and 1999, respectively. The average number of bushels per man-day was 6.5, with a range of 4.6 to 8.3 bushels. Applying the average harvest value of $19.30 per bushel, the average daily harvest earnings for Maryland watermen for the 1993 to 2002 seasons was $125.45 less expenses.
Hand tongs are the most common gear type used to harvest oysters in the Maryland portion of the bay. During the 2001 to 2002 season, hand tongers harvested approximately 41% of total landings. Over the past 12 years, hand tongers have harvested between 38 and 75% of the catch. Patent tongers and divers harvest approximately 20% each, with power dredges and skipjacks responsible for the remaining harvest (Chesapeake Bay Program, 2002). Description of these different gear types can be found in Kennedy (2002).
In terms of the number of Maryland license holders selling oysters in 1999, the peak harvest period for the past decade, 2,520 Maryland watermen sold oysters, while in 2002 only 915 watermen reported an oyster harvest (C. Judy, Maryland Department of Natural Resources, Annapolis, personal communication, 2002).
In addition to industrywide data on harvest, dockside value, and man-days, it is also important to understand the economic and sociocultural importance of the oyster fishery at the watermen household and community levels. Currently, the commercial (and recreational) oyster season in Maryland begins on October 1 for shaft and patent tonging and diving and November 1 for power dredging and dredge boats (skipjacks)
and ends for all on March 28th. Current daily harvest limits are 15 bushels per license for tongers and divers (maximum of 30 bushels per boat), 12 bushels per day per license for power dredging (24 bushels maximum per boat), and 150 bushels per day for skipjacks, which are limited to just 2 days per week.
For Maryland watermen, oystering is second in economic importance to crabbing. Prior to the 1980s, oystering was the most important fishery on the bay, with watermen hard crabbing (or farming) in the summer mainly to provide income in between oystering seasons. Today, oystering is the “off-season” income producer. Maryland watermen have intensified their crabbing efforts and diversified into the harvesting, shedding, and marketing of soft crabs. Today, the commercial crabbing season runs from April 1 until November 15, and most watermen fish 6 days a week during this period as soon as the crabs begin moving until they bury in the bottom for over-winter hibernation or (for mature females) migrate out of the bay to spawn.
Given the seasonal characteristics of the two fisheries and their reversed economic roles compared to earlier times, the oyster fishery takes pressure off the blue crab fishery, allowing Maryland watermen flexibility to shift to oysters in early fall when prices are the highest (pre-Thanksgiving and Christmas holidays), if the blue crab harvest or market prices drop off. The oyster fishery, even at its currently reduced levels, is an economic safety valve for Maryland watermen and can reduce harvest pressure on the blue crab, which is a fishery management priority (additional blue crab harvest regulations have been issued over the past 3 years to help ensure a 15% spawning stock).
The household or community benefits of the income from oystering in Maryland are more important than a simple consideration of industrywide figures might suggest. Once blue crabs have buried in bottom or moved to lower reaches of the bay to spawn, oystering provides Maryland watermen with their only source of fishing income. This income and “work on the water” are particularly important from October to January. Prices are also higher during this period, and the weather is generally better in the earlier months of this period. There is minimal work involved in rerigging boats with tonging or dredging gear, and the crews are either familybased or a continuation of a captain-mate arrangement used for crabbing (excluding skipjacks, which have crews of 6 to 8 watermen; it should be noted that only 5 to 10 skipjacks continue to dredge for oysters). Thus, watermen can shift to oystering with minimal effort and expense in either time or money.
For Maryland watermen, harvesting oysters is flexible work. While watermen crab daily (excluding Sundays) and most for the full 8 hours allowed by Maryland law, in part because crab mortality increases the
longer the crabs are left in the crab pot, most Maryland watermen oyster, on average, only a few days per week. Based on a combination of factors, such as weather conditions, market prices, immediate household income needs, and competing work and family requirements, watermen decide whether to “go and catch a few bushels.” This decision is not to imply that Maryland watermen do not take oystering seriously, and if there are oysters to be caught and marketed, watermen will go daily and brave bad weather. However, there is a flexible and varied side to their harvesting of oysters. Without overstating it, it represents a source of work and income that can be tapped to meet immediate household economic needs. It allows watermen to use their boats and gear and to continue, albeit at a reduced level, their cultural tradition of “working the water.” Again, the oyster fishery is available at a time when for most watermen there are no other significant income-earning alternatives, and it is a “set” resource that will be available throughout the season. As one Maryland waterman explained in an interview: “Oystering has none of the pressures that crabbing has, where you have to be one step ahead of the crab’s movements. Although it is hard work, it is a more relaxed way of fishing. You know where to go, and the oysters are either there or not. But you can always get a few bushels to put some food on the table.” Finally, with the arrival of the new year, as weather worsens and market prices drop, Maryland watermen begin to shift their efforts to preparing crab pots and boats for the upcoming crab season.
The loss of the oyster fishery for Maryland watermen would be a severe blow to their efforts to continue the livelihood and traditions of watermen communities. Being able to dredge or tong for oysters even in small amounts is an important part of the cultural heritage of watermen communities, a heritage that is increasingly being celebrated through baywide efforts to support and value the region’s cultural resources. Maryland watermen are increasingly participating in partnerships with scientists, environmentalists, and others to restore or replenish oyster habitat (e.g., Maryland’s Oyster Recovery Partnership). Maryland watermen bring to these partnerships detailed knowledge of the location, ecological status, and economic potential of oyster reefs throughout the bay and a strong commitment to restoring the oyster to provide a natural resource on which their families and communities can depend.
Virginia
In Virginia, overharvesting reduced turn-of-the-century landings of 6 million to 7 million bushels in the 1930s to between 3 million and 4 million bushels in the 1960s. Following outbreaks of MSX in the 1950s, Virginia’s harvest decreased to less than 20,000 bushels by the mid-1990s and has
remained at that level ever since (Chesapeake Bay Program, 2002). Commercial harvest from the Virginia public fishery was 16,000 bushels in the 2001 to 2002 season and is expected to be even lower for the 2002 to 2003 season.
A major difference between Virginia’s oyster fishery and Maryland’s is that Virginia does much more processing and marketing. About two-thirds of the processed oysters in Virginia come from areas outside the state, including the Gulf of Mexico states, Maryland, and Delaware Bay (J. Wesson, VMRC, Newport News, personal communication, 2003). In the 2001 to 2002 season, Virginia processors shucked and repackaged close to a million bushels of out-of-state oysters. In another example, total 1994 oyster landings from Virginia waters were 300,526 pounds valued at $812,000. However, the estimated total sales of oysters and related products that year reached $81 million (Kirkley, 1997). This figure is another indication that the overall demand for oyster products is strong. It is interesting to note that 1993 to 1994 was the record-low year of oyster harvests from Maryland waters (see above). Virginia also “wet stores” oysters brought in from other states.
Many of the household sociocultural and economic factors related to oystering described above for Maryland watermen also apply to Virginia watermen. Winter oystering on public grounds or private beds provides small amounts of much-needed income during late fall and winter; an earlier shift to fall oystering reduces fishing pressure on the blue crab; most oystering is familybased with minimal effort required to rerig for oystering; and oystering continues to be a fishing occupation central to the heritage and identity of watermen communities. However, in Virginia, watermen do not have a unique, statewide organization similar to the Maryland Watermen’s Association. Instead, there are 15 watermen associations, each based in a different geographical region.
Harvesting of oysters in Virginia is done on public beds during winter and private beds during summer. Traditionally, watermen would work public bottoms in winter and then in the summer work for processors planting seed and shell, dredging, and harvesting. According to data from the VMRC oyster harvest methods in Virginia have changed only slightly over the past 25 years. From 1976 to 1991 the top three oyster harvest methods, by harvest weight, were patent tongs (44%), the oyster dredge (35%), and hand harvest through diving (18%; VMRC, 2003b).
For the 1993-2001 period, the mean dockside value of C. virginica in Virginia was $0.8 million, with a minimum value of $0.6 million in 1996 and a maximum value of $1.1 million in 1993.
Historically, Virginia’s production was primarily from privately leased oyster grounds. From the 1950s until the 1973 to 1974 season, typically 66 to 89% of Virginia harvest came from privately leased bottom.
TABLE 5.2 Distribition of Virginia Oyster Harvest, Private vs. Public Beds
|
YEAR |
PUBLIC LANDINGS (BU) |
PRIVATE LANDINGS (BU) |
TOTAL |
% PRIVATE |
|
57-58 |
586,304 |
2,926,750 |
3,513,054 |
83% |
|
58-59 |
703,915 |
3,347,170 |
4,051,085 |
83% |
|
59-60 |
699,420 |
2,553,275 |
3,252,695 |
78% |
|
60-61 |
781,783 |
2,237,736 |
3,019,519 |
74% |
|
61-62 |
227,921 |
1,815,001 |
2,042,922 |
89% |
|
62-63 |
278,830 |
1,652,880 |
1,931,710 |
86% |
|
63-64 |
576,857 |
1,223,549 |
1,800,406 |
68% |
|
64-65 |
615,864 |
1,605,759 |
2,221,623 |
72% |
|
65-66 |
605,982 |
1,188,633 |
1,794,615 |
66% |
|
66-67 |
226,855 |
587,105 |
813,960 |
72% |
|
67-68 |
262,996 |
790,483 |
1,053,479 |
75% |
|
68-69 |
227,577 |
621,463 |
849,040 |
73% |
|
69-70 |
192,187 |
818,943 |
1,011,130 |
81% |
|
70-71 |
281,001 |
836,014 |
1,117,015 |
75% |
|
71-72 |
260,241 |
928,404 |
1,188,645 |
78% |
|
72-73 |
157,890 |
394,121 |
552,011 |
71% |
|
73-74 |
374,522 |
424,277 |
798,799 |
53% |
|
74-75 |
403,737 |
491,860 |
895,597 |
55% |
|
75-76 |
397,209 |
475,159 |
872,368 |
54% |
|
76-77 |
312,539 |
320,711 |
633,250 |
51% |
|
77-78 |
512,687 |
394,692 |
907,379 |
43% |
|
78-79 |
590,533 |
441,082 |
1,031,615 |
43% |
|
79-80 |
608,880 |
465,896 |
1,074,776 |
43% |
|
80-81 |
704,848 |
472,465 |
1,177,313 |
40% |
|
81-82 |
464,280 |
326,809 |
791,089 |
41% |
|
82-83 |
329,492 |
361,792 |
691,284 |
52% |
|
83-84 |
334,749 |
247,525 |
582,274 |
43% |
|
84-85 |
308,392 |
318,660 |
627,052 |
51% |
|
85-86 |
328,338 |
386,665 |
715,003 |
54% |
|
86-87 |
501,075 |
279,872 |
780,947 |
36% |
|
87-88 |
325,527 |
194,654 |
520,181 |
37% |
|
88-89 |
165,061 |
107,612 |
272,673 |
39% |
|
89-90 |
88,635 |
73,983 |
162,618 |
45% |
|
90-91 |
59,883 |
52,109 |
111,992 |
47% |
|
91-92 |
53,288 |
29,079 |
82,367 |
35% |
|
92-93 |
34,355 |
30,182 |
64,537 |
47% |
|
93-94 |
7,401 |
28,134 |
35,535 |
79% |
|
94-95 |
18,583 |
36,831 |
55,414 |
66% |
|
95-96 |
3,709 |
13,182 |
16,891 |
78% |
|
96-97 |
8,801 |
14,548 |
23,349 |
62% |
|
97-98 |
4,416 |
15,834 |
20,250 |
78% |
|
98-99 |
19,620 |
28,556 |
48,176 |
59% |
|
99-00 |
4,758 |
17,865 |
22,623 |
79% |
|
00-01 |
1,808 |
20,765 |
22,573 |
92% |
|
SOURCE: Data from VMRC (2003b). |
||||
From the 1973 to 1974 season until the 1993 to 1994 season, private-leased bottom accounted for 35 to 55% of Virginia’s harvest. Since then, leased beds have accounted for 62 to 92% of Virginia’s meager harvests (VMRC, 2003a; Table 5.2). In contrast, the private harvest in Maryland has been less than 4% for the past 25 years. Virginia’s utilization of private leased beds places it in a better position to take advantage of any program that utilizes hatchery-based oysters that are grown to market size on private beds using aquaculture systems. The introduction of triploid C. ariakensis will most likely employ aquaculture-oriented grow-out systems and therefore will tend to favor private lease owners. In such an environment, state and federal regulators can work with individual watermen to track how much seed is going into an area, how much product is coming out, and whether and with what frequency reversion is occurring in this semicontrolled environment. It may be much more difficult to track and control triploid oysters in a public harvest area. Private bed watermen may also benefit from a diploid C. ariakensis program more than public bed watermen because tracking of diploid oyster growth and reproduction may be easier in a private bed environment. It should be noted that this difference is specific to an aquaculture-based system such as currently proposed by the Virginia Seafood Council. A government-supported program to enhance public grounds with nonnative oysters would not differentially favor leaseholders.
A program that utilizes hatchery-based C. ariakensis and moves Chesapeake Bay oyster production toward an aquaculture-based regime could change the proportion of oysters being shucked. Aquaculture-based systems are likely to result in greater investment in equipment and in animal growth and health tracking. Watermen using these methods will want to make sure that they get the best return on their investment, and this return is more likely to be found in the half-shell rather than the shucked market. Evidence from the Pacific Northwest shows that aquaculturists tend to prefer the half-shell market over the shucked market. In this region the majority of oyster production enters the half-shell market.
RECREATIONAL AND AMENITY BENEFITS
The Chesapeake Bay supports a wealth of recreational activities and amenity services that are directly or indirectly related to the abundance and distribution of oysters. The benefits of these activities and services can be characterized as flows of use, option, and nonuse benefits through time. Use benefits include benefits net of costs associated with sportfishing for oysters and other fish and shellfish, boating, swimming, bird watching, waterfowl hunting, tourism, and the value of ecosystem services con-
tributed by the bay. Option benefits reflect individuals’ willingness to pay for the opportunity to engage in recreational activities and to benefit from amenity services at some future time. Nonuse benefits accrue to vicarious consumers of bay resources and include the benefit of knowing of the existence of these resources, the value associated with bequesting recreational opportunities and amenity services to future generations, the altruistic value of preserving recreation resources and amenity goods for other users, and the value associated with beliefs that maintaining or enhancing bay resources is intrinsically desirable.
Although linkages between the introduction of nonnative oysters and the magnitude of use and option benefits are poorly understood, it is likely that the linkage is through the effect of introduction on water quality, substrate characteristics, and the composition of benthic vertebrates, invertebrates, vascular plants, and algae. The effect of nonnative introductions on the magnitude of nonuse benefits is probably dependent on similar factors and on individual preferences regarding the benefits or disutility of the introduction of an alien species.
Water quality improvements provide direct and indirect benefits. The direct benefits of water quality improvements include increased use, option, and nonuse benefits associated with improved recreational opportunities and enhanced amenity values (Greenley et al., 1982; Smith and Desvouges, 1986). Indirect benefits of water quality improvement arise when the improved water quality reduces the costs of production or increases the value of products that depend on the water body as an input in production or a repository for byproducts of production. For example, improved water quality could lead to increased consumer demand for seafood or reduce the costs of certifying the safety of harvested fish and shellfish (Kahn and Kemp, 1985; Keithly and Diop, 2001a, 2001b; Jakus et al., 2002).
Bockstael et al. (1987a, 1987b, 1988, 1989) found that use benefits associated with swimming, boating, and sportfishing in the Chesapeake Bay were strongly influenced by perceived water quality. The aggregate benefits of a 20% improvement in water quality (defined as a 20% reduction in nitrogen and phosphorus loading and a 20% increase in sportfishing catches) relative to conditions present in 1980 were estimated to be $188 million for public western shore beach use, $26 million for recreational boating, and $8 million for striped bass sportfishing.2 Aggregate willingness to pay for water quality improvements was estimated to be $213 million for users and $74 million for nonusers. Kahn and Kemp (1985) linked the extent of submerged aquatic vegetation to the abundance of finfish and shellfish populations exploited by commercial and
recreational fishermen. Changes in the extent of submerged aquatic vegetation were, in turn, related to watershed-scale variations in nutrient runoff, suspended sediments, and metropolitan sewage outfall. The magnitude of recreational and amenity benefits are also positively correlated with water quality improvements through the effect of water quality on reduced health concerns regarding the consumption of oysters and finfish (Keithly and Diop, 2001a, 2001b; Jakus et al., 2002). In addition, the extent of submerged aquatic vegetation is linked to the abundance of finfish and shellfish populations exploited by commercial and recreational fishermen. Consequently, the extent of submerged aquatic vegetation is positively correlated with recreational use benefits (Kahn and Kemp, 1985). Moreover, changes in the extent of submerged aquatic vegetation are related to watershed-scale variations in nutrient runoff, suspended sediments, metropolitan sewage outfall, and nitrous oxide emissions by utilities, motor vehicles, and nonutility point sources in the bay airshed (Krupnick et al., 1998). The Chesapeake Bay airshed and watershed are depicted in Figure 5.6.
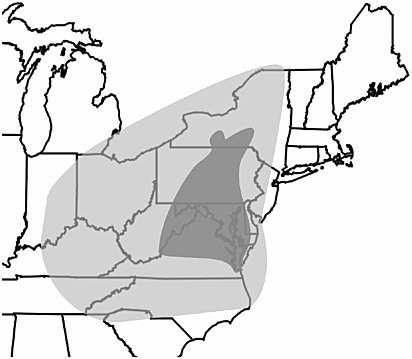
FIGURE 5.6 The Chesapeake Bay regional watershed and airshed. Light shading denotes airshed; dark shading denotes watershed.
SOURCE : Modified from Krupnick et al. (1998).
Changes in water quality, substrate characteristics, and the abundance of waterfowl populations and fish and shellfish stocks affect recreational and amenity benefits in two ways: (1) as water quality improves, the number of participants will increase and (2) as water quality improves, the average net benefit per trip increases. Because the travel costs and the number of alternative recreational areas increase at increased distances from the Chesapeake Bay, it is likely that, although improved water quality would attract increased participation, the incremental increases in participation are likely to be larger for initial water quality improvements and smaller for subsequent ones. Similarly, while improved water quality can be expected to increase the average net benefit of each trip taken, the increase in average net benefit per trip is likely to decline at ever more pristine levels of water quality. The overall effect of water quality improvements is represented graphically in Figure 5.7. The potential gains in use and option benefits depend on current water quality levels, the response of participants to increases in water quality, and the rate at which average net benefits per trip increase in response to improved water quality.
To the extent that introduction of nonnative oysters leads to improved water quality, desirable substrate characteristics, and increased abundance of waterfowl populations and fish and shellfish stocks, the introduction will lead to increased use and option benefits. Because of the diverse character of nonuse benefits, the effect of nonnative introductions
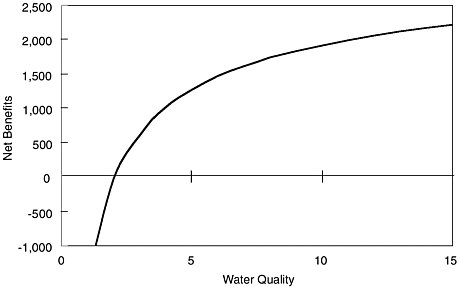
FIGURE 5.7 Relationship of net amenity and recreational benefits of the Chesapeake Bay to relative levels of water quality.
on the magnitude of nonuse benefits is uncertain. Nonuse values could be depressed because of disquietude over the introduction of an alien species or increased in anticipation of the existence of self-sustaining oyster reefs irrespective of species composition.
SUMMARY
-
Virginia and Maryland C. virginica harvests fell substantially between 1980 and 2001—83% in Maryland and 98% in Virginia.
-
In the past decade the Chesapeake Bay region produced 2 to 10% of the U.S. C. virginica domestic harvest and only 1 to 5% of the total oyster supply (fresh, frozen, and live, excluding smoked and canned). The bay’s share of domestic harvest was roughly 50% in 1980.
-
Total U.S. oyster supply (fresh, frozen, and live, excluding smoked and canned) increased by 15% from 1991 to 2001. At the same time, the real price of Chesapeake Bay oysters declined by 24%, despite the fact that the bay’s oyster harvest declined by 55% over the period.
-
Despite industrywide declines in oysters for both Maryland and Virginia, at the community and household levels oysters continue to provide small amounts of much-needed income during a period when watermen have no other source of fishing income. Moreover, oystering can reduce fall harvest pressure on the blue crab. Continued oystering, even at a reduced level, represents an important part of the cultural heritage of watermen communities in both states.
-
Both Virginia and Maryland processors are now dependent on oysters from outside the Chesapeake Bay region. A 1991 survey of processors found that 31% of Maryland respondents and 53% of Virginia respondents handled Gulf of Mexico oysters, while 20% of the Virginia respondents and 8% of those in Maryland handled oysters from the Pacific. Processors’ dependence on oysters from outside the region has continued to increase from these levels.
-
The structures of oyster production in Maryland and Virginia differ from one another. Over the past decade more than 60% of Virginia’s production came from privately leased beds, while less than 4% of Maryland’s harvest during the same period came from private beds. This structural difference places Virginia in a better position to take advantage of any solution that might utilize aquaculture methods.
-
Given that the Chesapeake Bay region now accounts for less than 3% of the total U.S. oyster supply, doubling or tripling of the harvest in the bay over several years is likely to have relatively minor
-
price effects. However, if growth in the harvest is extremely rapid as a result of the recovery of C. virginica or through the introduction of C. ariakensis, significant price declines could result.
-
Recreational and amenity benefits associated with the Chesapeake Bay are large relative to the dockside value of recent commercial oyster harvests. Because the magnitude of recreational and amenity benefits is closely linked to water quality, management actions that reduce the level of nutrient inputs or that accelerate the rate of nutrient clearing can be expected to yield increased recreational and amenity benefits. To the extent that increased oyster populations contribute to accelerated nutrient clearing, policies that foster increased native or nonnative oyster populations will yield increased recreational and amenity benefits.


