APPENDIX D
ILLUSTRATION OF PROCESS FOR EVALUATING KI DISTRIBUTION PLANS
Template for Evaluation of KI Plans
This appendix shows a process that a local region could use to evaluate the four sample distribution plans against the objectives for a hypothetical plant site. The aim is to demonstrate a process, not to identify a best distribution approach.
Example Sites
Three hypothetical stylized examples of local regions surrounding nuclear power plants are given here (Tables D.1-3). Each local region will be called the KI Planning Zone (KIPZ). This term is used in place of the commonly used Emergency Planning Zone term, because existing plans set specific distances for the radius of such zones (for example, the 10-mile EPZ), and this process is meant to be generic for whatever plans are considered, with possibly different geographic areas. The regions will be characterized by features that affect performance of a KI plan on the objectives.
Urban: The KIPZ has a large, highly concentrated, permanent population that is increased by 25% during the week from the influx of large numbers of workers and families from the surrounding area. The transportation network, which also contains major interstate highways, is barely able to handle this daily ebb and flow. The area contains three major hospitals (one associated with a university), a
jail, and a school system with a total enrollment of 100,000. The KIPZ itself is contained within one political jurisdiction, but it borders several other jurisdictions, including a neighboring state. The most severe weather threats come from potential hurricanes in the fall and ice storms in the winter.
Suburban: This KIPZ contains two rapidly developing counties that are on the outer fringes of a major metropolitan area. It is populated primarily by a mixture of young families, drawn by the comparatively open spaces and lower housing prices, and retirees. Many of the working-age adults are employed outside the KIPZ. The school systems of the counties are expanding to accommodate the growing number of children, but the school facilities are widely dispersed, and there is extensive daily busing of students. Day care for preschool children is a booming business. The largest employer in the KIPZ is a Department of Defense facility with 6,000 military and civilian employees. The second-largest is the NPP itself. Each county has a hospital and a penal facility. The KIPZ also contains a large assisted-living and nursing-home facility with 200 residents. There are two interstate-quality roads in the KIPZ that parallel each other; the remainders are primarily rural two-lane roads. The most important severe weather is occasional major snowstorms.
Rural: This KIPZ is contained in one county that is overwhelmingly agricultural, and is predominantly covered by dairy farms. The thinly-distributed population numbers about 15,000 and is generally middle-aged, with a smaller number of children per household than the national average. The schools are small, and there is extensive busing of the students. The road system is basically two-lane and farm roads, but it is estimated that the entire KIPZ can be evacuated in less than 3 hours under normal conditions. The NPP is the largest employer in the county. The most important natural hazards come from deep winter snows and a river that occasionally floods during the spring thaw, making several of the main roads impassable.
Table D.1 Urban Site Example
Table D.2 Suburban Site Example
Table D.3 Rural Site Example
|
Minimize Radiation Health Risks to Public |
Relevant Characteristics of Rural Site Example |
|||
|
A. |
Minimize Radioactive Iodine Risk to Thyroid |
|
||
|
|
a.1. |
Maximize KI Availability |
|
|
|
|
|
a.1.1. |
Max. Availability for Children and Pregnant Women Residents |
Small schools, extensive busing, few children |
|
|
|
a.1.2. |
Max. Availability for Other Residents |
Very small resident population of 15,000 in agricultural area |
|
|
|
a.1.3. |
Max. Availability for Mobile Population |
Power plant largest employer in county |
|
|
a.2. |
Optimize Ability to Take KI on Time |
|
|
|
|
|
a.2.1. |
Max. Number of People who Know Where Pill is |
Few residents |
|
|
|
a.2.2. |
KI Taken at Optimal Time if No Evacuation |
Unlikely winter snows or spring river flooding could block main roads |
|
|
|
a.2.3. |
KI Taken at Optimal time if Evacuation |
Unlikely winter snows or spring river flooding could block main roads |
|
|
|
a.2.4. |
Ensure KI is Stored to ensure Stability |
KI might be stored in leaky barns |
|
|
a.3. |
Minimize Harm from Inappropriate KI Administration |
|
|
|
|
|
a.3.1. |
Correct KI Dosage Given (and Taken) for Age/Body size |
Small population of children |
|
|
|
a.3.2. |
KI Taken at Optimal Time |
Weather or traffic might impede evacuation to KI stockpile site |
|
|
|
a.3.3. |
Adverse KI Side Effects Minimized |
Small Chance of pre-existing thyroid cases in middle-aged residents |
|
B. |
Minimize Harm from Other Aspects of Incident |
|
||
|
|
b.1. |
KI Procedures Don’t Impede Evacuation |
Entire KIPZ can normally evacuate in < 3 hours |
|
|
|
b.2. |
Avert Mortality and Morbidity from Radiation or Accidents |
Two-lane and farm roads |
|
|
|
b.3. |
Minimize Panic/Anxiety due to KI Procedures |
School buses available for children; Power plant largest employer |
|
|
|
b.4. |
KI Procedures’ Resource Use Not Excessive |
Small population to cover for KI predistribution and communication costs |
|
|
|
b.5. |
Simple KI Procedures before and during Incident |
One county jurisdiction |
|
|
|
b.6. |
Educate Public to Respond Appropriately to Nuclear Plant Incident |
Emergency planning zone in one county |
|
Rating Scale and Weights on Objectives
Once a region has determined how local area characteristics may affect the general performance of plans on objectives (as in the above three examples of an urban, a suburban, and a rural area), different plans can be created and evaluated.
The performance of each KI distribution plan option may be evaluated on the objectives by using descriptive text or on a 0-10 scale, where 10 is best and 0 is minimally acceptable. See the Rating Scale Table D.4 with sample rating scales for the sample objectives. The end points of the rating scale need not be absolute ratings of the best and worst conceivable levels; they can be set to be the best and worst levels attainable with a reasonable set of plan options. For example, for the objective of maximizing the number of people who know where the nearest KI is, “10% of the people knowing” may be the lowest-level rating of 0 and “85% of the people knowing” may receive the highest-level rating of 10 if this is the range for the set of options being considered.
After rating how well each plan does on each objective, an option may appear that is dominant on all objectives, and that option should be seriously considered for implementation by decision-makers. However, it is likely that no plan option will be dominant on all objectives. The relative importance of the different objectives may then need to be examined in more depth. The importance of objectives can be placed in rank order or, more precisely, given importance weights. By convention, weights are normalized to sum to 100%. A theoretically correct way to assess and interpret the meaning of importance weights is to use the swing weight method (Clemen, 1996; von Winterfeldt and Edwards, 1986). The decision-maker should think of a benchmark worst option that scores at the bottom of the rating scale on every objective. The most important objective is the one that the decision-maker would prefer to “swing” to the top of the rating scale first. The question is; If it was possible to meet only one objective completely, and the other objectives would be at their worst level of attainment, which one objective would be chosen to be met? The next-most-important objective is the one that would be chosen second. Note that this approach depends on the
range between worst and best levels that has been set in the rating scale.
The overall value of an option can be computed by multiplying the weight of an objective by the rating of the plan’s performance on the objective and then summing the products over all objectives. The plan with the highest overall value would be the one that this model recommends be chosen. Sample calculations using a hypothetical set of importance weights on the objectives and sample ratings are shown in Table D.5, for example 1.
Table D.4 Sample Rating Scales
|
|
Selected Pointson Rating Scale for Each Objective |
|||||
|
|
0 |
5 |
10 |
|||
|
Minimize Radiation Health Risks to Public |
|
|
|
|||
|
A. |
Minimize Radioactive Iodine Risk to Thyroid |
|
|
|
||
|
|
a.1. |
Maximize KI Availability |
|
|
|
|
|
|
|
a.1.1. |
Max. Availability for Children and Pregnant Women Residents |
1 dosage/person in stockpile |
50% have extra dosage at home now |
85% have extra dosage at home now |
|
|
|
a.1.2. |
Max. Availability for Other Residents |
0 dosages/person in stockpile |
10% have extra dosage at home now |
25% have extra dosage at home now |
|
|
|
a.1.3. |
Max. Availability for Mobile Population |
1 dosage/child in stockpile |
1 dosage/person in stockpile |
25% have extra dosage at mobile location now |
|
|
a.2. |
Optimize Ability to Take KI on Time |
|
|
|
|
|
|
|
a.2.1. |
Max. Number of People who Know Where KI is |
10% know |
50% know |
85% know |
|
|
|
a.2.2. |
KI Taken at Optimal Time if No Evacuation |
2% take timely KI who bought on own |
20% take timely predistributed KI |
50% take timely predistributed KI |
|
|
|
a.2.3. |
KI is Taken at Optimal Time if Evacuation |
2% take own + 30% take reception KI |
20% take own + 50% take reception KI |
50% take own + 40% take reception KI |
|
|
|
a.2.4. |
Ensure KI is Stored to ensure Stability |
50% of KI stored poorly |
20% of KI stored poorly |
1% of KI stored poorly |
|
|
a.3. |
Minimize Harm from Inappropriate KI Administration |
|
|
|
|
|
|
|
a.3.1. |
Correct KI Dosage Given (and Taken) for Age |
90% take KI take wrong dosage |
40% take KI take wrong dosage |
10% take KI take wrong dosage |
|
|
|
a.3.2. |
First KI Dosage Not Taken Too Late |
90% take KI take too late |
40% take KI too late |
10% take KI too late |
|
|
|
a.3.3. |
Adverse KI Side Effects (nonthyroid cancer) Minimized |
5% side effects |
2.5% side effects |
0.1% side effects |
|
B. |
Minimize Harm from Other Aspects of Incident |
|
|
|
||
|
|
b.1. |
KI Procedures Don’t Impede Evacuation |
evacuation slowed by 1 hour/person |
Evacuation slowed by 30 min./person |
evacuation slowed by 5 min./person |
|
|
|
b.2. |
Avert Mortality and Morbidity from Radiation or Accidents |
expect 25 serious (nonthyroid) cases |
expect 15 serious cases |
expect ≤ 2 serious cases |
|
|
|
b.3. |
Minimize Panic/Anxiety due to KI Procedures |
much panic or anxiety due to KI |
little panic or anxiety due to KI |
no extra panic or anxiety |
|
|
|
b.4. |
KI Procedures’ Resource Use Not Excessive |
very costly in labor time and money |
somewhat costly in labor time |
very inexpensive |
|
|
|
b.5. |
Simple KI Procedures Before and During Incident |
Very complicated |
some complications |
very simple |
|
|
|
b.6. |
Educate Public to Respond to Nuclear Incident |
little public understanding |
some understanding |
much public understanding |
|
Table D.5. Example 1
Template for Evaluating Plans on Objectives
|
|
Description of How Well Each Plan Meets Each Objective (Rate from 0 to 10 = best) |
|||||||
|
Example 1. Original Weights |
Importance Weights (Sum = 100%) |
MM: Predistribute in Mass Mailing in KIPZ |
VP: Predistribute via Voluntary Pickup in KIPZ |
RC: Stockpile at Evacuation Reception Centers Outside KIPZ |
ND: No Distribution of KI |
|||
|
Minimize Radiation Health Risks to Public |
|
|
|
|
|
|||
|
A. |
Minimize Radioactive Iodine Risk to Thyroid |
|
||||||
|
|
a.1. |
Maximize KI Availability |
|
|||||
|
|
|
a.1.1. |
Max. Availability for Children and Pregnant Women Residents |
20% |
10 |
2 |
0 |
0 |
|
|
|
a.1.2. |
Max. Availability for Other Residents |
2% |
10 |
1 |
0 |
0 |
|
|
|
a.1.3. |
Max. Availability for Mobile Population |
4% |
0 |
10 |
0 |
0 |
|
|
a.2. |
Optimize Ability to Take KI on Time |
|
|
|
|
|
|
|
|
|
a.2.1. |
Max. Number of People who Know Where Pill is |
5% |
0 |
5 |
10 |
0 |
|
|
|
a.2.2. |
KI Taken at Optimal Time if No Evacuation |
5% |
10 |
3 |
0 |
0 |
|
|
|
a.2.3. |
KI is Taken at Optimal Time if Evacuation |
3% |
10 |
10 |
10 |
0 |
|
|
|
a.2.4. |
Ensure KI is Stored to ensure Stability |
3% |
0 |
0 |
10 |
0 |
|
|
a.3. |
Minimize Harm from Inappropriate KI Administration |
|
|
|
|
|
|
|
|
|
a.3.1. |
Correct KI Dosage Given (and Taken) for Age |
5% |
0 |
5 |
10 |
0 |
|
|
|
a.3.2. |
First KI Dosage Not Taken Too Late |
3% |
10 |
10 |
0 |
10 |
|
|
|
a.3.3. |
Adverse KI Side Effects (nonthyroid cancer) Minimized |
1% |
0 |
8 |
10 |
10 |
|
B. |
Minimize Harm from Other Aspects of Incident |
|
|
|
|
|
||
|
|
b.1. |
KI Procedures Don’t Impede Evacuation |
10% |
0 |
5 |
10 |
10 |
|
|
|
b.2. |
Avert Mortality and Morbidity from Radiation or Accidents |
18% |
10 |
3 |
0 |
10 |
|
|
|
b.3. |
Minimize Panic/Anxiety due to KI Procedures |
2% |
10 |
5 |
10 |
5 |
|
|
|
b.4. |
KI Procedures’ Resource Use Not Excessive |
1% |
0 |
5 |
7 |
10 |
|
|
|
b.5. |
Simple KI Procedures before and during Incident |
8% |
0 |
3 |
10 |
10 |
|
|
|
b.6. |
Educate Public to Respond to Nuclear Incident |
10% |
8 |
10 |
0 |
0 |
|
|
OVERALL VALUE (SUM OF PRODUCTS OF WEIGHTS TIMES RATINGS) |
100% |
6.1 |
4.6 |
3.8 |
4.2 |
|||
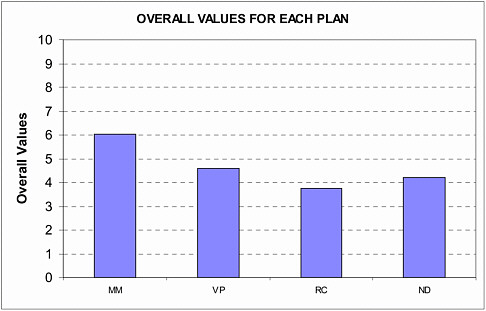
Figure D.1 Overall Values of Four Plan Options for Hypothetical Local Region
The mass-mailing plan scored highest, with an overall weighted value score of 6.1 out of 10 possible. A plan that was rated a 10 on each objective would earn an overall value score of 10. (Similarly, one that was rated 0 on each objective would earn an overall value of 0.) The weights and ratings in Figure D.1 are hypothetical and are not intended to apply to any one locale or set of plans. Local decision-makers should determine their own plans, weights and ratings on the basis of local conditions.
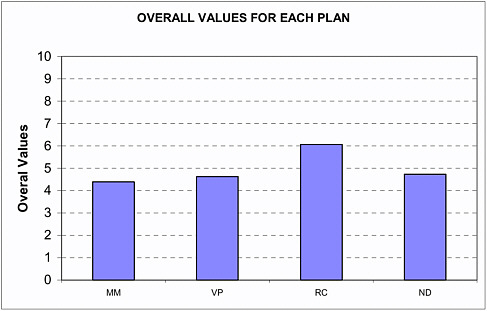
Note that if the weights on the objectives were different, the rank order of the options could change. For example, with new weights, and a particularly high weight of 24% out of 100% on simple procedures during and before an accident, the option of only stockpiling at reception centers scores highest, as seen in Table D.6 and Figure D.2 below.
Once preliminary analysis has been done, planners may be able to design a new plan that would combine the best features of multiple plans.
Table D.6. Example 2 Meets Each Objective
|
|
Description of How Well Each Plan Meets Each Objective (Rate from 0 to 10 = best) |
|||||||
|
Example 2. Revised Weights |
Importance Weights (Sum = 100%) |
MM: Predistribute in Mass Mailing in KIPZ |
VP: Predistribute via Voluntary Pickup in KIPZ |
RC: Stockpile at Evacuation Reception Centers Outside KIPZ |
ND: No Distribution of KI |
|||
|
Minimize Radiation Health Risks to Public |
|
|
|
|
|
|||
|
A. |
Minimize Radioactive Iodine Risk to Thyroid |
|
|
|
|
|
||
|
|
a.1. |
Maximize KI Availability |
|
|
|
|
|
|
|
|
|
a.1.1. |
Max. Availability for Children and Pregnant Women Residents |
9% |
10 |
2 |
0 |
0 |
|
|
|
a.1.2. |
Max. Availability for Other Residents |
5% |
10 |
1 |
0 |
0 |
|
|
|
a.1.3. |
Max. Availability for Mobile Population |
7% |
0 |
10 |
0 |
0 |
|
|
a.2. |
Optimize Ability to Take KI on Time |
|
|
|
|
|
|
|
|
|
a.2.1. |
Max. Number of People who Know Where Pill is |
6% |
0 |
5 |
10 |
0 |
|
|
|
a.2.2. |
KI Taken at Optimal time if No Evacuation |
3% |
10 |
3 |
0 |
0 |
|
|
|
a.2.3. |
KI is Taken at Optimal Time if Evacuation |
2% |
10 |
10 |
10 |
0 |
|
|
|
a.2.4. |
Ensure KI is Stored to ensure Stability |
6% |
0 |
0 |
10 |
0 |
|
|
a.3. |
Minimize Harm from Inappropriate KI Administration |
|
|
|
|
|
|
|
|
|
a.3.1. |
Correct KI Dosage Given (and Taken) for Age |
6% |
0 |
5 |
10 |
0 |
|
|
|
a.3.2. |
First KI Dosage Not Taken Too Late |
7% |
10 |
10 |
0 |
10 |
|
|
|
a.3.3. |
Adverse KI Side Effects (nonthyroid cancer) Minimized |
3% |
0 |
8 |
10 |
10 |
|
B. |
Minimize Harm from Other Aspects of Incident |
|
|
|
|
|
||
|
|
b.1. |
KI Procedures Don’t Impede Evacuation |
2% |
0 |
5 |
10 |
10 |
|
|
|
b.2. |
Avert Mortality and Morbidity from Radiation or Accidents |
5% |
10 |
3 |
0 |
10 |
|
|
|
b.3. |
Minimize Panic/Anxiety due to KI Procedures |
11% |
10 |
5 |
10 |
5 |
|
|
|
b.4. |
KI Procedures’ Resource Use Not Excessive |
1% |
0 |
5 |
7 |
10 |
|
|
|
b.5. |
Simple KI Procedures before and during Incident |
24% |
0 |
3 |
10 |
10 |
|
|
|
b.6. |
Educate Public to Respond to Nuclear Incident |
3% |
8 |
10 |
0 |
0 |
|
|
OVERALL VALUE (SUM of PRODUCT OF WEIGHTS TIMES RATINGS) |
100% |
4.4 |
4.6 |
6.1 |
4.8 |
|||