
5
Supply Chains for Hydrogen and Estimated Costs of Hydrogen Supply
The supply chain for hydrogen comprises the processes necessary to produce, distribute, and dispense the hydrogen. Currently, most hydrogen is produced from natural gas close to where it is needed for industrial purposes. A variety of potential hydrogen supply chain pathways are considered in this chapter. The major factors that will affect the cost of delivered hydrogen are these:
-
The feedstock and/or the major energy source from which the hydrogen is produced,
-
The size of the facility at which the hydrogen is produced and the transportation requirements to deliver it to the customer,
-
The state of the technology used—whether current or to be improved by future developments, and
-
Whether or not the carbon dioxide (CO2) by-product is sequestered when hydrogen is produced from fossil fuel.
This chapter presents estimates of the costs of hydrogen, measured in terms of dollars per kilogram of hydrogen, for the most likely supply chain pathways.
HYDROGEN PRODUCTION PATHWAYS
Feedstocks and Energy Sources
Hydrogen must be chemically separated from some other material. Currently, natural gas is the most common feedstock, but coal is also used. Biomass could be used in the future. The full costs of the production, processing, and purification of these hydrocarbon feedstocks are included in this analysis. When these materials are used to produce hydrogen, the required energy is embedded in the feedstock. (See Chapter 8 and Appendix E for more details.)
Hydrogen also can be separated from water via electrolysis or high-temperature chemical reactions. Electricity can be taken from the grid (from a variety of sources) or generated by wind turbines or photovoltaics that feed the hydrogen production facility directly.1 Nuclear energy might be used in high-temperature chemical reactions.2
Scale of Production
The estimates presented here are developed at three different scales of hydrogen generation, referred to as central station (CS), midsize (MS), and distributed (Dist). Central station plants are assumed to have a production capacity of 1,200,000 kilograms per day (kg/d) and to operate with a 90 percent or higher capacity factor, therefore producing on average 1,080,000 kg/d H2 supporting nearly 2 million cars. Midsize plants are assumed to have a production capacity3 of 24,000 kg/d; operating with a 90 percent capacity factor, they produce on average 21,600 kg/d H2 and support about 40,000 cars. The distributed plants have different production capacities corresponding to the differing capacity factors. Those that operate with a 90 percent capacity factor are assumed to have a production capacity of 480 kg/d H2, producing on average 432 kg/d. Those operating with lower capacity factors are assumed to have the larger production capacities, so that each distributed unit produces on average 432 kg/d H2, supporting about 800 cars.
For each feedstock (or energy source), the committee selected the scales of generation that could be appropriate, given its analysis of the nature of the technology and its cost estimations. Table 5-1 shows the combinations examined in
TABLE 5-1 Combinations of Feedstock or Energy Source and Scale of Hydrogen Production Examined in the Committee’s Analysis
|
|
Feedstock or Primary Energy Source |
||||||
|
Scale of Production |
Natural Gas |
Coal |
Nuclear Energy |
Biomass |
Photo-voltaics |
Wind |
Grid-Based Electric Energy (from any source) |
|
Central station plant |
Steam reforming |
Gasifier |
Thermal splitting of water |
|
|
|
|
|
Midsize plant |
Steam reforming |
|
|
Gasifier or direct conversion |
|
|
|
|
Distributed |
Steam reforming |
|
|
|
Electrolysis |
Electrolysis |
Electrolysis |
developing this analysis.4Appendix E contains the data for each technology case analyzed.5
The costs and energy requirements for distributing the hydrogen to the “filling” station and then dispensing it into the vehicle can be a significant fraction of the total. For central station plants, it is assumed that the distribution system uses pipelines. For midsize plants, it is assumed that distribution would be by cryogenic truck, because the low volumes of hydrogen involved would not justify a pipeline system. Distributed technologies generate hydrogen at the filling station itself and do not require a distribution system.
State of Technology Development
Almost all6 of the cost estimates are developed for two different states of technology development. One state, referred to as current, is based on technologies that could in principle be implemented in the near future. No fundamental technological breakthroughs would be needed to achieve the performance or cost estimates, although normal processes of design, engineering, construction, and system optimization might be needed to achieve costs as low as those estimated in this analysis.
The second state, referred to as possible future, is based on technological improvements that may be achieved if the appropriate research and development (R&D) are successful. These improvements are not predicted to occur; rather, they may result from successful R&D programs. Some may require significant technological breakthroughs. The nature of the improvements in each particular technology is discussed in Chapter 8; additional detail is provided in Appendix G. Generally these future technologies are assumed to be available at a significantly lower cost than that of the current technologies using the same feedstock.
Carbon Dioxide Sequestration
Some of the technologies in the analysis are further differentiated by whether carbon dioxide resulting from hydrogen generation is separated and sequestered. In particular, the midsize and the central station production facilities at which production is based on natural gas, coal, or biomass are examined both with and without the sequestration of carbon dioxide.
Summary of Technologies Considered
The hydrogen supply chain pathways that are considered in this chapter are identified in Table 5-2. They do not include all combinations of the factors listed above (e.g., coal as a feedstock in a distributed plant, or sequestration in a photovoltaic-driven electrolyzer plant). Intermittent technologies (wind, photovoltaics) can be used independently or in combination with the electric grid in order to allow hydrogen production when the renewable technology is not producing power. The results presented here are for the latter case, representing the average output of these intermittent technologies, as discussed later in this chapter. The cases for 100 percent renewables are presented in Appendix E. An all-grid-based system is included here.
CONSIDERATION OF HYDROGEN PROGRAM GOALS
Although the unit cost of producing and delivering hydrogen from the various technologies is critically important
|
4 |
In the graphs in this chapter (Figures 5-1 through 5-13), all of the combinations listed in Table 5-1 are included except midsize generation of hydrogen based on natural gas. The analysis suggests that this alternative would be dominated by either distributed or central station use of natural gas, and thus those estimates are not reported. |
|
5 |
Solar-photovoltaic (PV) and wind technologies were examined by the committee only at distributed scale. These technologies do not benefit from scale economies to the same extent as do single-train processes, such as gasification (of biomass or coal) and steam methane reforming. For example, in the case of solar-PV, twice the structural supports will be required for a solar field of twice the generating capacity (watts)—a linear scaling. Wind farms require multiple turbines to reach capacities above a few megawatts. |
|
6 |
Evaluation of a current nuclear thermal reforming of water is not included because no such technology exists at the present time. |
TABLE 5-2 Hydrogen Supply Chain Pathways Examined
|
|
Primary Energy Source |
|||||||||||
|
Scale |
Natural Gas |
Coal |
Nuclear |
Biomass |
Grid-Based Electricity (from any source) |
Wind |
Photovoltaics |
|||||
|
Central station |
CN: CS NG-C |
CN: CS Coal-C |
|
|
|
|
|
|||||
|
|
FN: CS NG-F |
FN: CS Coal-F |
F: CS Nu-F |
|
|
|
|
|||||
|
|
CY: CS NG-C-Seq |
CY: CS Coal-C-Seq |
|
|
|
|
|
|||||
|
|
FY: CS NG-F-Seq |
FY: CS Coal-F-Seq |
|
|
|
|
|
|||||
|
Midsize |
|
|
|
CN: MS Bio-C |
|
|
|
|||||
|
|
|
|
|
FN: MS Bio-F |
|
|
|
|||||
|
|
|
|
|
CY: MS Bio-C-Seq |
|
|
|
|||||
|
|
|
|
|
FY: MS Bio-F-Seq |
|
|
|
|||||
|
Distributed |
C: Dist NG-C |
|
|
|
C: Dist Elec-C |
C: Dist WT-Gr Elec-C |
C: Dist PV-Gr Elec-C |
|||||
|
|
F: Dist NG-F |
|
|
|
F: Dist Elec-F |
F: Dist WT-Gr Elec-F |
F: Dist PV-Gr-Elec-F |
|||||
|
NOTES: C= current technology; Y= sequestration (hydrocarbon feedstock in central station and midsize plants only); F= future technology; N= no sequestration. The abbreviations for the hydrogen supply chain pathways (e.g., CS NG-C) are from the detailed spreadsheets in Appendix E of this report. |
||||||||||||
in determining their likely competitive success, other characteristics are important as well. One of the important goals of the nation’s hydrogen program is to reduce emissions of CO2 into the atmosphere. Therefore, it is important to estimate whether shifts from gasoline-fueled automobiles to hydrogen-fueled vehicles or other substitutions from direct use of fossil fuels to hydrogen would reduce CO2 emissions and, if so, by how much. For each of the technological pathways considered, estimates were developed regarding the amount of CO2 that would be released into the atmosphere per kilogram of hydrogen produced. As a point of comparison, estimates were made of the CO2 that would be released into the atmosphere per gallon of gasoline use.
Since a goal of the committee’s analysis is to compare costs and CO2 release from gasoline with those from hydrogen, it was important to adjust the gasoline costs and CO2 releases to account for engine efficiency differences between gasoline-powered and fuel cell vehicles (FCVs). For gasoline-powered vehicles, the committee chose a gasoline hybrid electric vehicle (GHEV).
A second important goal of the hydrogen program is to improve energy security by substituting secure domestic resources for imported energy resources, particularly those that may be traded in unstable international markets. In motor vehicles, the use of hydrogen reduces the use of gasoline and therefore could reduce the imports of crude oil or petroleum products. However, if natural gas is the feedstock used to produce hydrogen, this substitution will increase the importation of natural gas, a commodity that may be subject to international market instability just as in the petroleum markets. On the other hand, if coal, biomass, wind, or solar energy are used to produce hydrogen, energy security could be improved. The committee developed estimates of the amount of natural gas that would be needed for technologies using natural gas to produce hydrogen; those data are presented in Chapter 6.
COST ESTIMATION METHODS
For each hydrogen production pathway and for both states of technology development (current and possible future), the committee developed engineering–economic models to estimate the primary inputs of feedstocks, of electricity or other energy, and of capital equipment for each standard-sized plant and to estimate the resulting outputs of H2 and CO2. Within the models, a distinction is made between pathways in which the CO2 is sequestered and those in which it is released back into the atmosphere. Additional costs of CO2 separation, capture, compression, transport, and sequestration are included for processes in which most of the CO2 is sequestered.
Prices of feedstocks and electricity, costs of major pieces of capital equipment, operation and maintenance (O&M) costs, and rates of return on investment are used to translate physical measures of inputs to total costs of operating the plant annually. The total annual cost and the total annual average hydrogen output together give the cost per kilogram of hydrogen produced.
The original engineering–economic models were developed for the committee by SFA Pacific (an engineering and economic consulting firm located in Mountain View, California), working closely with a member of this committee. Committee members extensively reviewed all of the original models and subsequently modified or replaced many of them. Most of the models of current technologies using fossil fuels still correspond closely to the original models, although the committee made some changes in these models. The models of possible future technologies were modified greatly to correspond with the best judgments of the committee members about technological possibilities and the economic parameters. The final models used to analyze renewable technologies for hydrogen production were based almost entirely on analysis by committee members. Thus, the final versions of the models and the resulting cost estimations reflect the overall judgment of the committee.
Committee judgments, and thus the final parameters in the models, are based on a combination of information derived from many presentations by experts and industry representatives, SFA Pacific data, the expertise and experience of committee members, and committee follow-up on specific issues with outside experts. Many components of the cost estimates rely heavily on technical and economic judgments by members of the committee and on the information gathered during the course of the study. Thus, ultimately, the quantification represents collective judgments of the committee members. As such, the estimates, although they may look precise, are simply estimates.
There remains significant uncertainty about what the actual costs of the technologies would be under current conditions. Costs are site-specific, particularly for wind and solar-based technologies; only single representative costs are reported. And the uncertainty about possible future technologies is substantially greater. In addition, because these cost estimates are so heavily dependent on the judgment of committee members, other people may well make very different technical and economic judgments, particularly about the possible future technologies. Therefore, costs could be either higher or lower than the committee’s estimates.
The committee’s analysis generally is based on the assumption that critical technology development programs will be successful. The committee needed estimates of what might possibly be achieved with concerted research and development in order to determine the impact on petroleum consumption and CO2 emissions of an optimistic but plausible future. The committee is not predicting that the requisite research and development will be pursued, or that all of these technical advances necessarily will be achieved, even with a concerted R&D program. The committee simply needed a framework for its further analysis. If the research
goals are not met, there will be less (or even no) hydrogen in the nation’s energy system.
The committee chose not to provide sensitivity tests for the various parameters. A complete range of sensitivity tests would increase the report to unmanageable proportions and would still depend on the technological judgments of the committee members. However, the committee is making the spreadsheets containing the underlying data (see Appendix E) publicly available. These spreadsheets can be used by interested parties to conduct complete sensitivity tests based on their own technical and economic judgments.
In addition, the committee qualitatively estimated the sensitivity of supply chain costs to various parameters of the model. Table 5-3 includes these estimates, labeling the sensitivity as “low,” “medium,” or “high.” A blank cell in a column means that there is very low or no sensitivity to the particular parameter. More details about the cost estimations appear in Appendix E. The technologies are described in Chapter 8 and Appendix G.
In the following section, graphical estimates are presented to show the costs per kilogram of hydrogen production for many of the technologies examined in the study. Comparable information covering all of the technologies in the analysis appears in Appendix E.
UNIT COST ESTIMATES: CURRENT AND POSSIBLE FUTURE TECHNOLOGIES
Current Technologies
Figure 5-1 presents the unit cost estimates—the cost per kilogram of hydrogen—for the current technologies state of development for 10 of the current hydrogen supply pathways included in Table 5-2. (The possible future case is discussed later in this chapter.) For each pathway, the cost includes production, distribution (for CS and MS plants), and dispensing costs. State and federal fuel taxes—commonly called gasoline taxes—are not included. For central station production (4 pathways) and midsize production (2 pathways), the cost is separated into five components: (1) production cost (cost including production and storage onsite), (2) distribution cost (cost of transporting hydrogen by pipeline or cryogenic truck to the filling station), (3) dispensing cost (cost of compressing and storing hydrogen at the filling station and cost of dispensing hydrogen into vehicles), (4) CO2 disposal cost (cost of transporting and sequestering CO2 for technologies involving CO2 sequestration), and (5) an imputed cost7 for CO2 released into the atmosphere8 (with the imputed cost of $50 per metric ton [tonne] of carbon). For distributed production (4 pathways), there are no pipeline or cryogenic truck costs; compression and storage cannot be separated between production and dispensing. Thus, for distributed production, the first three cost components are combined into the total distributed cost; the imputed cost for CO2 released into the atmosphere is shown separately. There is no CO2 disposal cost included for distributed technologies; it is assumed that all of the CO2 is vented to the atmosphere.
In order to facilitate the comparison of total supply chain hydrogen costs with costs of gasoline, the gasoline efficiency adjusted (GEA) cost for a GHEV is introduced as a separate bar in Figure 5-1. The GEA allows head-to-head comparison of the total supply chain cost of amounts of gasoline and hydrogen that provide equal vehicle miles traveled (VMT) when consumed in a GHEV or an FCV, respectively. Thus, included within the GEA calculation is an adjustment for the efficiency of the respective vehicle. The estimate of GEA cost in Figure 5-1 is based on an assumed crude oil price of $30 per barrel (bbl) and a 66 percent efficiency gain of the FCV over the GHEV (see Chapter 6, especially Figure 6-2, for a detailed explanation). The gasoline cost is estimated as $1.27 per gallon (gal) of gasoline. Thus, the GEA cost of gasoline is $2.12 per kilogram of hydrogen (calculated as $1.27 × 1.66).9
Figure 5-1 shows that the cost per kilogram of hydrogen for the four central station technologies is similar to the GEA cost of gasoline in hybrid electric vehicles, once these plants are operating at full capacity. This suggests that with current technologies, if the cost and functionality of a hydrogen-fueled vehicle could be made similar to the cost and functionality of a hybrid electric vehicle, then hydrogen generated at central stations, using natural gas or coal as feedstocks, could be roughly comparable in overall cost to gasoline used in hybrid electric vehicles, once plants were
|
7 |
In Figure 5-1, there is a negative imputed cost of carbon for the generation of hydrogen from biomass with sequestration. That occurs because growing the feedstock takes CO2 from the atmosphere, CO2 that is ultimately sequestered. In the graph, that negative imputed cost appears as the part of the bar below the y = $0 line. The total cost would be reduced by this amount. |
|
8 |
Often this imputed cost is referred to as a carbon tax. However, the committee chose to use other terminology because it does not make a prediction as to whether the United States will legislate a carbon tax, issue tradable permits for CO2 releases, or not implement any such carbon controls. However, the cost to the environment per ton of carbon released is not dependent on whether such instruments are adopted. Thus the somewhat clumsy phrasing “imputed cost is used for carbon dioxide released into the atmosphere,” or the shortened version, “imputed cost of carbon dioxide,” is neutral on the particular instruments that might be adopted. The committee uses a $50 per metric ton cost of carbon. If the United States does not impose carbon restrictions, that cost will not be incorporated into the prices facing the producers of hydrogen. Likewise, if global climate changes turn out to be more severe than posited in some analyses, that cost may be an underestimate. |
|
9 |
In calculating the GEA cost, the cost of hydrogen included production, distribution, dispensing costs, and the imputed cost of carbon released into the atmosphere. The estimate of gasoline price excludes state and federal gasoline taxes. Similarly, the various components of gasoline cost—production, distribution, dispensing, and imputed carbon cost—are scaled in the same manner to calculate hydrogen-equivalent costs. |
TABLE 5-3 Sensitivity of Results of Cost Analysis for Hydrogen Production Pathways to Various Parameter Values
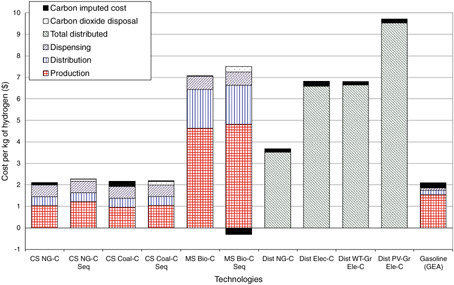
FIGURE 5-1 Unit cost estimates (cost per kilogram of hydrogen) for the “current technologies” state of development for 10 hydrogen supply technologies. Evaluation of a current technology case for nuclear thermal reforming of water is not included because no such technology exists at the present time. See Table 5-2 and discussion in text. NOTE: GEA = gasoline efficiency adjusted.
operating at full capacity. Each central station plant could provide enough hydrogen to fuel about 2 million vehicles. Thus, until there were several million vehicles operated within the service territory of a central station plant, these plants would operate at less than full capacity, and the average costs would exceed those estimated here.
Figure 5-1 also shows that with current technologies, the costs of generating hydrogen with any of the distributed technologies or the midsize biomass technologies would greatly exceed the gasoline costs.
The cost of hydrogen distribution and dispensing is important in assessing the overall economics of hydrogen production. Figure 5-1 shows that for the central station natural gas and coal technologies, the production cost is likely to be only one-half of the total cost of hydrogen; the cost of distribution plus dispensing is roughly as large as the production cost. Therefore, any estimation of the costs of supplying hydrogen must include the costs of distribution and dispensing or else risk sharply underestimating total supply costs.
Figure 5-1 also shows that CO2 disposal costs of $10 per tonne of CO2, and the carbon imputed cost of $50 per tonne of carbon (C), have very little impact on the comparative cost across technology options.
Figure 5-2 provides detail underlying the cost estimates. It includes each of the same technologies but disaggregates the production cost for central station and midsize technologies into five components: (1) capital charges, (2) feedstocks, (3) electricity, (4) nonfuel operation and maintenance, and (5) fixed costs. The costs of dispensing, distribution, CO2 disposal, and the imputed cost of carbon are not further disaggregated here, but their disaggregation is shown in Appendix E. For distributed technologies, the total cost is disaggregated to the same five components listed above.
Figure 5-2 shows that for the central station plants, feedstock costs play major roles in natural gas technologies, while capital costs are a very significant percentage in coal technologies. For biomass technologies, both feedstock and capital costs are high, resulting in hydrogen costs greater than $7.00/kg. Figure 5-2 shows that for the midsize and the distributed technologies, with the exception of distributed natural gas technologies, the capital costs alone exceed $2.00/kg. To calculate this capital cost in this analysis, the committee used a levelized annual capital cost equal to 15.9 percent of the capital investment cost for central station and midsize plants and equal to 14.0 percent of the capital investment cost for distributed generation.10 Central station and midsize plants were assumed to have a 2.5-year construction time, while distributed plants were assumed to have
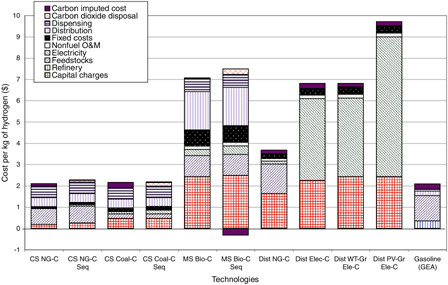
FIGURE 5-2 Cost details underlying estimates for 10 current hydrogen supply technologies in Figure 5-1. Evaluation of a current technology case for nuclear thermal reforming of water is not included because no such technology exists at the present time. See Table 5-2 and discussion in text. NOTE: O&M = operation and maintenance; GEA = gasoline efficiency adjusted.
a 1-year construction time.11 The differences in construction times result in the 1.9 percent differential in the annual capital cost factors.
The estimated costs for the three electrolysis-based distributed technologies are dominated by the electrolyzer capital costs and electricity costs, either grid-delivered electricity or electricity generated by wind turbines or photovoltaics. Therefore, the per-kilowatt-hour (kWh) cost of purchasing or generating electricity is an important determinant of the overall cost of supplying hydrogen using distributed electrolysis. This analysis assumes that grid-delivered electricity is available all of the time at a delivered price of $0.07/ kWh, photovoltaic-derived electricity is available 20 percent of the time at an average cost of $0.32/kWh, and wind-turbine-generated electricity is available 30 percent of the time at an average cost of $0.06/kWh.
Future Technology Cases
The costs of supplying hydrogen might be significantly reduced if research and development directed toward reducing these supply costs were successful. Figure 5-3 provides cost estimates for the possible future technologies, based on judgments by committee members about possible technological progress. This figure presents cost estimates for each hydrogen production process shown in Figures 5-1 and 5-2, plus hydrogen generated by dedicated nuclear plants, using a thermal process to decompose water (CS Nu-F)—in all, 11 technologies. The distributed electrolysis based on wind turbines (Dist WT Ele-F) now is assumed to use only electricity generated by wind turbines, in contrast to the current technologies analysis, in which it was assumed that most of the electricity was purchased from the grid. The wind machines and the electrolyzer are assumed to be made large enough that sufficient hydrogen can be generated during the 40 percent of the time that the wind turbines are assumed to provide electricity.12 The vertical scale is the same as the scale in the two previous graphs.
Figure 5-3 shows the committee’s estimation that, with this assumed technical state, hydrogen generated from natu-
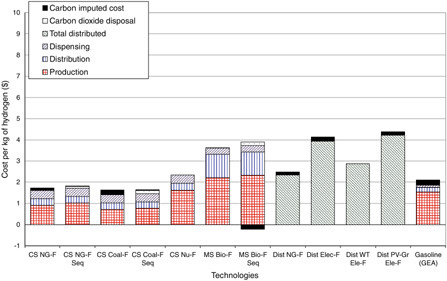
FIGURE 5-3 Unit cost estimates for 11 possible future hydrogen supply technologies, including generation by dedicated nuclear plants. See Table 5-2 and discussion in text. NOTE: GEA = gasoline efficiency adjusted.
ral gas or coal in central stations would be approximately the same cost to a cost lower than that for gasoline used in GHEVs. The gasoline cost assumes no increases in refining efficiency, and crude oil stays at $30/bbl.13 The committee estimates that hydrogen generated by central station nuclear energy, distributed natural gas steam reforming, and distributed electrolysis using wind-turbine-generated electricity would have costs within about $1.00/kg of the equivalent cost of gasoline used in GHEVs. Figure 5-3 shows that hydrogen generated using grid-delivered electricity or photovoltaic-derived electricity or using biomoss as a feedstock would be substantially more costly. This figure suggests that, if technology does advance as much as assumed possible, then several different technologies, using several different domestically available feedstocks, might become economically competitive with gasoline.
Figure 5-4 shows the detailed cost components for the possible future technologies. For fossil and nuclear technologies, distribution and dispensing costs are still a significant part of the costs. And feedstock costs are high for natural gas conversion. This figure, compared with Figure 5-2, shows that reduced capital costs and reduced electricity costs are the most important differences. The reduced electricity costs result from reduced costs of generating electricity using wind turbines or photovoltaics and estimated increases in the efficiency of electrolyzers.
This figure also suggests that because the electricity cost remains such an important component of overall cost, the price of electricity purchased from the grid and the costs of generating electricity using photovoltaics or wind turbines will be extremely important factors in determining the economic competitiveness of distributed electrolysis. For these possible future technologies, the estimates of the cost of delivered electricity generated using wind turbines14 decreases to $0.04/kWh (from $0.06/kWh), and using photovoltaics to $0.098/kWh (from $0.32/kWh). The price of grid-delivered electricity is kept at $0.07/kWh, the default estimate, under the assumption that advances in hydrogen-production tech-
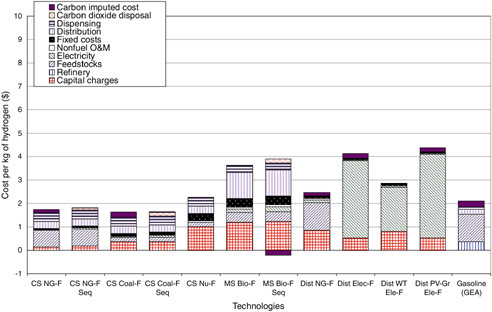
FIGURE 5-4 Cost details underlying estimates in Figure 5-3 for 11 future hydrogen supply technologies, including generation by dedicated nuclear plants. See Table 5-2 and discussion in text. NOTE: O&M = operation and maintenance; GEA = gasoline efficiency adjusted.
nologies and in wind turbines and photovoltaics will have small impact on the price of grid-delivered electricity.
COMPARISONS OF CURRENT AND FUTURE TECHNOLOGY COSTS
In order to facilitate comparisons between costs of current technologies and those of possible future technologies, both sets of costs can be displayed in a single graph. Figures 5-5 through 5-8 provide such graphs, with technologies grouped by primary feedstock from which the hydrogen is generated.
Distributed Electrolysis
Figure 5-5 shows the various distributed electrolysis technologies. This graph shows that the committee conceives of large reductions in hydrogen costs with technology advances. Most of the reduction comes from reduced electrolysis capital costs. The reduced capital cost is primarily the result of the assumption that the costs of proton exchange membrane (PEM) electrolyzers should decline by almost 90 percent, with successful research and development that parallels the advances in PEM fuel cells. The cost of solar photovoltaic electricity also decreases by 50 percent, owing to significant efficiency and manufacturing cost enhancements.15 Wind electricity also decreases, but by a smaller amount owing to its advanced state of current development.
For wind-turbine-derived electricity, both production using grid-delivered electricity when wind turbines are not providing electricity (Dist WT-Gr Ele-C and Dist WT-Gr Ele-F) and production relying exclusively on wind-turbine-generated electricity (Dist WT Ele-C and Dist WT Ele-F) are included. Capital cost decreases by a larger percentage for electrolysis using wind turbines exclusively. This particularly large capital cost decrease occurs because, for this technology, the capacity of the electrolyzer is inversely proportional to the capacity factor of the wind turbines that supply the electricity. It is assumed that current wind turbines supply electricity 30 percent of the time and that the possible future wind turbines supply electricity 40 percent of the time owing to better technology for utilizing a wider variation in wind speeds. In practice, these figures would be very site-specific, with some sites having higher capacity and others
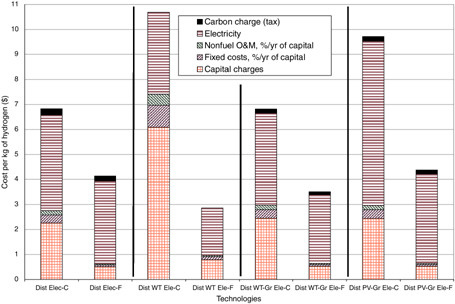
FIGURE 5-5 Unit cost estimates for four current and four possible future electrolysis technologies for the generation of hydrogen. See Table 5-2 and discussion in text. NOTE: O&M = operation and maintenance.
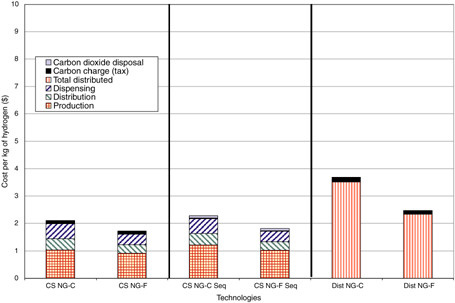
FIGURE 5-6 Unit cost estimates for three current and three possible future natural gas technologies for hydrogen generation. See Table 5-2 and discussion in text.
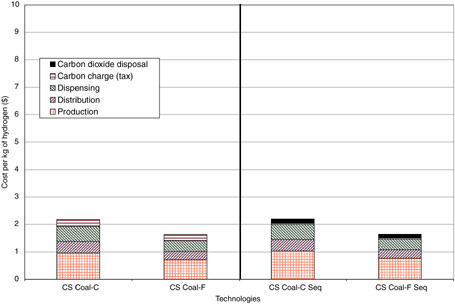
FIGURE 5-7 Unit cost estimates for two current and two future possible coal technologies for hydrogen generation. See Table 5-2 and discussion in text.
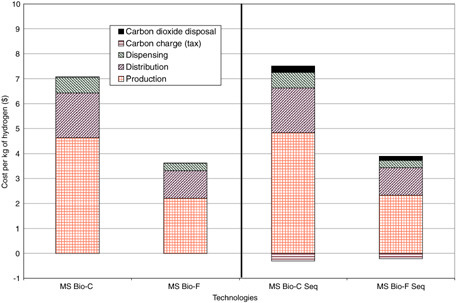
FIGURE 5-8 Unit cost estimates for two current and two possible future biomass-based technologies for hydrogen generation. See Table 5-2 and discussion in text.
lower capacity than is assumed here. Thus, the possible future technology electrolyzers need only be 75 percent as large as the current technology electrolyzers. The combination of the decreased cost of electrolyzers of a given size and the decreased size of required electrolyzers leads to the large reduction in estimated capital costs. The electricity cost also decreases more for electrolysis exclusively using wind turbines than for the technologies that rely on the grid to supply a large amount of the electricity, because a constant $0.07/ kWh price of grid-supplied electricity is assumed.16
Steam Reforming of Natural Gas
Figure 5-6 shows the various natural-gas-based hydrogen technologies, including both central station and distributed units based on steam reforming of natural gas. As can be seen, technology advances in central station plant hydrogen from natural gas will have a relatively small impact (15 to 20 percent) on hydrogen costs, while advances will have a larger impact on distributed electrolysis hydrogen costs (see Figure 5-5). The cost difference between distributed reforming and central station technologies comes about primarily for three reasons: (1) Capital costs per kilogram of hydrogen are considerably larger for the small steam reformer that would be used in a distributed operation. Central station reformers are assumed to be 2500 times as large as the distributed reformers, but cost only 333 times as much in total. Thus, the capital cost per kilogram of hydrogen is almost 8 times as large for the distributed unit. (2) Delivered natural gas prices for small-volume distributed units would probably differ from delivered prices for large-volume central station units. The committee assumes that the central station units would be able to purchase natural gas at a liquid natural gas parity price of $4.50 per million Btu (EIA, 2003), but that the distributed units would need to pay $6.50 per million Btu because of smaller volumes. (3) The cost advantage of the distributed unit, that no distribution costs would be required to transport the hydrogen from the point of production, is small compared with these two cost disadvantages of the distributed unit.
Coal
Figure 5-7 shows a graph, similar to Figure 5-6, for the central station generation of hydrogen using coal as the feedstock. Technology advances could improve the costs of hydrogen from coal by 25 percent. Under the assumptions of the costs of CO2 sequestration and the assumption of a $50 per tonne imputed cost of carbon released into the atmosphere, the total costs of coal-based hydrogen production would be almost identical with and without sequestration of CO2. This occurs because the analysis of the additional costs of CO2 separation and sequestration suggests that these costs would be very similar to the imputed cost of CO2 released into the atmosphere. If an imputed cost of carbon of more than $50 per tonne of carbon is used, sequestration of the carbon would be the less costly overall option, whereas if a smaller imputed cost of carbon is used, venting the CO2 into the atmosphere would be the less costly option.
Biomass
Finally, Figure 5-8 shows the cost comparisons for the hydrogen technologies using biomass as a feedstock. These technologies all assume the following: crops, such as switchgrass, would be grown and used as the feedstock, the biomass would be gasified, and the resultant syngas would be processed to separate the hydrogen. The cost differences between the possible future and the current technologies primarily stem from two factors: (1) The gasifiers are assumed to be reduced in cost and become more efficient—from 50 percent to 70 percent, with the appropriate successful research and development. (2) In addition, the growing of the biomass is assumed to become more productive with the genetic engineering of crops and other productivity advances, so the possible future technologies cases assume that 50 percent more crop could be grown per acre of land.
General Observations
In Figures 5-6, 5-7, and 5-8, the cost of distribution and dispensing from central station and midsize plants is a large part of the overall costs. In this analysis, it is assumed that some reductions in these costs will occur with future technologies, owing to the complex logistical issues in transporting hydrogen and delivering it into the end-use devices, the vehicles. As mentioned in Chapter 4, radically different methods of distribution and dispensing need to be developed to overcome these hurdles. The committee chose not to assume how much these breakthroughs would reduce costs.
As mentioned, this analysis assumes an imputed cost of $50 per tonne C released into the atmosphere and a $10 per tonne CO2 disposal cost. The committee concludes that technology choices for supplying hydrogen would not be significantly influenced by these costs, as they are small components of the overall costs.
As noted in Chapter 4, in the committee’s vision of a possible hydrogen future, the demand for hydrogen will likely be met using distributed production during the first couple of decades of transition. The total cost of hydrogen from the various distributed methods can be compared using Figure 5-5 and the last two bars on the right of Figure 5-6. These data show that with current technology, distributed electrolysis (Figure 5-5) produces hydrogen at a total cost much greater than that for hydrogen produced by distributed natural gas reforming. If competitive electrolysis is not avail-
able during the transition, use of distributed natural gas may be necessary during the transition period, until centralized facilities and the required distribution system are built.
UNIT ATMOSPHERIC CARBON RELEASES: CURRENT AND POSSIBLE FUTURE TECHNOLOGIES
Characteristics other than the unit cost of producing hydrogen from the various technologies are important as well. Regarding the important hydrogen program goal of reducing emissions of CO2 into the atmosphere, this analysis incorporates one measure of the goal by including the imputed cost of $50 per tonne of carbon for releasing CO2 into the atmosphere. But a general consensus has not been reached about the appropriate magnitude of this imputed cost of carbon, or equivalently, about the value of reducing carbon emissions. For that reason, the committee provides here its primary estimates of the unit impacts of introducing various hydrogen technologies into the energy system. In particular, estimates are developed of the amount of CO2 that would be released into the atmosphere per kilogram of hydrogen produced for each of the technological pathways considered. And, for comparison, similar estimates are also included, on a hydrogen-equivalent basis, of the amount of CO2 released from the combustion of gasoline in light-duty GHEVs (passenger cars and light-duty trucks). This information is used in Chapter 6 to provide estimates of the amount by which shifts from gasoline-fueled automobiles to hydrogen-fueled vehicles might change CO2 emissions.
Figures 5-9 and 5-10 provide estimates of the amount of carbon, in the form of CO2, that would be released into the atmosphere per kilogram of hydrogen produced. Figure 5-9 provides estimates for the current state of technology and Figure 5-10 for the possible future technologies.
The bars in Figures 5-9 and 5-10 are divided into two segments, as applicable, to indicate contributions from direct and indirect releases of CO2. One segment represents the direct release of CO2 from the generation of hydrogen. But many of the hydrogen-generation processes use significant amounts of electricity, and generation of that electricity itself releases carbon dioxide into the atmosphere. Estimates of these indirect releases are shown in Figures 5-9 and 5-10 in a second segment of each bar. For the indirect releases, it is assumed that the new electric generation facilities will release much less CO2 than the current grid does. For these estimates, it is assumed that electricity generation from new facilities releases 0.32 kg CO2 (0.087 kg C) per kilowatt of electricity, in contrast to the current system, which releases on average about 0.75 kg CO2 (0.205 kg C) per kilowatt of electricity.17 The estimates for the new facilities are used in the calculations, since it is expected that new facilities will represent the marginal impacts on the system. The two segments of a given bar together show the total release.
In order to compare carbon releases for hydrogen production with carbon releases from the use of gasoline, a gasoline estimate is included in Figures 5-9 and 5-10, in the same way that gasoline cost comparison is shown in Figures 5-1 through 5-4. This carbon emissions estimate for gasoline can be interpreted as the carbon emission for a GHEV on a “gasoline efficiency adjusted” basis. It is estimated that a gallon of gasoline, when used in an internal combustion engine, would release 2.42 kg C (or 8.87 kg CO2). The supply chain (reservoir to pump) for gasoline is about 79.5 percent efficient. Therefore, about 3.0 kg C is released into the atmosphere per gallon of gasoline consumed (3.0 is calculated as the ratio of 2.42 to 0.795). Thus, the carbon emission of gasoline is 5.0 kg C per kilogram of hydrogen (calculated as 3.0 × 1.66).
Figures 5-9 and 5-10 show that for all of the technologies except those involving electrolysis, the direct release of CO2 is far greater than the indirect release. However, for those involving electrolysis, there is no direct release of CO2; all releases are indirect, through electricity generation.
These figures show that whether or not the production of hydrogen would reduce CO2 emissions in comparison with emissions from gasoline-fueled vehicles depends on the particular hydrogen supply chain and on the characteristics of the gasoline-fueled vehicles.
Figure 5-9 shows that two current technologies—the central station coal facility without CO2 sequestration (CS Coal-C) and the distributed electrolysis system (Dist Elec-C)—would release about as much CO2 into the atmosphere as would the GHEV. This results from the higher energy efficiency of the FCV over the GHEV, offsetting the higher carbon content of the coal vented to the atmosphere during electricity generation from the coal.
Figure 5-9 also shows that using natural gas as a feedstock would reduce CO2 emissions by 30 percent (Dist NG-C) or 50 percent (CS NG-C) versus emissions from a GHEV, even though the CO2 from distributed natural gas reforming is assumed not to be sequestered. The use of wind turbines (Dist WT-Gr Ele-C) and photovoltaics (Dist PV-Gr Ele-C) for electrolysis would reduce the CO2 emissions to the extent that these renewables were the source of electricity rather than grid-supplied electricity. (In the committee’s analysis, these technologies rely on the power grid as backup.) However, because in these systems either 70 or 80 percent of the electricity is grid-supplied, these systems would reduce CO2 emissions by only 30 or 20 percent, as Figure 5-9 shows. Only with CO2 sequestration or with biomass as a feedstock would the current technology emissions be driven to near zero. And biomass with CO2 sequestration (MS Bio-C Seq) could lead to substantial negative net emissions of carbon dioxide: the CO2 taken from the atmosphere while growing the biomass would greatly exceed the residual amount released back into the atmosphere at the time of hydrogen production.
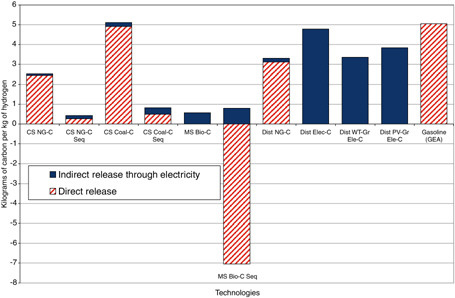
FIGURE 5-9 Estimates of unit atmospheric carbon release per kilogram of hydrogen produced by 10 current hydrogen supply technologies. See Table 5-2 and discussion in text. NOTE: GEA = gasoline efficiency adjusted.
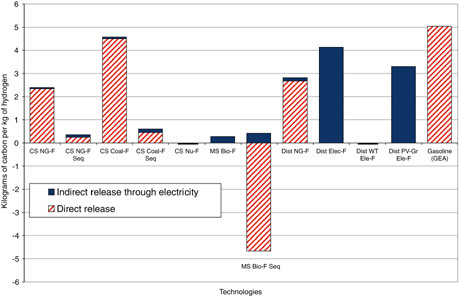
FIGURE 5-10 Estimates of unit atmospheric carbon release per kilogram of hydrogen produced by 11 future possible hydrogen supply technologies, including generation by dedicated nuclear plants. See Table 5-2 and discussion in text. NOTE: GEA = gasoline efficiency adjusted.
Figure 5-10 shows that the implications are similar with the possible future technologies. There are important differences. The first and most significant is the impact of the assumed large reductions in the capital cost of the electrolyzers. It would be less costly to purchase much larger electrolyzers, generate all electricity from wind turbines while they were generating electricity (rather than purchasing most of the electricity from the grid), and leave the electrolyzer idle the rest of the time. The generation of all of the electricity from the wind turbines implies that no CO2 would be released into the atmosphere.
Second, the carbon from sequestered biomass would be reduced in magnitude, becoming less negative. This reduction would be the result of the increased efficiency of hydrogen generation with the new technologies. A more efficient process implies that less biomass is needed per kilogram of hydrogen and thus less CO2 is removed from the atmosphere.
Finally, for all other technologies there are only small differences in the CO2 generation between the current and future cases, thus indicating that, in terms of CO2 releases, the choice of technology is more important than the technology advances that have been assumed.
Figure 5-11 plots unit carbon emissions (kilograms of carbon per kilogram of hydrogen produced) versus unit costs (dollars per kilogram of hydrogen) for each of the hydrogen production technologies depicted. Two key drivers—low cost and low net carbon emissions—can thus be compared in one graph. In the figure, the current technology is plotted as a square and the possible future technology as a triangle for each hydrogen production method.
WELL-TO-WHEELS ENERGY-USE ESTIMATES
One measure of the performance of a supply chain is its energy efficiency. For vehicles, such a measure is the well-to-wheels calculation of the amount of energy used18 per mile driven. Figures 5-12 and 5-13 provide these estimates for current technologies and possible future technologies, respectively, with PEM fuel cell vehicles. For the distributed wind-turbine-based electrolysis and photovoltaic-based hydrolysis, the committee assigned zero energy use for electricity from the wind turbine and photovoltaic arrays. Electricity from the grid, where applicable, is assumed to be 50 percent efficient.
The energy used per mile driven19 depends on the weight, aerodynamic resistance, and other physical characteristics of vehicles. Therefore, any measure of the energy used per mile driven must be standardized to these characteristics. The measurement in this analysis is based on a 27 miles-pergallon conventional gasoline-fueled vehicle (CFV).
Figure 5-12 shows that for current technologies, some technologies, such as the biomass-based or 100 percent grid-electric-based electrolysis technologies,20 would use more energy per mile driven than would the conventional vehicle and considerably more energy than would a GHEV. However, biomass uses renewable solar energy, and if enough land is available, the lower efficiency may not be particularly important. Other technologies—the electrolysis processes that use a combination of renewable wind power or photovoltaic electricity plus grid-based electricity—would use less energy per mile driven than would the conventional vehicle, but more than a GHEV would use. Still others—such as natural-gas-based or coal-based units—would use significantly less energy per mile driven than a conventional gasoline vehicle would, but would use only slightly less energy per mile driven than a GHEV would. Thus, with current technologies, hydrogen vehicles would not significantly increase the overall energy efficiency beyond the increase available with hybrid electric vehicles.
Figure 5-13 shows that energy efficiency would be increased with the possible future technologies, so that all of the hydrogen technologies would use less energy per mile driven than would the conventional gasoline-fueled passenger car. Natural gas, coal, or nuclear-based technologies would be more energy-efficient than GHEVs, but even these technologies would not substantially reduce energy use per mile driven. Only the system that uses 100 percent of its electricity from wind turbines would sharply reduce well-to-wheels energy use, in this case down to near zero.
FINDINGS
Several findings emerge from the analysis in this chapter:
Finding 5-1. Hydrogen from central station plant natural gas or coal, used in fuel cell vehicles, can be roughly cost-equivalent to gasoline in a hybrid electric vehicle, on a “gasoline-efficiency-adjusted” (GEA) basis. For natural gas and coal, the differences between current and possible future technologies are relatively small, in comparison to the committee’s estimation accuracy.
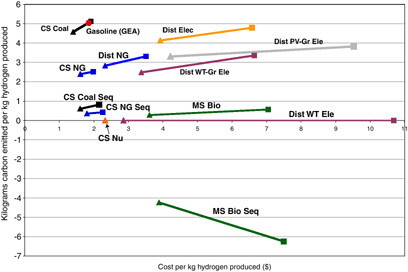
FIGURE 5-11 Unit carbon emissions (kilograms of carbon per kilogram of hydrogen) versus unit costs (dollars per kilogram of hydrogen) for various hydrogen supply technologies, in both current (■) and possible future (▲) states. See Table 5-2 and discussion in text. NOTE: GEA = gasoline efficiency adjusted.
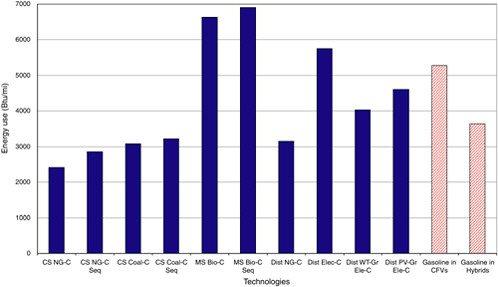
FIGURE 5-12 Estimates of well-to-wheels energy use (for 27 miles-per-gallon conventional gasoline-fueled vehicles [CFVs]) with 10 current hydrogen supply technologies. See Table 5-2 and discussion in text.
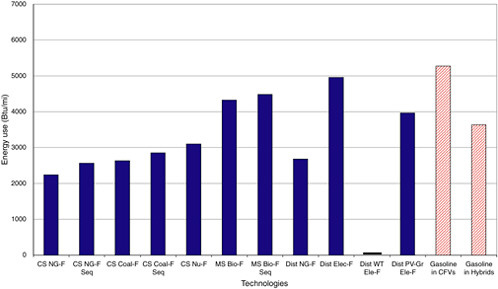
FIGURE 5-13 Estimates of well-to-wheels energy use (for 27 miles-per-gallon conventional gasoline-fueled vehicles [CFVs]) with 11 possible future hydrogen supply technologies, including generation by dedicated nuclear plants. Well-to-wheels energy use for wind-turbine-based electrolysis (Dist WT Ele-F) is near zero (narrow bar), as wind turbines have been assigned zero energy use. See Table 5-2 and discussion in text.
Finding 5-2. With the possible future technology advances, hydrogen generated by central station nuclear energy, distributed natural gas steam reforming, and distributed electrolysis using wind-turbine-generated electricity could have costs within about $1.00 per kilogram of gasoline costs on a gasoline-efficiency-adjusted basis.
Finding 5-3. Even with the possible technology advances, hydrogen from distributed electrolysis using photovoltaics or grid-supplied electricity, or hydrogen using gasification of biomass would have gasoline-efficiency-adjusted costs significantly higher than the gasoline cost. Thus, technological breakthroughs, even beyond the optimistic assumptions of the committee, would be needed to make these technologies competitive.
Finding 5-4. Distribution and dispensing costs will continue to be a significant component of total hydrogen supply chain costs for all production pathways except those based on distributed generation. Ignoring these costs would significantly underestimate total supply chain costs for hydrogen.
Finding 5-5. Using estimated carbon dioxide disposal costs of $10 per tonne of carbon dioxide, and the carbon imputed cost of $50 per tonne of carbon released into the atmosphere, these two costs of carbon management would have only a small impact on the relative costs of the various technologies.
Finding 5-6. Whether distributed electrolysis becomes economically viable will depend critically on the cost of the electricity used in the electrolysis. Therefore, the price of electricity purchased from the grid and the costs of generating electricity using photovoltaics or wind turbines will be extremely important factors in determining the economic competitiveness of distributed electrolysis.
Finding 5-7. Hydrogen can be produced by electrolysis using wind turbines as the source of the electricity. Whether this technology would be competitive on a gasoline-efficiency-adjusted basis with gasoline depends critically on whether the capital cost of the proton exchange membrane electrolyzers declines by the 90 percent assumed by the committee. With very low cost of electrolyzers, installation of very large electrolyzer units could fully compensate for the intermittent nature of wind-produced electricity. Costs of wind-produced electricity include the full capital costs of wind turbines, even though the wind turbine would produce electricity only some of the time.
Finding 5-8. Solar-based hydrogen does not appear viable even with currently envisioned cost decreases in photovoltaic cells and in electrolyzers.
Finding 5-9. Most of the hydrogen supply chain pathways would release significantly less carbon dioxide into the atmosphere than would gasoline used in hybrid electric vehicles. Only coal-based nonsequestered production and grid-based electrolysis are comparable to gasoline in this respect. The higher efficiency of fuel cell vehicles compensates for the high carbon dioxide content of the fossil fuels.
Finding 5-10. The technology advances envisioned by the committee would not significantly reduce the carbon dioxide emissions from fossil fuels, absent sequestration.
Finding 5-11. Carbon dioxide emissions could be brought down to near zero with biomass, with electrolysis depending exclusively on wind turbines or photovoltaics, with nuclear energy, or with the successful sequestration of carbon dioxide from the production of hydrogen from fossil fuels. Carbon dioxide emissions could be made negative if the hydrogen was produced from biomass and the carbon dioxide from production was separated and sequestered.
Finding 5-12. With current technologies, hydrogen vehicles would not significantly increase the “well-to-wheels” energy efficiency significantly beyond the increase available with gasoline hybrid electric vehicles. Well-to-wheels energy efficiency would be increased with the possible future technologies, and so all of the hydrogen technologies would use less energy per mile driven than would the conventional gasoline-fueled passenger vehicle. Fuel cell vehicles that derive their hydrogen from natural gas, coal, or nuclear-based technologies would be more energy-efficient than hybrid electric vehicles would, but even these technologies would not substantially reduce energy use per mile driven. Only the system that uses 100 percent of its electricity from wind turbines and solar power would sharply reduce well-to-wheels energy use, in this case down to near zero.


