
6
Implications of a Transition to Hydrogen in Vehicles for the U.S. Energy System
In this chapter, estimates are provided of the possible impacts of a successful transition to hydrogen in vehicles, focusing on the potential economic and environmental impacts and on those related to energy security and domestic resource use. The analysis is structured around a vision of transition to the use of hydrogen in light-duty vehicles (passenger cars and light-duty trucks). Although there are other proposed uses of hydrogen—for example, in heavy-duty trucks and buses, electricity generation, and stationary home applications—the focus here is on one use in order to gain a sense of the potential quantitative significance of a transition to hydrogen.
In this analysis, it is assumed that many problems of hydrogen use in vehicles are solved: low-cost and durable fuel cells are available; high density of energy storage on vehicles allows reasonable range and quick refilling of the vehicles; vehicles have the same functionality, reliability, and cost1 associated with their gasoline-fueled competitors; hydrogen-fueled vehicles are as safe as gasoline-fueled vehicles. (These problems are discussed more fully in Chapter 3.)
This vision is not a prediction of the diffusion of hydrogen technologies into the fleet of vehicles, depending as it does on such a large number of factors that are inherently uncertain. However, it is offered to allow some specificity in the analysis of the possible implications for the U.S. energy system of a transition to hydrogen in vehicles.
Starting with this optimistic vision, estimates are made of the consumption of gasoline and of hydrogen for the first half of this century. This estimation depends on assumptions of the growth in vehicle miles; the average fuel efficiency over time of conventional gasoline-fueled vehicles, gasoline hybrid electric vehicles (GHEVs), and hydrogen vehicles; the sales of new vehicles; and the operational life of vehicles once purchased.
The analysis of Chapter 5 is combined with this estimation of hydrogen consumption over time. For each particular hydrogen-producing technology, an examination is made of the economic, environmental, energy security, and domestic resource use implications, under the pure case assumption that all of the hydrogen is generated through that individual technology. This analysis is conducted for both the “current” state of technology development and the “possible future” state of technology development.
Although the analysis is conducted on the basis of the pure cases of 100 percent of the hydrogen’s being generated from a particular technology, the committee does not believe that the system would evolve that way. If there is a successful transition to hydrogen, the committee expects hydrogen to be produced using multiple technologies. The committee has chosen in this study not to create a single scenario in which the proportions of production using the various technologies are postulated. But the interested reader can examine the implications of such scenarios by taking weighted averages of the impacts estimated from the pure strategies.
In developing the analyses, the committee made quantitative estimates of some of the impacts believed to be most important, but it was not able to examine all of the possible impacts. The environmental impacts examined are associated with potential global climate change caused by carbon dioxide (CO2) emissions from light-duty vehicles under the various technology pathways (see Table 5-2 in Chapter 5). The committee does not attempt to estimate any impacts on
global climate change of hydrogen leakage or of changes in the quantities of other greenhouse gases released into the atmosphere, nor does it examine the impacts on emissions of criteria pollutants2 from vehicles.
The economic impacts examined are the costs to the United States as a whole from fueling the fleet of light-duty vehicles. Under the committee’s maintained assumption that the costs of the vehicles themselves are equivalent to the costs of the vehicles for which they substitute, differences in the costs of fueling the fleet will translate into differences in the total costs of driving the fleet of light-duty vehicles. Costs of the infrastructure to fuel the vehicles are included in the supply costs for hydrogen. Therefore, although the committee does not explicitly separate the infrastructure costs from the fuel costs, the infrastructure costs are part of the total. However, because the development of infrastructure may involve large investments concentrated over a small number of years, calculations should not be interpreted as capturing the time dimension of the physical investments themselves. And the committee does not examine any of the redistributional consequences of a shift to hydrogen. In particular, such a massive transition will lead to economic opportunities for some established companies, many new companies, and many individuals, while reducing the economic opportunities for some established companies and individuals. The committee does not examine these potentially important consequences.
The energy security implications examined are related to the imports of energy, in particular, petroleum and natural gas. The committee examined the impacts on the use of gasoline, impacts that can be expected to translate directly to impacts on the imports of crude oil or petroleum products. Impacts on the use of natural gas were examined. An increase in demand would cause an increase in price, which in turn could increase domestic supply. Thus, it is not clear what fraction of this increase in natural gas use would translate into increases in natural gas imports. However, it is assumed that most of this increase in natural gas use would translate directly into increases in natural gas imports, consistent with projections in Annual Energy Outlook 2003 (EIA, 2003). The committee did not try to quantify other impacts on energy security associated with changes in the vulnerability of the energy infrastructures to human error, mechanical breakdown, or terrorism. However, the committee does recognize that choices of distributed production versus central station production, choices of particular hydrogen transportation options, and choices of precise locations of new plants can have significant impacts on energy security.
The committee analyzed several implications relative to domestic resource use. For biomass production, it examined the amount of land that would be required to grow the crops used as feedstocks. For coal-based hydrogen production, it examined the amount of coal that would be used over time. For technologies involving sequestration, it examined the amount of CO2 that would be sequestered on a year-by-year basis and the cumulative quantity sequestered. The committee did not try to quantify several other resource use impacts: it did not examine the amount of land that would be required for wind farms, production facilities, or distribution infrastructure; it did not examine the impacts on water use for steam reforming processes or for biomass production; it did not attempt to examine any labor force issues; nor did it examine the needs for metals or other materials for fuel cells, electrolyzers, or production facilities, or the number of pipelines, or other infrastructure.
HYDROGEN FOR LIGHT-DUTY PASSENGER CARS AND TRUCKS: A VISION OF THE PENETRATION OF HYDROGEN TECHNOLOGIES
Starting with the assumption that the many problems related to the use of hydrogen in vehicles are solved, a plausible but optimistic vision of the penetration of hydrogen technologies into the fleet of vehicles was created. In this vision, as described in Chapter 3, the committee assumes that GHEVs initially begin capturing market share from conventional vehicles, reaching 1 percent in 2005 and growing by 1 percentage point per year until hybrids reach 10 percent market share in 2014. With the introduction of hydrogen vehicles in 2015, initially the market share of GHEVs grows by 5 percentage points per year, while that of hydrogen vehicles grows by 1 percentage point annually. During this period, the market share of conventional vehicles declines by 6 percentage points annually. As hydrogen vehicles continue to grow in popularity, with their market share increasing, the market share of GHEVs peaks in 2024 at 60 percent and then begins declining by 2 percentage points annually. After reaching a 10 percent market share in 2024, hydrogen vehicles begin increasing their market share by 5 percentage points per year until capturing a 60 percent market share in 2034. In that year, hybrids capture 40 percent of the market, and conventional vehicles are no longer purchased. From that point on, hydrogen vehicles increase their market share by 10 percentage points per year, until hydrogen vehicles ultimately capture 100 percent of the market for new vehicles in 2038. The committee considers this vision to repre-
sent an optimistically fast rate of penetration of hydrogen vehicles into the marketplace.
In order to examine the impacts of the hydrogen introduction, the committee examined a case in which no hydrogen vehicles are introduced, but hybrids capture the entire market share that would have been captured by hydrogen vehicles. In this case, the time path of conventional vehicles remains the same as in the committee’s plausible but optimistic vision. For every additional hydrogen vehicle in this analysis, there is one fewer hybrid electric vehicle.
The market shares of new vehicle sales of the three classes of vehicles in the vision are shown in Figure 6-1.
Once new automobiles are sold, they are driven for many years.3 Thus, the fraction of miles driven by each class of vehicles lags well behind the market share of new vehicle sales. Figure 6-1 shows the fractions of all miles assumed to driven by each class in the committee’s vision, in addition to the fractions of new vehicles sold by each class. The fractions of all miles are calculated as the fractions of all vehicles on the road, adjusted by the assumption that new vehicles are driven more than old vehicles are.
During the years in which it is driven, each type of vehicle must use the fuel for which it is was designed. And, in the committee’s analysis, it also assumed that the fuel economy of each vehicle is determined at the year the vehicle is sold, and that the fuel economy remains constant during the lifetime of the vehicle.
Figure 6-2 shows the fuel economy assumed for the three classes of vehicles over time. New and existing conventional vehicles are assumed to achieve, on average, 21 miles per gallon (mpg) of gasoline in 2002. However, this average fuel efficiency is assumed to increase by 1 percentage point per year during the entire time horizon. No assumptions are made about whether this increase is determined by regulations such as changing corporate average fuel economy standards, improved technologies, market forces, or some combination of factors. The committee notes that historic trends in light-duty-vehicle fuel economy, on a fleetwide basis, reached a plateau in the mid-1980s (EPA, 2003).
New GHEVs are estimated to have a 45 percent higher fuel economy than that of conventional vehicles in any year (see Chapter 3 for a discussion of efficiency differences); new hydrogen vehicles are estimated to have 2.4 times the fuel economy of conventional vehicles (or a 66 percent higher fuel economy than that of GHEVs). (For both types of vehicles, the average fuel efficiency is assumed to increase by 1 percentage point per year during the entire time horizon.4) Thus, the ratio of miles per kilogram for new hybrid vehicles to miles per gallon for gasoline-fueled vehicles remains constant over time, with all fuel economies growing steadily. This assumption about the relative efficiencies is designed to provide an optimistic view of the fuel efficiency of hydrogen vehicles.
In the committee’s analysis, both the number of new cars sold and the total vehicle miles traveled increase at 2.3 percent per year, consistent with the Energy Information Administration’s (EIA’s) Reference Case forecast of growth in vehicle miles traveled for light-duty vehicles.5 (This forecast rate of increase is consistent with recent historical trends, but the committee recognizes that it could be subject to alteration by many factors.) The total vehicle miles traveled for each type of car is proportional to the number of each type on the road, adjusted so that new cars are assumed to be driven more than older cars are.
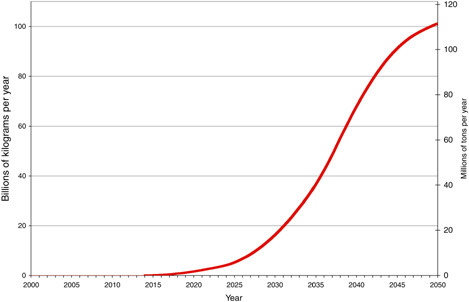
Taken together, the assumptions about new-car sales, new-car fuel economy, proportions of the different types of vehicles, and vehicle miles traveled allow the committee to estimate the amount of hydrogen and of gasoline that would be used for light-duty vehicles if those assumptions in the optimistic vision came to pass. Figure 6-3 shows the consumption of hydrogen by light-duty vehicles estimated for this vision. By the year 2050, light-duty vehicles would be consuming 101 billion kilograms, or 111 million tons, of hydrogen per year. The consumption can be compared with the current U.S. industrial production of hydrogen of about 8 billion kilograms annually (see Chapter 2). In the committee’s vision of the possible penetration of hydrogen vehicles into the marketplace, light-duty vehicles could be consuming 8 billion kilograms of hydrogen annually by the year 2027.
In contrast, gasoline consumption would continue to rise only until the year 2015, after which it would begin declining until it reached zero in 2050. This trajectory of gasoline consumption is shown in Figure 6-4. Note that this figure includes two scales, measuring gasoline use in millions of barrels per day (right scale) and in quadrillion British thermal units (Btu) per year (left scale).6
Figure 6-4 also displays two other trajectories of gasoline consumption. The first shows an estimate of gasoline consumption in the absence of either hybrid electric vehicles or hydrogen vehicles. It shows that gasoline consumption would continue increasing at rates consistent with historical
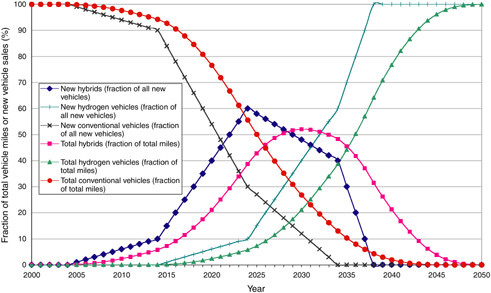
FIGURE 6-1 Demand in the optimistic vision created by the committee: postulated fraction of hydrogen, hybrid, and conventional vehicles, 2000–2050.
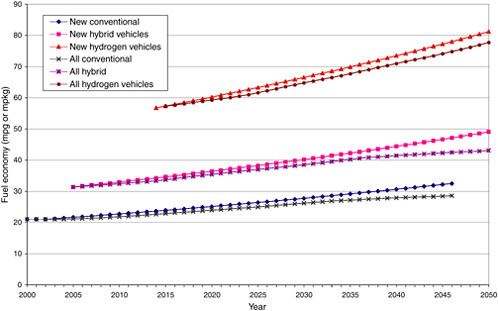
FIGURE 6-2 Postulated fuel economy based on the optimistic vision of the committee for conventional, hybrid, and hydrogen vehicles (passenger cars and light-duty trucks), 2000–2050.
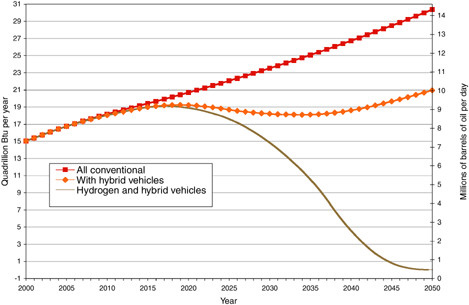
experience, taking into account the increased mileage per gallon of conventional vehicles. The second trajectory shows the estimated consumption of gasoline if hydrogen vehicles were never adopted and hybrids captured the entire market share that would have been captured by hydrogen vehicles. In the discussions that follow, the committee considers the impact on gasoline consumption of a transition to hybrid vehicles. That impact can be seen as the difference in Figure 6-4 between the gasoline consumption and the consumption with hydrogen and hybrid vehicles.
In order to put the figures showing gasoline use in context, the committee can plot the projections from the Energy Information Administration (EIA, 2003) of U.S. oil consumption, production, and imports along with the committee’s estimates of gasoline consumption in the three cases. This superposition of the gasoline consumption estimates with the EIA projections of oil supply, demand, and imports appears in Figure 6-5. This figure shows that automotive consumption of gasoline is a large fraction of total oil consumption but is less than 50 percent of total U.S. use of crude oil and petroleum products. Thus, a transition to hydrogen in light-duty vehicles could lead to a large reduction in oil imports, although the United States would continue to import crude oil or petroleum products to be used in large trucks, airplanes, and other industrial uses.
It should be noted that none of the estimates in Figures 6-1 through 6-5 depends on which technologies are used to produce hydrogen, but rather on whether hydrogen vehicles are introduced into the marketplace and on the rate at which they are adopted. However, the environmental, energy security, economic, and domestic resource use implications depend significantly on which technologies are used to generate the hydrogen. These issues are examined in subsequent sections of this chapter.
CARBON DIOXIDE EMISSIONS AS ESTIMATED IN THE COMMITTEE’S VISION
As noted in Chapter 5, one of the important goals of the hydrogen program is to reduce the emissions of carbon dioxide into the atmosphere, given the impacts of possible global climate change associated with releases of greenhouse gases. Therefore, it is important to estimate the amount by which shifts from gasoline in automobiles to hydrogen for fueling vehicles would change CO2 emissions. In order to put the committee’s estimates in context, Figure 6-6 shows EIA projections of U.S. carbon emissions in the form of CO2, broken down by energy-consuming sectors and by fossil fuels. The EIA projects that by the year 2025, the United States will be emitting more than 2200 million metric tons of carbon, over
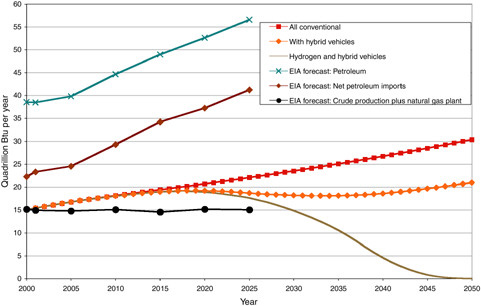
FIGURE 6-5 Gasoline use cases based on the committee’s optimistic vision compared with Energy Information Administration (EIA) projections of oil supply, demand, and imports, 2000–2050. SOURCE: EIA (2003) for EIA projections.
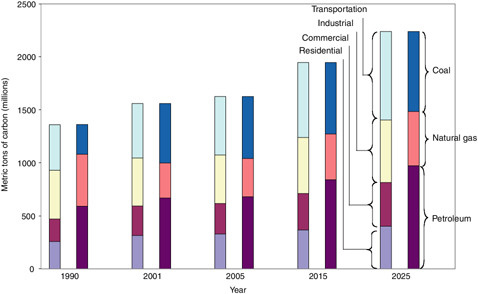
FIGURE 6-6 Projections by the Energy Information Administration (EIA) of the volume of carbon releases, by sector and by fuel, in selected years from 1990 to 2025. SOURCE: EIA (2003).
one-third of which is projected to be from petroleum use (EIA, 2003). The projections show that the entire transportation sector, not simply the light-duty vehicles, will account for 37 percent of these emissions. Thus, gasoline use in light-duty vehicles is an important component of the release of CO2 into the atmosphere, comprising roughly two-thirds of the carbon emissions from the transportation sector (EIA, 2002), but it is not the dominant component.
In Chapter 5, the committee presented estimates of the amount of CO2 that would be released into the atmosphere per kilogram of hydrogen produced for each of the technological pathways considered; it also gave estimates of the amount of CO2 that would be released into the atmosphere per gallon of gasoline used. These estimates can be applied to the committee’s estimates of gasoline consumption and hydrogen consumption over time in order to estimate the impacts of a transition to hydrogen on the carbon releases into the atmosphere. These estimates appear in Figures 6-7 and 6-9 for current hydrogen production technologies and in Figures 6-8 and 6-10 for possible future technologies.
Figures 6-7 through 6-10 show that a transition from conventional fueled vehicles to hybrids alone, without the introduction of hydrogen-fueled vehicles, would reduce carbon emissions by 200 million metric tons annually by 2050. A further transition from GHEVs to hydrogen vehicles would have sharply different impacts, depending on which technology was utilized. At one extreme, the use of coal without sequestration or of distributed electrolysis using grid-supplied electricity would lead to little or no further reductions in CO2 releases than would occur through a transition to GHEVs.
Distributed generation of hydrogen by electrolysis using photovoltaics or wind turbines when they were available, and using grid-supplied electricity when the wind turbines or photovoltaics were not supplying electricity, could further reduce CO2 emissions by a moderate amount (on the order of 100 million to 150 million metric tons per year by 2045). The reductions in CO2 emissions from the possible future technologies could be somewhat greater than those obtainable using the current technologies, but the differences between the two are not great. However, distributed electrolysis using electricity exclusively from wind turbines could bring CO2 emissions down to zero by 2050 if it were possible to generate all of the hydrogen by this means. The committee shows this particular technology for the possible future state of technology development and shows wind turbines combined with grid-supplied electricity for the current state of development.7
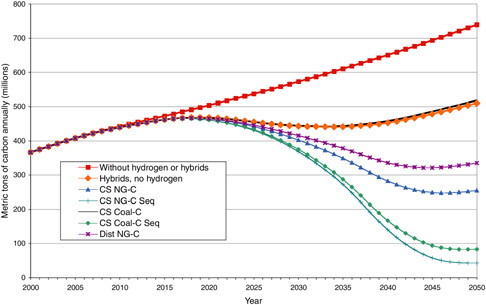
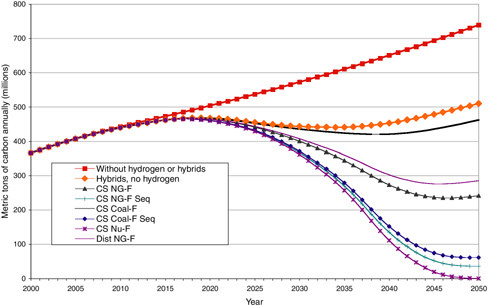
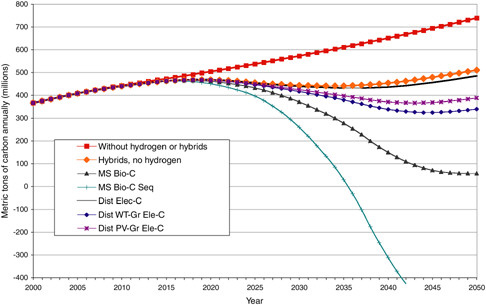
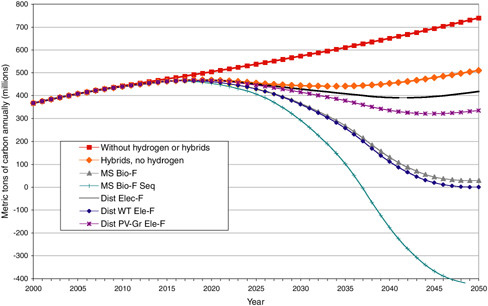
Steam reforming using natural gas in a central station or distributed facility could reduce CO2 emissions on the order of 200 million metric tons per year by 2050, in either state of technology development. Also, sharp reductions in CO2 emissions would occur if all of the hydrogen was generated using biomass as a feedstock, or nuclear power as a heat source, or if the CO2 from a coal-based or a natural-gas-based technology was separated and sequestered.
At the other extreme, if all of the hydrogen could be generated using biomass as a feedstock and all of the CO2 could be separated at the point of hydrogen production and sequestered, there would be negative net emissions of CO2 into the atmosphere after 2036. That is, on net, the process would take significant amounts of CO2 out of the atmosphere.8
SOME ENERGY SECURITY IMPACTS OF THE COMMITTEE’S VISION
As noted, a second important goal of the hydrogen program is to improve energy security by substituting secure domestic resources for imported energy resources, particularly those that may be traded in unstable international markets. Figure 6-4 shows that a transition to hydrogen in light-duty vehicles could sharply reduce the use of gasoline and thus could reduce the importation of oil. Some of the technologies would use domestic resources without increasing the importation of other energy from potentially unstable parts of the world. Technologies based on coal, biomass, nuclear power, or entirely on renewables, such as wind turbines and photovoltaics, would not lead to significant energy imports. A transition to hydrogen could improve energy security if the hydrogen were generated from such domestic feedstocks.
Other technologies, however, would use natural gas, a commodity which, although produced domestically, is also imported in significant quantities and would be subject to some of the same international market instability that occurs in the petroleum markets. Additional uses of natural gas would lead to additional imports. In this case, whether energy security is improved or harmed depends on whether the security benefits from reduced oil imports are greater than the security costs of increased natural gas imports.
In order to examine this issue, estimates were developed of the amount of natural gas that would be used if all of the hydrogen were generated using one of the natural-gas-based technologies. These estimates appear in Figure 6-11, which includes estimates for both current and possible future technologies. This figure also includes the EIA projections of natural gas supply, demand, and imports in order to put the estimates from the committee’s vision in context.
Figure 6-11 shows that if all of the hydrogen were generated using one or more of the natural-gas-based technologies, the increase in natural gas consumption would be a significant fraction of the projected domestic production. It also shows that, according to EIA projections, the United States will be importing a significant fraction of this natural gas in the years 2010 through 2025. Given the magnitude of the use of natural gas for hydrogen production, it can be reasonably expected that most of the additional consumption will result in additional imports of natural gas once the United States gets beyond a transition period. However, during the transition period (through 2030), natural gas imports would not increase significantly.
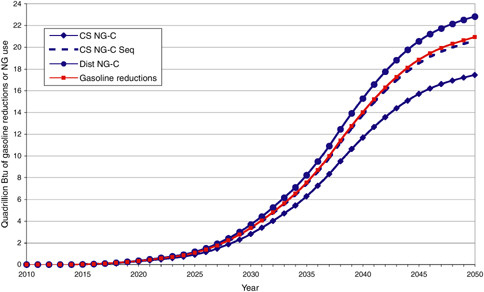
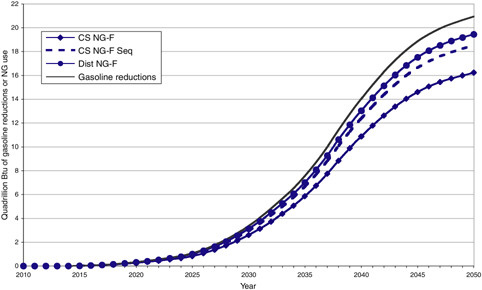
The additional use of natural gas can be compared with the reduced use of gasoline. Figure 6-12 provides this comparison for the current technologies, and Figure 6-13 provides the comparison for possible future technologies. Both of these graphs plot, on the same scale, the gasoline reductions associated with the penetration of hydrogen vehicles in place of hybrid electric vehicles, and the natural gas use increases for the central station natural-gas-based technologies, with and without sequestration, and the distributed reforming of natural gas.
Figures 6-12 and 6-13 show that the increases in natural gas use, measured in quads, are of similar magnitude to the decreases in gasoline use, although the natural gas increases with the possible future technologies will be somewhat smaller than the decreases in gasoline use will be. These figures suggest that it is unlikely that a transition to hydrogen based on natural gas would significantly increase energy security.
It must be stressed, however, that the issue raised here would not be relevant for the other domestically produced resources or if large new sources of domestic natural gas are found. Technologies based on coal, biomass, nuclear power, or the two renewables—wind turbines and photovoltaics—would not result in such compensating increases of energy imports. A transition to hydrogen using these feedstocks could thus improve energy security.
A sharp reduction in gasoline use would require important adjustments in U.S. petroleum refining. These adjustments themselves could have energy security implications. Existing refineries swing between summer and winter differences in demand for gasoline and distillate fuels. However, if gasoline use is reduced to a very small portion of refined products, new refining processes may be needed. Alternatively, U.S. refiners might continue importing crude oil, making gasoline for exportation. The implications of such a scenario, or of alternative responses, are worthy of examination.
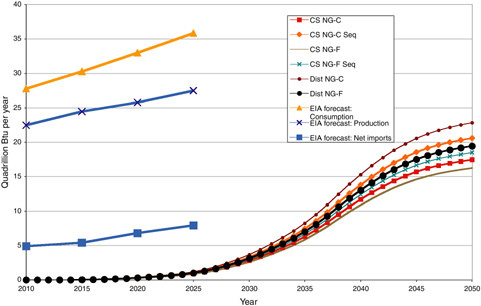
FIGURE 6-11 Estimated amounts of natural gas to generate hydrogen (current and possible future hydrogen production technologies) compared with projections by the Energy Information Administration (EIA) of natural gas supply, demand, and imports, 2010–2050. See Table 5-2 in Chapter 5 and discussion in text. SOURCE: EIA (2003) for EIA projections.
OTHER DOMESTIC RESOURCE IMPACTS BASED ON THE COMMITTEE’S VISION
In addition to impacts on natural gas, the committee has estimated impacts on several other domestic resources. Coal-based hydrogen generation would require increased U.S. production of coal. Biomass-based hydrogen production would require the use of land. The sequestration of CO2 would require infrastructure for sequestration as well as domestic resources into which the sequestered CO2 could be prominently placed. The committee summarizes here some of the most important of these impacts on such domestic resources. It continues to maintain the discussion about pure options in which all of the hydrogen is produced from a given feedstock. The reader should be reminded that, more realistically, if the challenges of hydrogen are mastered, the transition will not be to such a pure system but rather to a system in which many different supply chains are used to provide the hydrogen.
Hydrogen generation using only coal as a feedstock could be expected to significantly increase the use of coal in the United States. Figure 6-14 provides those estimates for both current and possible future technologies that use coal as a feedstock, either with or without CO2 sequestration. The figure puts these estimates in perspective by including the EIA forecast of U.S. consumption and production of coal.9
Figure 6-14 shows that, by 2050, hydrogen production could use between 13 quadrillion and 15 quadrillion Btu per year of coal, with slightly smaller quantities for possible future technologies and slightly larger quantities for technologies involving CO2 sequestration. The figure shows that, at least through 2035, the use of coal for hydrogen production can be expected to be a relatively small fraction of total coal production. However, by 2050, if hydrogen were generated exclusively using coal-based technologies, its use for hydrogen production would be a substantial portion of the industry.
Technologies that use biomass as a feedstock require substantial acreage in order to grow the biomass. In the models developed for the study, it is assumed that under current technology conditions, 4.0 tons of bone-dry biomass can be grown per year for each acre of land and that each ton of biomass has an energy content of 16 million Btu. Under possible future technology conditions, it is assumed that the growing of a biomass becomes more productive, so that 6.0
|
9 |
Figure 6-14 shows the EIA projection that domestic production and consumption of coal will remain equal to one another, so there will be no net imports of coal. |
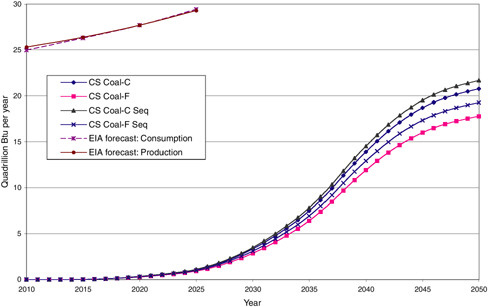
FIGURE 6-14 Estimated amounts of coal used to generate hydrogen (current and possible future hydrogen production technologies) compared with Energy Information Administration (EIA) projections of coal production and use, 2010–2050. See Table 5-2 in Chapter 5 and discussion in text. SOURCE: EIA (2003) for EIA projections.
tons of bone-dry biomass can be grown per year for each acre of land. These assumptions allow the committee to develop estimates of the amount of land that would be required if biomass were the feedstock for 100 percent of the hydrogen production. Figure 6-15 provides those estimates for both the current and possible future technologies, both with and without CO2 sequestration.
Figure 6-15 shows that under current technology conditions, if all of the hydrogen were generated from biomass, in 2050 the United States would be using about 650,000 mi2 of land to grow the biomass needed to fuel the light-duty fleet of vehicles. However, with the possible future technologies, the nation would need a substantially smaller amount, about 280,000 mi2. The difference between the two estimates of land use results from differences in the assumed productivity of land and differences in the efficiency of the gasifier under the two states of technology development.
For comparison purposes, the United States is estimated to have roughly 700,000 mi2 of cropland and 900,000 mi2 of rangeland or pastureland (Vesterby and Krupa, 1997). If the biomass can be grown on land that currently serves as rangeland or pastureland, which the committee believes is unlikely because of water-use restrictions, then under possible future technology conditions, by 2050 biomass production would account for about 16 percent of this land, even if all of the hydrogen were made using biomass as a feedstock. However, if the biomass requires land that currently serves as cropland, then by 2050 under possible future technology conditions, biomass production could use about 33 percent of all current cropland.
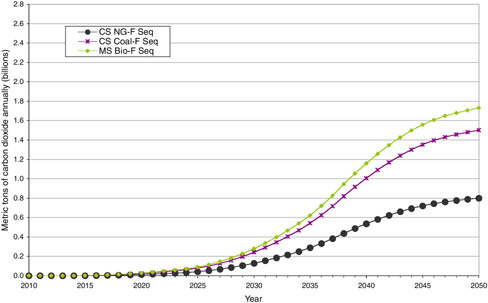
For those technologies that rely on CO2 sequestration, the committee examined the amount of CO2 that would be sequestered annually and the cumulative sequestration. The models assume that 90 percent of the CO2 for a given plant can be separated and sequestered and that 10 percent of the CO2 will escape into the atmosphere. Figures 6-16 and 6-17 respectively provide estimates of the annual and cumulative amounts of CO2 that would be sequestered with current technologies, for central station natural gas and coal plants and midsize biomass plants. Figures 6-18 and 6-19 respectively provide annual and cumulative sequestration estimates for possible future technologies.
Figures 6-16 through 6-19 show the massive amount of CO2 sequestration that would be required, both annually and cumulatively, in order to use fossil fuels as hydrogen feedstocks while sharply reducing the amount of CO2 released into the atmosphere. By 2050 the United States would need
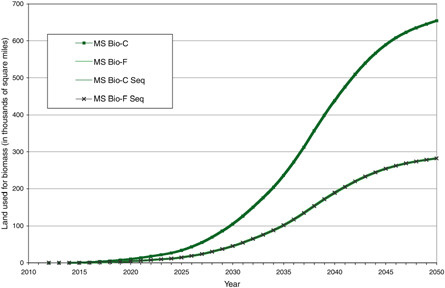
FIGURE 6-15 Estimated land area used to grow biomass for hydrogen: current and possible future hydrogen production technologies, 2010–2050. See Table 5-2 in Chapter 5 and discussion in text. NOTE: The curves for current midsize biomass with sequestration (MS Bio-C Seq) and without sequestration (MS Bio-C) are identical, as are the curves for possible future midsize biomass with sequestration (MS Bio-F Seq) and without sequestration (MS Bio-F).
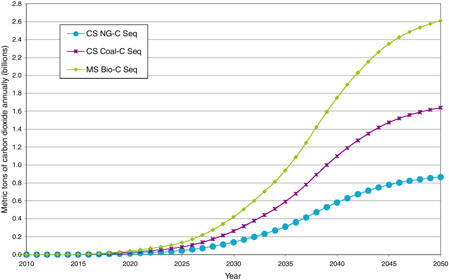
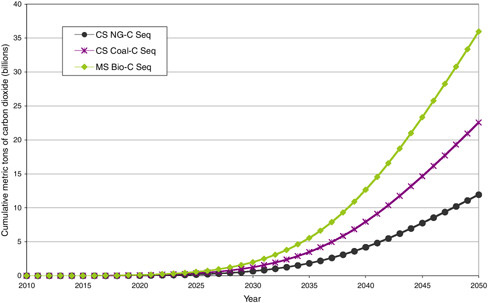
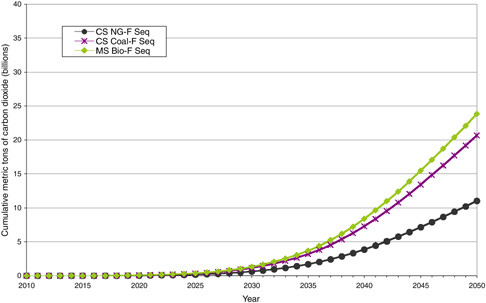
to sequester about 10 billion metric tons of CO2, cumulatively, if hydrogen was generated using natural gas as a feedstock, and about twice as much with coal as a feedstock. These figures also suggest that, except for biomass-based hydrogen, there is relatively little difference in the amount of sequestration needed between current and possible future technologies. Both the rate of sequestration and the cumulative amount of sequestration needed can be expected to pose very great challenges.
These estimates can be compared with the available estimates of the geological sequestration capacities of potential locations. North American storage capacity is estimated at between 5 and 500 gigatons (GT) CO2 in Holloway (2001), and the same review article notes that the capacity of a single aquifer has been estimated at 9 to 43 GT CO2.
To put the annual volumes of sequestration in context, one can compare them with the movement of natural gas. The EIA (2003) projections for the year 2025 of natural gas consumption at 36 quadrillion Btu per year translates to roughly 0.7 billion metric tons of natural gas moved per year. Thus, sequestration of CO2 from coal-based or biomass-based hydrogen production in 2050 (see Figures 6-16 and 6-18) would require the movement of a mass of CO2 twice the amount that the EIA projects to be the mass of natural gas moved in 2025.
IMPACTS OF THE COMMITTEE’S VISION FOR TOTAL FUEL COSTS FOR LIGHT-DUTY VEHICLES
Finally, the committee considered the economic impacts of the alternative hydrogen production technologies. Taking into account the estimate of the consumption of gasoline over time, the consumption of hydrogen over time, the cost of gasoline,10 and the cost of hydrogen from the various technologies, estimates were made of the total cost per year of fueling the fleet of automobiles. Under the assumption that hydrogen-fueled vehicles have the same production and maintenance costs as those for gasoline-fueled vehicles, differences in the total cost per year of fueling the fleet of automobiles translates directly into differences in the total economic costs of the transition to hydrogen.
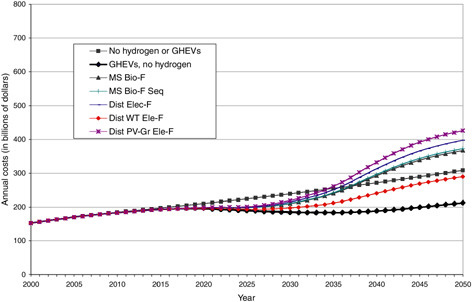
Figures 6-20 and 6-21 provide these total annual costs for the current technologies, for fossil fuels, and for renewables and distributed electrolysis, respectively. Figures 6-22 and 6-23 provide similar data for future technologies for fossil fuels and nuclear thermal energy and for renewables and distributed electrolysis, respectively. In each of Figures 6-20 through 6-23, there is a curve displaying an estimation of the annual fuel cost with only conventional vehicles, with no
GHEVs and no hydrogen vehicles. A second line provides an estimate of total annual fuel costs if GHEVs ultimately capture 100 percent of the market share and hydrogen-fueled vehicles are never introduced. The other lines assume that hydrogen-fueled vehicles capture the market shares over time (at the rates shown in Figure 6-1) and that all of the hydrogen is produced using the particular technology denoted; GHEVs are being phased in and then out of the market using the estimates in Figure 6-1.
Figures 6-20 and 6-21 show the large impact of the penetration of GHEVs into the marketplace. These figures suggest that by 2050, the movement from conventional vehicles to GHEVs alone could reduce the fuel cost by about $75 billion per year, without the introduction of hydrogen-fueled vehicles.
Figures 6-20 and 6-21 show that most of the current technologies would lead to total costs that are higher than the amount drivers would face if GHEVs ultimately dominated the fleet. However, central station coal-based or natural-gas-based hydrogen production could keep total costs almost identical to the costs with GHEVs. Hydrogen based on distributed natural gas would be somewhat more costly. But Figure 6-21 shows that if the system were to be based on distributed electrolysis, biomass, or distributed photovoltaics, the total cost would be substantially greater than would be possible with even hybrid vehicles or conventional vehicles. For example, in 2050 the cost of using these technologies would exceed the cost of using gasoline in GHEVs by more than $400 billion annually.
Figures 6-22 and 6-23 show the great importance of possible future technologies on the total cost of the system. They show that if the possible future technologies are successfully developed and have costs consistent with the committee’s estimates, all but the biomass and the grid-electric or photovoltaic-based electrolysis technologies could be operated at costs less than those that would characterize a system of gasoline-fueled conventional vehicles. The central station coal-based and natural-gas-based technologies would be lower in cost than that of operating a system of gasoline-fueled hybrid electric vehicles. But the technologies based on distributed electrolysis operating either entirely on grid-supplied electricity or partially on photovoltaic-supplied
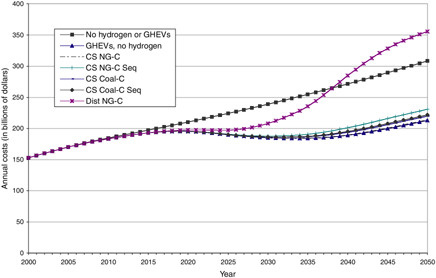
FIGURE 6-20 Estimated total annual fuel costs for automobiles: current hydrogen production technologies (fossil fuels), 2000–2050. Each line for the various hydrogen production technologies assumes that hydrogen-fueled vehicles capture the market shares over time (at the rates shown in Figure 6-1) and that all of the hydrogen is produced using the particular technology denoted (e.g., CS NG-C, CS Coal-C, and so on); gasoline hybrid electric vehicles (GHEVs) are being phased in and then out of the market using the estimates in Figure 6-1. Two other cost curves are provided, one displaying an estimation of the annual fuel cost with only conventional vehicles (no hydrogen or GHEVs). A second line provides an estimate of total annual fuel costs if GHEVs ultimately capture 100 percent of the market share and hydrogen-fueled vehicles are never introduced (GHEVs, no hydrogen). See Table 5-2 in Chapter 5 and discussion in text. NOTE: The cost curve for central station natural gas (CS NG-C) is obscured by the cost curve for GHEVs (GHEVs, no hydrogen), and the cost curve for central station coal with sequestration (CS Coal-C Seq) is partly obscured by the cost curve for coal without sequestration (CS Coal-C).
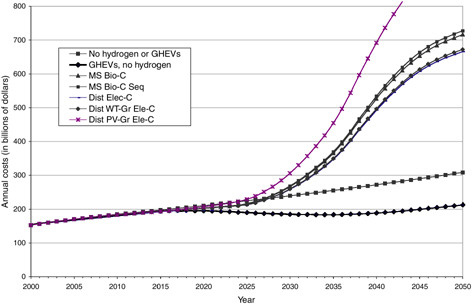
FIGURE 6-21 Estimated total annual fuel costs for light-duty vehicles: current hydrogen production technologies (electrolysis and renewables), 2000–2050. Each line for the various hydrogen production technologies assumes that hydrogen-fueled vehicles capture the market shares over time (at the rates shown in Figure 6-1) and that all of the hydrogen is produced using the particular technology denoted (e.g., MS Bio-C, Dist Elec-C, and so on); gasoline hybrid electric vehicles (GHEVs) are being phased in and then out of the market using the estimates in Figure 6-1. Two other cost curves are provided, one displaying an estimation of the annual fuel cost with only conventional vehicles (“no hydrogen or GHEVs”). A second line provides an estimate of total annual fuel costs if GHEVs ultimately capture 100 percent of the market share and hydrogen-fueled vehicles are never introduced (“GHEVs, no hydrogen”). See Table 5-2 in Chapter 5 and discussion in text. NOTE: The cost curve for distributed electrolysis (Dist Elec-C) is obscured by the cost curve for distributed wind turbine/grid hybrid electrolysis (Dist WT-Gr Ele-C), since these two cost estimates are virtually identical.
electricity have substantially greater costs than those for a system with no hybrids or conventional vehicles. Likewise, the biomass technologies are substantially more costly. Therefore, if research and development are successful and the possible new technologies are developed consistent with the committee’s estimations, and if the challenges associated with fuel cell vehicles themselves are solved, almost all of these technologies might be able to compete successfully with conventional gasoline-fueled vehicles, and most would lead to total costs that are roughly comparable with the costs of operating GHEVs.
The committee expects that, absent hydrogen, GHEVs, not conventional vehicles, will come to dominate the fleet of automobiles; nonetheless, the cost of conventional vehicles provides a useful benchmark. This cost is consistent with current cost per mile driven and growth in vehicle miles influenced by population and income growth. Thus, the conventional vehicle cost is consistent with what Americans have been willing to pay for the fuel costs of driving (itself only a fraction of the total costs of driving). Thus, Figures 6-22 and 6-23 show that if the possible future technologies are successfully developed and have costs consistent with the committee’s estimates, all but the biomass and the grid-electric or photovoltaic-based electrolysis technologies could be operated at costs less than what Americans have been willing to pay for the fuel costs of driving.
SUMMARY
In this chapter, the committee examined its vision of how the energy system might operate if hydrogen-fueled vehicles were broadly adopted in place of gasoline-fueled vehicles. The implications of broad adoption of hydrogen for other purposes, such as electricity generation, are not examined in depth. However, this examination of the transition to hydrogen for light-duty vehicles suggests that the implications for the energy system could be profound, depending on which technologies were adopted. Some technologies could lead to sharp reductions in the amount of CO2 released into the atmosphere, but not all could lead to such environmental
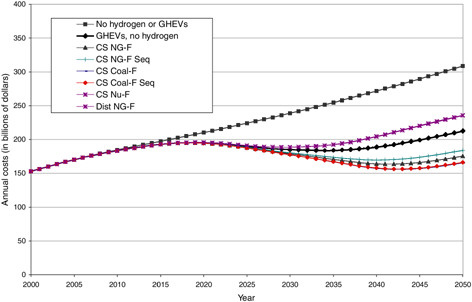
FIGURE 6-22 Estimated total annual fuel costs for light-duty vehicles: possible future hydrogen production technologies (fossil fuels and nuclear energy), 2000–2050. See Table 5-2 in Chapter 5 and discussion in text. NOTE: The cost curve for nuclear thermal energy (CS Nu-F) is obscured by the cost curve for distributed generation from natural gas (Dist NG-F), since these two cost estimates are virtually identical.
improvements. Some technologies could lead to sharp reductions in the amount of energy imported from unstable parts of the world, but not all could lead to such energy security improvements. And some technologies could reduce the cost of driving, but not all could lead to such economic benefits. Thus, the ultimate configuration of a hydrogen supply system will depend crucially not only on the technological successes but also on the trade-offs that individuals and societies are willing to make.
Chapter 8 contains a detailed examination of the various production technologies and of the possible technical advances that might give society and individuals the opportunity to make those choices. The discussion of production technologies in Chapter 8 makes use of the analyses presented in this chapter, together with those of Chapter 5, to make recommendations on the DOE hydrogen program.
FINDINGS
The following findings are drawn from the analysis in this chapter:
Finding 6-1. In the committee’s optimistic vision of a transition to hydrogen for light-duty vehicles, 25 years from now the demand for hydrogen for these vehicles would be about equal to the current production of 9 million tons per year. This is only a small fraction of the 110 million tons required for full replacement of gasoline for light-duty vehicles.
Finding 6-2. A transition to a light-duty fleet of vehicles fueled entirely by hydrogen would dramatically reduce U.S. oil consumption and imports.
Finding 6-3. If coal, renewable energy, or nuclear energy is used to produce hydrogen, a transition to a light-duty fleet of vehicles fueled entirely by hydrogen would reduce total energy imports by the amount of oil consumption displaced. However, if natural gas is used to produce hydrogen, and if, on the margin, natural gas is imported, there would be little if any reduction in total energy imports, because natural gas for hydrogen would displace petroleum for gasoline.
Finding 6-4. The exclusive use of coal to produce hydrogen could significantly increase the scale of this domestic industry. This increase in coal production is unlikely to have any significant impact on coal imports, since all of the coal can reasonably be produced domestically. Oil imports could decrease greatly over time, resulting in a significant net decrease in energy imports.
Finding 6-5. Using current technologies, the land required for biomass to produce all of the hydrogen for fueling light-duty vehicles would be as large as the total amount of cropland in the United States. However, significant improvements in the yield of lands and the efficiency of biomass gasifiers could significantly reduce that figure. But because biomass does not appear to be economically viable even with technology advances, the committee does not expect much if any hydrogen to be produced by biomass gasification.
Finding 6-6. Using only natural gas for the production of the hydrogen for fueling light-duty vehicles would have a great impact on natural gas consumption and imports by the end of the 50-year time horizon in the committee’s analysis, but it would have only an insignificant impact during the next 25 years.
Finding 6-7. Carbon dioxide emissions from the total supply chain of hydrogen-fueled vehicles can be cut significantly only if the hydrogen that is produced is based entirely on renewables, or nuclear energy, or with sequestration of CO2 from fossil fuels. However, emissions of CO2 from all modes of transportation are projected to account for only 37 percent of total U.S. CO2 emissions; emissions from light-duty vehicles are only two-thirds of this 37 percent. Thus, sharply reducing overall CO2 releases would require carbon reductions in other parts of the economy, particularly in electricity production. Technology advances, other than those that make the use of nuclear energy or sequestration economic, would have very little additional impact on carbon releases.
Finding 6-8. Sequestration would involve a massive movement of carbon dioxide. While the United States probably has sufficient geological capacity to sequester these amounts, the sequestration of all the carbon dioxide possible could involve moving twice as much carbon dioxide as the amount of natural gas that the nation anticipates moving.
Finding 6-9. The penetration of hybrids into the marketplace, even absent hydrogen-fueled vehicles, could reduce fuel costs by tens of billions of dollars per year in the United States. Most current hydrogen production technologies would lead to a total driving cost higher than the total cost if hybrid electric vehicles ultimately dominated the fleet, but central station coal-based or natural-gas-based hydrogen production could keep total costs similar to those with hybrid electric vehicles.
Finding 6-10. With the possible future technology advances, all but biomass and grid-electric or photovoltaic-based electrolysis technologies could be operated at costs less than those that Americans have been willing to pay in fuel costs for driving gasoline-fueled conventional vehicles.
Finding 6-11. Although a transition to hydrogen could greatly transform the U.S. energy system in the long run, the impacts on oil imports and CO2 emissions are likely to be minor during the next 25 years. Thus, hydrogen—although it could transform the energy system in the long run—does not represent a short-run solution to any of the nation’s energy problems.


