
Appendix C
Assessing the Human Resource Need for Expanding HIV/AIDS Services in the 15 PEPFAR Focus Countries
Gilbert Kombe, Xingzhu Liu, Nancy Pielemeier, Catherine Decker
Abt Associates
BACKGROUND
There is broad recognition that human capacity is a critical constraint in scaling up HIV/AIDS services in low-resource countries. Difficulties in producing and retaining a sufficient number of health workers is not a new problem, but the sheer magnitude of the HIV/AIDS epidemic and its impact on human resources (HR)1 through an array of supply and demand-side factors has made the problem worse (Smith, 2004). For example, in sub-Saharan Africa, both budgetary stringency and fiscal economic crises have reduced the governments’ ability to attract and train health workers, as well as to retain them and maintain their morale. Studies indicate that the numbers of trained health workers in many low resource areas remain insufficient and currently many such settings are experiencing serious scarcities of almost all cadres due to economic and fiscal difficulties (USAID, 2003). According to the World Health Organization (WHO), about 100,000 health workers globally need to be trained in order to reach the target to deliver antiretroviral therapy (ART) to 3 million people. These health workers include those involved in managing and delivering antiretroviral treatment services, those working on testing and counseling, and community treatment supporters assisting people living with HIV/AIDS who are receiving medication (WHO, 2003).
There are many reasons why the United States Government (USG) should invest in understanding the magnitude and complexity of HR issues in the 15 focus countries. First, these countries account for more than 50 percent of all global infections and nearly 75 percent of all HIV infections in Sub-Saharan Africa. It is estimated that without a significantly expanded response to the epidemic, more people will become infected in the next few years. Second, there is compelling evidence from published and unpublished reports that the 15 countries studied have a critical shortage of human resource stock. The current ratio of key health workers to population in each country is not encouraging. According to the latest available information, 7 of the 15 countries have a ratio less than one doctor to 5,000 and 6 of them have a ratio below one nurse to 2,000 inhabitants as shown in Table C-1. These ratios are well below the WHO recommended minimum standard of one doctor per 5,000 inhabitants and one nurse per 500 population. Third, understanding the number of available health care workers, their skill mix, training needs, and the distribution of such personnel is essential in planning a USG response to fill in HR gaps through allocation of appropriate resources. This information can also be of critical value to countries themselves in developing appropriate strategies to address the HR problems to improve their overall health systems. As the President Emergency Plan for AIDS Relief (PEPFAR) countries begin to scale up HIV/AIDS activities, increased attention should focus on identifying and addressing these HR constraints.
The objective of this paper is to provide broad estimates on the quantity and mix of human resources needed to deliver full HIV/AIDS services in PEPFAR countries. The paper is organized in the following manner. First, the paper presents the methodological approach used in the analysis. Second, it presents specific findings on the current and projected future HR stocks, projects the HR needs to provide full HIV/AIDS services2 under PEPFAR targets, and identifies the gaps. Finally, it recommends strategies to fill these HR gaps, discusses policy implications and the way forward.
METHODOLOGICAL APPROACH
A comprehensive desktop review of published and unpublished documents was conducted to obtain information on human resources in the 15
TABLE C-1 Basic HIV/AIDS Indices and Human Resource Status in the 15 PEPFAR Focus Countries
|
Country |
Population (year) |
|
Population with HIV (15–49)b |
HIV Prevalence (15–49) %b |
|
Botswana |
1,646,640 |
(1999)a |
270,000 |
37.3 |
|
Cote d’Ivoire |
14,685,000 |
(1996)d |
530,000 |
7.0 |
|
Ethiopia |
68,613,470 |
(2003)a |
1,400,000 |
4.4 |
|
Kenya |
27,390,000 |
(1995)d |
1,100,000 |
6.7 |
|
Mozambique |
17,691,000 |
(2000)a |
1,200,000 |
12.2 |
|
Namibia |
1,750,000 |
(1997)d |
200,000 |
21.3 |
|
Nigeria |
126,910,000 |
(2000)a |
3,300,000 |
5.4 |
|
Rwanda |
8,163,000 |
(2002)a |
230,000 |
5.1 |
|
South Africa |
44,812,420 |
(2001)a |
5,100,000 |
21.5 |
|
Tanzania |
35,181,300 |
(2002)a |
1,500,000 |
8.8 |
|
Uganda |
24,600,000 |
(2002)a |
450,000 |
4.1 |
|
Zambia |
10,402,960 |
(2003)a |
830,000 |
24.6 |
|
Haiti |
7,797,000 |
(1998)d |
260,000 |
5.6 |
|
Guyana |
759,000 |
(2000)a |
11,000 |
2.5 |
|
Vietnam |
79,492,930 |
(2001)a |
200,000 |
0.4 |
|
aWorld Development Indicators Database, World Bank (http://devdata.worldbank.org/dataquery/). b2004 Report on the Global AIDS Epidemic, UNAIDS. |
||||
PEPFAR focus countries. The latest available data were collected from various databases and documents from sources such as UNAIDS, WHO, World Bank, etc. Information was also supplemented by country assessments conducted by the Partners for Health Reformplus Project and other collaborating agencies. The WHO online Global Atlas of the Health Workforce was the primary source of data on the current HR stock for each country by year and by profession.3
In making HR projections, a number of key assumptions were applied. We discuss five assumptions that have the most impact on human resource
|
Total Number of Doctors (year)c |
Doctor per Population Ratio |
Total Number of Nurses (year)c |
Nurse per Population Ratio |
||
|
488 |
(1999) |
3,374 |
4090 |
(1999) |
403 |
|
1,322 |
(1996) |
11,108 |
6,785 |
(1996) |
2,164 |
|
1,162 |
(2003) |
59,048 |
14,123 |
(2003) |
4,858 |
|
3,616 |
(1995) |
7,575 |
24,679 |
(1995) |
1,110 |
|
435 |
(2000) |
40,669 |
5,078 |
(2000) |
3,484 |
|
516 |
(1997) |
3,392 |
4,978 |
(1997) |
352 |
|
30,885 |
(2000) |
4,109 |
154,000 |
(2003) |
824 |
|
155 |
(2002) |
52,665 |
1,745 |
(2002) |
4,678 |
|
30,740 |
(2001) |
1,458 |
172,338 |
(2001) |
260 |
|
822 |
(2002) |
42,800 |
13,292 |
(2002) |
2,647 |
|
1,175 |
(2002) |
20,936 |
2,200 |
(2002) |
11,182 |
|
756 |
(2003) |
13,761 |
10,558 |
(2003) |
985 |
|
1,949 |
(1998) |
4,001 |
834 |
(1998) |
9,349 |
|
366 |
(2000) |
2,074 |
1,738 |
(2000) |
437 |
|
42,327 |
(2001) |
1,878 |
59,201 |
(2001) |
1,343 |
|
cAll statistics come from WHO online Global Atlas of the Health Workforce (www.who.int/GlobalAtlas/home.asp) except data on Ethiopia (“The Human and Financial Resource Requirements for Scaling Up HIV/AIDS Services in Ethiopia.” Kombe et al. February 2005. PHRplus), (“Health Manpower Situation in Nigeria: Nigeria, 1995-2000.” Health Manpower Registration Councils/Boards) and Zambia. d“Human Resources for Health: Overcoming the Crisis.” Joint Learning Initiative, 2004. |
|||||
needs for providing full HIV/AIDS services. First, with regard to ART, individual country targets for ART were estimated by determining country weights based on the number of infected adults in the individual country divided by the total number of infected adults in all 15 countries. This number was then multiplied by 2 million to obtain the individual country target for ART. Second, we assumed that all patients not receiving ART would need OI care. Therefore, OI targets were estimated by subtracting the ART target from the estimated number of patients eligible for ART.
Third, it is assumed that VCT and PMTCT will be gateways to HAART in a manner characterized by certain key ratios. It is assumed here that the diagnosis rate of HIV-positive individuals is twice the country-specific prevalence rate (to account for self-selection). Also, it is assumed that 20 percent of those identified as HIV positive individuals will be clinically eligible as suggested under the PEPFAR Initiative. Fourth, we estimated the HR need by multiplying the number of encounters per patient by the time needed per encounter by the size of target population. The total time is then converted into person-year by considering the number of working days per
year (180), and the number of effective working hours (6),4 and the average share of provider’s time used for HIV services (50 percent).5 We then multiply the number of person-years by (a) the number of people in need of HIV/AIDS services and (b) the PEPFAR target population.
The fifth assumption deals with estimating projected HR growth over the next 5 years. The annual growth rate of the HR stock of each country over the next 5 years is assumed to be equivalent to the annual growth rate of the past 5 years. The aggregate growth rate is the weighted average of the growth rates of individual countries—estimated at 4.5 percent.
MAIN FINDINGS
Five main findings can be drawn from this paper. First, as shown in Table C-2, the total human resource stock available in 2004 is estimated at 566,580. This number does not include community health workers, counselors, and social workers due to lack of data. Nurses and midwives6 make up the majority (74 percent) followed by doctors (21 percent), and pharmacists (5 percent). Applying the 2004 baseline data and assuming that existing conditions are not going to change, the projected growth in the total number of health workers will increase from 566,580 in 2004 to 592,076 in 2008 at an annual rate of approximately 4.5 percent. This increase is primarily driven by Nigeria, South Africa, and Vietnam, all countries with large populations and high personnel totals. Meanwhile, countries like Tanzania and Uganda will see a decrease in the total HR stock. The remaining 10 PEPFAR countries will have a minimal growth in the next 4 years.
Second, to provide full HIV/AIDS services to all eligible patients, the total human resource need is about 78,360 in 2004, rising to 95,246 in 2008. To reach PEPFAR targets, the total human resource need is about 11,232 in 2004, but by 2008, this figure will increase to 56,146 due to the planned scale-up of PEPFAR funded programs (see Table C-3 for country specific data). It must be noted that PEPFAR needs are a subset of the total number of health workers to provide full HIV/AID services.
Third, the question of how many health workers have been trained in the 15 PEPFAR countries has been a subject of debate by many health planners. It is estimated that on average 10 percent of the health workers
TABLE C-2 Current and Projected Human Resource Stock in the 15 PEPFAR Focus Countries
|
Gross Human Resource Stock by Type |
Available in: |
||||
|
2004 |
2005 |
2006 |
2007 |
2008 |
|
|
Doctors |
117,523 |
123,230 |
129,265 |
135,649 |
142,403 |
|
Nurses |
419,906 |
424,247 |
429,246 |
434,864 |
441,071 |
|
Pharmacists |
29,151 |
29,930 |
30,755 |
31,604 |
32,484 |
|
Total |
566,580 |
577,407 |
589,266 |
602,117 |
615,958 |
|
Estimated number of health workers trained in HIV care |
56, 658 |
57,245 |
57,865 |
58,518 |
59,208 |
including doctors, nurses and pharmacists have already been trained in full HIV/AIDS service provision in each of the countries. Based on this assumption, the number of available staff trained to provide HIV/AIDS services is 10 percent of the figures shown in Table C-2, increasing from 56,658 to 59,208 between 2004 and 2008 respectively. There has also been a lot of debate on how many health workers are needed to reach the PEPFAR goals of 2 million people on ART, preventing 7 million infections, and providing care to 10 million orphans and vulnerable children. Under the PEPFAR initiative, in 2005, the total number of trained health workers needed to reach PEPFAR targets is approximately 4,431.7 This number will almost double in 2006 to roughly 8,676.
Fourth, we explore the issue of “human resource gap” by comparing the trained health workers with estimated HR needs over the next 4 years. The HR gap is an indication of the severity of human resources shortages. To put this into context, the magnitude of HR Gap is illustrated for doctors, nurses and pharmacists. As shown in Figure C-1, in 2004 the number of trained doctors falls well short of those needed to treat all patients eligible for HIV services.
The gap is widest for pharmacists, followed by doctors, with nurses showing a gap of only 10 percent (having 41,991 trained out of 46,635 needed). In all three cases the gap widens as time goes by, resulting in insufficient numbers of trained doctors and pharmacists for the provision of PEPFAR services in 2008. This human resource gap exists for both
TABLE C-3 Estimated Total of Key Health Workers Needed to Deliver Health Services in the 15 PEPFAR Focus Countries
|
|
|
2004 |
|
|
Country |
Staff Type |
Available |
PEPFAR Needed |
|
Botswana |
Doctors |
488 |
66 |
|
Nurses |
4,090 |
66 |
|
|
Pharmacists |
160 |
35 |
|
|
Cote d’Ivoire |
Doctors |
1,322 |
89 |
|
Nurses |
6,785 |
200 |
|
|
Pharmacists |
378 |
46 |
|
|
Ethiopia |
Doctors |
1,971 |
232 |
|
Nurses |
4,160 |
703 |
|
|
Pharmacists |
95 |
118 |
|
|
Kenya |
Doctors |
3,616 |
215 |
|
Nurses |
24,679 |
419 |
|
|
Pharmacists |
1,370 |
112 |
|
|
Mozambique |
Doctors |
435 |
210 |
|
Nurses |
5,078 |
433 |
|
|
Pharmacists |
419 |
108 |
|
|
Namibia |
Doctors |
516 |
34 |
|
Nurses |
4,978 |
44 |
|
|
Pharmacists |
149 |
17 |
|
|
Nigeria |
Doctors |
30,885 |
580 |
|
Nurses |
108,230 |
1,537 |
|
|
Pharmacists |
8,642 |
300 |
|
|
Rwanda |
Doctors |
155 |
41 |
|
Nurses |
1,745 |
91 |
|
|
Pharmacists |
11 |
21 |
|
|
South |
Africa Doctors |
30,740 |
872 |
|
Nurses |
172,338 |
1,371 |
|
|
Pharmacists |
10,742 |
453 |
|
|
Tanzania |
Doctors |
822 |
269 |
|
Nurses |
13,292 |
540 |
|
|
Pharmacists |
365 |
140 |
|
|
Uganda |
Doctors |
1,175 |
103 |
|
Nurses |
2,200 |
154 |
|
|
Pharmacists |
125 |
55 |
|
|
2006 |
2008 |
||
|
Available |
PEPFAR Needed |
Available |
PEPFAR Needed |
|
551 |
197 |
622 |
329 |
|
4,451 |
197 |
4,844 |
329 |
|
173 |
106 |
188 |
177 |
|
1,444 |
268 |
1,577 |
447 |
|
7,409 |
601 |
8,091 |
1,002 |
|
413 |
138 |
451 |
230 |
|
2,167 |
695 |
2,383 |
1,159 |
|
4,176 |
2,109 |
4,192 |
3,516 |
|
106 |
354 |
119 |
589 |
|
3,949 |
646 |
4,312 |
1,076 |
|
26,950 |
1,256 |
29,430 |
2,094 |
|
1,496 |
337 |
1,634 |
562 |
|
529 |
629 |
643 |
1,048 |
|
5,162 |
1,298 |
5,247 |
2,163 |
|
434 |
323 |
449 |
538 |
|
563 |
102 |
615 |
169 |
|
5,436 |
132 |
5,936 |
219 |
|
163 |
52 |
178 |
87 |
|
35,911 |
1,739 |
41,755 |
2,898 |
|
108,230 |
4,610 |
108,230 |
7,684 |
|
8,642 |
599 |
8,642 |
1,498 |
|
169 |
123 |
185 |
204 |
|
1,906 |
274 |
2,081 |
457 |
|
12 |
63 |
13 |
105 |
|
33,556 |
2,616 |
36,630 |
4,361 |
|
172,338 |
4,112 |
172,338 |
6,853 |
|
11,189 |
1,358 |
11,655 |
2,264 |
|
727 |
808 |
643 |
1,347 |
|
9,696 |
1,619 |
7,073 |
2,698 |
|
323 |
419 |
285 |
698 |
|
1,283 |
310 |
1,401 |
517 |
|
1,514 |
461 |
1,043 |
768 |
|
131 |
165 |
143 |
275 |
|
|
|
2004 |
|
|
Country |
Staff Type |
Available |
PEPFAR Needed |
|
Zambia |
Doctors |
756 |
152 |
|
Nurses |
10,558 |
242 |
|
|
Pharmacists |
75 |
79 |
|
|
Haiti |
Doctors |
1,949 |
44 |
|
Nurses |
834 |
109 |
|
|
Pharmacists |
557 |
23 |
|
|
Guyana |
Doctors |
366 |
2 |
|
Nurses |
1,738 |
6 |
|
|
Pharmacists |
86 |
1 |
|
|
Vietnam |
Doctors |
42,327 |
31 |
|
Nurses |
59,201 |
853 |
|
|
Pharmacists |
5,977 |
16 |
|
reaching all those in need and reaching the PEPFAR targets. The current trained HR stock is not enough to provide full HIV/AIDS services to all those in need.
To further illustrate this HR gap, we analyzed the gap for doctors across the 15 countries. As shown in Box C-1, the 15 countries were divided into six categories according to the adult HIV prevalence rate (for those aged 15–49) and doctor gap (total need for doctors divided by total stock of doctors) multiplied by 100 to give percentage). The HR gap was divided into three groups: severe, moderate and low. Prevalence was divided into high (greater than 6 percent) and low (less than 6 percent).
An initial review of the HR gap for doctors points towards an association between the gap of a country and its HIV prevalence rate. First, none of the countries with high HR gaps have low HIV prevalence rates. Second, all of the low prevalence countries are either low or medium HR gap countries.
In general, the estimated HR gap in many countries will increase along with the scaling-up of PEPFAR programs year by year. Countries such as Cote D’Ivoire, Vietnam, and Guyana have only a modest doctor gap, while Tanzania, Mozambique, Botswana, and Zambia have large gaps. It is vital to point out that in the latter countries, the provision of HIV/AIDS services will absorb more than 100 percent of the available stock because the total doctor need is larger than the available stock. Namibia, Ethiopia, Rwanda, Uganda and Kenya have medium gaps and are expected to absorb over 50
|
2006 |
2008 |
||
|
Available |
PEPFAR Needed |
Available |
PEPFAR Needed |
|
783 |
455 |
810 |
758 |
|
10,558 |
726 |
10,558 |
1,210 |
|
75 |
236 |
75 |
393 |
|
2,128 |
133 |
2,224 |
222 |
|
911 |
327 |
952 |
545 |
|
608 |
69 |
636 |
115 |
|
400 |
6 |
436 |
10 |
|
1,898 |
17 |
2,073 |
29 |
|
94 |
3 |
103 |
5 |
|
45,105 |
92 |
48,066 |
153 |
|
59,201 |
2,560 |
59,201 |
4,266 |
|
6,096 |
47 |
6,217 |
79 |
percent of the doctor stock for the provision of HIV/AIDS services. In Cote d’Ivoire and South Africa where the gap is low and the prevalence rate is high the provision of HIV/AIDS services will utilize less than 50 percent of the HR stock because they have a large HR stock. Finally, countries with a low HR gap and a low prevalence rate, such as Guyana, Haiti, Nigeria, and Vietnam will also absorb less than 50 percent of HR stock for the provision of HIV/AIDS services.
Finally, the projected gaps in trained HIV/AIDS personnel, in particular for doctors, lead to the fifth finding. Countries need to mobilize a large number of master trainers to train health workers on HIV/AIDS care. The need for master trainers is estimated in 2 parts. First, we consider the need to train enough trainees to provide full HIV/AIDS services to all eligible patients. In 2005, the 15 countries will need approximately 3,067 master trainers.8 These trainers will include 1,141 doctors, 1,209 nurses, and 717 pharmacists, as shown in Table C-4. Second, we focus on the master trainers needed under the PEPFAR Initiative. Our analysis indicates that in 2005, the total need for master trainers for PEPFAR is 354,9 which increases to 1629 (580 doctors, 631 nurses, and 418 pharmacists) by 2008.
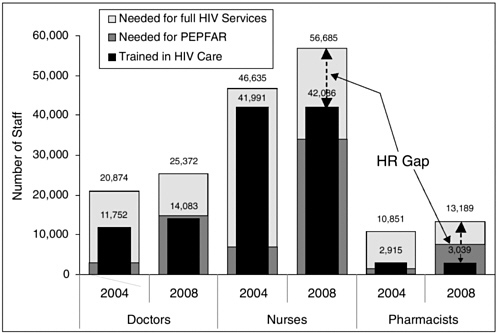
FIGURE C-1 Human resource gap for doctors, nurses (including midwives), and pharmacists.
SENSITIVITY ANALYSIS
A sensitivity analysis was performed to determine the extent to which the human resources vary along with the variation in the assumed percentage of health worker’s time used for HIV/AIDS services. The analysis was performed by changing the percentage share between a minimum of 25 percent and a maximum of 75 percent, with 50 percent as the average.10 For example, if the percentage share of providers’ time used for HIV/AIDS services decreases from 50 percent to 25 percent, the estimated HR gap (PEPFAR HR need minus HIV/AIDS trained HR) increases from 20,361 to 63,725, more than triple as shown in Table C-5.
LIMITATIONS OF THE STUDY
This review and analysis has several limitations. First, the availability and reliability of the HR data was not consistent across the 15 PEPFAR
|
BOX C-1
|
||||||||||||||||||
countries. It is not known whether all the data collected from the WHO online Global Atlas of the Health Workforce includes the private sector providers. Health personnel such as laboratory technicians and counselors are excluded from this analysis due to the lack of data.
Second, in some countries like Guyana and Rwanda, only 1 point of data was available, reducing the power of projection. Similarly, data on the numbers of deaths, retirements, emigrants, immigrants, staff turnovers, new graduates, etc. needed to estimate the decrease or increase of stock were not available, leading to the assumption that the change in the next 4 years will follow the pattern of the past 5 years (which may not be accurate).
Third, this lack of available data and time constraint restricted the opportunity for a detailed country level analysis. Therefore, it is extremely important to point out that all analyses are considered to be approximations and can only be used broadly for the development of an overall human resource capacity building strategy, rather than for country level planning. Fourth, key assumptions (e.g., time share between HIV/AIDS with non-HIV/AIDS services) have a significant impact on HR gap estimates. Finally, it must also be noted that the analysis is restricted to na-
TABLE C-4 Estimated Need for Master Trainers in the 15 PEPFAR Focus Countries
|
|
2004 |
2005 |
2006 |
2007 |
2008 |
|
Need for Master Trainers to Provide full HIV/AIDS Services to all Eligible Patients |
|||||
|
Doctors |
1,058 |
1,141 |
1,227 |
1,318 |
1,413 |
|
Nurses |
1,082 |
1,209 |
1,342 |
1,482 |
1,631 |
|
Pharmacists |
674 |
717 |
762 |
809 |
859 |
|
Total |
2,814 |
3,067 |
3,331 |
3,609 |
3,903 |
|
Need for Master Trainers to Reach PEPFAR Targets |
|||||
|
Doctors |
41 |
136 |
249 |
395 |
580 |
|
Nurses |
25 |
126 |
269 |
441 |
631 |
|
Pharmacists |
35 |
92 |
177 |
297 |
418 |
|
Total |
101 |
354 |
695 |
1,133 |
1,629 |
TABLE C-5 Sensitivity Analysis of Human Resource Gap in the 15 PEPFAR Focus Countries in 2009
|
|
25% of Health Worker’s Time Used for HIV Services |
50% of Health Worker’s Time Used for HIV Services |
75% of Health Worker’s Time Used for HIV Services |
|
Number of Trained Health Workers Needed to Provide PEPFAR Services |
|||
|
Doctors |
21,591 |
7,244 |
3,578 |
|
Nurses |
29,376 |
7,893 |
4,033 |
|
Pharmacists |
12,758 |
5,224 |
2,713 |
|
Total |
63,725 |
20,361 |
10,324 |
|
Number of Trained Health Workers Needed to Provide Full HIV/AIDS Services to all in Need |
|||
|
Doctors |
42,726 |
17,662 |
9,325 |
|
Nurses |
71,452 |
20,385 |
9,477 |
|
Pharmacists |
23,798 |
10,740 |
6,400 |
|
Total |
137,976 |
48,787 |
25,202 |
tional level because of data limitations on distribution of health workers between rural and urban settings.
DISCUSSION
Policy Implications of the Findings
Numerous studies have identified the major policy and program priorities needed to address the human resource gap in low resource countries, particularly those highly impacted by HIV/AIDS (JLI, 2004). The solutions focus on strategies to improve recruitment, retraining, retention and redeployment of health personnel. This analysis focuses primarily on the first 2 solutions: recruitment, or increasing the total stock of human resources, and retraining of existing personnel to deliver priority HIV/AIDS services. This is not meant to imply that retention and redeployment, or the reengineering of tasks among various categories of health personnel, are not critical to address the AIDS epidemic, as well as to address the overall crisis in human resources for health (HRH). However, the scope of this study and the limitations of available data limit our ability to draw firm conclusions on these strategic options beyond endorsing others’ calls to identify strategies to improve health worker salaries and incentives to increase retention, and to identify alternative personnel mixes to provide HIV/AIDS services.
The data limitations faced in this study do raise an issue of first order priority, noted also by similar studies (JLI, 2004; Martineau, 2004), that there is an urgent need for investment in databases and monitoring systems for human resources for health. The data available are insufficient, as illustrated by the lack of information on key categories of personnel, such as laboratory technicians and counselors, and therefore likely undercounting the total stock. It is highly likely that the countries that appear from this analysis to have the lowest human resource gap are precisely the countries that are losing the highest numbers of health personnel to international migration.
Notwithstanding the limitations of the data on which this analysis is based, there are a number of emerging implications for human resource policy development, which are likely to persist even when more precise human resource data become available. This analysis pinpoints the variation in the human resource gap across PEPFAR countries, based on HIV prevalence level, as well as on the relative scarcity of HRH. The program priorities vary slightly according to classification of countries within these dimensions; however, all PEPFAR countries need to focus on training of existing personnel, and most, if not all, PEPFAR countries need to focus on retaining and expanding the total HRH stock.
Conclusion
It is apparent that the HRH gap is a major constraint for both providing full coverage for HIV/AIDS services and reaching PEPFAR targets. The fact that many countries have a smaller stock of doctors and pharmacists than nurses calls for targeted strategies to address the shortage. Efforts should also be made to continue training large numbers of nurses and midwives to keep pace with migration and to fill the huge demand for nurses. If HRH capacity strategies are not implemented at the early stages of the PEPFAR program, the constraint will be more severe and plans to scale up will prove more difficult. Countries and development partners should define the role of donor assistance in training of trainers, and determine under what circumstances donors should be involved in direct training of staff and direct delivery of care in the short, medium, and long term, in order to meet both short-term PEPFAR goals, as well as longer term goals to provide sustained services to the affected population.
Second, each country should develop a national human resource for health plan. As recommended by the JLI, these plans should guide enhanced investments in human resources through appropriate education, deployment, and retention.
Third, development partners should work together under the guidance of the host government and within the country’s national human resource plan to support both basic training of additional recruits, as well as in-service training of existing personnel, to meet the growing requirements for HRH for HIV/AIDS services.
The Way Forward
It is clear from the analysis that the way forward should focus on building innovative and sustainable strategies to address HRH in the 15 countries. Governments and donors should design and implement strategies for training the existing human resources for HIV/AIDS services. They should invest in conducting country specific HRH assessments and develop HRH plans according to specific country need. Furthermore, they should improve databases and monitoring systems for human resource for health.
REFERENCES
Health Manpower Registration Councils/Boards. 2001. Health Manpower Situation in Nigeria: 1995–2000.
Huddart J, Lyons JV, Furth R. 2004. The Zambia HIV/AIDS Workforce Study: Preparing for Scale-Up. [Online]. Available: http://www.qaproject.org/pubs/PDFs/ORMZambiaWorkforcel.pdf [accessed February 8, 2005].
JLI (Joint Learning Initiative). 2004. Human Resources for Health: Overcoming the Crisis. [Online]. http://www.globalhealthtrust.org/report/Human_Resources_for_Health.pdf [accessed February 9, 2005].
Kombe G, Smith O. 2003. The Costs of Anti-Retroviral Treatment in Zambia. [Online]. Available: http://www.phrplus.org/Pubs/Tech029_fin.pdf [accessed February 8, 2005].
Kombe G, Galaty D, Gadhia R, Decker C. 2005. The Human and Financial Resource Requirements for Scaling Up HIV/AIDS Services in Ethiopia. [Online]. Available: http://www.phrplus.org/Pubs/Tech059_fin.pdf [accessed February 18, 2005].
Kombe G, Galaty D, Nwagbara C. 2004. Scaling Up Antiretroviral Treatment in the Public Sector in Nigeria: A Comprehensive Analysis of Resource Requirements. [Online]. Available: http://www.phrplus.org/Pubs/Tech037_fin.pdf [accessed February 8, 2005].
Martineau T, 2004. Staffing Options for Emergency HIV/AIDS programs. Unpublished draft.
Smith O. 2004. Human resource requirements for scaling up antiretroviral therapy in low resource countries. In Scaling Up Treatment in the Global AIDS Pandemic. Washington, DC: The National Academies Press. Pp 292–308.
UNAIDS. 2004. 2004 Report on the Global AIDS Epidemic. [Online]. Available: http://www.unaids.org/bangkok2004/report_pdf.html [accessed February 7, 2004].
USAID (U.S. Agency for International Development). 2003. The Health Sector Human Resource Crisis in Africa: An Issues Paper. [Online]. Available: http://www.aed.org/ToolsandPublications/upload/healthsector.pdf [accessed February 18, 2005].
WHO (World Health Organization). 2003. Human Capacity-Building Plan for Scaling Up HIV/AIDS Treatment. Geneva, Switzerland: World Health Organization.
WHO. 2004. WHO Online Global Atlas for Health Workers [Online]. Available: www.who.int/GlobalAtlas/home.asp [accessed February 7, 2005].
World Bank. 2004. World Development Indicators Database. [Online]. Available: http://www.worldbank.org/data/dataquery.html [accessed February 7, 2005].


