
5
Results of Applying the Methodology
The committee sought to test its proposed benefits evaluation framework on continuing programs in order to identify key methodological issues. The committee chose three U.S. Department of Energy (DOE) research and development (R&D) activities—advanced lighting, carbon sequestration, and fuel cells—to which the framework could be applied. For this purpose, the National Research Council (NRC) formed three panels with the appropriate expertise. The charge to the panels was to complete the preliminary prospective benefits matrix using the guidance from the committee set forth in Chapter 3 and Appendix E. The panels had considerable flexibility in determining how to fulfill this charge. This chapter summarizes the panels’ findings on the methodology and process.
Although a member of the committee chaired each panel, the full committee did not participate in the work of the panels. Rather, the committee reviewed the findings of the panels, using this review as the empirical basis for developing the methodology and process that it recommends in Chapters 3 and 4 of this report. For this reason, the committee’s recommendations may not reflect the specific suggestions or findings of an individual panel.
The committee wishes to emphasize that:
-
The panels did not apply the methodology recommended in Chapters 3 and 4. The methodology recommended there will be applied in Phase Two of this project.
-
The panel reports were developed for the sole purpose of methodology development. As a result, they are not complete or systematic evaluations of program benefits and should not be interpreted as such.
The statements of task for the three panels were nearly identical. Here is the statement of task for the Panel on Benefits of Lighting R&D for the Committee on Prospective Benefits of DOE’s Energy Efficiency and Fossil Energy R&D Programs:
1. The members of the panel shall familiarize themselves with the relevant DOE programs, including the expected progress of the technologies under development, the markets they are intended to enter, and private sector R&D programs whether or not they cooperate with DOE. They will also examine any estimation of benefits provided by DOE.
2. Then the panel will estimate the probability of technological and economic success of the various lighting R&D projects under current funding projections. Insofar as possible, it shall also examine alternative funding levels and resulting changes in the rates of progress and the probability of success.
3. The panel shall also estimate how credit should be apportioned between DOE and the private sector’s R&D programs, assuming the new technologies are developed and marketed successfully. This exercise should consider the impact of the DOE contributions on when the technologies enter the market as well as the probability of overall success. Insofar as possible, the panel shall perform this exercise for the alternative funding levels considered in Task 2.
4. The panel will then apply the committee’s methodology to estimate the value of the benefits of DOE’s lighting R&D programs under several scenarios to be provided by the committee, including economic, environmental, and national security benefits. Environmental and national security benefits may be left in physical units (e.g., tons of emissions or barrels of oil imported) or just described if the economic values have not been determined by the committee. Insofar as possible, the panel shall perform this exercise for the alternative funding levels considered in Task 2.
5. The panel will prepare a report for the committee detailing its analyses, supporting the conclusions, and commenting on the practicality and adequacy of the methodology used to estimate benefits.
Each panel conducted two meetings at different times in Washington, D.C., during July, August, and September 2004. These meetings featured open information-gathering sessions with DOE headquarters staff on R&D programs and
their anticipated benefits. The three panels based their separate reports on information gleaned from these meetings, documents supplied by DOE, and the panel’s own knowledge of the respective subject matters. The complete panel reports can be found in Appendixes F, G, and H, along with biographies of the panel members.
The following sections summarize the three panel reports. The chapter concludes with a discussion of the key points gleaned from the panels’ experience in applying the methodology.
THE LIGHTING PANEL
Objectives of the Study
The Panel on Benefits of Advanced Lighting R&D was convened to test the committee’s methodology for estimating benefits that might be provided by current R&D programs. The panel reviewed the lighting program at DOE as part of the test, but the results presented here are not a program evaluation. Rather, they are focused on the methodology. The panel was drawn from industry (conventional and solid state lighting), academia, state government, and the energy efficiency community (see Appendix F).
Lighting has long been a prime target for R&D at DOE because of its high energy demand. Reducing the electricity needed for lighting should provide economic benefits, decrease emissions of carbon and other pollutants from electric generating stations, and reduce demand for primary energy. The lighting program’s main focus is on solid state lighting (SSL), including both light-emitting diodes (LEDs) and organic light-emitting diodes (OLEDs). LEDs have already been commercialized for some applications but are not yet competitive for general illumination, where the big energy savings would be expected to occur. Because the panel determined that large benefits would be realized under the Reference Case, it did not analyze the other scenarios, which would have shown even larger benefits.
Calculating Expected Benefits
The lighting panel considered three levels of technological success:
-
DOE’s goal, a lamp efficacy of 150 lumens per watt (lpw), is attained by about 2015. Goals involving cost, reliability, and light quality will be almost as important in assuring commercial success.
-
DOE falls short of its goal, but SSL R&D improves lamp efficacy to 125 lpw by 2015.
-
Research progress is slow and efficacy rises to only 100 lpw by 2015, which is close to the efficacy of today’s linear fluorescent lamps but much higher than that of incandescent bulbs.
Gross benefits (the economic, environmental, and national security benefits that accrue from the use of improved lighting technology) are estimated by DOE using the National Energy Modeling System (NEMS),1 which projects out to 2025, and MARKAL,2 which extends the analysis to 2050. Modeling analysis assumed that the SSL program would meet its goals and that SSL technology would compete in the marketplace for new and replacement applications.
Two sets of analyses were provided by DOE: the full budget ($50 million per year for 10 years) program, which leads to 142 lpw in 2015, and a reduced funding program ($25 million per year for 20 years), which results in lamps of 102 lpw in 2015 and 146 lpw in 2025 (the funding levels are discussed in Appendix F). The DOE analyses do not correspond exactly to the goals estimated by the panel because the work was done in parallel, but the first analysis is close to the 150 lpw goal considered by the panel and the second to the 100 lpw result.
The lighting panel did not accept DOE’s assumptions on competing technology, which ignored much research on SSL in other parts of the world and continued improvements in traditional (non-solid-state) lighting. Instead it applied a 5-year delay to the lower budget analysis and used that as a surrogate for the baseline, zero-DOE budget. DOE also ran this analysis and calculated benefits relative to this surrogate. The 5-year rule had been recommended by the NRC Committee on Benefits of DOE R&D on Energy Efficiency and Fossil Energy R&D (see NRC, 2001) for use in the absence of better information. Because the experience with the panels convinced the committee that the 5-year rule is often inadequate for prospective evaluation, it recommends a more elaborate methodology in this report.
Probability Assessment
Each lighting panel member estimated the probability of achieving the technical goals at each level of success and each budget level, as shown in Figure 5-1, with the high and low probabilities surrounding each average. In addition, the panel estimated the probability that the market penetration projected by NEMS can be achieved or exceeded if the SSL technical goals are met at 70 percent.
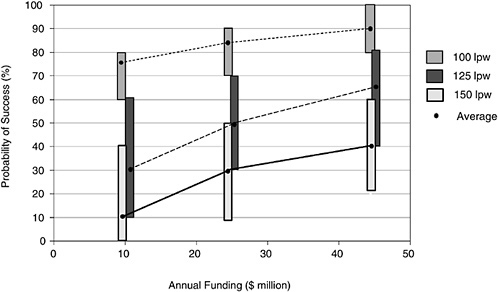
FIGURE 5-1 Probability of technical success.
Probability estimation was done in two stages at the second meeting. The panel members discussed the technologies involved, and their opinions about the probability of success were recorded. Later, a ballot was distributed, and voting was private. This process worked well, allowing panel members to estimate as knowledgeably and consistently as possible. Achieving 150 lpw will require several technology breakthroughs as well as considerable incremental progress. Panelists took these factors into account when estimating probabilities, but their final estimates were for the overall program, not for specific projects within the program. Each panel member was asked to estimate the probability of achieving each of the goals given different levels of annual funding. The results are plotted as bars. The bar closest to the origin shows the results for a scenario where the goal is to achieve 150 lpw with a research budget of $10 million per year. The length of the bar says that the panel member’s estimates ranged from 0 percent to 40 percent, with an average value of 10 percent. As funding levels increase, moving to the right, the probability of success increases. As the goal is set lower, moving upward in the graph, the probability of success increases.
Allocation of Benefits
The lighting panel combined the results of the analyses of benefits and probabilities to determine the share of benefits attributable to DOE. Figure 5-2 shows the matrix for the reduced budget case, for which data were more complete. In keeping with the committee-designed format, Figure 5-2 is valid only when the technical goals and all the other necessary SSL technology attributes are met.
Results and Discussion
Figure 5-2 shows that the U.S. economy would see a benefit of $50 billion if funding for the SSL Program continues. This is the current value of the cumulative expected economic benefits through 2050 relative to the baseline, which represents the progress that the private sector and foreign government R&D funding would probably achieve without DOE involvement.
While the analysis is based on the difference in impacts between the two cases, it is not a net analysis in that it does not consider the incremental costs associated with SSL market penetration as a replacement for existing or new lighting applications. The panel suggests that DOE refine its future modeling of benefits for all of its programs to take these incremental costs into account. At least in the case of lighting, they are unlikely to make a large difference in the calculated benefits, but they should be included for completeness. The lighting panel also notes that there might be other positive benefits that are not incorporated in the NEMS economic analysis, such as the possibility that air conditioning loads
would be lowered in commercial buildings with more efficient lighting. Additional benefits such as the reduction of peak electricity demand might also be realized. There were no estimates of such benefits available for the panel’s analysis.
Environmental benefits include savings in carbon emissions from power plants due to lower electricity use, estimated in million metric tons of carbon equivalent (MMTCe). Other environmental benefits likely to be realized from lower electricity use, such as lower emissions of oxides of nitrogen (NOx), sulfur dioxide (SO2), particulate matter (PM), and mercury, are not listed here. Since NOx and SO2 emissions are capped and emission reduction credits are tradable, any such reductions would probably result in economic benefits in the form of lower costs of compliance with environmental regulations rather than in environmental benefits per se.
National security benefits stem from reducing natural gas imports, which reduces U.S. vulnerability to disruptions in supplies. Security benefits might also stem from reducing peak loads and therefore, to some extent, the vulnerability of the electric transmission network. However, the panel was not prepared to estimate either the degree of reduction or its value.
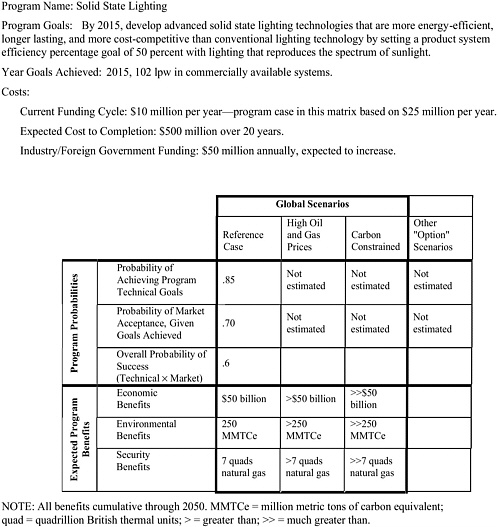
FIGURE 5-2 SSL Program prospective benefits, reduced budget.
Summary and Recommendations
The lighting panel discovered that the achievement of DOE’s technical goal (150 lpw) depended on an increase in funding from the current $10 million per year to $50 million per year. It believes, however, that such an increase is unlikely. DOE eventually revised its estimated progress and benefits downward to reflect half that level, as presented here. Unfortunately, that revision came late in the process, and it was difficult to incorporate the results in the analysis.
DOE’s input to NEMS did not adequately reflect likely developments in competing technologies or in conventional lighting, nor did it reflect SSL work in other countries. Even the full DOE budget would supply only a fraction of the funding for lighting R&D worldwide, so that DOE cannot take full credit for improved lighting efficacy.
The NEMS model is useful for calculating the economic environment for new technologies and their rate of penetration, but it is difficult and cumbersome to use.
THE CARBON SEQUESTRATION PANEL
Carbon Sequestration Program
DOE’s Carbon Sequestration Program, established in 1997, seeks to identify and develop sequestration technologies that could be applied to meet the targets for reducing greenhouse gas emissions. DOE has projected that funding of approximately $55 million per year is required to achieve the program goals. In the panel’s view, funding to date has not kept pace with this requirement. In addition, it believes that the DOE Carbon Sequestration Program does not contain all of the elements necessary to bring new concepts to a point where they can be considered for industrial or utility deployment. Major investments would be needed to demonstrate sequestration technologies at scales sufficient for deployment by utilities. Some of these resources could be provided by other DOE programs focused on new concept demonstration. However, no information on these programs was provided to the panel, nor were they slated for the panel’s assessment.
Overview of the Panel’s Approach
The committee’s proposed benefits methodology requires the panels to estimate the expected economic, environmental, and security benefits under three global economic/environmental scenarios. The sequestration panel reviewed the three scenarios and concluded that the Carbon Sequestration Program would have a benefit only in the Carbon Constrained scenario. (The Carbon Constrained scenario considered by the sequestration panel matched that used by the DOE in its own evaluation of the sequestration program.)
To perform this evaluation, the sequestration panel was divided in two subpanels: one on benefits assessment and the other on probability assessment. The DOE program was reviewed at the program and project levels. The panel’s assessment of the technical viability of the projects formed the knowledge base for its program probability assessment. The full sequestration panel used decision tree analysis to calculate an expected benefit value using the results of the panel’s probability assessment and a simplified benefits calculation method based on NEMS inputs.
Benefits Calculation Method
The primary task of the benefits assessment subpanel was to develop a method for calculating the economic benefits of the DOE Carbon Sequestration Program. The subpanel’s method for calculating benefits was designed to meet four objectives: simplicity, transparency, applicability to the Carbon Sequestration Program examined here, and potential applicability to other DOE programs that will be examined in the future by other expert panels. The method assumes that demand for a product or service is independent of cost, so that the net benefit of an innovation that lowers the cost of supplying the product is calculated by multiplying the cost reduction per unit produced by the total number of products supplied. This method is discussed in Chapter 3 in the section “Simplified Model for Estimating Benefits.”
In assessing the Carbon Sequestration Program, the benefits assessment subpanel focused on the cost of obtaining reductions in CO2 emissions from electricity generation plants. The approach used by the sequestration panel differs from DOE’s benefits calculation approach in terms of the measure of benefits as well as the model used. DOE calculates consumer (not societal) benefits by considering change in the price consumers pay for electricity as well as for natural gas. DOE’s benefits calculation is not consistent with the committee’s definition of economic benefits as the total net societal benefits for the U.S. economy, as discussed in Chapter 3 (see also NRC, 2001). The sequestration panel believes that the reduction in the cost of producing low-emissions electricity would represent the true net economic benefit to society.
The assumptions used in the panel’s simple benefits model were initially chosen to match the assumptions that DOE uses to calculate benefits. The panel’s simplified method, however, makes it possible to easily calculate benefits under alternative assumptions.
Probability Assessment
The probability subpanel was assigned the task of developing a method to assess the probabilities of success for the Carbon Sequestration Program that could be integrated with the simplified benefits method to calculate the expected benefits for the program. The subpanel developed a questionnaire, used by each panelist, to estimate the probabilities of technical success at the project level. The results were then
discussed in a group setting to allow each panelist to refine his or her judgment. A decision tree analysis was then used to assess the impact the total program would have on the cost of electricity supply.
The probability subpanel’s questionnaire asked panelists to estimate the probability of successful completion of the individual projects in the program. The subpanel recognized that the success of the individual projects did not necessarily imply that the overall program goal would be met. Therefore, the subpanel performed a separate assessment to develop probabilities for the overall program. While it was not possible to sum the individual project probabilities to arrive at a probability for the entire program, the evaluation of individual project probabilities provided background information, helping the panel make judgments about the entire program. The panel also recognized that the base program budget was not adequate to bring any of the successful projects to commercial deployment without further scale-up and demonstration projects, which it assumed would be forthcoming or would be provided in parallel DOE programs.
At the program level, there are at least two relevant probabilities: the probability of meeting program goals and the probability of market acceptance. However, for simplicity these were merged into one overall probability of success. Probability estimates were requested for the success of attaining program goals in each year. The goal of the DOE program is to sequester greenhouse gases from fossil fuel conversion plants (the panel focused on coal-fired plants). Since the goal of having commercially ready and demonstrated technology by 2012 seemed optimistic, the panel elected to also consider extended goals—by 2017 and by 2022. The panel viewed the program’s stated goal of keeping the increase in the cost of electricity associated with sequestration at 10 percent as very unlikely and decided to estimate probabilities for a range of cost variables.
Decision Tree Analysis of Overall Success
While the sequestration panel believed it was impossible to simply aggregate the probabilities developed at the project level into a probability for the overall success of the sequestration program, it also believed that, given the project-level information, it could assess the probability for overall success by using a decision tree to capture probabilities for different points in time.3 In the decision tree analysis, panelists specified probabilities of achieving cost reductions equal to 0, 33, 67, or 100 percent of DOE’s claimed benefit in 2012, 2017, and 2022. These percentage improvements could be translated into cost reductions (measured in cents per kilowatt-hour). The probability assessments for the 2017 cost reductions were conditional probability assessments that depended on the cost reduction in 2012, and the assessments for 2022 similarly depended on the 2017 results.
The panel also recognized a separate form of risk (public acceptance) associated with the sequestration of captured CO2. The panel therefore included this risk together with the above results for technical and market risk to arrive at a single probability for sequestration risk.
Results and Discussion
The panel concluded that the technology developed by the Carbon Sequestration Program would be deployed only under the Carbon Constrained scenario, so it did not perform any analyses under the other two scenarios. Although the panel assigned very low probabilities of achieving the DOE’s goals in full in any year and zero probability of achievement by 2012, it still expected substantial benefits in later years. These results reflect the judgment of the panel that the cost reduction goals at the program level were overly optimistic based on the projects that DOE is currently supporting. In addition, the panel believed that significant additional funds would be required to take the bench- and pilot-scale results from the various projects to a plant-scale demonstration level of at least 100 megawatt (MW) capacity. DOE did not discuss the programs that are required for large-scale demonstration and that the panel thought would ultimately be required for successful deployment, so it was very difficult for the panel to reliably assess the probability of achieving the ultimate program goal, which would require full-scale deployment. The panel assumed that if bench- and pilot-scale results were promising, programs would be funded and put in place to demonstrate these concepts at a size sufficient for full-scale deployment.
While the panel’s estimate of expected benefits for the sequestration program is much lower than DOE’s estimates, the benefits are nonetheless substantial. Averaging across panelists, one finds an expected net present value (NPV) program benefit of approximately $35 billion compared with an estimated NPV of approximately $120 billion if the DOE’s goals are met in full, on schedule. The difference is based on the panel’s beliefs that the DOE’s goals would only be partly met and would require more time than assumed by the DOE. If one assumes that a carbon constraint is inevitable (e.g., that the Carbon Constrained scenario prevails) and that parallel demonstration programs (which could add $2 billion to 4 billion to the total program costs) are also supported, the net benefit of the sequestration program is roughly 10 times the amount invested in the program.
Summary and Recommendations
Three major issues complicate the sequestration panel’s assessment: (1) project information provided by DOE was
not complete or consistent, (2) there was no clear roadmap relating the project goals to the overall program goal (in particular, there was no information on scale-up or demonstration plants), and (3) it was difficult to assess benefits of the DOE program independently of parallel activities by other entities, including international initiatives.
The DOE fact sheets describing the projects were unsatisfactory for the panel’s evaluation, and the DOE roadmap did not provide a clear picture of the path from success on individual projects to the attainment of the program’s overall goals. The panel thought that its interactions with DOE regarding benefits calculations were excellent, that requests for benefit information were handled expeditiously, and that clarifying comments by DOE personnel were useful.
The panel believes that the expert panel approach to evaluating DOE programs—that is, the approach recommended by the committee—could succeed in developing consistent results useful for decision makers on other DOE programs. It believes that more information about benefits calculation and probability assessment methods at the beginning of an evaluation would expedite the evaluation process and ensure program-to-program consistency. While it ultimately used an aggregated probability assessment for the overall success of the program, the panel believes it is important to also consider the likelihood of success for individual projects and whether all the projects are in place that are needed to achieve the program goals.
Recommendations to the Committee
Future expert panels would benefit from a one-page fact sheet prepared by DOE to describe activities at the project level and specify the total budget required to bring each project to its defined completion. It is recommended that a template for this one-page fact sheet be discussed, drawn up, and employed. In addition, a roadmap describing the projects necessary to achieve the program goals should be provided and the costs should be estimated.
To minimize work, the panel believes it might be sufficient to assess the probabilities of success for only those projects that are “enabling.” Supporting projects would not be assessed. This level of granularity is a compromise between overgeneralization and overspecialization.
Before starting its evaluation, an expert panel should develop a questionnaire that asks the correct questions and frames them clearly so that the panel members can respond consistently.
It is important that all DOE programs use a consistent benefits calculation method, perhaps one related to NEMS. This would allow calibrating the simplified benefits model assumptions to the DOE assessment. DOE should be ready to provide the NEMS results and input assumptions before the panel initiates its evaluation and should be prepared to do subsequent runs at the request of the panel.
THE FUEL CELL PANEL
Study Objective and Scope
The Panel on Benefits of Fuel Cell R&D evaluated only a portion of the full suite of applied R&D activities related to fuel cells at DOE. A subpanel on vehicle applications was formed to evaluate those fuel cell activities in the Office of Energy Efficiency and Renewable Energy (EE) that included vehicle fuel cell applications but not EE activities involving the distributed generation applications of polymer electrolyte membrane (PEM) fuel cells. The total annual funding requested by the administration in FY 2005 for EE vehicle fuel cell activities was $70 million.4 Likewise, a subpanel on stationary applications was formed to evaluate the $35 million of annual funding for the Solid State Energy Conversion Alliance (SECA).5 (Total funding was $69 million for stationary fuel cell activities within the Office of Fossil Energy [FE] in FY 2004.)
Vehicle Subpanel
Program Overview
Vehicle fuel cell activities are administered by the Office of Hydrogen, Fuel Cell and Infrastructure Technologies (HFCIT).6 The budget request for fuel cell activities in HFCIT in all applications was $77.5 million for FY 2005,7 with $70 million going toward vehicle applications. The program objective for vehicle applications is to develop a 60-percent-efficient, durable, direct-hydrogen fuel cell power system for transportation at a projected manufactured cost of $45/kW by 2010 and $30/kW by 2015.8 DOE has addressed
technological barriers, set forth milestones and go/no-go decisions, and received stakeholder input to its planning process (DOE, 2002, 2003a, 2003b).
Benefits Calculation
Owing to time and resource constraints, the vehicle applications subpanel did not independently calculate benefits. Instead, it worked with the benefits as computed by DOE using MARKAL. The subpanel nonetheless harbored several concerns about the validity of these calculations, which are touched upon briefly below.
The MARKAL model calculated benefits through 2050, by which time it is assumed that fuel cells will have penetrated 38 percent of the vehicle miles traveled and hybrid vehicles will account for the bulk of the remaining vehicle miles traveled. (The NEMS model calculates benefits only through 2025, by which time the vehicle fuel cell program will have realized only a portion of its benefits.)
Probability Calculation
The subpanel based its assessment of the probability of technical success on its evaluation of the subcomponent and performance goals for the fuel cell system that constitutes the vehicle power plant. The subpanel first assigned separate probabilities to the likelihood of each of the various technical targets (durability, cold start, and so on) being met. The probability of technical success for the entire program was then set at the probability of the goal having the lowest probability, which the subpanel determined to be 20 percent (for the $30/kW cost target for the fuel cell system, including storage). The subpanel believes this is justified both because it made separate evaluations of the probability for each goal, assuming the other goals had been met, and because the goal of cost per kilowatt is a showstopper.
In the vehicle applications subpanel’s judgment, DOE did not compare the benefits of the fuel cell program9 against the correct baseline; the subpanel believes the baseline should be the case in which the next-best alternative (e.g., hybrid electric vehicles) succeeds. In DOE’s analysis (NREL, 2004), the benefits of fuel cell vehicles were based on the savings of the fuel cell portion of the market versus a baseline case in which the fuel economy of the light-duty vehicle fleet increased only 10 percent by 2050. The panel believes that the comparison should be between, on the one hand, a baseline case in which fuel cells do not exist and the next-best alternative is allowed to dominate the market and, on the other hand, the case in which fuel cells and other alternatives compete in the market (the latter similar to DOE’s fuel cell program case).
Another problem with probability estimation is that the subpanel evaluated only the fuel cell part of the hydrogen activities at DOE. The fuel cell and the hydrogen production, distribution, and storage program elements are inherently interdependent and should be evaluated as one. The intuition of the subpanel is that the production, distribution, and storage of hydrogen—in view of constraints on cost, environmental impacts, safety, and capital investments—present challenges that may be even more difficult to overcome than those associated with fuel cell vehicles. This concern about low-cost, clean, and widely available hydrogen was one reason for assigning a very low probability of market success to fuel cell vehicles.
The vehicle applications subpanel accounted for the deficiencies in DOE’s benefit calculation, such as the choice of a slowly progressing next-best alternative and other flawed assumptions (listed in Appendix H, the fuel cell panel report) by lowering the probability of market success. The subpanel further notes that DOE’s benefits calculation for fuel cells assumes the success of complementary technology for hydrogen supply, a doubtful outcome in the subpanel’s opinion. Although the subpanel did not evaluate the hydrogen program, it has serious reservations about whether hydrogen will be produced, distributed, and stored at a cost competitive with that of gasoline and doubts that hydrogen will be widely available, as is assumed by DOE. The subpanel has attempted to account for these reservations about supply by reducing the probability of market success to 10 percent.
Expected Benefits
The subpanel calculated both cumulative benefits by 2050 and annual benefits in that year, because the rationale for the program is to provide the means for drastically reducing the nation’s CO2 emissions as well as its vulnerability to oil supply shocks. These benefits were calculated by multiplying DOE’s MARKAL benefits by the overall probability of 2 percent. Cumulative benefits were computed using a third-order fit to NREL (2004).
The undiscounted annual benefits in 2050 were $1.58 billion, 2.76 million metric tons carbon equivalent (MMTCe), and 50 million barrels of imported oil offset. The undiscounted cumulative savings through 2050 were $19 billion, 46 MMTCe, and 700 million barrels of oil.
Results and Discussion: Vehicle Subpanel
The subpanel found that the methodology for creating the prospective benefits matrix was reasonably successful. However, the process for evaluating, digesting, and analyzing the information necessary to construct the matrix could be improved. The need for this improvement can be illustrated by looking at how this subpanel operated within the compressed time frame allotted to it.
The strength of the methodology is that it brings together independent experts with different backgrounds to do the evaluation and relies on a common methodology for all programs. Its greatest weaknesses are the dearth of simple-to-use tools for evaluating benefits and the huge volumes of data that are needed.
The issue of the next-best alternative and its correct specification was a major confounding factor in the subpanel’s evaluation. The subpanel had hoped DOE would pick a baseline case in which technological progress was more rapid—that is, one that recognized the success of hybrid electric vehicles. The pessimistic choice made by DOE tends to exaggerate the benefits of the fuel cell programs.
As noted above, the subpanel believes that for vehicle fuel cell R&D activities to lead to successful commercial deployment and benefits, hydrogen supply R&D activities have to be successful as well—the complementary technology issue. The subpanel believes vehicle fuel cell success is heavily dependent on the success of the hydrogen supply R&D, making this an extreme case of complementarity.
Stationary Applications Subpanel
Program Overview
The program goal of SECA is to produce, by 2010, solid oxide fuel cell (SOFC) modules of 3 to 10 kilowatt (kW) capacity at a capital cost of no more than $400 per kilowatt. A longer-term program goal (2012-2015) is to scale up SOFC modules to megawatt-class and run fuel cell/turbine hybrids on a coal-derived slipstream. By 2015, the goal is to test a SECA 40-MW hybrid at a coal gasifier. Both these hybrid approaches have the same capital cost goal of $400/kW as the fuel cell product but higher thermal efficiency goals.10
Benefits Calculation Method
The stationary applications subpanel employed two methods of its own to compute potential economic benefits of the SECA program. The results of these methods were checked against DOE runs of the very sophisticated NEMS model, to see if they were in the same ballpark.
Economic benefits were calculated by the subpanel for the three global scenarios—Reference Case, High Oil and Gas Prices, and Carbon Constrained. The natural gas price is assumed to be $4.6 per million Btu in the Reference Case. In the High Oil and Gas Prices scenario, the natural gas price is assumed to be 63 percent higher. In the Carbon Constrained scenario, the low and high carbon taxes are assumed to be $50 and $150 per ton (t), respectively. Method 1 used as inputs the cumulative, installed distributed generation (DG) fuel cell capacity, which DOE calculated using NEMS. NEMS determined the cumulative penetration for the fuel-cell-based system at three different capital costs—that is, dollars per kilowatt ($/kW) of electrical generating capacity—with penetration naturally being greater at lower capital costs.11 The DG market was divided into three segments based on installed system capacity: (1) less than 1 MW, (2) approximately 1 MW, and (3) approximately 10 MW. Economic benefits were calculated assuming the program goal of $400/kW capital cost would be met, as well as alternative outcomes in which capital costs of $600/kW and $800/kW are achieved. This produced a range of estimated benefits.
For Method 2, the total market for distributed generation (DG) in any given year, starting in 2011, was assumed to be 25.78 gigawatts (GW)12 and the penetration of the DG market by fuel cells was assumed to be 10 percent.
Probability Determination
The stationary applications subpanel intended to assign quantitative probabilities to the likelihood of technical success and market success. However, the details of how the cost goal will be achieved by the six industry teams that participate in the SECA program are proprietary and were not available to the subpanel for its evaluation. When this information was requested from the DOE, the response was “actual costs for the SECA fuel cells are proprietary” and “details regarding where they are relative to the targets cannot be made public.” Hence, the panel could not use DOE information to make a determination of technical (i.e., program) success. The panel believes that if SECA’s program goals on capital cost and efficiency are met, success is highly probable for much of the market segment up to 10 MW, because the capital cost and fuel consumption per kilowatt hour are lower than those of the next-best alternative.
Expected Benefits
The committee calculated gross benefits but was unable to apply probabilities to calculate expected benefits because the panel was unable to make an independent assessment of program success.
Results and Discussion: Stationary Applciations Subpanel
As noted, the stationary applications subpanel developed two methods of its own for calculating economic benefits. Fuel cell or fuel cell/turbine hybrid units deliver economic benefits in the form of fuel savings and reduced capital costs vis-à-vis the next-best alternative. The subpanel calculated economic benefits of $19.5 billion to $26 billion in the Reference Case, $23.3 billion to $35.7 billion for the High Oil and Gas Prices scenario, and $20.5 billion to $31.7 billion for the Carbon Constrained scenario. These results are consistent with DOE’s predictions. They are not unexpected, as the subpanel assumed that all program goals were achieved and used DOE and NEMS data for inputs to their benefits calculations.
The subpanel understands that it was not charged with performing a program review; however, these issues would need to be understood in order to independently establish probabilities and benefits.
The subpanel recommends that, should a similar evaluation be performed by a another group in the future, such a group should work with the NRC staff on a strategy for obtaining the information it needs to perform its work. Once these data are obtained, it should be a relatively simple matter to complete the matrix. Most of this activity could be completed by e-mail, with perhaps one meeting with DOE to clarify issues and allow the subpanel or another group to discuss the program and develop an analytical strategy for completing the matrix.


