
4
Ensuring an Adequate Workforce for Breast Cancer Screening and Diagnosis
Recent media reports suggest that shortages of radio logic technologists (RTs) and interpreting physicians (see Box 4-1) have contributed to the closure of some mammography facilities (Martinez, 2000; Gorman, 2001) and articles in trade publications refer to a current or looming “crisis” in access to mammography (Maguire, 2003; Brice, 2004; Hayes, 2004). Although these reports depict alarming situations, they are largely anecdotal or impressionistic; however, it is clear that demand for breast imaging services is increasing and is likely to continue to do so over the coming decades, while there is little to suggest that the numbers of interpreting physicians and RTs will rise accordingly. Although demand for mammography could potentially decrease in the future—for example, if longer screening intervals were recommended for some portion of the population—such changes are difficult to predict. These concerns serve to highlight the lack of data on the national mammography workforce, the volume of services it delivers, and its capacity for expansion—measures that are essential to determining whether, and where, workforce shortages occur and what impact such shortages have, or potentially could have, on the delivery of mammography and other breast imaging services.
In the absence of such data, the Committee relied on several sources of information in order to assess the current and future state of the mammography workforce. These included inspection reports to the Food and Drug Administration (FDA), as well as survey data from the American College of Radiology (ACR; see Appendix A), the Society of Breast Imaging (SBI; see Appendix B), and the American Society of Radiologic Technologists (ASRT). Although FDA does not collect data on individual practitioners, the Committee was able to estimate the total number of physicians who interpreted mammograms each year since 1997. However, it should be noted that these estimates are still likely to be inflated.1
It is also important to recognize the limitations of opinion surveys. Although they are helpful in gaining the perspective of current or potential members of the mammography workforce, survey methods are also prone to subject bias and error. Motivational factors may influence the results of surveys that address sensitive subjects such as employment; respondents may be unwilling to provide accurate information for reasons of self-protection or personal gain (Wentland, 1993). In addition, experiments in social psychology suggest that responses to survey questions regarding attitude are influenced by environment, survey type, and the context in which the question is presented (Tourangeau et al., 2000). The Committee’s intention in presenting findings from opinion surveys, including those conducted by the ACR and SBI, is to shed light on a variety of attitudes
|
BOX 4–1 Interpreting physician: Interprets mammograms. Initial training and qualifications: Must be a physician with a state license to practice medicine and must be board certified in diagnostic radiology by a Food and Drug Administration- (FDA-) approved body or have 3 months of formal training in mammography (although physicians who qualified under the interim regulations only needed two months). Must have a minimum of 60 hours of documented Continuing Medical Education (CME) in mammography (although physicians who qualified under the interim regulations only needed 40 hours), and have interpreted at least 240 mammograms under the direct supervision of an interpreting physician in the 6 months prior to qualifying. Continuing education: Must teach or complete at least 15 Category I CME hours in mammography every 36 months. Continuing experience: Must interpret a minimum of 960 mammograms every 24 months. The lead interpreting physician in a mammography facility has general responsibility for ensuring that a facility’s quality assurance program meets all of the requirements of Section 900.12(d) through (f). Each facility must also designate at least one audit interpreting physician to review and analyze the medical outcomes audit data. This individual is responsible for documenting the results, for notifying other interpreting physicians of their results and the facility aggregate results, and for documenting the nature of any follow-up actions. Radiologic technologist (RT): Performs mammographic examinations and prepares films or digitized images for interpretation. Initial training and qualifications: Must be state licensed to perform general radiographic procedures, or have a general certification from an FDA-approved body to perform radiologic examinations. Must complete 40 hours of training specific to mammography, including performance of a minimum of 25 examinations under direct supervision (although technologists who qualified under the interim regulations did not need to perform 25 exams and the number of hours of mammography training was not specified). Continuing education: Must obtain 15 continuing education units every 36 months. Continuing experience: Must perform 200 mammograms every 24 months years. Medical physicist: Surveys mammography equipment and oversees the equipment-related quality assurance practices of the facility. Initial training and qualifications: Must be board certified in an appropriate specialty area by an FDA-approved body, or be State licensed or approved for medical physics surveys of mammography facilities. Must have a master’s degree or higher in physical science with no less than 20 semester hours or equivalent of college undergraduate- or graduate-level physics. Must complete 20 hours of specialized training in conducting surveys of mammographic facilities. Must survey at least 1 mammography facility and a total of 10 mammography units. (Medical physicists who qualified under the interim regulations could continue to perform surveys under the final regulations with a bachelor’s degree in physical science and 10 semester hours of physics, provided they had 40 hours of training in surveys and had done surveys of at least one facility and 20 mammography units.) Continuing education: Must obtain 15 continuing education units every 36 months. Continuing experience: Must conduct surveys of two facilities and six units every 24 months. |
|
Breast imaging specialist: Specializes in interpreting the results of mammographic and nonmammographic imaging examinations of the breast and performs interventional procedures, including image-guided biopsies of the breast. Training and qualifications are not defined by MQSA, but are generally considered to include some or all of the following: fellowship training in breast imaging, spending a majority of time on the interpretation of breast images, and conducting a high volume of breast imaging. Radiologist assistant (RA): A recently created physician extender position, the RA is an advanced-level radiologic technologist who works under the supervision of a radiologist. Experience as an RT is a prerequisite for admission to ACR- and ASRT-approved RA training programs at four U.S. universities (additional programs are under development). The RA is an ARRT-certified radiographer who has successfully completed an advanced academic program encompassing a nationally recognized curriculum and a radiologist-directed clinical preceptorship. Under a radiologist’s supervision, the RA performs patient assessment, patient management, and selected examinations. The roles and responsibilities of the RA, as agreed on by the ACR and ASRT, will not include interpretations (preliminary, final, or otherwise) of any radiological examination or the transmission of observations to anyone other than to the supervising radiologist. The RA may make initial observations of diagnostic images and forward them to the supervising radiologist. SOURCES: 21 C.F.R. § 900.1 (2003); IOM (2004); Williams and Short (2004). |
that may influence the present and future breast imaging workforce; it is not an attempt to determine or predict the magnitude of influence associated with a specific attitude or opinion.
Although predicting future workforce trends is fraught with uncertainty, the Committee commissioned Paul Wing, of the Center for Workforce Studies at the State University of New York School of Public Health in Albany, to model the possible effects of current trends and potential changes in regulations on the supply and demand for RTs who perform mammograms and the physicians who interpret them (see Appendix C). Key statistics, derived from the three surveys and the workforce modeling study, are summarized in Box 4-2.
The Committee examined a variety of factors that could limit the future supply of interpreting physicians, including concerns that reading mammograms, as compared with other areas of radiology, is less lucrative, more regulated, and carries greater medicolegal risk. It was also noted that the expanded use of nonmammographic imaging technologies for breast cancer detection and diagnosis are likely to increase future demand for breast imaging, and thereby the workload of some interpreting physicians. These issues are considered in proposing strategies to increase the number of new entrants to the field of breast imaging, retain the current mammography workforce, and enhance the productivity of new and existing practitioners.
|
BOX 4–2 In 2003–2004: Approximately 62 percent of all radiologists interpreted mammograms. The supply of interpreting physicians was approximately 14,400 full-time equivalent (FTE) radiologists, which translates to approximately 2.4 FTE radiologists interpreting mammograms per 10,000 women aged 40 and older. However, an FTE radiologist is not an FTE interpreting physician, as most are general radiologists who spend a significant portion of their time interpreting other radiologic exams. The average interpreting physician (50th percentile) read 1,670 mammograms per year. Among interpreting physicians:
The effective workforce of radiologic technologists (RTs) in mammography is approximately 26,000 FTEs. Less than half of all members of the American Registry of Radiologic Technologists who are certified in mammography work primarily in mammography. On an average hourly wage basis, RTs working primarily in mammography earned significantly less than those working primarily in nuclear medicine (26 percent), magnetic resonance imaging (12 percent), sonography (10 percent), and computerized tomography (6 percent). Future projections based on current trends (assumes no change in the numbers of physicians or RTs entering or exiting the field): The population of women over age 40 will increase by nearly 30 percent by 2025. The number of interpreting physicians per 10,000 women over age 40 will decline by 14 percent by 2015 and by 23 percent by 2025. The shortfall could be overcome by increasing the number of interpreting physicians or by increasing the volume of mammograms read by the available pool of interpreting physicians. The supply of RTs will decline by approximately 22 percent by 2025; the number of RTs per 10,000 women over age 40 will decline by 23 percent by 2015 and by 40 percent by 2025. SOURCES: Wing (2005); American College of Radiology (2004); ASRT (2004a). |
TABLE 4–1 Number of Interpreting Physicians by Year
CURRENT STATUS: IS ACCESS TO MAMMOGRAPHY ENDANGERED?
As shown in Table 4–1, the number of interpreting physicians increased by 5 percent between 1997 and 1999, and then declined by about 3 percent by 2003. Although the absolute numbers are inflated due to redundancy in the data source, FDA estimates are
useful in that they reflect year-to-year trends. The ACR estimated a smaller number of interpreting physicians from the results of a 2003 survey2 of radiologists and nuclear medicine specialists with major ties to radiology (for a detailed account of the ACR’s survey methods, see Appendix A). The discrepancy between FDA and ACR estimates probably results from differences in the processes that produced them, and also is exacerbated by variability in name entry that eluded efforts to factor out redundancy.
As the data collection and analysis methods used to produce the ACR estimates were also used to address other questions about workforce, these results were used to model future workforce supply and demand for consistency (see below). In 2003, the ACR estimates that about 16,000 radiologists—60 percent of the U.S. total—interpreted mammograms, and that the equivalent of 2.4 full-time radiologists interpreted mammograms for every 10,000 women in the U.S. population aged 40 years and older. However, it is important to note that a full-time equivalent (FTE) radiologist is not necessarily an FTE interpreting physician. In fact, the vast majority of radiologists who interpret mammograms spend a significant portion of their time reading other types of images. The actual number of full-time equivalent interpreting physicians is thus much lower. As no attempt has been made to determine the optimal ratio of radiologists (or interpreting physicians) to women aged 40 and older, the ratio calculated by the ACR is meaningful only as a basis of comparison from year to year. Moreover, if such an optimal ratio could be determined, it would need to reflect technological innovation and screening intervals, and therefore would probably change over time. Although the volume of mammograms read by individual practitioners cannot be determined from FDA data, the ACR has collected such information. Figure 4–1, which classifies interpreting physicians in the United States according to the volume of mammograms they read during 2003, shows that 75 percent of the 16,000 estimated interpreting physicians read at least 1,000 of them, and 46 percent read at least 2,000. Seventy to 80 percent of radiologists in small and medium-sized practices (2 to 10 radiologists) interpreted mammograms, as compared with less than 40 percent in large, and apparently more specialized, practices (30 or more radiologists).
The ASRT’s 2004 data indicate that approximately 26,000 full-time RTs work primarily in mammography in the United States (ASRT, 2004a). They comprise less than half of all technologists certified by the American Registry of Radiologic Technologists (ARRT) who are certified in mammography.
Unfilled Positions
One frequently cited indicator of workforce supply relative to demand in mammography is the number of unfilled job openings for interpreting physicians and RTs who perform mammography. In the SBI’s October 2003 survey,3 29 percent of nearly 570 breast imaging practices reported unfilled positions for physicians. More than a third of
|
2 |
The 2003 ACR survey (see Appendix A) was sent to a “stratified random sample” of 3,090 physicians derived primarily from the American Medical Association’s Physician Masterfile, representing vascular/interventional radiologists, all other types of allopathic radiologists, osteopathic radiologists, and nuclear medicine specialists with major ties to radiology (e.g., those holding American Board of Radiology [ABR] certification and/or membership in the ACR). The sample included residents, fellows, and retirees; 1924 usable responses were received, yielding a response rate of 63 percent. |
|
3 |
The October 2003 SBI survey was sent to every breast imaging practice (one survey per practice) in the organization’s database. Surveys were received from 575 practices (64 percent of study population). |
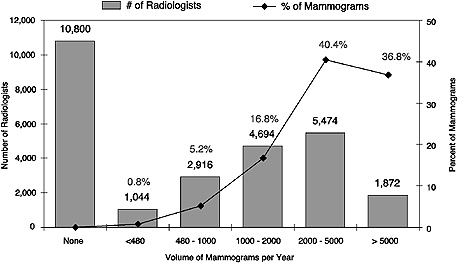
FIGURE 4–1 Estimated radiologists interpreting mammograms and percentage of total mammograms, by volume, United States, 2003. According to the figure, 5,474 radiologists read between 2,000 and 5,000 mammograms per year, accounting for 40.4 percent of all mammograms read each year.
SOURCE: Derived from Sunshine et al. (2004a) and Wing (2005).
these practices had two or more such openings, and nearly one-quarter had been attempting to hire an interpreting physician for more than 2 years (Farria et al., in press). There were many more interpreting physician and RT openings in academic practices than in private and government practices. Nearly two-thirds of the 12 percent of practices surveyed that offered breast imaging fellowships reported that these positions were unfilled. A survey of 53 community-based mammography facilities in three states (Washington, New Hampshire, and Colorado) conducted by D’Orsi and coworkers (2005) in 2001–2002 found shortages of interpreting physicians relative to mammography volume in 44 percent of these facilities.
Job vacancies in mammography do not appear to reflect an overall trend within radiology, which in 2003 saw multiple signs that a severe shortage of radiologists had eased (Sunshine et al., 2004b). Demand for all types of specialist physicians, and particularly for radiologists, rose between 2002 and 2003 (Merritt, Hawkins & Associates, 2003). The New York State Resident Exit Survey found that starting salaries for radiologists in general (both diagnostic and therapeutic) who had completed training within that state rose more than 37 percent between 1999 and 2003, and more than 45 percent between 1998 and 2003 (Center for Health Workforce Studies, 1999–2004). This survey indicates a slight drop (about a 2 percent change) in median salary between 2002 and 2003, but that came on the heels of a more than 17 percent in-crease between 2001 and 2002. Inasmuch as academic radiologists’ salaries reflect general trends in the field, it can
also be noted that the median compensation4 for a full-time assistant professor of diagnostic radiology rose by about 23 percent between 1999 and 2003, according to the Association of American Medical Colleges (1999–2003). This survey also reported a 9 percent median increase for assistant professors in all clinical departments and a 14 percent salary rise for those in therapeutic radiology over the same period. Year-to-year trends in these figures show a slight slowdown in annual salary increases for academic diagnostic radiologists after 2001–2002.
Trends in vacancies for mammography RT positions appear to mirror those for interpreting physicians. Thirty percent of the breast imaging practices that responded to the SBI survey reported unfilled mammography technologist positions; of these, 45 percent had two or more openings in 2003 (Farria et al., in press). Similarly, 20 percent of the community mammography facilities that responded to the aforementioned survey by D’Orsi and coworkers reported a shortage of MQSA-qualified RTs; 46 percent reported some difficulty in maintaining an adequate staff of qualified technologists (D’Orsi et al., 2005).
Data from the ARRT indicated a steady and substantial decline in examinees for certification in mammography between 1996 and 2000 (American Registry of Radio logic Technologists, 2001). However, since the exam was first offered in 1992, this decline may in part reflect the fact that many people taking the exam in its first few years were already working in the field (IOM, 2001). Since 2000, the total number of registrants has remained essentially flat, although 2003 showed the first increase in first-time examinees in recent years (a nearly 6 percent increase over the number of first-time examinees in 2002).
A key barrier to filling RT positions in mammography is their low pay in comparison to RT positions in other subspecialties. In the 2003 SBI survey, wages for RTs working primarily in mammography ranked third out of four radiology subspecialties (Farria et al., in press). On an average hourly wage basis, mammography RTs earned significantly less than those working primarily in nuclear medicine (26 percent), magnetic resonance imaging (MRI) (12 percent), sonography (10 percent), and computerized tomography (CT) (6 percent), according to the ASRT (2004b).5 The average salaries of RTs who worked primarily in nuclear medicine in 2004 were 28 percent higher than those who worked primarily in mammography (ASRT, 2004b).
Medical physicists (see Box 4-1) also play an essential role in the breast imaging workforce, but supply/demand issues for these professionals are less well understood than those of interpreting physicians and RTs. A 1993 report written by the National Mammography Quality Assurance Advisory Committee showed that there were 511 medical physicists qualified under the interim rules to perform mammography surveys, and concluded that this number was sufficient to support mammography across the United States (National Mammography Quality Assurance Advisory Committee, 1996). However, concerns were subsequently raised that there would not be enough physicists to perform MQSA evaluations unless physicists substantially increased the number of mammography units they evaluated each year (Rothenberg et al., 1995). Moreover, a 2001 survey of
TABLE 4–2 American College of Radiology (ACR) Mammography Accreditation Program: Reason for Facility Closures Since April 2001 (as of October 2004)
|
Reason |
Number of Facilities Closed |
% of Total |
|
Financial |
523 |
33.5 |
|
Moved to sister site |
370 |
23.7 |
|
Equipment |
173 |
11.1 |
|
Staffing |
161 |
10.3 |
|
Unknown |
159 |
10.2 |
|
Other |
84 |
5.4 |
|
Bankruptcy |
34 |
2.2 |
|
Change in ownership |
30 |
1.9 |
|
Mobile unit merged with another site |
29 |
1.9 |
|
Total |
1,563 |
— |
|
SOURCE: Destouet et al. (In press). Reprinted from the Journal of the American College of Radiology, In press, Destouet JM, Bassett LW, Yaffe MJ, Butler PF, Wilcox PA. The American College of Radiology Mammography Accreditation Program—10 years of experience since MQSA, with permission from The American College of Radiology. |
||
850 medical physicists revealed that clinical activities in breast imaging were among the most time-consuming activities they performed (Cypel and Sunshine, 2004). Due to the dearth of recent data in general—let alone among those who evaluate mammographic equipment—the possibility of a present or future shortage of medical physicists active in breast imaging cannot be determined. Nonetheless, the lack of even anecdotal reports on the supply of and demand for medical physicists suggests there is no shortage of these personnel.
Facility Closures
The ACR documented the closure of 1,563 (out of 8,325, or about 19 percent) facilities accredited by that organization between April 2001 and October 2004 (Destouet et al., in press). Although partially offset by the opening of hundreds of new facilities, these closures contributed to a net loss of 752, or more than 8 percent, of ACR-accredited facilities over that time period. Financial factors, cited by about one-third of respondents, were the most frequent reason for facility closures, as shown in Table 4–2. The second most common reason for the closure of ACR-accredited facilities, “moved to sister site,” was cited in nearly one-quarter of these cases. This response may reflect consolidation that could provide more efficient delivery of services, but the prevalence of such closures suggests that access to mammography may have declined in many communities. According to FDA, the number of mammography units operated by hospitals and clinics rose 5.4 percent between 2000 and 2004.
As a result of concerns about the increasing number of mammography facility closures, the U.S. Government Accountability Office (GAO) is currently conducting a
study to evaluate the factors that contributed to the closing of facilities nationwide since 2001. The study, to be completed by July 2005, will attempt to determine whether these facilities closed due to consolidation, or whether they represent a true reduction in mammography availability. It will also explore the relationship between certified units and facility capacity, evaluate capacity issues, and determine the effect facility closings have had on public access (including underserved populations) to mammography services since the April 2002 GAO report on access to mammography.6
Wait Times for Screening and Diagnosis
A national survey of 9,908 mammogram facilities conducted in 1999–2000 found that 64 percent could schedule a patient for a screening mammogram within 7 days (IMV Medical Information Division, 2002). Similar results were obtained in a statewide survey representing 89 percent of licensed mammography practices that was conducted by the Florida Department of Health in July 2004, in conjunction with a study of the accessibility of mammography services in that state (The Workgroup on Mammography Accessibility, 2004). Survey results indicated that wait times for screening mammograms in the nation’s fourth most populous state were highly variable, ranging from less than 24 hours to several months, but that 50 percent of appointment wait times were less than 3 days. The median wait time for a diagnostic mammogram scheduled by the patient was 2 days, and if scheduled by a physician, 1 day. Seventeen percent of mammography practices reported appointment wait times exceeding 28 days for screening mammograms (as compared with 8 percent in the national survey) (Eastern Research Group and U.S. Food and Drug Administration, 2001), 24 percent had patient-scheduled diagnostic appointment wait times longer than 7 days, and 21 percent had physician-scheduled appointment wait times longer than 7 days.
Reports of lengthy wait times for mammograms indicate that some breast cancer screening facilities are operating at or near full capacity (IOM, 2001). In New York City, patients waited an average of more than 40 days in 2003 for first-time screening mammograms, as compared with 14 days in 1998 (Maguire, 2003). In 2004, waits for screening mammograms in Jacksonville, Florida, where four breast imaging centers had closed within 2 years, reportedly ranged from 10 weeks to more than 5 months. The aforementioned three-state survey of community-based mammography facilities reported wait times for screening mammograms of up to 8 weeks (D’Orsi et al., 2005).
Mammography facilities with staff vacancies are likely to require longer wait times for appointments. The 2003 SBI survey found a strong association between the percentage of unfilled radiologist or RT positions in breast imaging practices and the length of time symptomatic women had to wait for a mammogram (Farria et al., in press). In facilities where at least 80 percent of either radiologist or RT positions were filled, average wait times for symptomatic women were less than 24 hours. Where only 40 percent of either radiologist or technologist positions were filled, symptomatic patients waited an average of at least 2 weeks.
The Florida accessibility study identified several additional factors contributing to longer wait times for mammography appointments. These included reports by
TABLE 4–3 Fees for Screening Mammograms Vary by Insured Status
|
Insurance Status |
Amount (2004) |
|
Private insurancea |
$167.00 |
|
Uninsuredb |
$106.39 |
|
Medicarec |
$88.54 |
|
Medicaidd |
$45.48 |
|
a The amount reported for private insurance identifies the fee considered fair and reasonable as reported by the Florida Department of Health. b Based on survey results from the American Cancer Society’s Mammography in Florida: A Consumer’s Guide, July 2004. This amount represents the average fee amount for a screening mammogram for the reporting facilities. c For Medicare, the amount is the maximum authorized for screening mammograms. The reimbursement rate is 50 percent higher for screening mammograms when digital equipment is used. Medicare patients pay 20 percent of the Medicare-approved amount. d Medicaid patients pay an additional $3 co-payment. NOTE: Fees listed are from the state of Florida. SOURCES: The Florida Legislature: Office of Program Policy Analysis & Government Accountability (2004); American Cancer Society (2004). |
|
interpreting physicians at facilities with long wait times that they limited the number of mammograms they read in order to limit their exposure to medical malpractice lawsuits (The Florida Legislature: Office of Program Policy Analysis & Government Accountability, 2004). Women with private health insurance and/or who are members of health maintenance organizations may also face extended wait time because their primary physicians are contractually obliged to refer patients to designated—and therefore, high-volume—mammography facilities. Most importantly, however, the Florida study found that low-income women face a variety of barriers to access to mammography, as described below.
There is no consensus regarding optimal or acceptable wait times for screening or diagnostic appointments. Like other measures of workforce capacity, there are no national data to systematically assess wait times. There are different ways to measure this parameter, but consistently recording time to the third appointment (a standard measure for access in the health care industry; [National Quality Measures Clearinghouse, 2004]) for both screening and diagnostic exams would be a useful start.
Low-Income Limits Access
Many studies have identified a link between socioeconomic factors and limited access to mammography (reviewed by Lawson et al., 2000; Lannin et al., 2002; Ward et al., 2004). In Florida, the cost of services and the stipulation by most facilities that a woman must obtain a referral for a mammogram from a primary care provider were found to limit access to mammography for low-income women without insurance (The Florida Legislature: Office of Program Policy Analysis & Government Accountability, 2004). For women in Florida’s Medicaid Program, reimbursement rates and facility admission criteria can serve as barriers to obtaining mammography services. More than 20
percent of the mammography facilities surveyed reported that they do not provide mammography services for Medicaid recipients; other facilities that accept Medicaid recipients limited the number of recipients served. Low reimbursement rates were cited as a primary reason for excluding or limiting the number of Medicaid patients (Table 4–3). In addition, Florida’s Medicaid program does not currently reimburse for mammography at mobile facilities, although that restriction is currently under examination.
As a result of such barriers to mammography, while 65 percent of all Florida women aged 40 and older received annual mammograms in 2002, only 42 percent of Florida women over 40 without insurance, and a mere 4 percent of those on Medicaid, did so (The Florida Legislature: Office of Program Policy Analysis & Government Accountability, 2004). Nationally, 64 percent of insured women aged 40 and older received mammograms within the past 2 years (as of 2002), as compared with 38 percent of uninsured women aged 40 and older (Centers for Disease Control and Prevention, 2002).
Increasing Demand for Breast Imaging Services
In the absence of a comprehensive measurement of national mammography usage—and one that distinguishes between screening and diagnostic examinations—researchers have attempted to estimate mammography use through a variety of means. Most utilize self-report survey data, but a recently developed methodology uses disparate data sources, including screening registry data provided by the Breast Cancer Surveillance Consortium, to obtain a comprehensive model of screening use (Cronin et al., in press). As one might expect, the specific results of these exercises vary. However, similar trends in year-to-year increases in mammography usage emerge from these disparate estimates. According to GAO, mammography utilization rose 15 percent between 1998 and 2002 (U.S. Government Accountability Office, 2002). Between 2000 and 2003, mammography rates among privately insured women rose nearly 16 percent (Brice, 2004). The total number of mammography procedures (including an unknown proportion of diagnostic mammograms) reported to FDA has increased by more than 6 percent per year for the past 2 years (between December 2002 and January 2005).7
Accordingly, in 2003, 75 percent of breast imaging practices reported increased patient volume over the previous 2 years, according to the SBI (Farria et al., in press). Ninety-six percent of these practices attributed the upswing to “increased demand,” interpreted as a combination of an increase in the number of women eligible for screening mammography, better compliance with examination guidelines by women over age 40, and greater use of a broadening spectrum of services offered by breast imaging practices, as described below.
FUTURE PROJECTIONS: WORKFORCE DEMAND OUTSTRIPS SUPPLY
In an effort to predict the future supply and demand of the mammography workforce, the Committee commissioned Paul Wing, of the Center for Workforce Studies at the State University of New York School of Public Health in Albany, to model the possi-
ble effects of current trends and potential changes in regulations on the workforce. An age-cohort flow model (described in detail in Appendix C) was used to project the future supply of radiologists and radiologic technologists working in mammography (Wing, 2005). The current rates of entry into and departure from the field were estimated and predictions were made based on the assumption that these rates will remain essentially unchanged over the next 20 years. From this baseline model, predictions were made regarding the total number of specialists in the field; the ratio of specialists per 10,000 women over the age of 40, as predicted by the U.S. Census Bureau; and the workforce increases needed to implement potential new mandatory changes in mammography interpretation (e.g., double reading or an increase in the minimum reader volume).
The model of the projected supply of interpreting physicians depicted in Table 4–4 predicts that the number of radiologists interpreting mammograms will remain essentially flat through 2025. Thus, as the population of women over 40 increases by nearly 50 percent (U.S. Census Bureau, 2004), the number of practitioners per 10,000 women over age 40 is expected to decline by 14 percent by 2015, and by 23 percent by 2025. If the average volume of mammograms read by interpreting physicians remained constant, the number of new interpreting physicians would have to increase by 38 percent in order to maintain the current ratio of interpreting physicians to women 40 and over in future years.
Another way of increasing the effective supply of interpreting physicians would be to increase the volume of mammograms they read. Because the total number of interpreting physicians who spend more than 30 percent of their time interpreting mammograms is small, further increasing their volume would have a minimal impact on the workforce. Convincing radiologists who currently devote no time to mammography to begin reading mammograms appears also to offer only a marginal impact on the effective supply. To make a major impact, one would have to convince a large number of these radiologists (50 percent in Table 4–4b) to read 1,000 mammograms per year (Table 4–4b) in order to make a significant difference (the equivalent of approximately 1,080 radiologists who read 5,000 mammograms per year). That leaves the group currently devoting less than 30 percent of their time to mammography. If this group, which represents about half of all radiologists, could be convinced to increase their mammography volume by a third, it would increase the effective workforce supply by 34 percent (the equivalent of approximately 1,620 radiologists who read 5,000 mammograms per year). However, the capacity for increasing reading volume in the workforce is unknown, and would probably require radiologists to reduce their volume of nonmammographic interpretation.
Table 4–5 shows similar trends toward supply/demand imbalances for RTs who perform mammograms. In fact, if the current rates of entrants and departures from the field remain constant, their numbers are expected to decline by approximately 22 percent by 2025. Thus the decline in the number of mammography technologists per 10,000 women over age 40 is expected to drop even more than that predicted for radiologists—by 23 percent in 2015 and by 40 percent in 2025. If the number of RTs entering mammography increased from the actual 2000 to 2003 levels of approximately 1,150 per year, to 1,610 per year (a 40 percent increase), then the number of RTs performing mammography would remain approximately constant out to 2025 and beyond. If the number of RTs entering mammography increased to 2,235 per year (a 94 percent increase), then the
TABLE 4–4 Projected FTE Supply of Radiologists Performing Mammography. (A) Status quo projections for the United States, 2003–2005. Assumes constant introduction of new radiologists interpreting mammograms, constant rate of departure of radiologists interpreting mammograms, constant average interpretive volume, and increasing numbers of women 40 and older, per U.S. Census Bureau projections. (B) Impact on the effective supply of radiologists reading mammograms of increased interpretive volume.
|
A |
||||||||
|
1-Year Additionsa 525 (%) |
5-Year DDRb (%) |
Age Group |
Baseline 2003 |
Year |
||||
|
2005 |
2010 |
2015 |
2020 |
2025 |
||||
|
17.1 |
0.0 |
<35 |
449 |
449 |
449 |
449 |
449 |
449 |
|
57.0 |
0.0 |
35–39 |
1,943 |
1,944 |
1,945 |
1,945 |
1,945 |
1,945 |
|
11.9 |
0.0 |
40–44 |
2,252 |
2,253 |
2,256 |
2,258 |
2,258 |
2,258 |
|
14.0 |
0.0 |
45–49 |
2,620 |
2,620 |
2,621 |
2,624 |
2,625 |
2,625 |
|
0.0 |
28.8 |
50–54 |
2,620 |
2,620 |
2,620 |
2,621 |
2,624 |
2,625 |
|
0.0 |
20.3 |
55–59 |
1,865 |
1,865 |
1,865 |
1,865 |
1,866 |
1,868 |
|
0.0 |
55.1 |
60–64 |
1,486 |
1,486 |
1,487 |
1,487 |
1,487 |
1,487 |
|
0.0 |
52.0 |
65–69 |
666 |
666 |
667 |
667 |
668 |
668 |
|
0.0 |
60.0 |
70–74 |
317 |
318 |
320 |
320 |
320 |
320 |
|
0.0 |
86.0 |
75+ |
194 |
194 |
195 |
195 |
196 |
196 |
|
100.0 |
— |
Total |
14,411 |
14,416 |
14,425 |
14,431 |
14,437 |
14,441 |
|
Women 40+(000s) |
68,357 |
70,197 |
75,265 |
79,633 |
83,888 |
88,583 |
||
|
Number/100K Pop |
21.1 |
20.5 |
19.2 |
18.1 |
17.2 |
16.3 |
||
|
Percent Change (%) |
— |
−2.6 |
−6.7 |
−5.4 |
−5.0 |
−5.3 |
||
|
Cumulative Percent Change (%) |
— |
−2.6 |
−9.1 |
−14.0 |
−18.4 |
−22.7 |
||
TABLE 4–5 Full-Time Equivalent (FTE)a Supply of Radiologic Technologists Performing Mammography: Status Quo Projections for the United States, 2004 to 2025
|
1-Year Additionsb 938 (%) |
5-Year DDRc (%) |
Age Group |
Baseline 2003 |
Year |
||||
|
2005 |
2010 |
2015 |
2020 |
2025 |
||||
|
4.2 |
0.0 |
<25 |
196 |
196 |
197 |
197 |
197 |
197 |
|
25.0 |
0.0 |
25–29 |
1,368 |
1,368 |
1,369 |
1,369 |
1,369 |
1,369 |
|
40.3 |
0.0 |
30–34 |
3,256 |
3,256 |
3,258 |
3,259 |
3,260 |
3,260 |
|
11.2 |
0.0 |
35–39 |
3,782 |
3,781 |
3,781 |
3,783 |
3,784 |
3,785 |
|
16.2 |
0.0 |
40–44 |
4,544 |
4,543 |
4,541 |
4,541 |
4,543 |
4,544 |
|
3.1 |
11.5 |
45–49 |
4,689 |
4,689 |
4,688 |
4,687 |
4,686 |
4,688 |
|
0.0 |
36.5 |
50–54 |
4,150 |
4,150 |
4,150 |
4,149 |
4,148 |
4,147 |
|
0.0 |
56.2 |
55–59 |
2,633 |
2,633 |
2,635 |
2,635 |
2,635 |
2,634 |
|
0.0 |
74.0 |
60–64 |
1,153 |
1,153 |
1,153 |
1,154 |
1,154 |
1,154 |
|
0.0 |
82.5 |
65+ |
364 |
363 |
363 |
363 |
364 |
364 |
|
100.0 |
|
Total |
26,132 |
26,132 |
26,136 |
26,138 |
26,139 |
26,142 |
|
Women 40+(000s) |
68,357 |
70,197 |
75,265 |
79,633 |
83,888 |
88,583 |
||
|
Number/100K Pop |
38.2 |
37.2 |
34.7 |
32.8 |
31.2 |
29.5 |
||
|
Percent Change (%) |
— |
−2.6 |
−6.7 |
−5.5 |
−5.1 |
−5.3 |
||
|
Cumulative Percent Change (%) |
— |
−2.6 |
−9.2 |
−14.1 |
−18.5 |
−22.8 |
||
|
a FTE=(mammography is 1st specialty)*1.0+(mammography is 2nd specialty)*0.5. b New RTs added ever year to maintain new entrant counts, estimated; percentages represent estimated allocation of new practitioners by age group. c Rate of deaths, departures, and retirements (for 5-year groups), estimated; percentages represent estimated percentages of an age cohort that will retire, die, or otherwise depart from practice in a 5-year interval. NOTE: Assumes constant introduction of new RTs performing mammography, constant rate of departure of RTs performing mammography, and increasing numbers of women 40 and older, per U.S. Census Bureau projections. SOURCES: Derived from ASRT (2004a), Wing (2005), and U.S. Census Bureau (2004). |
||||||||
number of RTs performing mammography would increase at about the same rate as the number of women 40 and older.
Measures proposed later in this chapter intended to increase the number of new entrants to the field of breast imaging, to retain the current mammography workforce, and to increase productivity of new and existing practitioners could improve future access to mammography. However, a predicted impending shortage of all physicians and the nation’s lack of capacity to expand medical class sizes may severely restrict growth in thenumber of interpreting physicians for several years to come (Cooper et al., 2003; RSNA, 2004b). Moreover, the field appears poised to experience a net loss of practitioners because more than half of radiologists interpreting mammograms are older than age 50 (Sunshine et al., 2004a; Smith-Bindman et al., 2005). This possibility is alarming, given simultaneous demographic trends that promise to increase demand for breast imaging over the next two decades.
The availability of sufficient mammography facilities and equipment to meet demand may also be a concern. In Florida, mammogram equipment capacity was estimated to be capable of serving 3.4 million women per year in 2004, but 3.3 million women were
expected to receive mammograms that year (The Florida Legislature: Office of Program Policy Analysis & Government Accountability, 2004). If demographic and compliance trends in that state continue, demand for mammograms is expected to exceed machine capacity by 2006.
Although a decline in mammography utilization rates over the next two decades appears unlikely, changes in recommended screening interval could reduce demand. Consensus does not exist as to the optimal screening interval (Smith et al., 2003). Several analyses indicate that shorter screening intervals for women aged 40 to 49 improve cancer detection at an earlier stage (which is associated with lower mortality), but offer no such advantage for older women (Jansen and Zoetelief, 1997; Duffy et al., 1997; White et al., 2004; Aiello et al., 2005).
If the hoped-for development of methods to predict breast cancer risk on an individual basis became reality, it could allow the relatively large number of women at low risk to be screened less frequently (IOM, 2005). On the other hand, several factors, discussed below, could raise future demand for mammography and associated breast imaging services. These include the increased use of additional breast imaging technologies, as well as potential changes in MQSA to increase continuing experience (minimum volume) requirements or to require double reading for all screening mammograms. These sorts of changes could move the current fragile stability of the breast imaging workforce toward a crisis.
Increasing Use of Additional Breast Imaging Technologies
If compliance rates for regular mammograms among women over age 40, estimated at 64 percent in 2002 (Centers for Disease Control and Prevention, 2002), increase, not only will demand for mammography rise accordingly, but also for other follow-up breast imaging services and interventional procedures. For example, about half of women recalled for additional imaging are examined by ultrasound. These trends are illustrated in workforce burden estimates, based on several outcome surveys of women with positive mammograms, as shown in Table 4–6 and Figure 4–2. According to the SBI survey, core biopsy and stereotactic core biopsy were offered, respectively, by 89 percent and 79 percent of responding breast imaging practices; 17 percent of practices stated they performed same-day core biopsies (Farria et al., in press).
In addition, a variety of other breast imaging technologies are increasingly employed to complement mammography. Some facilities are beginning to offer women at high risk other nonmammography screening tests for breast cancer, even though that is not currently recommended as the standard of care in any breast screening guidelines. Initial studies on these technologies are fueling demand. For example, 35 percent of the breast imaging practices that responded to the 2003 SBI survey reported that they offered screening ultrasound—more than twice as many as in 2000 (Farria et al., in press). Ultrasound imaging is offered in addition to a mammogram and must be correlated with it, and ultrasound images require more elaborate, real-time interpretation than a mammogram. Moreover, a small percentage of ultrasound results lead to additional, time-consuming procedures such as biopsies that might not have been suggested by mammography alone.
The SBI survey also found that 12 percent of breast imaging practices offered MRI screening, and 51 percent offered diagnostic MR (Farria et al., in press). Like ultrasound, MR images reportedly take significantly longer to interpret than a mammogram;
TABLE 4–6 Estimate of Workforce Burden Subsequent to Screening Mammography
|
Service |
Percentage of Women Screened Ages 40–79 (%) |
Procedures per 1,000 Screening Mammograms |
Sourcea |
|
Diagnostic mammography |
|||
|
Call backs |
7.2 |
72 |
Sickles et al. (in press) |
|
Short-term follow-ups |
5.0 |
50 |
Yasmeen et al. (2003) |
|
Ultrasound |
|||
|
Call backs |
3.6 |
36 |
Sickles et al. (in press) |
|
Short-term follow-ups |
2.5 |
25 |
Yasmeen et al. (2003) |
|
Biopsy |
|||
|
Call backs |
1.0 |
10 |
Sickles et al. (in press) |
|
Short-term follow-ups |
0.25 |
2.50 |
Yasmeen et al. (2003) |
|
a Primary source: Personal communication, B.Monsees, M.D., Washington University in St. Louis, October 19, 2004. |
|||
MR also requires additional staffing and frequently leads to second-look ultrasound imaging. Demand for MR is likely to increase in response to recent reports of its superior sensitivity for detecting abnormalities that strengthened the case for its limited use in high-risk8 populations of women (Liberman et al., 2003; Kriege et al., 2004; Warner et al, 2004).
Despite the fact that the value of these technologies for breast cancer screening has yet to be confirmed (Kopans, 2004; Lee, 2004; Irwig et al., 2004), demand for nonmammographic breast imaging services has driven insurance coverage in some cases, especially in the northeastern United States.9 MR imaging is more costly than mammography (Table 4–7). Although data are currently limited on the number of facilities offering these services and the number of women receiving them, the Committee expects that increasingly significant downstream costs and workforce burden will result from MR false positives. For example, Liberman et al. (2003) found that 24 percent of the high-risk women10 in their study received a “probably benign” interpretation at their first breast MR imaging screening exams. Of the nearly 80 percent of these women who underwent the recommended follow-up MRI (within an average of 11 months), only about 10 percent were found to have malignancy in the area initially judged to be “probably benign.”
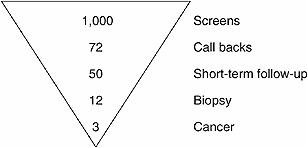
FIGURE 4–2 Simplified screening mammogram outcome pyramid. For every 1,000 mammograms, 72 individuals are recalled for additional imaging, 50 individuals are told to return in three months for a follow-up exam, 12 individuals are recommended for biopsy, and 3 individuals will be diagnosed with breast cancer.
SOURCES: Sickles et al. (in press); Personal communication, B.Monsees, M.D., Washington University in St. Louis, October 19, 2004. Adapted from Helvie (2004).
The Committee expressed concern that the publicity surrounding studies of MR use in high-risk women, as well as the relatively high rate of reimbursement for this procedure as compared with mammography, could lead to the inappropriate use of MR in breast imaging.
Even the hoped-for time savings conferred by digital mammography and computer-aided detection (CAD) appear to be elusive. A recent study conducted by researchers at Michigan State University found that on average, radiologists spent nearly twice as long interpreting a digital screening mammogram as compared with a film image; moreover, this difference persisted even after approximately 2 years of experience with digital mammography (Aben et al., 2004). Another recent study found that use of CAD did not shorten the amount of time required to read films (Taplin et al., submitted).
Potential Impact of Changes to MQSA Continuing Experience Requirements
The distribution of radiologists’ volumes of mammogram interpretation in 2003, shown in Figure 4–1, was used to determine the effect of increasing the continuing experience (minimum volume) requirement from the current minimum of 960 mammograms every 24 months to either 1,000 or 2,000 mammograms per year. Raising the minimum interpretation volume to 1,000 mammograms per year would affect about 4,000 radiologists (25 percent of all practitioners) who interpreted approximately 6 percent of all mammograms performed in 2003 (Wing, 2005). If the minimum were raised to 2,000 mammograms per year, the change would affect about 8,700 radiologists (54 percent of all practitioners) who accounted for approximately 23 percent of all mammograms interpreted in 2003.
TABLE 4–7 Medicare Reimbursement for Selected Radiology Procedures, 2005
Because the percentages of radiologists interpreting high and low volumes of mammograms are not evenly distributed across the United States, these averages cannot reflect the potential local impacts of increasing the minimum volume requirement for mammogram interpretation. The data presented in Table 4–8, which displays radiologists’ interpretation volumes according to their location in a large or small city, their respective suburbs, or in a nonmetropolitan area, was therefore used to predict the impact of increased interpretation volume requirements on different types of communities. These
TABLE 4–8 Percentages of Radiologists Interpreting Mammograms and Mammograms by Type of Location, 2003
|
Type of Location |
Percent of Radiologists Interpreting Different Volumes of Mammograms (%) |
Percent of Mammograms Interpreted by Radiologists with Different Volumes of Mammograms (%) |
||||||||
|
<480 |
480–1000 |
1000–2000 |
2000–5000 |
5000+ |
<480 |
480–1000 |
1000–2000 |
2000–5000 |
5000+ |
|
|
All Locations |
6.5 |
18.2 |
29.3 |
34.2 |
11.7 |
0.8 |
5.2 |
16.8 |
40.4 |
36.8 |
|
Large Metro City |
5.0 |
22.3 |
21.6 |
30.1 |
21.0 |
0.6 |
4.9 |
9.6 |
29.7 |
55.2 |
|
Large Metro Suburb |
7.2 |
14.3 |
35.6 |
32.7 |
10.2 |
0.9 |
4.2 |
20.5 |
41.4 |
33.0 |
|
Small Metro City |
5.9 |
15.3 |
26.2 |
37.7 |
14.9 |
0.8 |
3.8 |
13.4 |
40.3 |
41.7 |
|
Small Metro Suburb |
14.1 |
22.7 |
23.8 |
32.0 |
7.4 |
1.9 |
7.6 |
16.4 |
42.9 |
31.2 |
|
Non-Metro |
5.2 |
19.5 |
38.7 |
33.4 |
3.3 |
0.8 |
7.8 |
30.5 |
49.4 |
11.6 |
|
SOURCE: Derived from Sunshine et al. (2004a) and Wing (2005). |
||||||||||
findings, and possible means to address the potential impacts they predict, are discussed in the next section of this chapter.
Potential Impact of Adding a Requirement for Double Reading
A model was also used to predict the effects of requiring every mammogram to be read by two different interpreting physicians. As shown in Table 4–9 (a, b), an increase in the current workforce of radiologists interpreting mammograms, or an increase in the number of mammograms read by interpreting physicians, or both, will be needed to implement double reading of mammograms in the United States. The magnitude of the need for an increased workforce or greater productivity will depend on the number of facilities currently performing double reads (a number that is not readily available) and the method of double reading used. If the second reading of a mammogram takes approximately half as long as the initial read, then the equivalent of as many as 7,000 interpreting physicians reading the current average volume of mammograms would be required to meet this demand. This increased demand could be met by greatly increasing the volume of mammograms read by the current pool of interpreting physicians and/or by recruiting a large number of new interpreting physicians. In any case, only large increases in the interpretive workforce or in physicians’ productivity in reading mammograms could enable such a change to occur.
ADDRESSING UNDERSERVED COMMUNITIES
A nationwide shortfall in the mammography workforce is likely to further restrict low-income women’s already limited access to mammography, particularly in under-served communities. Analysis of the distribution of interpreting physicians among dif-ferment types of communities identifies areas that are especially vulnerable to such ef-
TABLE 4–9 Estimated Numbers of New Radiologists Needed to Implement Double Reads on All Mammograms, Assuming Constant Average Volume for Interpreting Physicians: (A) Assuming Second Reads Are Blind and Thus Require Reading Time Equivalent to the First Read, and (B) For Different Assumptions About Time Required for Second Reads
fects, and informs strategies, such as those described below, to improve access to mammography for underserved communities and individuals.
Distribution of Interpreting Physicians
Based on data obtained from the 2003 ACR survey, Sunshine and coworkers (2004a) examined the distribution of interpreting physicians among 5 different types of
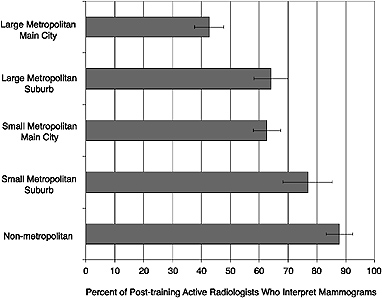
FIGURE 4–3 Percentage of radiologists who interpret mammograms in different community settings, by degree of urbanness. Figure demonstrates the percentage of all radiologists in a given geographic setting who interpret mammograms. For example, approximately 86 percent of all radiologists practicing in nonmetropolitan areas read mammograms, as compared with approximately 42 percent of all radiologists practicing in the main city of large metropolitan areas. NOTE: Error bars represent 95 percent confidence intervals.
SOURCE: Sunshine et al. (2004a).
communities: “large metropolitan main city” (total area population of 1 million or more), “large metropolitan suburb” (total area population of 1 million or more), “small metropolitan main city” (total area population greater than 50,000 but less than 1 million), “small metropolitan suburb” (total area population greater than 50,000 but less than 1 million), and “nonmetropolitan area” (total area population of 50,000 or less, and rural). Figure 4–3 shows the percentage of U.S. radiologists who interpret mammograms working in each of these community types. This analysis indicates that large metropolitan main cities have significantly fewer interpreting physicians per 1,000 women than do other types of communities, a finding that may reflect greater specialization among urban radiologists. Small metropolitan suburb and nonmetropolitan areas appear to have significantly higher percentages of interpreting physicians than do other types of communities.
Figure 4–4 shows the number of interpreting physicians in each community type per 10,000 women aged 40 and older. The authors (Sunshine et al., 2004a) suspect that the pronounced spike in this otherwise roughly equal distribution reflects a combination of confusion on the part of survey respondents regarding the definition of community types (i.e., the difference between a small metropolitan city and a suburb) and a pattern of residents of crossing boundaries to obtain services. Further refinement of these models
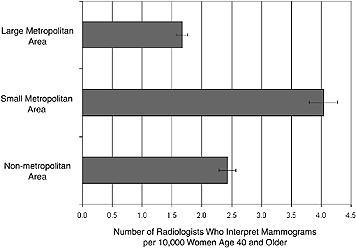
FIGURE 4–4 Number of radiologists who interpret mammograms per 10,000 women aged 40 and older in different communities, by degree of urbanness. In a large metropolitan setting, there are approximately 1.7 radiologists who interpret mammograms per 10,000 women. In small metropolitan and nonmetropolitan settings, there are 4.0 and 2.4 radiologists interpreting mammograms per 10,000 women, respectively.
NOTE: Error bars represent 95 percent confidence intervals.
SOURCE: Sunshine et al. (2004a).
will be necessary to gain a detailed picture of patterns of mammography service availability in U.S. communities.
The authors also examined access to mammography on a regional basis. In comparisons of three measures (percentages of total radiologists; number of radiologists interpreting mammograms per 10,000 women aged 40 and older; and average or median number of mammograms interpreted), no significant differences were found among four U.S. Census regions (Northeast, South, Midwest, West). This suggests that if there is indeed unequal access to mammography, it occurs within geographic regions, at the community level.
Effects of Increased Interpretation Volume on Access to Mammography
Any change in access resulting from an increase in MQSA-mandated continuing experience (minimum volume) requirement for interpreting physicians would be imposed upon the patterns of access to mammography identified above. To analyze such potential interactions, Wing (2005) combined the community-based data described above with the volume distribution data shown in Figure 4–1 to produce Table 4–8 (Wing, 2005).
The results of these calculations indicate that the impact of increasing the annual minimum volume to 1,000 would be greatest for radiologists in the suburbs of small met-
ropolitan areas. If such a change occurred, nearly 37 percent of the radiologists currently reading mammograms in these communities would have to increase their volume or stop interpreting mammograms. Under the same circumstances, 27 percent of mammography radiologists in large metropolitan cities would have to increase their volume or stop interpreting mammograms. These two groups of physicians respectively interpret about 10 and 6 percent of mammograms within their community types. Their current annual volume of mammograms could be interpreted by an additional 267 radiologists in small metropolitan suburbs and 478 radiologists in large metropolitan cities interpreting 1,000 mammograms per year, or by an increase in volume to 1,000 mammograms per year by about half of the 513 radiologists in small metropolitan suburbs and the 836 radiologists in large metropolitan cities who now interpret fewer than 1,000 mammograms per year.
By contrast, if the annual volume requirement were increased to 2,000 mammograms per year, the model predicts that the greatest impact would occur in nonmetropolitan areas, closely followed by the suburbs of small metropolitan areas (Wing, 2005). About 63 percent of radiologists in nonmetropolitan areas interpreting mammograms, and 61 percent in the suburbs of small metropolitan areas, would have to increase their volume to meet this requirement or stop interpreting mammograms. These two groups of physicians respectively interpret about 40 and 26 percent of mammograms within their community types. Their current annual volume of mammograms could be interpreted by an additional 1,166 radiologists in nonmetropolitan areas and 657 radiologists in small metropolitan suburbs interpreting 2,000 per year, or by an increase in volume to 2,000 mammograms per year by about half of the 2,118 radiologists in nonmetropolitan areas and the 846 radiologists in small metropolitan suburbs who now interpret fewer than 2,000 mammograms per year.
Strategies to Improve Mammography Access and Use
Telemammography, mobile mammography facilities, and centralized interpretation of mammograms have all been proposed as ways to increase access to screening mammography in remote or otherwise underserved communities. Existing examples of these models of mammography delivery can inform the design of national or regional programs to serve communities that may lose access. However, it is important to note that, unlike screening mammography, breast cancer diagnosis is not readily adaptable to remote exams. While the strategies described below offer greater access to screening mammograms, women may still have to travel long distances to a central facility for follow-up procedures, including biopsies, as well as for treatment. Moreover, access to mammography is not only a function of supply of facilities and physicians. As noted previously, lack of health coverage is a key factor in limiting access to mammography.
Telemammography
By the late 1990s, a variety of institutions, including teaching hospitals, medical schools, and the U.S. Army and Navy, had developed telemammography or teleradiology networks. In 1999, researchers at the National Cancer Institute (NCI) and the National Institutes of Health’s Center for Information Technology launched a telemedicine system capable of transmitting diagnostic-quality radiology and pathology images (Michalowski, 2003). The system, called TELESYNERGY®, was subsequently expanded to 18 U.S. and
4 international sites. It was used for the first time in Belfast, Northern Ireland, in early 2003 to permit consultation with NCI physicians on a treatment plan for a patient with a rare form of leukemia. The U.S. Air Force, in anticipation of losing half of its radiology staff between 2002 and 2005, has developed a network that links radiologists at eight stateside hospitals operated by the U.S. military with eight overseas hospitals (as of April 2003) (Brewin, 2003). According to an Air Force spokesperson, teleradiology “will not fix the shortage, but it will make maximum use of the radiologists we currently have” (Trevino, 2003).
Mobile Mammography
Mobile mammography programs, some of which have existed for nearly two decades, serve women with limited mobility, including those living on farms and in small, remote communities. One such program, based in Rapid City, South Dakota, since 1985, provides screening mammograms for women in small towns and on Indian reservations throughout central and western South Dakota, and in some sites in Wyoming, Montana, and Nebraska.11,12 A radio logic technologist, accompanied by an assistant who handles paperwork, drives the mammography machine in a converted minivan to sites such as community centers, houses of worship, and nursing homes, traveling an average of 32,000 miles per year. The machine is unloaded and mammograms are performed within the premises; afterward, the films are stored for the journey back to the Rapid City facility, where they are developed and interpreted. If additional views or diagnostic mammograms are indicated, patients must travel to Rapid City. This service, which generally operates 4 days per week, 51 weeks per year, provided screening mammograms for more than 3,400 women in 2003.
Mobile digital mammography programs are also underway, but presently cannot match the transportability and comparatively low cost of services based on film mammography. Until a truly portable digital mammography machine is developed—one that can withstand being driven over unpaved roads and repeated loading and unloading from a van—mobile digital mammography must be performed in comparatively large mobile clinics built from large recreational vehicles, buses, or trucks. A Canadian program that has provided both screening and diagnostic mammography to sparsely populated underserved areas in Northern Ontario for more than 10 years is attempting to fund a conversion to digital mammography.13 The service presently operates aboard a converted bus. Films are returned to a central facility to be processed and interpreted—steps that could be eliminated by establishing a digital telemammography link on the bus.
Centralized and “Decentralized” Interpretation
Centralized facilities could permit expert interpretation, including second readings, of either films or digitized data collected at several remote locations (Shtern and Winfield, 1999; Michalowski, 2003). In France, for example, the Association pour le
Dépistage des Maladies du Sein (ADEMAS) program has provided free mammography screening to women between the ages of 50 and 65 in the Strasbourg administrative regions and in surrounding small towns and rural areas since 1989 (Gairard et al., 1992; Renaud et al., 1994). This “decentralized” program was designed to accommodate existing patterns of service delivery predominated by private-practice radiologists, the lack of reliable population registries, and an apparent reluctance on the part of general practitioners to encourage women to obtain mammograms. Women aged 50 to 65 present themselves for testing every 2 years to an authorized radiologist, who performs a single external oblique mediolateral view of each entire breast (Gairard et al., 1992). After interpreting the mammogram, the radiologist sends it to a coordinating center, where it receives a second reading (and a third as well if the first two readings differ). The coordinating center also oversees regular quality control inspections of all participating mammography facilities (Maccia et al., 1995).
The success of the ADEMAS program led to the establishment of additional regional mammography programs and eventually to the creation of a national breast cancer screening protocol in France (Gairard et al., 1997). However, the cost-effectiveness of this decentralized program has been shown to be significantly less than of that of truly centralized breast cancer screening programs in other European countries (in which all screening and interpretation take place in centralized facilities) (Wait et al., 2000). A 1997 comparison of one of the French regional programs with a similar, but centralized, program in the United Kingdom also found lower compliance and cancer detection rates in the French program (McCann et al., 1997).
In some U.S. medical facilities, screening mammograms are performed by an RT who then sends the films by overnight delivery to a radiologist in another location for interpretation. Under current MQSA regulations, such remote facilities must be overseen by an offsite lead interpreting physician. In such cases, problems with quality should be readily apparent in the films, and can be corrected through clear communication with the RTs onsite.14 Under such circumstances, the Committee notes, it might be feasible to allow a radiologist assistant (see Box 4-1) to take on this aspect of MQSA facility oversight.
FACTORS LIMITING THE SUPPLY OF INTERPRETING PHYSICIANS
Breast imaging specialists generally consider their chosen field to be challenging, diverse, and interesting, but they interpret less than 12 percent of mammograms in the United States; most are read by general radiologists.15 FDA regulations do not require interpreting physicians to be radiologists, but most are. Generally the non-radiologists who read mammograms are breast surgeons or OB/GYNs. Other types of non-breast imaging data are often interpreted by orthopedic surgeons, cardiologists, and neurologists. Nevertheless, due to a combination of factors discussed below, the interpretation of mammograms is performed primarily by radiologists. These same factors influence radiologists in their choice of a specially.
Few Residents Choose Breast Imaging
As trainees in radiology, residents spend 1 postgraduate year in clinical internships and 4 years in formal radiology training before they are Radiology Board eligible (American Board of Radiology, 2004). If a subspecialty is chosen, most train for an additional 1 to 2 years in that field. Radiology trainees who choose to subspecialize typically select their field during the course of their residency and pursue postresidency fellowships in order to train in that subspecialty. In addition to individual interests, market demands often influence the choice of a subspecialty, as residents tend to pursue fields that will allow them to obtain the best possible position.
A national radiology fellowship match program began in 2003 (Arenson, 2004). Most programs participated in a match for fellowships in July 2004, at which a total of 358 programs offered 769 positions in 9 categories. Fifty-three percent of these positions were filled in the match; however, in breast/women’s imaging, only 12 of 48 positions (25 percent) were filled. A follow-up survey on the program conducted by the Society for the Chairmen of Academic Radiology Departments revealed that some positions for all categories were filled outside the match, and others went to inside candidates who did not participate in the match. After adjusting for these events, the success rate for breast/women’s imaging in this initial match ranked eighth out of nine subspecialties, exceeding only pediatric radiology.
Several factors, some interrelated, have been noted by radiology residents as factors that dissuaded them from specializing in breast imaging, or even from choosing positions that will involve interpreting mammograms. A survey, conducted in 2000, of 211 radiology residents in 211 accredited radiology residencies in the United States and Canada found that although 65 percent of residents believed mammograms should be interpreted by breast imaging subspecialists, most wouldn’t consider doing a fellowship in breast imaging (Bassett et al., 2003). Only 29 percent of residents agreed that they would like to spend at least 25 percent of their time interpreting mammograms when in practice. Those who said they wanted to spend little or no time interpreting mammograms chose the following explanations for their preference: that mammography was not an interesting enough field (45 percent); that they feared lawsuits (37 percent); and that interpreting mammograms was too stressful (19 percent). Twelve percent of respondents reported that they were disinclined to interpret mammograms because the field is “female dominated.” This is in fact the case: Although radiology remains a male-dominated specialty, female radiologists—particularly among radiologists under age 45—are significantly more likely to interpret mammograms than their male counterparts. In addition, among radiologists who interpret mammograms, the median number of mammograms read by female radiologists is significantly higher than for male radiologists (Sunshine et al., 2004a).
When asked to compare interpreting a diagnostic mammogram with CT of the abdomen with contrast, 70 percent said they would be more concerned about missing a potentially important finding on a diagnostic mammogram than on a CT exam, and 93 percent said they would be more concerned about malpractice liability associated with diagnostic mammography as compared with other types of imaging examinations (Bassett et al., 2003). Eighty-two percent of residents rated stress associated with possible misdiagnosis as higher for diagnostic mammography as compared with interpreting other types of imaging examinations.
Factors That Deter Mammogram Interpretation by General Radiologists
According to the 2003 ACR survey, radiologists who interpret mammograms enjoy practicing medicine as much as radiologists who do not interpret mammograms (Sunshine et al., 2004a). Nevertheless, some general radiologists may find that reading large volumes of screening mammograms is tedious, especially when only a small fraction of screening mammograms identifies a woman with breast cancer. There is also the significant possibility that some cancers will be missed. As detailed in Chapter 2 (see section on “Factors Affecting Interpretive Performance”), mammograms are among the most challenging images to interpret. Abnormalities can be very subtle, and a missed cancer in a screening mammogram of an asymptomatic woman may not be clinically evident for several years. By contrast, most radiologic examinations of other areas of the body are ordered to evaluate symptomatic patients, so a false-negative result or an error in interpretation is more likely to be pursued.
A variety of factors raise public expectations for mammography as compared with other radiologic procedures. Although most imaging procedures are used for diagnosis, mammography is used to screen a large segment of the population. In addition, many women are especially fearful of breast cancer. Results of a recent survey by the American Heart Association found that women incorrectly perceive their risk of dying from breast cancer to be greater than their risk of dying from heart disease (American Heart Association, 2000; Mosca et al., 2004). In response to such concerns, 14 percent of breast imaging facilities offer online interpretation of mammograms (films are interpreted immediately, rather than batch read later), although it is not medically necessary (Farria et al., in press). A retrospective study of women who had received false-positive mammogram results found that those who obtained an immediate onsite diagnostic evaluation experienced less stress on average than those who received their results later and had to return for a diagnostic workup (Lindfors et al., 2001). However, it is also interesting to note that a similar survey-based study found that more women prefer to have their mammograms receive a double reading, despite a delay in receiving the result, than to have their films interpreted immediately, but only once, by an onsite physician (Hulka et al., 1997).
In the highly charged atmosphere surrounding mammography, it is perhaps not surprising that interpreting physicians are the most frequently named parties in lawsuits concerning missed breast cancer diagnoses (Physician Insurers Association of America, 2002). For example, 55 percent of breast imaging practices that responded to a 2003 Society of Breast Imaging survey of more than 550 U.S. practices reported involvement in at least one lawsuit during the previous 5 years (Farria et al., in press). National data indicate that the costs of settlements and judgments in mammography cases nearly doubled between 1995 and 2002, to reach an average of $346,000.16
Being found liable for misinterpreting a mammogram usually increases radiologists’ malpractice insurance premiums. It can also limit the number of malpractice insurance companies willing to insure the radiologists to the point where some cannot afford or are able to acquire malpractice insurance. In addition, a previous malpractice claim against a radiologist can render the physician ineligible to contract with a managed care
organization or lead to severance of medical hospital staff credentialing (Berlin, 2003). A number of states also now post information regarding medical malpractice settlements and awards in publicly accessible Internet databases (Adams, 2003) (for more detail on medical malpractice issues, see Chapter 5).
Given the risk of missing a cancer and the possibility that such an oversight can lead to a lawsuit, it is perhaps not surprising that some radiologists and residents are reluctant to interpret mammograms. Twenty-seven percent of respondents to the 2003 SBI survey indicated that the threat of lawsuits decreased their willingness to do breast imaging, and 50 percent believed that this threat made staffing their practices more difficult (Farria et al., in press). Responding breast imagers ranked malpractice lawsuits the top factor deterring potential fellows from entering breast imaging, followed by stress, regulation, and low salary. Each of these factors was identified by more than 60 percent of respondents; malpractice was cited by 93 percent of respondents.
Another survey of practicing radiologists (Elmore et al., in press) also indicates that medicolegal liability is a common concern. This cross-sectional study found that approximately half (53 percent) of the radiologists reported a prior medical malpractice claim, with 18 out of 124 reporting mammography-related claims.17 Radiologists who were older and those who had more years in clinical practice were both significantly more likely to report a prior medical malpractice claim, which may be due to the level of exposure over time to lawsuits. The majority of radiologists sued (81 percent) reported the experience to be very or extremely stressful. Three out of four radiologists (76 percent) either agreed or strongly agreed that they are concerned about the impact medical malpractice is having on their practice of mammography. In addition, about one-quarter of radiologists surveyed said they considered withdrawing from interpreting mammograms at least on a monthly basis, and 16 percent considered withdrawing weekly or daily because of concerns about malpractice (Elmore et al., in press). Among those thinking about leaving mammography on a daily, weekly, or monthly basis, there was no difference by age categories (35–44, 45–54, 55+). Radiologists more frequently considered withdrawing from mammography than from the practice of general radiology.
Nonetheless, radiologists’ perceptions of malpractice risk appear to be somewhat inflated. Radiologists in the Elmore study reported that if in the next 5 years they were to interpret mammograms full-time, the majority (90 percent) estimated a probability of greater than 10 percent that they would be sued, with 56 percent estimating the probability as greater than 30 percent (Elmore et al., in press). In actuality, among radiologists who had been practicing for at least 5 years, only 9 percent reported a mammography-related claim filed against them from 1997 to 2001. The majority of radiologists with a previous mammography-related malpractice suit thought their probability of being sued in the next 5 years was 50 percent or higher. The majority of radiologists (61 percent) who consider leaving mammography on a monthly, weekly, or daily basis thought their probability of being sued in the next 5 years was 50 percent or higher.
Federal regulation and state oversight of mammography services were also cited by 73 percent of respondents to the 2003 SBI survey as a disincentive to specialize in breast imaging (Farria et al., in press). Unlike other subspecialists in radiology, interpreting physicians must meet federal requirements, and they must regularly provide evidence of compliance. Financial and time considerations associated with that oversight historically have not been reimbursed.
Another factor commonly cited by radiologists as a disincentive to mammographic interpretation is the lower rate of reimbursement compared to rates for interpreting other images (see Box 4-3 and Table 4–7). Reimbursement for interpreting screening mammograms is lower than that for several other radiological procedures, the majority of which are diagnostic examinations. For example, a radiologist who receives a professional reimbursement of $36.38 from Medicare for interpreting screening mammography would receive the same amount for interpreting a unilateral diagnostic mammogram, $84.51 for interpreting a unilateral breast MRI, and $123.17 for interpreting a brain MRI with and without contrast. Interpreting physicians in hospital practices receive only this professional component of reimbursement; the hospital receives an additional sum, the technical component of reimbursement, to compensate for all other costs related to the procedure (see Table 4–7). Interpreting physicians in private practice receive both the professional and technical components of Medicare reimbursement, and may be able to retain some of the technical reimbursement after paying staff and overhead if their practice costs are lower than those of a hospital.18
In addition, hospitals typically see a larger proportion of Medicare recipients than do private practices, which may refuse or cap the number of such relatively unprofitable patients.19 Teaching hospitals appear to be especially disadvantaged because they also tend to see a higher proportion of women seeking second opinions and those with difficult diagnoses, and are therefore likely to conduct a larger proportion of diagnostic mammograms as compared with community facilities (IOM, 2005). A financial analysis of seven university-based mammography programs conducted in 1997 and 1998 determined that all incurred financial losses, which were largely attributed to diagnostic mammography, in the professional component of reimbursement (Enzmann et al., 2001). Although Medicare only covers a portion of the women who undergo mammography, the above comparisons are informative because private insurers often use Medicare reimbursement rates as a reference when setting their own rates. However, reimbursement for mammography is far from uniform, and is most profoundly influenced by the patient’s insurance status. Recent calculations performed for the Florida mammography accessibility study found that the average total fee for a screening mammogram in that state varies from $167 for women with private insurance, to $106 for uninsured women (out-of-pocket expense), to $89 for women on Medicare, to $46 for women on Medicaid (The Florida Legislature: Office of Program Policy Analysis & Government Accountability, 2004). Such disparities in reimbursement undoubtedly influence the accessibility of mammography for low-income women and the geographic accessibility of mammography to all women who live in communities with significant low-income populations.
|
BOX 4–3 Medicare Physician Fee Schedule Overview From the time of Medicare’s implementation in 1966 until 1992, the reasonable charge payment method was used to reimburse physicians for services provided to Medicare recipients. In 1992, due to rising costs and wide variations in payments, the reasonable charge system was replaced by the physician fee schedule. The physician fee schedule consists of three parts: relative value, geographic adjustment, and conversion factor. Relative Value: The Current Procedural Terminology (CRT) manual, published by the American Medical Association, assigns a code to every medical procedure performed by physicians. Medicare assigns each CRT code a numerical relative value unit (RVU). The RVU for a service compares the relative work for a physician performing that service to the work involved with providing other services. These comparisons are made through the use of the resource-based relative value scale (RBRVS). The RVU for each service is divided into three components: physician work, practice expense, and malpractice expense. Each component is assigned a separate numerical RVU. The physician work component measures the time, mental and technical skill, and stress involved with performing a service. The practice expense component measures office expenses, and varies based on site of service; either a facility (inpatient or outpatient hospital settings, emergency rooms, skilled nursing facilities, or ambulatory surgical centers) or nonfacility setting payment applies. The malpractice expense component measures the average insurance costs for a service; estimates are derived from malpractice premiums data. Radiology services are further divided into technical and professional components, enabling more accurate payment for each aspect of a service provided. For example, a screening mammogram performed in a hospital outpatient setting is billed separately by component: The hospital receives payment for the technical component of service, while the physician receives reimbursement for the professional component of service. The sum of the professional and technical components equals the global RVU, billed when one entity provides both components of a service. The Relative Value Scale (RVS) Update Committee (RUC), composed of representatives from medical associations and specialty societies, advises the Centers for Medicare and Medicaid Services (CMS) annually on potential improvements to the RVS system. Although the RVS generally remains unchanged each year, CMS uses the RUC recommendations in its statutorily required comprehensive 5-year review. Geographic Adjustment: To account for cost variations across geographic regions, CMS derived the geographic practice cost index (GPCI). There are currently 92 geographic regions defined by CMS. A separate GPCI is calculated for each component of the RVU; to obtain a single, geographically indexed RVU for a service, the three RVU components are multiplied by their respective GPCI values, and then summed. Conversion Factor: Converting a geographically indexed RVU to a reimbursement dollar value requires use of a conversion factor. There is a single conversion factor for all ser- |
|
vices. This dollar figure is adjusted annually by CMS to ensure that reimbursement levels match current market expenses; the conversion factor for 2005 is set at $37.897. Mammography and Medicare The history of reimbursement for mammography services through Medicare is complex, having undergone numerous revisions in the past decade. The most important changes that lead to the current reimbursement system are discussed below. Screening Mammography: Reimbursement for screening mammography was initially set by congressional mandate. This flat reimbursement rate applied nationwide, regardless of site of service or geographic location. Passage of H.R. 4577 in December 2000 placed screening mammography within the purview of the Medicare physician fee schedule as of January 1, 2002. The Hospital Outpatient Prospective Payment System (OPPS): Until recently, the technical component of screening and diagnostic mammography performed in a hospital outpatient department setting was paid under OPPS, not the Medicare physician fee schedule. OPPS was devised by CMS to standardize payment for the technical component of hospital outpatient services. Reimbursement for the technical component of mammography under OPPS was seen as artificially low based on a cost survey conducted by the ACR. Legislation passed by the 108th Congress excluded mammography services from payment under OPPS, thereby placing such services under the physician fee schedule as of January 1, 2005. This statutory change is expected to increase the reimbursement rate for mammography procedures performed in the hospital outpatient setting. Emerging Technologies: Digital screening and diagnostic mammography procedures have been reimbursed through Medicare since January 1, 2002. Historically, digital mammography has been reimbursed at a higher rate than its analog counterpart, largely due to higher associated operation costs. Computer-aided detection (CAD) technology is used on both film-screen and digital mammograms to facilitate interpretation. CAD has been reimbursed under the physician fee schedule as an add-on payment for screening and diagnostic mammography services since January 2004. In contrast, there is no add-on payment for double reading. 2005 Mammography Reimbursement: As of January 1, 2005, payment for both screening and diagnostic mammography services, regardless of practice setting, is provided through the physician fee schedule. The Medicare Physician Fee Schedule for 2005 was published in the Federal Register on November 15, 2004. Table 4–7 displays the most common mammography CPT codes, and associated reimbursement rates for 2005. SOURCES: Odle (2003); Congressional Research Service (2003); Thorwarth and Borgstede (2001); Linver (2002); Pub. L. No. 106–554; CMS (2004a); Farria and Feig (2000). |
Thus it is apparent that for some radiology and/or breast imaging practices, particularly hospital programs with a large proportion of patients without private insurance, mammograms may generate only marginal earnings. Under such circumstances, mammography may be regarded as a drain on a practice’s profits; this negative perception may be exacerbated if obtaining malpractice insurance is difficult, or if premiums are increased because the practice provides mammography services. Among other issues relasted to malpractice insurance, which are discussed in detail in Chapter 5, tail coverage20 for interpreting physicians may be especially expensive or hard to obtain because cancer occurrences may take years to become evident after a negative mammogram.
STRATEGIES TO ENSURE AN ADEQUATE MAMMOGRAPHY WORKFORCE
Improvements in breast imaging technology, as well as in the delivery of cancer screening services, could perhaps increase women’s access to breast cancer screening in the future (IOM, 2005). Unfortunately, as indicated by the U.S. workforce projections described earlier in this chapter, it is unlikely that these benefits will arrive in time to prevent an impending shortage of interpreting physicians and mammography RTs who perform mammography. Three basic strategies could be used to ensure an adequate breast imaging workforce: increasing the number of new entrants to the field, retaining the current workforce, and increasing the productivity of new and existing practitioners.
Training More Interpreting Physicians
The Committee recognizes that efforts to reduce previously described disincentives for radiologists to specialize in breast imaging and for general radiologists to interpret mammograms are likely to strengthen the mammography workforce over the long term. Nevertheless, the Committee’s recommendations focus on a variety of near-term incentives intended to increase access to mammography for underserved areas and populations and to enlarge the nation’s aggregate supply of interpreting physicians—especially breast imaging specialists—and RTs.
The National Health Service Corps (NHSC) makes contract awards to clinicians for service in designated health professional shortage areas (U.S. Department of Health and Human Services, 2004a). In exchange for this service, NHSC participants receive funds for the repayment of their outstanding educational loans (up to $25,000 for each year of service), plus tax assistance (equal to 39 percent of the total amount of loan repayments received during a tax year) (U.S. Department of Health and Human Services, 2004b). Expanding this program to provide loan repayment awards to appropriately qualified radiologists who work in underserved areas, and who spend at least half of their professional time in breast imaging, could improve access to mammography. This designation would also serve to emphasize the national importance of breast imaging specialists to medical students and physicians in training and would further the goals of Breast Imaging Centers of Excellence, as discussed in Chapter 2.
Another established means of bolstering the supply of in-demand physician specialists is by waiving the requirement that non-U.S. resident physicians return to their country of origin for 2 years following training as part of the U.S. Department of State J-1 visa program (U.S. Department of State, 2004). Such waivers, which can be requested from the Department of State on a participant’s behalf by either federal or state agencies (such as health departments), currently bring physicians to underserved areas throughout the country (Wisconsin Department of Health and Family Services, 2003; Hagopian et al., 2003; California Department of Health Services, 2004). The Committee recommends that J-1 visa waivers, when authorized, also be extended to appropriately qualified breast imaging radiologists who work in underserved areas and who spend at least half of their professional time in breast imaging. In order to target breast imagers to the highest need areas, the Health Resources and Services Administration should establish a process to identify and designate shortage areas for breast imaging specialists.
The Committee also notes educational incentives such as proposals to sequence residency training that would expose radiology residents to breast imaging earlier in their education and training (Bassett et al., 2003). The SBI has developed a curriculum for resident education in breast imaging intended to provide guidance to academic chairpersons, list key topics for residents, and specify critical material that practicing radiologists need to know (The Society of Breast Imaging, 1999–2005; Feig et al., 2000); these guidelines could provide the basis for a more specialized “fast track” for breast imaging that could be created within existing radiology fellowship programs, similar to existing combined training programs for nuclear medicine and diagnostic radiology (American Board of Nuclear Medicine, 2004). Alternatively, a new breast imaging subspecialty could be developed. For example, a breast imaging specialty with a 3-year residency independent of the general radiology track could attract physicians to the field, as does the breast surgery subspecialty recently launched by the Society of Surgical Oncology. However, establishing a breast imaging subspecialty would require the creation of a new credentialing organization. Moreover, the new subspecialty could face underpopulation if medical students are reluctant to commit to such a narrow (and presently unpopular) area of specialization.
Finally, the Committee notes that breast imaging specialists must make an effort to promote their field if it is to grow. They need to share their enthusiasm for the specialty with medical students and radiology residents, and explain their reasons for choosing and remaining in their field.
Retaining Skilled Practitioners
The existing supply of radiologists who read mammograms at a high level of interpretive performance is a valuable resource. To invest in efforts to increase the number of entrants into this specialty without also addressing early departures from the existing workforce would be counterproductive.
Efforts directed at retaining already highly skilled practitioners, even for part-time work, may represent a cost-effective means to maintaining access to high-quality breast imaging services. For example, radiologists who wish to work part-time may find it difficult to choose breast imaging as a specialty because malpractice costs are not adjusted for less than full-time work. When such personnel approach retirement, encouraging them to continue reading mammograms part-time could ease the projected workforce shortage.
Possible incentives, described in Chapter 5, could include providing pro-rated malpractice and reduced-rate malpractice tail coverage (see footnote 20) insurance for such practitioners, who currently pay as much for these policies as their full-time counterparts. In recognition of the significant workload for mammography staff associated with MQSA compliance, as well as the heretofore uncompensated expense of compliance for mammography facilities, the Committee also recommends that reimbursement rates for mammography be increased to reflect these costs. Historically the costs of regulatory compliance have not been factored into reimbursement, placing a considerable financial burden on mammography facilities; however, successful programs in other countries such as the United Kingdom depend on funding to cover quality assurance activities (Perry, 2004). Moreover, the new audit procedures proposed earlier in this report (Chapter 2) will further increase the workload and costs associated with MQSA compliance.
Increasing Workforce Productivity
As an additional balance to its recommended expansion of the medical audit requirement for mammography interpretation, and in order to make the most effective use of the existing supply of well-trained breast imaging specialists, the Committee also recommends the development and expansion of roles for other members of the mammography workforce. This includes support for the training of radiologist assistants (RAs; see Box 4-1) and the exploration of possible new roles for these professionals in breast imaging; it also includes innovative staffing configurations in breast imaging facilities that could enable nontechnical personnel to take on appropriate responsibilities in quality control and administration. As a first step, demonstration projects could test the performance of both RAs and nontechnical personnel in a variety of responsibilities and tasks.
Integrating Radiologist Assistants into Breast Imaging
Increasing demands on radiologists—as well as the need to establish a career path by which to attract and retain RTs—have been recognized by the American College of Radiology and American Society of Radiologic Technologists, which recently collaborated to develop training and practice guidelines for a new type of physician extender, the radiologist assistant (Advanced Practice Advisory Panel, 2002; Williams and Short, 2004; RSNA, 2004a). Similar professionals such as physician assistants (PAs) and nurse practitioners have come to play key roles in other medical specialties, but this trend has largely bypassed radiology, which employs less than 0.5 percent of all PAs (Dunnick, 2004). Training programs, for which experience as an RT is a prerequisite, were recently initiated at Loma Linda University, Midwestern State University, the University of North Carolina, and the University of Medicine and Dentistry in New Jersey; eight additional institutions are also developing RA programs (Williams and Short, 2004; Dunnick, 2004).
The RA’s duties will include patient management; assisting radiologists with invasive procedures; conducting, monitoring, and tailoring certain routine procedures under direct supervision by a radiologist; and communicating results to referring physicians. They are not allowed to perform interpretations (preliminary, final, or otherwise) (Williams and Short, 2004). Maximizing the potential role of RAs in breast imaging could improve the quality of services as well as facility productivity and efficiency. In addition,
should MQSA eventually be amended to require double reading for mammograms, the resulting increase in workload for radiologists could potentially be eased, and the cost-effectiveness of double reading increased, by permitting nonphysician clinicians (e.g., radiologist assistants, radiologic technologists, nurse practitioners, physician assistants, etc.) to serve as second readers under the direct supervision of interpreting physicians. Based on evidence from several studies evaluating the interpretation of screening mammograms by RTs working under the supervision of board-certified radiologists (Sumkin et al., 2003; Wivell et al., 2003; Casey, 2003), the IOM report Saving Women’s Lives (2005) recommended that mammography facilities “enlist specially trained non-physician personnel to prescreen mammograms for abnormalities or double-read mammograms to expand the capacity of breast imaging specialists.” Immediately following the June 2004 release of Saving Women’s Lives, the ACR expressed strong opposition to technologists reading screening mammograms (Brice and Kaiser, 2004). However, it should be stressed that the previous IOM Committee did not recommend that technologists serve as the sole readers of any mammograms, but rather as second readers—thus all mammograms would still be read by a physician.
The existence of a precedent for according comparable responsibility to nonphysicians in the United States should also be noted: the routine interpretation of cervical cancer screening tests. Papanicolaou slide interpretation is carried out largely by nonphysician cytotechnologists under the supervision of a physician. Physicians are required to be onsite to provide technical oversight of the testing staff, and all gynecologic slide preparations positive for cell abnormalities must be confirmed by physicians before patient results are released (42 C.F.R. § 493). Analogous to mammography facilities, laboratories and personnel that perform Pap tests must adhere to quality assurance regulations stipulated by The Clinical Laboratory Improvement Amendments (CLIA), passed by Congress in 1988. CLIA established standards for all clinical laboratories to “ensure the accuracy, reliability, and timeliness” of clinical test results (Box 4-4). CLIA is user-fee funded; laboratories are responsible for the cost of registration, compliance, and surveys. The Centers for Medicare and Medicaid Services oversees registration, fee collection, surveys, enforcement, accreditation, and proficiency testing for all laboratories under CLIA (CMS, 2004b).
The current IOM Committee concurs that the potential benefits provided by a second reading of screening mammograms by an experienced and well-trained nonphysician clinician, supervised by a licensed, MQSA-qualified interpreting physician, could be significant. In order to better characterize potential benefits and risks, the Committee recommends the implementation of demonstration programs to evaluate the potential contribution of nonphysicians to the double reading of screening mammograms. These programs will require careful design in order to ensure women’s participation.
Improving Workplace Design and Organization
The incorporation of key elements of successful breast cancer screening programs in other countries, including centralized expert interpretation of all breast imaging modalities and a thorough quality assurance process, could increase the quality and effectiveness of breast cancer detection in the United States. Such improvements are discussed throughout this report, and are collected in the description of Breast Imaging Centers of
|
BOX 4–4 The Clinical Laboratory Improvement Amendments (CLIA) regulations define standards for laboratories performing clinical tests. Quality standards for cytology laboratories performing Pap testing are described below.
|
SOURCE: 42 C.F.R. § 493 (2003). |
Excellence in Chapter 2; similar recommendations were also made in Saving Women’s Lives. These same attributes—centralized, high-volume interpretation and ex-parties in nonmammographic imaging—may also make Breast Imaging Centers of Excellence attractive places to work.
Such centers could offer breast imagers the opportunity to use diverse skills, rather than focusing solely on mammography. These multidisciplinary environments should foster networking and feedback among practitioners with a common interest in breast health—practices that are not only likely to increase job satisfaction for radiologists and radiologic technologists, but which also appear to encourage accuracy in mammogram interpretation (Beam et al., 2003; Maguire, 2003). The continuity among screening, diagnosis, and treatment at breast health centers could also facilitate quality assurance, allowing it to become a more natural part of workflow and less of a burden.
A structure for organizing such multidisciplinary breast units throughout Europe was proposed in a 2000 position paper by the European Society of Mastology (European Society of Mastology (EUSOMA), 2000). This document established guidelines intended to convert existing, heterogeneous practices into a unified system with strong standards for the diagnosis and treatment of breast cancer (Mansel, 2000). While breast cancer experts in both Europe and the United States applauded the proposal’s overall aims—ensuring prompt and efficient diagnosis of breast cancer by specialists—they also expressed concern with the inflexibility of the proposed requirements, including the roles and protocols prescribed for the core members of the breast care teams (Silverstein, 2000; Mansel, 2000). These objections make clear that specialization in and of itself is not a prescription for job satisfaction, particularly in the United States, where physicians highly prize their right to individual judgment (Silverstein, 2000).
Increasing Administrative Efficiency
If RTs and interpreting physicians are to maximize their productivity, they should be able to focus their efforts on image interpretation and performing interventional breast imaging procedures, undistracted by administrative tasks. Administrative personnel, data entry personnel, and others could make an important contribution by taking on nontechnical responsibilities in quality control and administration. The Committee therefore recommends support for demonstrations to evaluate the roles of such nontechnical personnel in mammography, and to assess the costs and benefits of alternative staffing configurations on the efficiency, productivity, and quality of breast imaging services.
SUMMARY AND CONCLUSIONS
Because early detection of occult breast cancer is a key element for reducing breast cancer morbidity and mortality, it is important to accurately monitor the capacity of mammography services and to ensure adequate access for women. The paucity of robust national and regional data on the supply of and demand for mammography services necessitated an assessment of the mammography workforce based on estimates and projections and informed by anecdotal and regional reports of unfilled positions, facility closures, wait times, and barriers to access. Barring changes that would decrease demand, demographic projections predict that access to mammography is likely to become in-
creasingly limited, particularly in light of trends in training and employment for both interpreting physicians and RTs. The most severe restrictions in access will probably occur among currently underserved populations, including low-income women.
Clearly, data on the national mammography workforce, volume of services, and capacity should be routinely collected and analyzed, both in order to determine the status quo and to plan for the future. The Committee recommends that FDA address this need by collecting the relevant data during the annual inspection and using unique identifiers for all certified physicians, technologists, and medical physicists. The Health Resources and Service Administration should analyze this data to produce routine reports on the volume of mammography services by region, state, and type of service.
There is an urgent need to begin data collection immediately because it will take several years to identify trends. If the fragile stability of the breast imaging workforce moves toward crisis, data will be needed to react swiftly and effectively. Tracking mammography capacity will also be very important to monitor the impact of the new regulations and voluntary programs recommended in this report. There is always potential for unintended consequences of changes designed to improve quality. For example, it is possible that mammography facilities that lack the resources to participate in the voluntary advanced audit program or to seek designation as a Center of Excellence, as described in Chapter 2, might unfairly be viewed as providing substandard care by patients and insurers, and thus could see their patient base and income decrease This could lead to facility closures and reduce access, especially among women who lack the means to travel and pay for services. Likewise, the added costs of the proposed new medical audit procedures, whether covered by increased reimbursements or not, could disproportionately affect access by low income women.
Initiatives to expand the mammography workforce face a spectrum of factors that discourage today’s radiology residents from choosing breast imaging as a subspecialization in radiology and general radiologists from interpreting mammograms. Strategies proposed here to ease these problems focus on increasing the number of entrants to the field of breast imaging and their employment in underserved communities and on retaining skilled breast imagers. The first of these aims could be advanced through existing loan repayment and J-1 visa waiver programs. The second could be achieved by encouraging federal and state agencies and health care payers to develop incentives to recruit and retain skilled breast imagers, for example through support for part-time interpretation of mammograms. Establishing reimbursement rates for mammography that reflect the workload and expense of adhering to requirements of MQSA, as recommended in Chapter 2, would also have a positive impact on the workforce.
Improvements in workplace organization and effectiveness could act in a variety of ways to increase access to mammography, by simultaneously boosting recruitment, retention, and productivity in the breast imaging workforce.
REFERENCES
Aben GR, Bryson HA, Bryson TC. 2004 (June 21). Digital vs. Conventional Mammography, An Opportunity for Process Improvement. Presentation at the meeting of the Seventh International Workshop on Digital Mammography, Chapel Hill, NC.
Adams D. 2003. amednews.com: Doctors Resigned to Public Web Profiles. [Online]. Available: http://www.ama-assn.org/amednews/2003/05/05/prsa0505.htm [accessed November 17, 2004].
Advanced Practice Advisory Panel. 2002. The Radiologist Assistant: Improving Patient Care while Providing Work Force Solutions. Consensus Statements from the Advanced Practice Advisory Panel, March 9–10, 2002. Washington, DC: American Society of Radiologic Technologists.
Aiello E, Buist DS, White E, Porter PL. 2005. The association between mammographic breast density and breast cancer tumor characteristics. Cancer Epidemiology, Biomarkers & Prevention 14(3):662–668.
American Board of Nuclear Medicine. 2004. Certification and Requirements. [Online]. Available: http://www.abnm.org/frameset-certreq.html [accessed September 15, 2004].
American Board of Radiology. 2004. Training Requirements. [Online]. Available: http://www.theabr.org/DRAppAndFeesinFrame.htm [accessed December 6, 2004].
American Cancer Society. 2004. Mammography in Florida: A Consumer’s Guide. [Online]. Available: http://www.cancer.org/floridamammogram [accessed January 5, 2005].
American College of Radiology. 2004. Analysis and Reports on Radiologists Performing Mammography. Provided to the Institute of Medicine by the American College of Radiology. Reston, VA: American College of Radiology.
American Heart Association. 2000. Women, Heart Disease & Stroke Survey Highlights. [Online]. Available: http://www.americanheart.org/presenter.jhtml?identifier=10382 [accessed February 9, 2005].
American Registry of Radiologic Technologists. 2001. Annual Report of Examinations: Result of the 2001 Examination in Radiography, Nuclear Medicine Technology, and Radiation Therapy. St. Paul, MN: American Registry of Radiologic Technologists.
Arenson R. 2004. National Radiology Fellowship Match Program: Success or failure? Journal of the American College of Radiology 1(3):188–191.
ASRT (American Society of Radiologic Technologists). 2004a. Mammography Data for MQSA Reauthorization Effort. Albuquerque, NM: ASRT.
ASRT. 2004b. Radiologic Technologist Wage and Salary Survey. Albuquerque, NM: ASRT.
Association of American Medical Colleges. 1999–2003. AAMC Report on Medical School Faculty Salaries. Washington, DC: Association of American Medical Colleges.
Bassett LW, Monsees BS, Smith RA, Wang L, Hooshi P, Farria DM, Sayre JW, Feig SA, Jackson VP. 2003. Survey of radiology residents: Breast imaging training and attitudes. Radiology 227(3):862–869.
Beam CA, Conant EF, Sickles EA. 2003. Association of volume and volume-independent factors with accuracy in screening mammogram interpretation. Journal of the National Cancer Institute 95(4):282–290.
Berlin L, Chair, Department of Radiology, Rush North Shore Medical Center, Professor of Radiology, Rush Medical College. 2003. Mammography Quality Standards Act Reauthorization. Statement at the April 8, 2003, hearing of the Subcommittee on Aging, Committee on Health, Education, Labor, and Pensions, U.S. Senate.
Brewin B. 2003. Bio-IT Bulletin: DOD System Brings Medical Expertise Closer. [Online]. Available: http://www.bio-itworld.com/news/021203_report2006.html [accessed April 11, 2003].
Brice J. 2004. Closing doors in mammography threaten continued access to care. Diagnostic Imaging (Sept.):25–35.
Brice J, Kaiser JP. 2004. ACR Pans Proposal to Allow Physician Assistants to Read Mammography. Diagnostic Imaging Online. [Online]. Available: http://www.diagnosticimaging.com/dinews/2004061401.shtml [accessed August 19, 2004].
California Department of Health Services, State Office of Rural Health. 2004. CalSORH: J-1 Visa Waiver Request Guidelines and Documents. [Online]. Available: http://www.dhs.ca.gov/pcfh/prhcs/Programs/CalSORH/WaiverRequest.htm [accessed December 6, 2004].
Casey B. 2003. Breast Center Enlists Radiographers for First Look at Mammograms. [Online]. Available: http://www.auntminnie.com/default.asp?Sec=sup&Sub=wom&Pag=dis&ItemId=57614&stm=radiographers [accessed February 19, 2004].
Center for Health Workforce Studies. 1999–2004. Residency Training Outcomes by Specialty in New York State: Annual Summaries of Responses to the NYS Resident Exit Survey, 1998–2003. Rensselaer, NY: University at Albany, State University of New York, School of Public Health, Center for Health Workforce Studies.
Centers for Disease Control and Prevention, National Center for Chronic Disease Prevention and Health Promotion. 2002. Behavioral Risk Factor Survey. Atlanta, GA: Centers for Disease Control and Prevention, National Center for Chronic Disease Prevention and Health Promotion.
CMS (Centers for Medicare and Medicaid Services). 2004a. Medicare program: Revisions to payment policies under the Physician Fee Schedule for calendar year 2005. Final Rule. Federal Register 69(219):66235–66915.
CMS. 2004b. CLIA Program: Clinical Laboratory Improvement Amendments. [Online]. Available: http://www.cms.hhs.gov/clia/ [accessed December 14, 2004].
Congressional Research Service. 2003. Medicare: Payments to Physicians. RL31199. Washington, DC: Congressional Research Service.
Cooper RA, Stoflet SJ, Wartman SA. 2003. Perceptions of medical school deans and state medical society executives about physician supply. JAMA 290(22):2992–2995.
Cronin KA, Yu B, Krapcho M, Miglioretti DL, Fay MP, Izmirlian G, Ballard-Barbash R, Geller BM, Feuer EJ. In press. Modeling the dissemination of mammography in the United States. Cancer Causes and Control.
Cypel YS, Sunshine JH. 2004. Diagnostic medical physicists and their clinical activities. Journal of the American College of Radiology 1(2):120–126.
Destouet JM, Bassett LW, Yaffe MJ, Butler PF, Wilcox PA. In press. The American College of Radiology Mammography Accreditation Program—10 years of experience since MQSA. Journal of the American College of Radiology.
D’Orsi C, Tu SP, Nakano C, Carney PA, Abraham LA, Taplin SH, Hendrick RE, Cutter GR, Berns E, Barlow WE, Elmore JG. 2005. Current realities of delivering mammography in the community: Do challenges with staffing and scheduling exist? Radiology 235(2):391–395.
Duffy SW, Day NE, Tabar L, Chen HH, Smith TC. 1997. Markov models of breast tumor progression: Some age-specific results. Journal of the National Cancer Institute Monographs (22):93–97.
Dunnick NR. 2004. ACR Intersociety Conference 2003 summary: Radiologist assistants and other radiologist extenders. Journal of the American College of Radiology 1(6):386–391.
Eastern Research Group and U.S. Food and Drug Administration. 2001. Availability of Mammography Services. Contract ID 223–94–8031. Lexington, MA: Eastern Research Group.
Elmore JG, Taplin S, Barlow WE, Cutter G, D’Orsi C, Hendrick RE, Abraham L, Fosse J, Carney PA. In press. Community radiologists’ medical malpractice experience, concerns, and interpretive performance. Radiology.
Enzmann DR, Anglada PM, Haviley C, Venta LA. 2001. Providing professional mammography services: Financial analysis. Radiology 219(2):467–473.
European Society of Mastology (EUSOMA). 2000. The requirements of a specialist breast unit. 36(18):2288–2293.
Farria D, Schmidt ME, Monsees BS, Smith RA, Hildebolt C, Yoffie R, Monticciolo DL, Feig SA, Bassett LW. In press. Professional and economic factors affecting access to mammography: A crisis today, or tomorrow? Results from a national survey. Cancer.
Feig SA, Hall FM, Ikeda DM, Mendelson EB, Rubin EC, Segel MC, Watson AB, Eklund GW, Stelling CB, Jackson VP. 2000. Society of Breast Imaging residency and fellowship training curriculum. Radiologic Clinics of North America 38(4):xi, 915–920.
Gairard B, Renaud R, Haehnel P, Dale G, Schaffer P. 1992. How to organize a non centralized screening programme. In: Ioannidou-Mouzaka L, Agnantis NJ, Karydas I, eds. Senology. Vol. 1005. International Congress Series. Pp. 139–142.
Gairard B, Renaud R, Schaffer P, Guldenfels C, Kleitz C. 1997. Breast cancer screening in France: An update. Journal of Medical Screening 4(1):5.
Gorman C. 2001. Need a mammogram? It could take a while. TIME 157(10):78–81.
Hagopian A, Thompson MJ, Kaltenbach E, Hart LG. 2003. Health departments’ use of international medical graduates in physician shortage areas. Health Affairs 22(5):241–249.
Hayes JC. 2004. Mammography crisis continues as experts struggle to find solution. Diagnostic Imaging (Sept.):5.
Helvie MA. 2004. Image analysis. In: Harris JR, Lippman ME, Morrow M, Osborne CK, eds. Diseases of the Breast. New York: Lippincott Williams & Wilkins. Pp. 131–148.
Hulka CA, Slanetz PJ, Halpern EF, Hall DA, McCarthy KA, Moore R, Boutin S, Kopans DB. 1997. Patients’ opinion of mammography screening services: Immediate results versus delayed results due to interpretation by two observers. American Journal of Roentgenology 168(4):1085–1089.
IMV Medical Information Division. 2002. Benchmark Report: Mammography 2000. Des Plaines, IL: IMV Limited.
IOM (Institute of Medicine). 2001. Mammography and Beyond: Developing Technologies for the Early Detection of Breast Cancer. Washington, DC: National Academy Press.
IOM. 2005. Saving Women’s Lives: Strategies for Improving Breast Cancer Detection and Diagnosis. Washington, DC: The National Academies Press.
Irwig L, Houssami N, van Vliet C. 2004. New technologies in screening for breast cancer: A systematic review of their accuracy. British Journal of Cancer 90(11):2118–2122.
Jansen JT, Zoetelief J. 1997. Assessment of lifetime gained as a result of mammographic breast cancer screening using a computer model. British Journal of Radiology 70(834):619–628.
Kopans DB. 2004. Sonography should not be used for breast cancer screening until its efficacy has been proven scientifically. American Journal of Roentgenology 182(2):489–491.
Kriege M, Brekelmans CT, Boetes C, Besnard PE, Zonderland HM, Obdeijn IM, Manoliu RA, Kok T, Peterse H, Tilanus-Linthorst MM, Muller SH, Meijer S, Oosterwijk JC, Beex LV, Tollenaar RA, de Koning HJ, Rutgers EJ, Klijn JG, Magnetic Resonance Imaging Screening Study Group. 2004. Efficacy of MRI and mammography for breast-cancer screening in women with a familial or genetic predisposition. New England Journal of Medicine 351(5):427–437.
Lannin DR, Mathews HF, Mitchell J, Swanson MS. 2002. Impacting cultural attitudes in African-American women to decrease breast cancer mortality. American Journal of Surgery 184(5):418–423.
Lawson HW, Henson R, Bobo JK, Kaeser MK. 2000. Implementing recommendations for the early detection of breast and cervical cancer among low-income women. Morbidity & Mortality Weekly Report 49(RR-2):37–55.
Lee CH. 2004. Problem solving MR imaging of the breast. Radiologic Clinics of North America 42(5):vii, 919–934.
Liberman L, Morris EA, Benton CL, Abramson AF, Dershaw DD. 2003. Probably benign lesions at breast magnetic resonance imaging: Preliminary experience in high-risk women. Cancer 98(2):377–388.
Lindfors KK, O’Connor J, Parker RA. 2001. False-positive screening mammograms: Effect of immediate versus later work-up on patient stress. Radiology 218(1):247–253.
Linver MN. 2002. Coding and billing in breast imaging. Decisions in Imaging Economics (April).
Maccia C, Nadeau X, Renaud R, Castellano S, Schaffer P, Wahl R, Haehnel P, Dale G, Gairard B. 1995. Quality control in mammography: The pilot campaign of breast screening in the Bas-Rhin region. Radiation Protection Dosimetry 57(1–4):323–328.
Maguire P. 2003. Is an access crisis on the horizon in mammography? ACP Observer (Oct.).
Mansel RE. 2000. Should specialist breast units be adopted in Europe? A comment from Europe. European Journal of Cancer 36(18):2286–2287.
Martinez B. 2000 (October 30). Mammography centers shut down as reimbursement feud rages on. The Wall Street Journal. P. A1.
McCann J, Wait S, Seradour B, Day N. 1997. A comparison of the performance and impact of breast cancer screening programmes in East Anglia, U.K. and Bouches Du Rhone, France. European Journal of Cancer 33(3):429–435.
Merritt, Hawkins & Associates. 2003. 2003 Review of Physician Recruiting Incentives. Irving, TX: The MHA Group.
Michalowski J. 2003. Telemedicine: Transporting cancer expertise to all corners of the world. Benchmarks 3(6):1.
Mosca L, Ferris A, Fabunmi R, Robertson RM. 2004. Tracking women’s awareness of heart disease: An American Heart Association national study. Circulation 109(5):573–579.
National Mammography Quality Assurance Advisory Committee. Subcommittee on Physicist Availability. 1996. Medical Physicist Availability Report. Unpublished.
National Quality Measures Clearinghouse. 2004. Access: Time to Third Next Available Long Appointment. [Online]. Available: http://www.qualitymeasures.ahrq.gov/summary/summary.aspx?doc_id5743 [accessed February 22, 2005].
Odle TG. 2003. Mammography coding and reimbursement. Radiologic Technology 74(5):385–404; quiz 405–412.
Perry NM. 2004 (September 2). Mammography Quality and Performance in the National Health Service Breast Screening Programme. Presentation at the meeting of the Institute of Medicine Committee on Improving Mammography Quality Standards, Washington, DC.
Physician Insurers Association of America. 2002. Breast cancer study. 3rd ed. Rockville, MD: Physician Insurers Association of America.
Renaud R, Gairard B, Schaffer P, Guldenfels C, Haehnel P, Dale G, Bellocq JP. 1994. Europe Against Cancer Breast Cancer Screening Programme in France: The ADEMAS Programme in Bas-Rhin. European Journal of Cancer Prevention 3(Suppl 1):13–19.
Rothenberg LN, Deye JA, High MD, Jessop NW, Sternick ES. 1995. Demographic characteristics of physicists who evaluate mammographic units. Radiology 194(2):373–377.
RSNA (Radiological Society of North America). 2004a. Radiology assistants will share workload in diagnostic imaging. Radiological Society of North America News 14(2):5–6.
RSNA. 2004b. Radiologist shortage easing, physician shortage growing. Radiological Society of North America News 14(4):6–7.
Shtern F, Winfield D, eds. 1999. Report of the Joint Working Group on Telemammography/Teleradiology and Information Management: March 15–17, 1999. Washington, DC: U.S. Public Health Service, Office on Women’s Health.
Sickles EA, Miglioretti DL, Ballard-Barbash R, Geller BM, Leung JW, Rosenberg RD, Smith-Bindman R, Yankaskas BC. In press. Performance benchmarks for diagnostic mammography. Radiology.
Silverstein MJ. 2000. State-of-the-art breast units-a possibility or a fantasy? A comment from the U.S. European Journal of Cancer 36(18):2283–2285.
Smith RA, Cokkinides V, Eyre HJ. 2003. American Cancer Society guidelines for the early detection of cancer, 2003. CA: A Cancer Journal for Clinicians 53(1):27–43.
Smith-Bindman R, Chu P, Miglioretti D, Quale C, Rosenberg RD, Cutter G, Geller B, Bacchetti P, Sickles EA, Kerlikowske K. 2005. Physician predictors of mammographic accuracy. Journal of the National Cancer Institute 97(5):358–367.
Sumkin JH, Klaman HM, Graham M, Ruskauff T, Gennari RC, King JL, Klym AH, Ganott MA, Gur D. 2003. Prescreening mammography by technologists: A preliminary assessment. American Journal of Roentgenology 180(1):253–256.
Sunshine J, Bhargavan M, Lewis R. 2004a (September 3). Information on Radiologists Who Interpret Mammograms. Presentation at the meeting of the Institute of Medicine Committee on Improving Mammography Quality Standards, Washington, DC.
Sunshine JH, Maynard CD, Paros J, Forman HP. 2004b. Update on the diagnostic radiologist shortage. American Journal of Roentgenology 182(2):301–305.
Taplin SH, Rutter CM, Lehman C. Submitted. Testing the effect of computer assisted detection upon interpretive performance in screening mammography.
The Florida Legislature: Office of Program Policy Analysis & Government Accountability. (OPPAGA). 2004. OPPAGA Report: Access to Mammography Services in Florida Is More Limited for Low-Income Women. 04–79. Tallahassee, FL: OPPAGA Report Production.
The Society of Breast Imaging. 1999–2005. Breast Imaging Residency Training Curriculum. [Online]. Available: http://www.sbi-online.org/residentfellow.htm [accessed December 2, 2004].
The Workgroup on Mammography Accessibility. 2004. Report of The Workgroup on Mammography Accessibility. Tallahassee, FL: Florida Department of Health.
Thorwarth WT, Borgstede JP. 2001. Mammography reimbursement: components and strategies for change. Reston, VA: American College of Radiology.
Tourangeau R, Rips LJ, Rasinski K. 2000. The Psychology of Survey Response. Cambridge, UK: Cambridge University Press. Pp. 165–229.
Trevino M. 2003. Air Force Teleradiology Project Aims to Alleviate Staff Shortages: Plan Could Even Out Workflow and Improve Access to Subspecialty Reads. [Online]. Available: http://www.diagnosticimaging.com/pacsweb/cover/cover05090202.shtml [accessed May 13, 2003].
U.S. Census Bureau. 2004. U.S. Interim Projections by Age, Sex, Race, and Hispanic Origin. [Online]. Available: http://www.census.gov/ipc/www/usinterimproj/ [accessed August 26, 2004].
U.S. Department of Health and Human Services, Health Resources and Services Administration, National Health Service Corps. 2004a. Career Information: Loan Repayment Program. [Online]. Available: http://www.wphca.org/nhsc.html [accessed December 30, 2004].
U.S. Department of Health and Human Services, Health Resources and Services Administration, National Health Service Corps. 2004b. Fiscal Year 2005 Loan Repayment Program Application Information Bulletin. [Online]. Available: http://nhsc.bhpr.hrsa.gov/applications/lrp_05/e.cfm [accessed December 30, 2004].
U.S. Department of State, Bureau of Educational and Cultural Affairs. 2004. Waivers. [Online]. Available: http://exchanges.state.gov/education/jexchanges/participation/waivers.htm [acessed December 6, 2004].
U.S. Government Accountability Office. 2002. Mammography: Capacity Generally Exists to Deliver Services. GAO-02–532. Washington, DC: U.S. Government Accountability Office.
Wait S, Schaffer P, Seradour B, Guldenfels C, Gairard B, Morin F, Piana L. 2000. The cost of breast cancer screening in France. Journal de Radiologie 81(7):799–806.
Ward E, Jemal A, Cokkinides V, Singh GK, Cardinez C, Ghafoor A, Thun M. 2004. Cancer disparities by race/ethnicity and socioeconomic status. CA: A Cancer Journal for Clinicians 54(2):78–93.
Warner E, Plewes DB, Hill KA, Causer PA, Zubovits JT, Jong RA, Cutrara MR, DeBoer G, Yaffe MJ, Messner SJ, Meschino WS, Piron CA, Narod SA. 2004. Surveillance of BRCA1 and BRCA2 mutation carriers with magnetic resonance imaging, ultrasound, mammography, and clinical breast examination. JAMA 292(11):1317–1325.
Wentland EJ. 1993. Survey Responses: An Evaluation of their Validity. San Diego, CA: Academic Press. Pp. 71–93.
White E, Miglioretti DL, Yankaskas BC, Geller BM, Rosenberg RD, Kerlikowske K, Saba L, Vacek PM, Carney PA, Buist DS, Oestreicher N, Barlow W, Ballard-Barbash R, Taplin SH. 2004. Biennial versus annual mammography and the risk of late-stage breast cancer. Journal of the National Cancer Institute 96(24):1832–1839.
Williams CD, Short B. 2004. ACR and ASRT development of the radiologist assistant: Concept, roles, and responsibilities. Journal of the American College of Radiology 1(6):392–397.
Wing P. 2005. IOM Mammography Projects and Related Background Information. Rensselaer, NY: University at Albany, State University of New York, School of Public Health, Center for Health Workforce Studies.
Wisconsin Department of Health and Family Services. 2003. Wisconsin J-1 Visa Waiver Program. [Online]. Available: http://dhfs.wisconsin.gov/DPH_BCDHP/J_1VISA/ [accessed December 6, 2004].
Wivell G, Denton ER, Eve CB, Inglis JC, Harvey I. 2003. Can radiographers read screening mammograms? Clinical Radiology 58(1):63–67.
Yasmeen S, Romano PS, Pettinger M, Chlebowski RT, Robbins JA, Lane DS, Hendrix SL. 2003. Frequency and predictive value of a mammographic recommendation for short-interval follow-up. Journal of the National Cancer Institute 95(6):429–436.


