
7
HISPANICS IN THE U.S. LABOR MARKET
Brian Duncan, V. Joseph Hotz, and Stephen J. Trejo
As the first two chapters of this volume have noted, Hispanics constitute a large and rapidly growing segment of the U.S. population. Much of the public debate and controversy concerning Hispanics focuses on their integration and success in the U.S. labor market. In this chapter, we summarize some of what is currently known about these issues. We focus on employment and earnings as measures of labor market success. We also examine the educational attainment of Hispanics, given its crucial role in labor market success. We consider four different but complementary perspectives.
We begin by examining Hispanics and their subgroups that currently reside in the United States, on the basis of data from the 2000 Census of Population. We focus on how foreign-born versus U.S.-born Hispanics differ in an important indicator of human capital, namely their educational attainment. We then document the differences that exist among Hispanics, their subgroups, whites, and blacks in employment and earnings. Finally, we ask how much of these differences can be accounted for by differences in years of schooling, English language proficiency, and potential work experience. Two conclusions emerge from this analysis. First, we confirm the findings in Chapter 6 as well as numerous other studies that Hispanics have markedly lower levels of educational attainment than do whites or blacks and that these educational deficits are more pronounced for the foreign-born. Second, while the employment and earnings of Hispanics tend to lag behind those of whites, almost all of the differences relative to whites can be accounted for by a relatively small number of measures of human capital, namely, years of schooling, English proficiency, and potential work experience.
We next examine the early life-cycle patterns of schooling and work for Hispanics relative to blacks and whites, using data on cohorts who reached adulthood during the late 1980s and 1990s. In this analysis, we focus on two issues arising from the role that the Hispanic educational deficit plays in accounting for their relative employment and earnings differentials. First, we examine exactly what sorts and amounts of work experience Hispanics accumulated during early adulthood. We know that they accumulated less education over their early adulthood. But do they compensate by accumulating more work experience to offset some of their educational deficit? Second, we examine whether Hispanics realized the same financial returns from their accumulated work experience and schooling. Previous studies of other minority groups suggest that they do not realize the same gain from an additional year of schooling or work experience as do whites. Whether these differences reflect evidence of labor market discrimination or unmeasured differences in the quality of schooling and the amount of actual work experience is less certain. But at issue is whether observed measures of human capital have different impacts on the degree of labor market success by race or ethnicity.
In the final section of the chapter, we focus on how the labor market attainment of Hispanics in the United States has changed over time and across generations. Analyzing whether there has been secular and generational progress among Hispanics in the United States is important for at least three reasons. First, our analysis was performed on Hispanics during a period of substantial change in the structure of the U.S. labor market, which tended to be decidedly less favorable for less-skilled workers in the United States. As a result, it is important to assess, if only somewhat speculatively, how important this restructuring was for the lower levels of labor market attainment experienced by Hispanics. Second, knowing how things have changed is an essential ingredient for forecasting what will happen to the labor market attainment of this growing and increasingly important segment of the U.S. population. Third, assessing how things have changed across generations is essential because of the immigrant nature of Hispanics. The immigrants of today will be the parents and grandparents of future generations of Hispanics, and it is of critical importance to understand the degree of their intergenerational assimilation into the U.S. labor market.
THE CURRENT SCENE: THE LABOR MARKET ATTAINMENT OF HISPANICS
Human Capital
Time and time again, researchers have found that indicators of labor market disadvantage for U.S. Hispanics, such as earnings deficits or em-
TABLE 7-1 Average Years of Schooling, by Gender, Ethnicity, and Nativity
|
Ethnicity |
Men, by Nativity |
Women, by Nativity |
||||
|
All |
Foreign-Born |
U.S.-Born |
All |
Foreign-Born |
U.S.-Born |
|
|
Whites |
|
|
13.6 |
|
|
13.6 |
|
Blacks |
|
|
12.4 |
|
|
12.8 |
|
All Hispanics |
10.5 |
9.5 |
12.2 |
10.8 |
9.8 |
12.4 |
|
Mexicans |
9.8 |
8.5 |
12.1 |
10.1 |
8.6 |
12.2 |
|
Puerto Ricans |
11.7 |
11.2 |
12.4 |
12.0 |
11.4 |
12.7 |
|
Cubans |
12.7 |
12.4 |
13.6 |
12.9 |
12.5 |
14.2 |
|
NOTE: The samples include individuals ages 25 to 59. See Appendix Table A7-1 for standard errors and sample sizes, as well as for analogous calculations for other Hispanic subgroups. SOURCE: 2000 Census, 5% Public Use Microdata Samples (PUMS). |
||||||
ployment gaps with respect to white workers, are in large part explained by relatively low levels of human capital.1 Accordingly, we begin by describing, in broad terms, the labor market skills possessed by Hispanic Americans and how these skills compare with those of non-Hispanics.
One of the most important and easiest to observe dimensions of human capital is educational attainment, and Chapter 6 has documented the obstacles faced by Hispanic children in U.S. schools. Table 7-1 shows the substantial gaps in completed education that exist for Hispanic adults. Based on microdata from the 2000 census, the table reports average years of schooling—by gender, ethnicity, and nativity—for individuals between the ages of 25 and 59.2 In addition to presenting statistics for Hispanics as an aggregate group, we display separate results for Mexicans, Puerto Ricans, and Cubans, the three Hispanic national-origin groups with the largest U.S.-born populations.3 We also present comparable statistics for non-
|
1 |
See, for example, Altonji and Blank (1999); Antecol and Bedard (2002, 2004); Bean and Stevens (2003); Bean and Tienda (1987); Bean, Trejo, Capps, and Tyler (2001); Carlson and Swartz (1988); Carnoy, Daley, and Hinojosa-Ojeda (1993); Cotton (1985); Darity, Guilkey, and Winfrey (1995); DeFreitas (1991); Grogger and Trejo (2002); Gwartney and Long (1978); McManus, Gould, and Welch (1983); Reimers (1983); Smith (1991, 2001); Trejo (1996, 1997, 2003). |
|
2 |
We focus on individuals in this age range because they are old enough that virtually all of them have completed their schooling, yet they are young enough that observed labor market outcomes reflect their prime working years. |
|
3 |
Appendix Table A7-1 reports standard errors and sample sizes for the estimates in Table 7-1, as well as analogous calculations for other Hispanic subgroups. Throughout this chapter, appendix tables provide further details of the tables and charts presented in the text. All statistics reported in this chapter make use of the relevant sampling weights. |
Hispanic whites and non-Hispanic blacks, with both of these latter groups restricted to individuals who were born in the United States.4 U.S.-born whites provide a yardstick for measuring Hispanic outcomes against those of the primary native majority group in American society, whereas U.S.-born blacks are an important native minority group that is instructive to compare with Hispanics.
Table 7-1 shows that educational patterns are very similar for men and women. For Hispanics overall, immigrants average less than 10 years of schooling, but mean educational attainment rises sharply to over 12 years for U.S.-born Hispanics. Despite this sizeable improvement associated with nativity, U.S.-born Hispanics trail the average educational attainment of whites by more than a year, and they even trail the educational attainment of blacks. Consequently, Hispanic educational attainment is low not only in comparison with advantaged groups in American society such as whites, but also in comparison with disadvantaged minority groups such as blacks.
Among the Hispanic subgroups, Mexicans and Puerto Ricans display the same general patterns as Hispanics overall, with substantial schooling growth between immigrants and the U.S.-born, yet a large educational deficit relative to whites that persists even for the U.S.-born. Average education levels among the foreign-born, however, are much lower for Mexicans than for Puerto Ricans (8.5 years versus more than 11 years, respectively), but Mexicans experience bigger gains for the U.S.-born, thereby shrinking to a half year or less the educational gap between U.S.-born Mexicans and Puerto Ricans. Cubans stand out from the other groups with notably high levels of educational attainment. In terms of average schooling, Cuban immigrants exceed U.S.-born Mexicans and approach the level of U.S.-born Puerto Ricans, and U.S.-born Cubans equal (for men) or surpass (for women) the educational attainment of whites. More detailed tabulations reveal that the schooling deficits (relative to whites) of U.S.-born Hispanics, in general, and of Mexican Americans and Puerto Rican Americans, in particular, emanate from differences at the extremes of the education distribution. U.S.-born Mexicans and Puerto Ricans are much more likely to be without a high school diploma and much less likely to earn a bachelor’s degree than are non-Hispanic whites (Bean et al., 2001).
For Hispanic immigrants, a critical aspect of their human capital is that much of it was acquired outside the United States. The foreign schooling
and work experience that Hispanic immigrants bring with them transfer imperfectly to the U.S. labor market, in that U.S. employers typically place a lower value on human capital acquired abroad than on that acquired here (Chiswick, 1978; Schoeni, 1997). As a result, even after conditioning on age, education, and other observable indicators of human capital, labor market outcomes are likely to differ between foreign-born Hispanics and U.S.-born Hispanics (or between foreign-born Hispanics and U.S.-born whites), because of differences in the returns to human capital for foreign-born and U.S.-born workers. For this reason, nativity plays a key role in shaping the labor market success of Hispanics, and it is essential that labor market analyses of U.S. Hispanics distinguish between immigrants and the U.S.-born.
English language proficiency is an important dimension of human capital closely related to nativity. Census microdata provide self-reported information on English ability, and we display some of this information in Figure 7-1.5 All respondents were asked whether they “speak a language other than English at home,” and only those who answered affirmatively were asked how well they speak English, with possible responses of “very well,” “well,” “not well,” or “not at all.” For the tabulations presented in Figure 7-1, English monolinguals are presumed to speak English “very well” and are grouped together with bilinguals who indicated the highest level of English proficiency.
By this accounting, only a third of Hispanic immigrants speak English very well, but the proportion approaches 90 percent for U.S.-born Hispanics. Even among U.S. natives, however, the English proficiency of Hispanics falls somewhat short of the 99 percent rates observed for blacks and whites. Given the substantial penalties that the U.S. labor market assesses for English deficiencies (Bleakley and Chin, 2004; Grenier, 1984; McManus et al., 1983; Mora, 1998), the language gaps observed in Figure 7-1 can explain a considerable portion of Hispanic employment and earnings deficits, especially for immigrants, but also to some extent for U.S.-born Hispanics. In addition, English language proficiency varies across Hispanic subgroups. Among immigrants, Mexicans have the lowest rate of English proficiency (with 26 percent speaking the language very well), whereas the corresponding rate is around 50 percent for Cubans and still higher for Puerto Ricans. Differences are much less pronounced for U.S.-born Hispanics, with rates just under 90 percent for Mexicans and Puerto Ricans and a somewhat higher rate for Cubans.
A key feature of Hispanic immigration is that much of it is undocumented. Given the clandestine nature of undocumented immigration, this
|
5 |
More detailed information is reported in Appendix Table A7-2. |
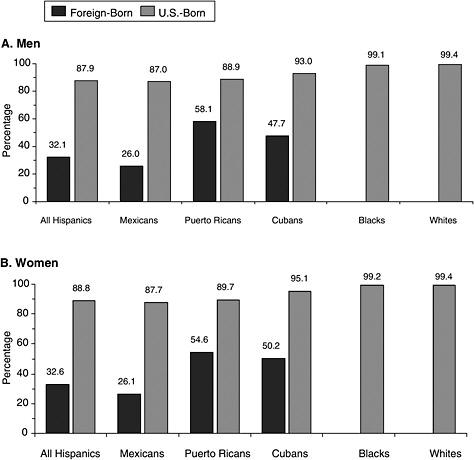
FIGURE 7-1 Percentage speaking English very well, by gender, ethnicity, and nativity.
NOTE: The samples include individuals ages 25 to 59. In these tabulations, those who speak only English are presumed to speak English “very well.” See Appendix Table A7-2 for further details.
SOURCE: 2000 census, 5% PUMS.
population is difficult to observe, but some credible information is available nonetheless. Passel, Capps, and Fix (2004) estimate that Latin Americans made up 80 percent of the undocumented immigrants living in the United States as of March 2002, with Mexicans alone accounting for 57 percent of the undocumented population. Moreover, these same authors estimate that undocumented immigrants represent a quarter of the total foreign-born population in the United States, and Passel (2004) indicates that the share of undocumented immigrants is much higher among foreign-born Hispan-
ics, particularly for recent immigrants. Indeed, Passel (2004) reports that over 80 percent of all Mexican immigrants who arrived in the United States after 1990 were undocumented as of March 2002.
Does undocumented status, by itself, hurt the labor market opportunities of Hispanic immigrants? If so, by how much? Most sources of information about U.S. immigrants, including the decennial census and Current Population Survey data that we analyze in this chapter, do not identify undocumented immigrants, so our analyses will not be able to control for the legal status of Hispanic immigrants. Other studies, however, have exploited unique surveys to shed light on this issue. Massey (1987), for example, compared the U.S. wages earned by legal and illegal immigrants originating in four Mexican communities. He reports that undocumented Mexican immigrants earn substantially less, on average, then legal Mexican immigrants, but he also shows that this wage gap is explained by the lower human capital possessed by undocumented immigrants, particularly with regard to English proficiency and U.S. work experience. After controlling for observable determinants of earnings, Massey finds that legal status per se has little direct effect on U.S. wages for the Mexican immigrants in his sample. Donato and Massey (1993), however, obtained a different result when they conducted a similar analysis of later and more extensive data from 13 Mexican communities. In these later data, undocumented status reduced wages by about 20 percent, even after controlling for observables.
Perhaps the best evidence on the labor market impact of undocumented status comes from a survey that tracked the experiences of initially undocumented immigrants before and after they were granted permanent legal resident status through the amnesty provisions of the 1986 Immigration Reform and Control Act. Despite using somewhat different approaches, Rivera-Batiz (1999) and Kossoudji and Cobb-Clark (2002) reach similar conclusions. First, holding observable skills constant, estimates suggest that legalization raised the wages of these workers by about 5–10 percent relative to what their wages would have been had the workers remained undocumented. Second, by increasing the incentives for these workers to invest in human capital, legalization also may have induced greater skill acquisition and thereby boosted wages through this indirect channel. Clearly, legal status is an important factor underlying the huge earnings deficits for Hispanic immigrants (relative to U.S.-born whites) that we document below, and this is especially true for recent immigrants from Mexico and Central America. Nevertheless, undocumented immigration assumes a minor role in the Hispanic labor market story compared with the leading role played by human capital. Indeed, we show below that, even without controlling for legal status, all or most of the earnings deficits of Hispanic immigrants can be explained by their low levels of education and English proficiency.
TABLE 7-2 Annual Employment Rates (Percentages), by Gender, Ethnicity, and Nativity
|
Ethnicity |
Men, by Nativity |
Women, by Nativity |
||||
|
All |
Foreign-Born |
U.S.-Born |
All |
Foreign-Born |
U.S.-Born |
|
|
Whites |
|
|
91.8 |
|
|
80.2 |
|
Blacks |
|
|
77.4 |
|
|
77.7 |
|
All Hispanics |
86.8 |
87.5 |
85.6 |
67.0 |
61.2 |
76.3 |
|
Mexicans |
87.8 |
88.5 |
86.5 |
64.7 |
56.1 |
76.4 |
|
Puerto Ricans |
80.0 |
76.6 |
83.8 |
67.7 |
60.8 |
75.5 |
|
Cubans |
87.3 |
86.8 |
89.1 |
74.7 |
72.5 |
82.5 |
|
NOTE: The samples include individuals ages 25 to 59. See Appendix Table A7-3 for standard errors, as well as for analogous calculations for other Hispanic subgroups. SOURCE: 2000 census, 5% PUMS. |
||||||
Employment
The success of Hispanics in the U.S. labor market heavily depends on their propensity to work and the kinds of jobs they are able to secure. We now turn to a discussion of these issues, highlighting the important influence of human capital.
Table 7-2 reports annual employment rates for whites, blacks, and Hispanics, by gender and nativity. The annual employment rate is defined as the percentage of individuals who worked at all during the calendar year preceding the census.6 For men, the overall Hispanic employment rate of 87 percent is somewhat lower than the 92 percent rate for U.S.-born whites but well above the 77 percent rate for U.S.-born blacks. Among Hispanic men, Mexicans and Cubans are employed at similar rates, and these rates vary only modestly with nativity, whereas the lower rates observed for Puerto Ricans (80 percent, overall) are markedly higher for the U.S-born (84 percent) than the foreign-born (77 percent).7
For Hispanic women, Table 7-2 highlights the important role that nativity plays in employment determination. For every national-origin
|
6 |
See Appendix Table A7-3 for further details. Another possible measure of labor supply is annual hours of work. Compared with the employment rate, this measure has the advantage of reflecting the intensity as well as the incidence of work. It turns out, however, that the relevant patterns for annual hours are similar to those for employment, so we present only the results for employment. |
|
7 |
Appendix Table A7-3 shows that Dominican men also have relatively low employment rates. Unlike the situation for Puerto Ricans, however, employment rates are similar for foreign-born and U.S.-born Dominicans. |
group, employment rates are at least 10 percentage points lower for immigrants than for U.S. natives, with this immigrant-native gap reaching 20 percentage points for Mexicans. Among U.S.-born women, the employment rates of 76 percent for Mexicans and Puerto Ricans are close to the corresponding rates for blacks (78 percent) and whites (80 percent), and the 83 percent rate for Cubans is highest of all.
How much does the human capital deficit of U.S. Hispanics contribute to their employment gap? The next two graphs address this question, with results for men presented in Figure 7-2 and those for women in Figure 7-3.
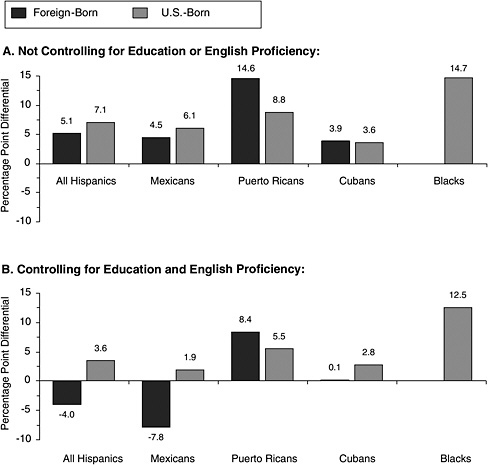
FIGURE 7-2 Male employment deficits relative to U.S.-born whites, by ethnicity and nativity.
NOTE: The samples include individuals ages 25 to 59. All of the reported differentials control for geographic location and age. See Appendix Table A7-4 for further details.
SOURCE: 2000 census, 5% PUMS.
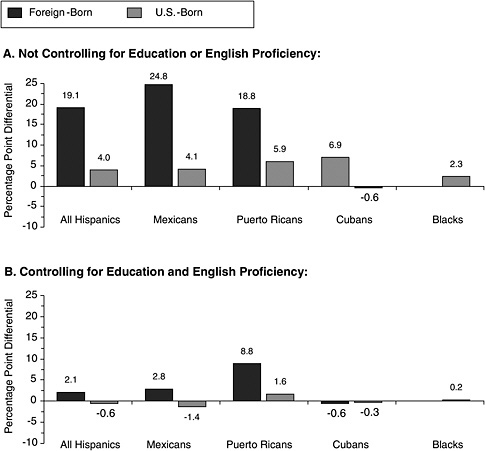
FIGURE 7-3 Female employment deficits relative to U.S.-born whites, by ethnicity and nativity.
NOTE: The samples include individuals ages 25 to 59. All of the reported differentials control for geographic location and age. See Appendix Table A7-4 for further details.
SOURCE: 2000 census, 5% PUMS.
To highlight ethnic differences, these graphs show the percentage point gap between the employment rate of each group and the corresponding rate for U.S.-born whites. A positive gap implies that whites have a higher employment rate than the group in question, whereas a negative gap indicates the opposite.8 The top panel of each figure displays the employment gaps that
|
8 |
The employment gaps shown in Figures 7-2 and 7-3 are based on the estimates reported in Appendix Table A7-4. In the graphs, however, the estimates in Table A7-4 have been first multiplied by 100 to transform them into percentage point differentials, and then their signs have been reversed so that they represent employment deficits, rather than differences, relative to U.S.-born whites. |
remain after using regression analysis to control for the influence of geographic location and age.9 The bottom panel of each figure shows what happens to the estimated employment gaps when the underlying regressions also control for completed years of schooling and English language proficiency.10
The main lesson from these figures is that the human capital disadvantage of Hispanics can account for most of their employment deficit. Indeed, after conditioning on educational attainment and English proficiency, Hispanic employment gaps (relative to U.S.-born whites) tend to vanish. For example, after adjusting for age and geographic location, Mexican men have employment deficits of 5–6 percentage points, but controlling for human capital lowers the deficit to 2 percentage points for U.S.-born Mexican Americans and creates a large employment advantage for Mexican immigrants. Foreign-born Mexican women provide an even more striking case, as controlling for education and language cuts their employment deficit from 25 percentage points down to just 3 percentage points. Puerto Ricans are an exception to this pattern, however. For immigrants, both men and women, and for U.S.-born men, large Puerto Rican employment gaps shrink substantially after conditioning on human capital, but even the adjusted gaps remain sizeable.11
Do Hispanic workers fill particular roles in the U.S. economy? Table 7-3 examines one facet of this question: the propensity to be self-employed. Among individuals ages 25–59 who were employed during the census reference week, Table 7-3 reports the percentage that mainly worked in their own business (whether incorporated or not).12 Overall, Hispanic self-employment rates lie between the corresponding rates of blacks and whites, with substantial variation across Hispanic subgroups. Cubans, both men and women, are self-employed at relatively high rates, with the rate for
|
9 |
Separate least-squares regressions were run for men and women. The dependent variable is a dummy variable indicating whether the respondent worked at all during the calendar year preceding the census. These regressions allow intercepts to differ across ethnicity/nativity groups (with U.S.-born whites as the reference group), but the coefficients of the control variables are restricted to be the same for all groups. The control variables include indicators for geographic location and age. The geographic indicators are dummy variables identifying the nine census divisions, eight states that are home to a large proportion of the Hispanic population in the United States (Arizona, California, Florida, Illinois, New Jersey, New Mexico, New York, and Texas), and whether the respondent resides in a metropolitan area. The age indicators are dummy variables identifying the five-year age group (i.e., 25–29, 30–34, …, 55–59) to which each respondent belongs. |
|
10 |
The controls for English proficiency are a set of dummy variables identifying whether respondents speak a language other than English at home, and, if so, how well such individuals report being able to speak English: “very well,” “well,” “not well,” or “not at all.” |
|
11 |
Appendix Table A7-4 shows that U.S.-born Dominican men display a similar pattern. |
|
12 |
See Appendix Table A7-5 for further details. |
TABLE 7-3 Self-Employment Rates (Percentages), by Gender, Ethnicity, and Nativity
|
Ethnicity |
Men, by Nativity |
Women, by Nativity |
||||
|
All |
Foreign-Born |
U.S.-Born |
All |
Foreign-Born |
U.S.-Born |
|
|
Whites |
|
|
13.9 |
|
|
8.1 |
|
Blacks |
|
|
5.8 |
|
|
3.4 |
|
All Hispanics |
8.2 |
8.4 |
7.9 |
6.6 |
8.0 |
5.0 |
|
Mexicans |
7.5 |
7.4 |
7.7 |
6.1 |
7.6 |
4.8 |
|
Puerto Ricans |
5.6 |
5.7 |
5.5 |
4.0 |
4.2 |
3.8 |
|
Cubans |
15.9 |
16.9 |
12.7 |
7.4 |
7.6 |
7.1 |
|
NOTE: The samples include individuals ages 25 to 59 who were employed during the census reference week. See Appendix Table A7-5 for standard errors, as well as for analogous calculations for other Hispanic subgroups. SOURCE: 2000 census, 5% PUMS. |
||||||
foreign-born Cuban males (17 percent) exceeding the rate for U.S.-born white males (14 percent). Puerto Ricans, both island-born and U.S.-born, have low self-employment rates (6 percent for men and 4 percent for women) that are similar to those of blacks. Mexican self-employment rates generally fall between the rates of the other two Hispanic groups, although foreign-born Mexican women have a relatively high rate (8 percent), as do several other groups of immigrant women such as Salvadorans/Guatemalans (11 percent), other Central Americans (8 percent), Colombians (12 percent), Peruvians/Ecuadorans (9 percent), and other South Americans (12 percent).13 Much of this self-employed work by Hispanic immigrant women is in domestic service.
For self-employment rates, it turns out that controlling for geographic location and human capital (i.e., age, education, and English proficiency) accounts for little of the differences between Hispanics and whites or of the variation across Hispanic subgroups.14 Several theories have been advanced to explain why self-employment rates vary across immigrant national-origin groups and across native ethnic groups, but these theories all have trouble providing a consistent explanation for the differences observed over a wide range of groups (Fairlie and Meyer, 1996; Portes and Rumbaut, 1990, pp. 71–79).
Table 7-4 examines another aspect of how Hispanic workers fit into the U.S. labor market: the kinds of jobs that they fill. For individuals ages 25 to 59 who were employed during the census reference week, Table 7-4
|
13 |
See Appendix Table A7-5. |
|
14 |
See Appendix Table A7-6. Also see Fairlie and Meyer (1996). |
TABLE 7-4 Industry and Occupation Distributions (Percentages), by Gender, Ethnicity, and Nativity
presents their percentage distributions across eight major industry and six major occupation categories.15 In each column, the industry percentages sum to 100 percent and the occupation percentages sum to 100 percent, except for rounding error.
At this broad level of aggregation, the important sectoral differences are related to nativity rather than to ethnicity. The industry and occupation distributions of Hispanic immigrants are quite distinct from those of any of the native groups, whereas much smaller differences exist between U.S.-born Hispanics and whites. Hispanic immigrant men disproportionately work in agriculture (11 percent) and construction (18 percent), and Hispanic immigrant women are particularly overrepresented in manufacturing (19 percent). Foreign-born Hispanics of both sexes are underrepresented in the managerial/professional and technical/sales occupations, which is not surprising given the low education levels and imperfect English skills of many Hispanic immigrants, and they are overrepresented in the service and operators/laborers occupations.
The index of dissimilarity (Duncan and Duncan, 1955) provides a useful summary measure of the extent to which two distributions differ. In the current context, for example, the dissimilarity index comparing the industry distributions of U.S.-born Hispanics and whites represents the percentage of Hispanic workers (or, equivalently, white workers) who would have to change industries in order to make the industry distributions identical for these two groups of workers. The index can range between 0 and 100 percent, with higher values indicating larger differences between the two industry distributions. In practice, the index values obtained in a particular application depend on how coarsely or finely sectors are defined, with broad industry and occupation categories such as those used here producing lower values of the index.
Dissimilarity indices comparing the industry or occupation distributions of U.S.-born whites with the corresponding distributions for each of the other ethnicity/nativity groups confirm the visual impression from Table 7-4 that U.S.-born Hispanics are the most similar to whites, followed by blacks, and then by Hispanic immigrants. For the industry comparisons, the dissimilarity indices for male workers are 5.7 for U.S.-born Hispanics,
8.5 for blacks, and 16.1 for foreign-born Hispanics. For women, the analogous indices are 3.0 for U.S.-born Hispanics, 7.9 for blacks, and 12.5 for foreign-born Hispanics. Similar patterns emerge for the occupational distributions, with male indices of 11.5 for U.S.-born Hispanics, 18.9 for blacks, and 29.5 for foreign-born Hispanics, and indices of 7.2, 9.7, and 34.2 for U.S.-born Hispanic, black, and foreign-born Hispanic women, respectively.
Earnings
Perhaps the ultimate indicator of labor market success is earnings, since earnings reflect the market’s valuation of a worker’s entire package of abilities and attributes, including those abilities and attributes for which data are often lacking (e.g., family background, the quality of schooling). Researchers have consistently found that, after controlling for human capital and observable skills, Hispanic workers enjoy earnings opportunities roughly similar to those of non-Hispanic whites (e.g., Antecol and Bedard, 2002; Bean et al., 2001; Grogger and Trejo, 2002; McManus et al., 1983; Reimers, 1983; Smith, 1991; Trejo, 1997). This finding for Hispanics contrasts with analogous research that shows that the earnings deficits of black men shrink only modestly upon adjusting for standard control variables (Altonji and Blank, 1999; Neal and Johnson, 1996).
To illustrate these patterns, Figures 7-4 and 7-5 display annual earnings gaps for Hispanics and blacks.16 The graphs show the estimated percentage earnings deficits for each group relative to U.S.-born whites.17 The samples include individuals ages 25 to 59 who worked during the calendar year preceding the decennial census.18Figure 7-4 presents the results for men
|
16 |
Our measure of earnings includes any income from self-employment. Annual earnings variation across ethnicity/nativity groups reflects differences in annual hours of work as well as differences in hourly wages. Patterns for hourly wages, however, are similar to those we report here for annual earnings. |
|
17 |
The estimated deficits come from regressions similar to those that underlie Figures 7-2 and 7-3 except that now the dependent variable is the natural logarithm of annual earnings. The key estimates from these log earnings regressions are reported in Appendix Table A7-7. For ease of exposition, in the text and in Figures 7-4 and 7-5, we refer to the estimated log earnings differentials from Table A7-7 as if they represented percentage earnings gaps. Strictly speaking, however, log earnings differentials closely approximate earnings gaps only when the log earnings differentials are on the order of .25 or less in absolute value. For larger differentials, the implied percentage earnings gap can be calculated as ec – 1, where c is the log earnings differential (i.e., the relevant estimate from Table A7-7). |
|
18 |
The fact that earnings information is unavailable for those without jobs can distort earnings comparisons like those shown in Figures 7-4 and 7-5. For example, suppose that individuals with lower earnings potential are less likely to be employed than those with higher skills and better labor market opportunities. In this case, the average earnings we observe, in the sample of people with jobs, are higher than what they would be if we somehow had |
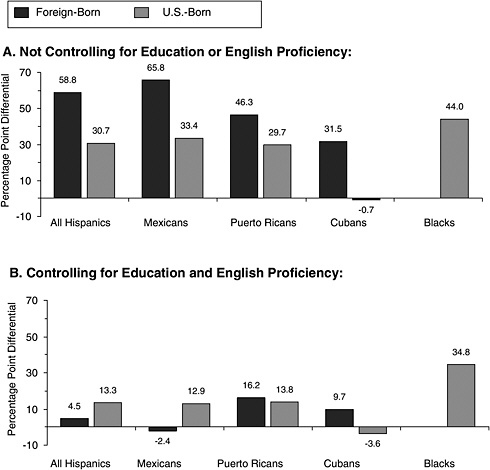
FIGURE 7-4 Male annual earnings deficits relative to U.S.-born whites, by ethnicity and nativity.
NOTE: The samples include individuals ages 25 to 59 who worked during the calendar year preceding the survey. All of the reported differentials control for geographic location and age. See Appendix Table A7-7 for further details.
SOURCE: 2000 census, 5% PUMS.
|
|
information on the earnings potential of all individuals, including those without jobs. Most importantly, the upward bias in observed average earnings will be larger for groups with relatively low employment rates, such as black and Puerto Rican men and immigrant Hispanic women, because for these groups a larger share of potentially low-earnings individuals will be excluded from the analysis samples. In an attempt to mitigate this problem, we present earnings comparisons that control for observable indicators of skill, such as age, education, and English proficiency, but the potential for bias remains to the extent that there are other important, unobserved determinants of labor market skills and earnings that are correlated with employment rates. This point should be kept in mind when interpreting the results reported in Figures 7-4 and 7-5. Under certain circumstances, statistical techniques can be |
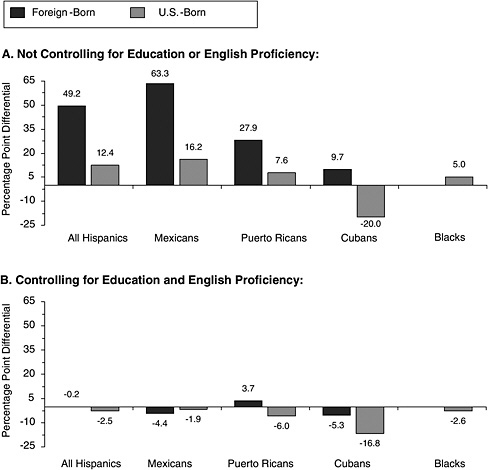
FIGURE 7-5 Female annual earnings deficits relative to U.S.-born whites, by ethnicity and nativity.
NOTE: The samples include individuals ages 25 to 59 who worked during the calendar year preceding the survey. All of the reported differentials control for geographic location and age. See Appendix Table A7-7 for further details.
SOURCE: 2000 census, 5% PUMS.
|
|
used to adjust earnings averages for the effects of employment differences across groups (Heckman, 1979), but the census data analyzed here do not provide the information necessary to make credible adjustments of this type. Later in this chapter, however, when we present estimates from longitudinal data of life-cycle patterns of human capital accumulation and wage growth, we discuss findings from research that does attempt to control for this form of selection bias as well as the endogeneity of work experience. |
and Figure 7-5 gives the corresponding results for women. As with the similar graphs of employment deficits shown earlier (Figures 7-2 and 7-3), the top panel of each figure displays earnings gaps after adjusting only for geographic location and age, whereas the bottom panel also adjusts for education and English proficiency.
Without controls for human capital (i.e., the top panels of Figures 7-4 and 7-5), earnings gaps narrow sharply as we move from Hispanic immigrants to U.S.-born Hispanic Americans. For Hispanics overall, the male earnings deficit falls from 59 percent for immigrants to 31 percent for U.S. natives, and the corresponding reduction is even larger for Hispanic women, from 49 to 12 percent. Among both men and women, Mexicans exhibit the largest earnings growth between immigrants and natives, but substantial growth of this sort also occurs for Puerto Ricans and Cubans, as well as for the other Hispanic subgroups reported in Appendix Table A7-7. U.S.-born Cubans, in particular, have relatively high earnings. Indeed, even without adjustments for education and English proficiency, Cuban American men earn the same as native white men, on average, and Cuban American women earn 20 percent more than their white counterparts. Finally, note that the earnings deficit of 44 percent for black men is considerably larger than that for U.S.-born men from any Hispanic subgroup.
The bottom panels of Figures 7-4 and 7-5 show what happens to these earnings gaps when we condition on schooling and language. For every Hispanic group with a sizeable initial earnings deficit, controlling for education and English proficiency produces a dramatic reduction in their deficit. For men, Figure 7-4 reveals that this adjustment shrinks the earnings gap from 59 to 5 percent for Hispanic immigrants and from 31 to 13 percent for U.S.-born Hispanics. In contrast, the same adjustment reduces the earnings deficit of black men only from 44 percent to 35 percent. Consequently, low human capital explains a much bigger portion of the earnings disadvantage of Hispanic men (relative to whites) than it does for black men. Moreover, after accounting for the admittedly crude measures of labor market skill available in census data—age, educational attainment, and English proficiency—the annual earnings gap of U.S.-born Hispanic men falls to 13 percent, whereas the corresponding earnings gap for black men is 35 percent. In other words, after conditioning on observable skills, Hispanics face labor market opportunities much more similar to those faced by whites than do blacks.
Figure 7–5 shows that the earnings patterns are largely the same for women. In fact, the effects of controlling for human capital are even more striking in this case, as the adjusted earnings deficit vanishes for every group of Hispanic women, regardless of nativity or national origin. Therefore, after adjusting for differences in schooling and English proficiency, all groups of Hispanic women have average annual earnings as high as those of
U.S.-born white women. In contrast to the situation for black men, however, black women display a modest earnings disadvantage relative to white women that disappears after conditioning on schooling.
We have seen that, for both employment and earnings, Hispanic–white differences are in large part explained by the relatively low human capital of most Hispanic groups. The estimates reported in the bottom panels of Figures 7-2 to 7-5, however, derive from regression specifications that constrain the impact of schooling and other measures of human capital to be the same for all ethnicity/nativity groups. Because U.S.-born whites make up the bulk of the population, the estimated labor market returns to our measures of human capital mainly reflect the returns for this dominant group. As a result, the education-adjusted employment and earnings deficits presented here reflect the quality as well as the quantity of schooling. These deficits represent the gaps relative to U.S.-born whites that would exist if Hispanics possessed as much education as whites and also earned the same labor market reward for education as whites. To the extent that differences in the returns to schooling across ethnicity/nativity groups arise from labor market discrimination rather than from differences in the quality of schooling, however, the education-adjusted employment and earnings gaps we present may overstate the role that human capital disparities play in the economic disadvantage of Hispanics. We return to the issue of differences in the returns to human capital by ethnicity and nativity in the next section.
Another issue that arises when attempting to adjust for human capital differences between workers is how to control for work experience. The results presented in the bottom panels of Figures 7-2 to 7-5 control for age, as well as years of schooling and English proficiency. By simultaneously controlling for age and education, these regressions implicitly hold constant potential work experience, which is typically measured as “Age-Years of Schooling-6.”19 The popularity of this means of controlling for differences in work experience is rooted largely in the lack of information on actual work experience in many data sources, including the decennial census and the Current Population Survey. Nonetheless, the issue is whether measures of potential work experience accurately represent the actual work experiences of various demographic groups, and whether the use of potential rather than actual work experience biases estimated earnings regressions.20 The employment rates reported in Table 7-2 (and Appendix Table A7-3)
indicate notable differences across racial and ethnic groups and especially by gender. Moreover, the extent to which work experience is systematically related to years of schooling can generate bias in estimated returns to education.21 In the next section, we explore these issues by investigating how Hispanic men and women differ relative to whites and blacks using longitudinal data for a set of birth cohorts who began their transition from school to work during the 1980s. We also discuss findings on whether the returns to schooling and work experience for Hispanics differ from those of whites or blacks.
LIFE-CYCLE PATTERNS IN LABOR MARKET EXPERIENCES AND THEIR CONSEQUENCES FOR LIFE-CYCLE WAGE GROWTH22
We now turn to a more detailed assessment of the life-cycle patterns of educational and labor market experiences of young Hispanic men and women and examine how these experiences have affected their earnings attainment. These estimates are derived for a nationally representative sample of young men and women between the ages of 13 and 16 in 1978 drawn from the National Longitudinal Survey of Youth 1979 (NLSY79).23 We note that all of the young adults enrolled in this sample resided in the United States in 1978. As a result, the sample members, including the Hispanics, had access to U.S. schools for much, if not all, of their adolescent years. As a result, we should expect to find differences in educational attainment by nativity for Hispanics between these data and those from the 2000 census presented above. Below, we present estimates for Hispanics, both U.S.-born and foreign-born, as well as blacks and whites. The information available in the NLSY79 does not permit identification of the Hispanic subgroups considered in the rest of this chapter.
Accumulated Labor Market–Related Experiences in Early Adulthood
Table 7-5 tabulates the high grades completed, high school and college graduation rates, and years spent in various work and other activities between the ages of 13 and 27 by gender and ethnicity and race.24 Consistent
TABLE 7-5 Graduation Rates and Years Spent in Various School, Work, and Other Activities
with our findings based on data from the 2000 U.S. Census of Population, Hispanics, both U.S.- and foreign-born, had lower levels of education than do their black and white counterparts. This is true, regardless of what measure of education (e.g., graduate rates or highest grades completed) is used. We note that the deficits in highest grades completed for U.S.-born Hispanics are almost identical to those presented in Table 7-1 using census data.
The high grade completed for foreign-born Hispanics in Table 7-5 is almost two grades higher, for both men and women, than the estimates presented in Table 7-1. This difference is consistent with the fact that the sample members in the NLSY79 had already entered the United States by the time they were adolescents, whereas no such restriction holds for the respondents in the 2000 census. With respect to rates of graduation from high school, the rates for Hispanic men are 15 percentage points lower than those of white men, with deficits of 17 percentage points for foreign-born Hispanic males. While the high school graduation rate deficits for all Hispanic women relative to white women are slightly lower than those for men (12 percentage points), foreign-born Hispanic women have graduation rates that were even larger than those of men (26 percentage points). The fact that we have sizeable deficits in graduation rates for foreign-born Hispanics relative to their white counterparts is all the more notable, given that the NLSY79 respondents resided in the United States during their adolescent years.
With respect to accumulated work experience, Hispanic men accumulated half a year less in the number of years they engaged in some work for pay between the ages of 13 and 27 than their white counterparts (9.98 years versus 10.48 for white men) and almost a year more than black men (9.09 years). Furthermore, we found no difference in accumulated years of work over this age range between foreign-born Hispanic men and whites. Among women, Hispanics accumulated a little more than a year less work experience than whites (9.09 versus 10.30 years for white women) and three quarters of a year more than blacks. Contrary to the findings for men, foreign-born Hispanic women worked 1.68 years less than white women over this age range.
Table 7-5 also records accumulated years spent working part-time, while both in and out of school, and working full-time during a given year. With respect to full-time work, Hispanic men worked 0.42 fewer years or 10 percent less than white men, and Hispanic women worked 0.47 years or 14.5 percent less than their white counterparts. As with overall work experience, foreign-born Hispanic men worked almost as many years between the ages of 13 and 27 as did native-born white men, but foreign-born Hispanic women were less likely to acquire full-time work experience than either U.S.-born Hispanic or white women. With respect to working part-
time in years that they were not in school, Hispanics, especially men, actually accumulated more of this type of work experience than did whites, with Hispanic men working 0.82 (or 32 percent) more years and virtually no differences between Hispanic women and their white counterparts. Finally, both Hispanic men and women, regardless of their nativity status, spent less time working while in school than did whites, although both accumulated more years of working while in school than did their black counterparts. This deficit in working-while-in-school for Hispanics relative to whites is largely due to the fact that Hispanics spent less time in school (and thus accumulated less education) than did whites. In sum, Hispanics gained less work experience in their transition from school to the world of work, and their work experience tended to be part-time rather than full-time work experience. To the extent that full-time work experience reflects greater attachment to the labor force and is more likely to enhance one’s human capital than part-time experience, these differences may play an important role in the subsequent success Hispanics had in earnings and the growth of earnings over their life-cycle.
We also present in Table 7-5 estimates of the years Hispanics spent in military service and compare them to whites and blacks. With respect to military experience, we note that since the Vietnam War, the U.S. military has been staffed by an all-volunteer force and studies have shown that military service provides an important employment and skill-enhancing opportunity for less-educated young adults, especially minority men (Kilburn, 1993). Partially consistent with the latter view, we found that black men and women spent more years in the military than their white counterparts, although relatively few young adults spent any time in the military, regardless of their race or ethnicity. However, both Hispanic men and women spent less time in the military than either blacks or whites. While this trend may have changed for more recent cohorts of young men, these statistics suggest that Hispanics did not make use of this alternative route into the U.S. labor force, which was used by less-educated blacks.
Finally, we examine the time that Hispanics and their black and white counterparts spent in an omnibus category of other nonwork, nonschool activities during their adolescent and early adult years. For young women, some of this time reflects time spent bearing and rearing children. For young men, it is less clear what activities they were engaged in, although one might presume that spending large amounts of one’s early adulthood in activities other than school, work, or the military did not enhance their success in the labor market. As recorded in Table 7-5, we found that women spent more time in this activity category than did men, and Hispanic and black women spent more of their years than did white women, consistent with both the greater time commitment of women relative to
men to childrearing and the higher fertility rates of minority women relative to white women. Among men, we also found that Hispanics spent more time not working, going to school, or serving in the military than whites but spent less of their adolescent and early adult years doing so than black men.
Wages in Early Adulthood
An important indicator of an individual’s labor market success, in addition to employment, is the wages they can command in the marketplace. Standard models of human capital accumulation (Mincer, 1974) argue that individuals acquire human capital through schooling and from the on-the-job training and experiences that are a by-product of early work experiences. Furthermore, these theories suggest that market wages received by individuals reflect the market rewards, or returns, to the amount of human capital one acquires over the life-cycle. In this section, we examine the life-cycle patterns in market wage rates received by Hispanic young men, as well as their black and white counterparts. We examine the wages and wage growth of Hispanics relative to whites and blacks during their early adulthood, focusing on ages 16 through 27. Note that these estimates are calculated using data for individuals who were employed at a particular age (more on the potential selectivity of these subsamples and their implications for estimating wages below).
Focusing on average hourly wage rates for ages 23 to 27, we found that Hispanic men and women earned $1.46 (16 percent) and $1.09 (14 percent) lower hourly wage rates, respectively, than did their white counterparts. For the same ages, Hispanic men had slightly higher wages than blacks, while Hispanic women had wage rates over a dollar lower than black women. U.S.-born Hispanics had slightly lower wages over these ages than did their foreign-born counterparts. Overall, these wage rate differentials between Hispanics and whites and blacks are consistent with those found for broader age ranges using 2000 census data.
Hispanics also experienced lower rates of growth in wages relative to whites and blacks during early adulthood. Wages over the age range 16 to 27 grew at an annual rate of 7.9 percent for Hispanic men, while the corresponding rates for white and black men were 9.2 and 8.2 percent, respectively. Among Hispanic women, wages over this same age range grew at an annual rate of 7.7 percent, compared with 8.5 and 6.9 percent per year for white and black women, respectively.25
Differences in Returns to Schooling and Work Experience for Earnings
The evidence on wage levels and growth in Table 7-6, along with that on annual earnings, indicates that over the life-cycle almost all Hispanics experienced a growing differential in wage rates between themselves and whites. As noted earlier, differences in wages between Hispanics and whites (or between Hispanics and blacks) can result from two factors: differences in the amounts of human capital—e.g., schooling, English language proficiency, and the amount and types of accumulated work experience—and differences in the returns to human capital across groups. We have already seen that a key difference between Hispanic young men and their black and white counterparts is the markedly lower levels of educational attainment for the former group. These findings are consistent with those in a large number of other studies of differences in labor market earnings by race and ethnicity.
However, a central issue in the literatures on labor market discrimination and educational quality has been the extent to which differences in labor market earnings are driven by differences across groups in the returns to skills, that is, differences by race and ethnicity in the way that labor markets reward skills.26 Several studies that have examined this issue (Grogger and Trejo, 2002; Smith, 1991; Trejo, 1997) have found that estimates of returns to additional years of schooling in terms of labor market earnings are similar for U.S.-born whites, blacks, and Hispanics. At the same time, estimated returns to years of schooling are typically much lower for immigrants. That the U.S. labor market pays less for years of schooling acquired outside the United States is a common finding that also applies to non-Hispanic groups, including whites (Borjas, 1995; Schoeni, 1997; Trejo, 2003). This finding is usually interpreted as evidence that the schooling immigrants acquire in their home country transfers imperfectly to the U.S. labor market (Chiswick, 1978).
In drawing conclusions about differences in the returns to acquired skills across racial and ethnic groups, it is important to take account of why individuals and groups differ in their accumulation of human capital (e.g., their acquisition of schooling and work experience) and how these processes relate to the generation of their labor market earnings. The central issue here is whether or not years of schooling and work experience used to measure an individual’s accumulation of human capital are exogenous with respect to one’s labor market earnings. Economic models of schooling acquisition (as well as the accumulation of work experience) assume that individuals (and families) choose these components of human capital so as
TABLE 7-6 Average Hourly Wage Rates by Age, Ages 16 to 27
to maximize, in part, their subsequent earnings (Becker, 1975; Card, 2001; Heckman et al., 2003; Mincer, 1958, 1974; Rosen, 1977; Willis, 1986).
In such models, for example, the amount of schooling an individual acquires will depend on two sets of factors: (a) individual “ability,” that is, one’s capacity to generate labor market earnings in the absence of any further skill acquisition and/or their productivity in converting schooling and work experience into market earnings and (b) “opportunities,” that is, the nontime costs of acquiring human capital and/or the ability to finance these costs. To the extent that there are differences in ability or opportunities or both across individuals, both within and across ethnic and racial groups, and that these differences are unobserved, simple (ordinary least-squares) regression methods for estimating the “average” returns to schooling and work experience—such as those used to produce the adjusted earnings in Figure 7-4 and 7-5 and as used in most simple analyses of racial, gender, and ethnic differences in earnings—are likely to be biased.27 More generally, this potential for endogeneity or self-selection bias can compromise the conclusions about ethnic and racial differences in the returns to schooling and work experience in previous empirical investigations.
In a recent paper, Hotz et al. (2002) exploit the richness of the longitudinal data in the NLSY79 to estimate the returns to educational attainment and a detailed set of accumulated work experiences, such as those presented in Table 7-5 for Hispanic, black, and white young men. The authors use a factor analytic, dynamic selection model developed by Cameron and Heckman (1998, 2001) to account for the endogenous acquisition of schooling and work experience of young white, black, and Hispanic men when estimating their returns in wages over their early careers. There are two notable findings in Hotz et al. (2002) with respect the rates of return to different forms of work and schooling experiences. First, once one controls for various forms of self-selection in the accumulation of years of schooling and work experience, one finds that spending an extra year in school (and completing an additional grade) has a higher rate of return than spending that year in full-time or part-time work or in the military. Second, there is no evidence that the returns for wages to various forms of human capital are systematically different across Hispanic and white young men once one controls for self-selection.28 These findings add further credence to the
conclusion drawn earlier—and that drawn by a number of other previous studies: the fact that Hispanics have lower labor market outcomes than whites is the result of having acquired less human capital and their lower levels of skill and not because comparably skilled Hispanics are treated differently from whites in the U.S. labor market.
TEMPORAL AND GENERATIONAL CHANGES IN THE LABOR MARKET ATTAINMENT OF HISPANICS
Our discussion of the labor market attainment of Hispanics in the United States to this point has focused either on the recent experiences (as of 2000) of Hispanics or on those of a recent cohort. But have the attainments of Hispanics in the United States improved or deteriorated over time? Have they improved across generations? In the following two sections, we address each of these questions in turn, examining whether Hispanics made progress in terms of educational attainment, employment, and earnings over the latter part of the 20th century and whether later cohorts of Hispanics show improvement relative to earlier generations. Examining the secular and generational changes in Hispanic labor market attainment is important for at least two reasons.
First, an essential part of the story of Hispanics in the United States is immigration. As has been noted by Rumbaut in Chapter 2, the United States has undergone a wave of immigration over the last 25 years that has increased the size of the Hispanic population as well as changed its composition. Both have potentially important impacts on the secular and generational trends in Hispanic attainment and on the ways they are likely to change in the future.
Second, the U.S. labor market and economy have undergone several important secular changes with important consequences for different skill groups in the U.S. workforce, including Hispanics. The past 30 years have witnessed a large rise in overall wage inequality among American workers that has resulted from substantial increases in the returns to skills (see Katz and Murphy, 1992). For example, from 1979 to 1988 the average wage rate of college graduates increased relative to that of high school graduates by 15 percentage points (Bound and Johnson, 1992, p. 371). In addition, since 1975, the United States has also experienced a significant decline in the share of employment in the manufacturing sector and a noticeable increase in the share of service-sector jobs (Levy and Murnane, 1992, Table 7). Jobs in the manufacturing sector in the United States traditionally paid relatively high wages to lower skilled workers; service-sector jobs, especially for less-skilled workers, have tended to pay lower wages and exhibit lower rates of improvement with experience and seniority. Given the lower levels of educational attainment of Hispanics relative to their white and
black counterparts, these changes in the structure of the U.S. labor market over the past 30 years have had a substantial impact on the likelihood of secular improvements for Hispanics over this period. Thus, a closer look at how Hispanics fared in the labor market over time and across generations is clearly in order.
Changes in Educational Attainment and Labor Market Earnings Over Time
We begin by discussing what happened to the educational attainment of Hispanics over the latter part of the 20th century. Whenever analyzing intertemporal trends for U.S. Hispanics, it is imperative to recognize that immigration is a fundamental source of change for this population. High rates of immigration imply that change can occur rapidly, not only in terms of the size of this group, but also with respect to its composition. As we have shown, foreign-born and U.S.-born Hispanics differ dramatically in their labor market skills and outcomes, and therefore it is essential to disaggregate by nativity when analyzing Hispanics. Immigration-induced shifts in the composition of the Hispanic population make this even more relevant when examining changes over time.
To illustrate this point, Figure 7-6 shows average years of schooling for Mexican and white men in the 1980, 1990, and 2000 censuses. If we compare all Mexicans (i.e., foreign-born and U.S.-born combined) with U.S.-born whites, the story that emerges is one of educational stagnation. Between 1980 and 2000, average schooling rose by just 0.4 years for all Mexicans (from 9.4 to 9.8), which is only half of the 0.8-year increase experienced by whites (from 12.8 to 13.6), so the educational disadvantage of Mexicans appears to have widened. Looking at the trends by nativity, however, leads to exactly the opposite conclusion. Over these two decades, average schooling climbed by 1.2 years for foreign-born Mexicans (from 7.3 to 8.5) and by 1.5 years for U.S.-born Mexicans (from 10.6 to 12.1), so both groups actually made some progress in closing their educational gaps relative to whites.
Why is the overall trend for Mexicans much less favorable than the nativity-specific trends? Because immigrants, with their relatively low education levels, constitute an increasingly large share of U.S. Mexicans. In the samples of men ages 25 to 59 used in Figure 7-6, the percentage foreign-born among Mexicans shot up from 37 percent in 1980 to 51 percent in 1990 and 63 percent in 2000. With the potential for profound compositional changes such as this, trends for Hispanic groups that do not distinguish by nativity are likely to provide a misleading portrait of what is really happening to these groups.
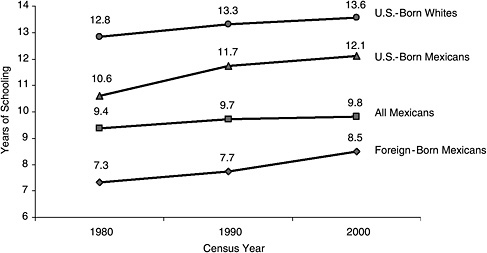
FIGURE 7-6 Average years of schooling for men, 1980–2000, by ethnicity and nativity.
NOTE: The samples include men ages 25 to 59.
SOURCE: 1980, 1990, and 2000 census, 5% PUMS.
We next turn to what happened to labor market earnings for Hispanics relative to whites and blacks over the latter part of the 20th century. In Table 7-7, we present estimates of the annual earnings of Hispanic men and women, for all Hispanics and subgroups, as a percentage of the earnings of whites and blacks for 1980, 1990, and 2000. On average, the gap in earnings between Hispanic men and women relative to U.S.-born whites grew from 1980 to 2000, with most of the change occurring between 1980 and 1990. In 1980, the earnings of Hispanic men were 58.5 percent of those of white men; by 2000, the earnings of Hispanic men had declined to 50.8 percent of white men. The declines in the earnings of Hispanic women relative to their white counterparts were even larger, declining by 18.5 percentage points from 1980 to 2000. Notably, the earnings of Hispanic men and women also declined relative to U.S.-born blacks, with the declines being steeper for men relative to women. As shown in Table 7-7, there is some variation in this pattern when comparing Hispanic subgroups to whites and blacks. Mexicans show steeper declines in earnings, relative to whites and blacks for both men and women. In contrast, the earnings of Puerto Rican men actually improved relative to whites and blacks, while the earnings of Puerto Rican women relative to whites declined slightly but remained largely unchanged relative to their black counterparts. The earnings of Cuban men remained largely unchanged relative to white men and
TABLE 7-7 Annual Earnings of Hispanics Relative to Black and Whites, 1980–2000
|
Ethnicity/Nativity |
Men |
Women |
||||||||||
|
Annual Earnings as Percentage of U.S.-Born Whites |
Annual Earnings as Percentage of U.S.-Born Blacks |
Annual Earnings as Percentage of U.S.-Born Whites |
Annual Earnings as Percentage of U.S.-Born Blacks |
|||||||||
|
1980 |
1990 |
2000 |
1980 |
1990 |
2000 |
1980 |
1990 |
2000 |
1980 |
1990 |
2000 |
|
|
U.S.-born blacks |
54.8 |
49.5 |
56.0 |
|
|
|
105.3 |
99.6 |
95.0 |
|
|
|
|
All Hispanics |
||||||||||||
|
All |
58.5 |
49.8 |
50.8 |
106.8 |
100.6 |
90.7 |
85.2 |
73.0 |
66.7 |
80.9 |
73.3 |
70.2 |
|
Foreign-born |
48.4 |
37.5 |
41.2 |
88.3 |
75.8 |
73.6 |
82.1 |
59.0 |
50.8 |
78.0 |
59.2 |
53.5 |
|
U.S.-born |
68.9 |
67.9 |
69.3 |
125.7 |
137.2 |
123.8 |
88.0 |
88.9 |
87.6 |
83.6 |
89.3 |
92.2 |
|
Mexicans |
||||||||||||
|
All |
55.8 |
45.4 |
45.8 |
101.8 |
91.7 |
81.8 |
77.8 |
65.9 |
60.3 |
73.9 |
66.2 |
63.5 |
|
Foreign-born |
38.1 |
26.3 |
34.2 |
69.5 |
53.1 |
61.1 |
63.8 |
37.8 |
36.7 |
60.6 |
38.0 |
38.6 |
|
U.S.-born |
66.3 |
65.1 |
66.6 |
121.0 |
131.5 |
118.9 |
83.7 |
83.8 |
83.8 |
79.5 |
84.1 |
88.2 |
|
Puerto Ricans |
||||||||||||
|
All |
50.1 |
53.5 |
62.0 |
91.4 |
108.1 |
110.7 |
89.7 |
85.3 |
82.8 |
85.2 |
85.6 |
87.2 |
|
Foreign-born |
44.8 |
45.8 |
53.7 |
81.8 |
92.5 |
95.9 |
85.6 |
75.8 |
72.1 |
81.3 |
76.1 |
75.9 |
|
U.S.-born |
69.5 |
66.0 |
70.3 |
126.8 |
133.3 |
125.5 |
101.7 |
98.6 |
92.4 |
96.6 |
99.0 |
97.3 |
|
Cubans |
||||||||||||
|
All |
77.4 |
76.7 |
75.8 |
141.2 |
154.9 |
135.4 |
110.3 |
104.8 |
97.9 |
104.7 |
105.2 |
103.1 |
|
Foreign-born |
76.9 |
73.7 |
68.5 |
140.3 |
148.9 |
122.3 |
109.5 |
102.5 |
90.3 |
104.0 |
102.9 |
95.1 |
|
U.S.-born |
83.1 |
95.7 |
100.7 |
151.6 |
193.3 |
179.8 |
122.3 |
118.5 |
120.0 |
116.1 |
119.0 |
126.3 |
|
NOTE: The estimates for 1980 and 1990 are constructed in an analogous way, using data from the 1980 and 1990 5% PUMS, census fi les. The estimates for 2000 are taken from Appendix Table A7-7, Columns (1) for Men and Women. SOURCE: 1980, 1990, 2000 censuses 5% PUMS. |
||||||||||||
improved relative to blacks, while Cuban women saw their earnings decline relative to white women and remain largely the same relative to black women.
The trends in the relative labor market earnings of Hispanics are markedly different for those who are foreign-born and U.S.-born. For Hispanics taken as a group and for all subgroups but Puerto Ricans, the earnings of foreign-born Hispanics either declined or remained unchanged relative to the earnings of whites and blacks. The relative declines in earnings for the foreign-born were more pronounced among all groups of Hispanic women. In contrast, the earnings of U.S.-born Hispanics tended to either improve or remain the same, compared with those of whites and blacks over the last 30 years of the 20th century. Thus, consistent with the trends in years of schooling—and probably as a result of the changes in educational attainment—the story of what happened to Hispanics over the latter part of the 20th century with respect to their success in the labor market is largely driven by immigration and where these groups were educated. The more recent waves of immigrants have fallen behind their white and black counterparts, while those educated in the United States tended to hold their position but not improve, relative to whites and blacks. In short, the education deficits of Hispanics, primarily those of the foreign-born, appear to have been an increasing liability over time as the U.S. labor market restructured and put a greater premium on work-related skills.
Intergenerational Changes in Attainment
As noted above, a distinguishing feature of the U.S. Hispanic population is the preponderance of those who are relatively new to this country. Because of the large volume of immigration from Spanish-speaking countries over the past several decades, most Hispanic workers in the United States come from families that have been in the country for no more than two generations. Previous waves of predominantly unskilled immigrants, such as the Italians and the Irish, experienced substantial intergenerational progress that ultimately enabled their descendants to join the economic mainstream of American society, but this process took two or three generations to unfold (Borjas, 1994; Chiswick, 1977; Neidert and Farley, 1985; Perlmann and Waldinger, 1997). When analyzing labor market outcomes for U.S. Hispanics, it is therefore of interest to examine differences not just between the foreign-born and U.S.-born, but also, when possible, across generations of the U.S.-born. In this section, we explore what available data can tell us about such intergenerational patterns.
Beginning in 1980, the decennial census stopped asking respondents where their parents were born. Starting in 1994, the Current Population Survey (CPS) began collecting this information on a regular basis from all
respondents. As a result, the CPS is currently the best large-scale U.S. data set for investigating how Hispanic labor market outcomes vary by immigrant generation.
The CPS is a monthly survey of about 50,000 households that the U.S. government uses to estimate unemployment rates and other indicators of labor market activity. Every March, the CPS includes a set of additional questions, known as the annual demographic supplement, that collects detailed information on respondents’ labor supply and sources of income for the preceding calendar year. We analyzed microdata from these March CPS files for the years 1998–2002, and the earnings measures that we constructed pertain to calendar years 1997–2001.29
As before, we restricted our analysis to individuals in the age range of 25 to 59. Using the CPS information on the nativity of each individual and his or her parents, we define three broad categories of immigrant generation. The first generation consists of immigrants: foreign-born individuals whose parents were also born outside the United States. The second generation includes U.S.-born individuals who have at least one foreign-born parent. The “third and higher generation” is the designation applied to U.S. natives whose parents are also natives. For ease of exposition, we often refer to this last group as the “3rd+ generation” or simply the third generation. Compared with the census data presented earlier, the main advantage of the CPS is this ability to distinguish between the second and third+ generations of U.S.-born individuals. For our purposes, important drawbacks of the CPS data are the smaller sample sizes and the absence of information about English proficiency.
The standard method for identifying Hispanics in CPS data is to use respondents’ self-reported information about their ethnicity. In response to a question about their “origin or descent,” individuals can report themselves to be non-Hispanic, or they can choose to identify as a member of one of the following Hispanic groups: Mexican (including Mexican American, Chicano, or Mexicano), Puerto Rican, Cuban, Central or South American, or the residual category of “other Hispanic.” We employ this standard method for identifying Hispanics. An alternative method is to assign Hispanic ethnicity based on the countries of birth of the respondent and his or her parents, but this method cannot identify Hispanics beyond the second generation. Moreover, for the analyses reported below, using the alternative method to identify first- and second-generation Hispanics produces results similar to those obtained from the standard method.
In addition to reporting results for all three generational categories of Hispanics, we also present analogous statistics for non-Hispanic whites and
for non-Hispanic blacks. Here, the non-Hispanic samples include only individuals who are third and higher generation.
Figure 7-7 begins our intergenerational analysis of CPS data with a look at educational attainment.30 We focus on differences between the second and third generations, because this is the information not available in the census data already discussed. Strikingly, average education levels are essentially the same for second and later generations of Hispanics. This finding seems surprising in light of the large schooling gains that occur between the first and second generations and the sizeable educational gap that remains between second-generation Hispanics and third-generation whites.
Mexicans and Puerto Ricans display the same general patterns as Hispanics overall, with substantial schooling growth between the first and second generations, little or no additional growth after the second generation, and a large educational deficit relative to whites that persists into at least the third generation. As before, Cubans stand out from the other groups with remarkably high levels of schooling. At over 14 years, the average education of second-generation Cubans is at least half a year above that of third-generation whites.
Figures 7-8 and 7-9 present a parallel analysis of annual earnings gaps. The graphs show the estimated percentage earnings deficits for each group relative to third-generation whites.31 For Hispanic men (Figure 7-8), earnings gaps narrow across generations, with the biggest decline between the first and second generations and a smaller decline after that. The earnings deficit for Mexican men, for example, falls from 67 percent for immigrants to 38 percent for the second generation to 31 percent for later generations. For Puerto Rican men, the analogous earnings deficits are 48 percent for the first generation, 31 percent for the second generation, and 16 percent for later generations. Remarkably, the 39 percent earnings deficit among Cuban immigrants disappears by the second generation. For comparison purposes, note that the earnings gap for third-generation black men is 41 percent.
The bottom panel of Figure 7-8 shows what happens to these earnings gaps when we condition on schooling.32 As before, all of the earnings
|
30 |
Because our CPS samples include very few Cubans who are third generation, only statistics for the first and second generations are shown for this national-origin group. See Appendix Table A7-8 for the calculations underlying Figure 7-7, including standard errors and cell sample sizes. Appendix Table A7-8 also reports results for the two somewhat amorphous Hispanic subgroups identified by the CPS but not shown in Figure 7-1: Central/South Americans and “other Hispanics.” |
|
31 |
See Appendix Table A7-9 for details of these estimates. |
|
32 |
Unlike the census, the March CPS does not collect information on English proficiency, so we cannot also adjust for this factor. |
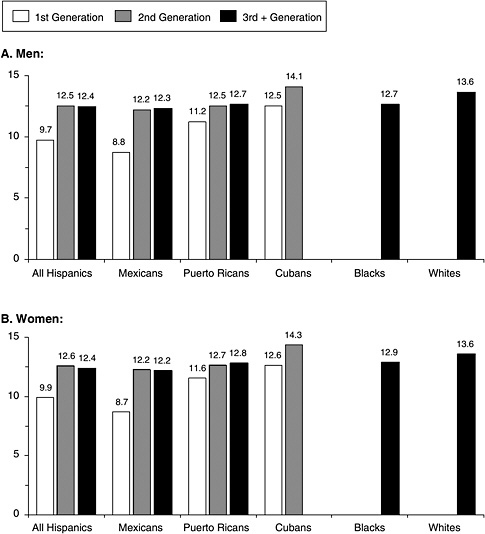
FIGURE 7-7 Average years of schooling, by gender, ethnicity, and generation.
NOTE: The samples include individuals ages 25 to 59. See Appendix Table A7-8 for further details.
SOURCE: March 1998–2002, CPS data.
deficits for Hispanic men shrink substantially after controlling for education, whereas this same adjustment produces a less dramatic decline in the earnings deficit of black men.
Figure 7-9 tells a similar story for Hispanic women. For Hispanics as a whole, the earnings gap is huge for immigrants (51 percent) and much smaller for the second and third generations (9–15 percent). Controlling
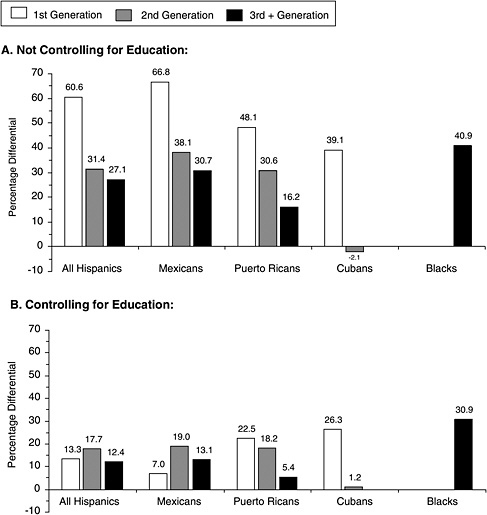
FIGURE 7-8 Male annual earnings deficits relative to 3rd+ generation whites, by ethnicity and generation.
NOTE: The samples include men ages 25 to 59 who worked during the calendar year preceding the survey. All of the reported differentials control for survey year, geographic location, and age. See Appendix Table A7-9 for further details.
SOURCE: March 1998–2002, CPS data.
for education dramatically lowers this gap for immigrants (to 5 percent) and eliminates it altogether for U.S. natives. The pattern is the same for each of the Hispanic subgroups. In fact, after adjusting for educational differences, U.S.-born women from every Hispanic national-origin group have average annual earnings as high as those of third-generation white women. As we saw earlier in the census data, black women possess a small
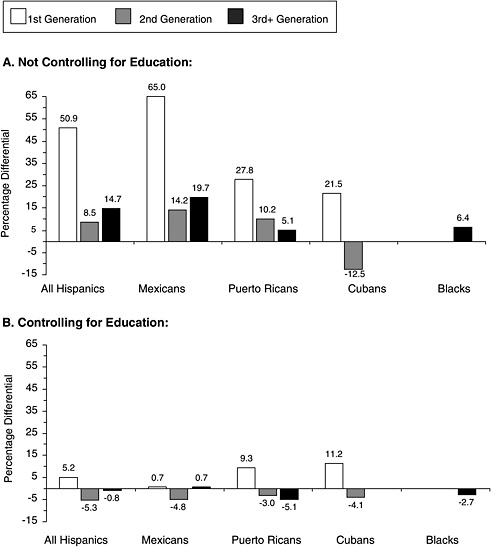
FIGURE 7-9 Female annual earnings deficits relative to 3rd+ generation whites, by ethnicity and generation.
NOTE: The samples include women ages 25 to 59 who worked during the calendar year preceding the survey. All of the reported differentials control for survey year, geographic location, and age. See Appendix Table A7-9 for further details.
SOURCE: March 1998–2002, CPS data.
earnings disadvantage relative to white women that disappears once we control for schooling.
The education data in Figure 7-7 and the earnings data in Figures 7-8 and 7-9 reveal substantial gains for Hispanics between immigrants and the second generation. In contrast, the same data show relatively minor differences between second-generation and later-generation Hispanics in terms
of their labor market skills and success, despite the fact that in these dimensions U.S.-born Hispanics continue to trail whites by a considerable amount. Does this imply that intergenerational progress stalls for Hispanics after the second generation? Not necessarily. As noted by Borjas (1993) and Smith (2003), generational comparisons in a single cross-section of data do a poor job of matching immigrant parents and grandparents in the first generation with their actual descendants in later generations. Indeed, Smith (2003) found evidence of more substantial gains between second-and third-generation Hispanics when he combined cross-sectional data sets from successive time periods in order to compare second-generation Hispanics in some initial period with their third-generation descendants 25 years later. Yet even Smith’s analysis shows some signs of intergenerational stagnation for Hispanics. In his Table 4, for example, five of the six most recent cohorts of Mexicans experience no wage gains between the second and third generations. Moreover, all studies conclude that large education and earnings deficits remain for third- and higher-generation Mexican Americans.33
If we assume that schooling is complete by the age of 25 and does not change thereafter, we can use our CPS samples to conduct an analysis of intergenerational changes in Hispanic educational attainment similar in spirit to that of Smith (2003). Table 7-8 presents average schooling levels like those displayed previously in Figure 7-7, except that now separate calculations have been done for two particular age groups: 25–34 and 50–59. By choosing age groups 25 years apart, we create a situation in which the older age group from a particular generation potentially represents the parental cohort for the younger age group in the next generation. For example, the cohort of immigrant men ages 50 to 59 is likely to include fathers of the second-generation cohort of sons ages 25 to 34. Following Smith (2003), we report calculations for Hispanics overall and also for Mexicans, the only Hispanic subgroup with adequate sample sizes for a separate analysis.
If we make comparisons within age groups by reading down the columns of Table 7-8, we tend to see the same story that emerged from Figure 7-7: huge educational improvement for Hispanics between the first and second generations but little progress after the second generation.34 The story changes for the second and third generations, however, if we instead compare age/generation groups that could match parents with their children. Among Hispanic men, for example, average schooling rises from 12
TABLE 7-8 Average Years of Schooling, by Gender, Ethnicity, Generation, and Age
|
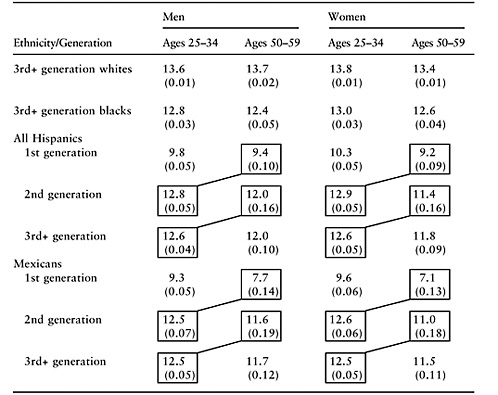 |
|
NOTE: Standard errors are shown in parentheses. SOURCE: March 1998–2002, CPS data. |
years for the older second generation to 12.6 years for the younger third generation. The analogous educational expansion between the second and third generations is even larger for Mexican men, from 11.6 to 12.5 years. Note that calculating progress between the first and second generations in this same way produces huge gains, even bigger than those we saw in Figure 7-7: 3.4 years for Hispanic men and 4.8 years for Mexican men.
Patterns are similar for women, with the implied intergenerational gains somewhat larger than those for men. For Hispanics overall, comparing older and younger women across generations yields schooling growth of 3.7 years between the first and second generations and 1.2 years between the second and third generations. For Mexican women, the corresponding gains are 5.5 years between the first and second generations and 1.5 years between the second and third generations. Despite this apparent progress,
we should point out that young third-generation Hispanics still trail the average schooling of their white peers by a year or more.
Does this educational improvement between older second-generation Hispanics and younger third-generation Hispanics truly represent intergenerational progress, or could it be something else? One possibility is that it reflects secular trends that have raised average schooling levels for all young people relative to their elders. The data in Table 7-8 for third-generation whites suggest that this is not the case, however. For white men, the younger age group is not any more educated than the older age group. For white women, the younger age group has a schooling advantage of less than half a year, which accounts for at most a third of the estimated educational progress between the second and third generations of Hispanic women.
Another possibility is that the civil rights movement and related factors opened up educational opportunities for younger members of minority groups that were not available for their parents. For men there is some evidence consistent with this hypothesis, in that for blacks the younger age group averages almost half a year more schooling than the older age group, whereas for whites the younger age group actually has slightly less education than the older age group. If we believe that young Hispanics experienced a similar educational gain arising from increased educational opportunities for minorities, this could account for most of the estimated intergenerational progress between second- and third-generation Hispanic men, and for about half of the corresponding intergenerational progress for Mexican men. Note, however, that for women the educational advantage of the younger age group relative to the older age group is the same for blacks and whites, so this argument cannot account for any of the estimated intergenerational progress for Hispanic or Mexican women.
A different issue concerning the measurement of intergenerational progress for Hispanics arises because ethnic identification is to some extent endogenous, especially among people at least one or two generations removed from immigration to the United States (Alba, 1990; Waters, 1990). Consequently, the descendants of Hispanic immigrants who continue to identify themselves as Hispanic in the third and higher generations may be a select group.35 In particular, if the most successful Hispanics are more likely to intermarry or for other reasons cease to identify themselves or their children as Hispanic, then available data may understate human capital and earnings gains between the second and third generations.
Duncan and Trejo (2005) have begun to investigate this issue with respect to Mexicans. Analyzing 2000 census data, they find that U.S.-born
Mexican Americans who marry non-Mexicans are substantially more educated, on average, than are Mexican Americans who marry coethnics (whether they are Mexican Americans or Mexican immigrants). The educational selectivity of Mexican American intermarriage generates corresponding differences in the employment and earnings of Mexican Americans according to the ethnicity of their spouses. Moreover, the children of intermarried Mexican Americans are much less likely to be identified as Mexican than are the children of endogamous Mexican marriages. These forces combine to produce strong negative correlations among the education, employment, and earnings of Mexican American parents and the chances that their children retain a Mexican ethnicity. Several important steps remain to be done, however, before these correlations can be used to assess the magnitude of potential biases that might be obscuring the intergenerational progress of Mexican Americans.
CONCLUSION
This chapter has analyzed both the absolute and relative success that Hispanics have experienced in the U.S. labor market. Several conclusions emerge. First and foremost, the human capital disadvantages that characterize Hispanics as a group, especially those who are foreign-born, end up heavily shaping how they fare in the U.S. labor market. As we have documented above, Hispanics living in the United States today, especially Mexicans, have much lower levels of education than do whites or blacks. This schooling deficit is largely the result of an increasing share of Hispanics in the United States who are foreign-born and, in many cases, educated outside the United States. Not surprisingly, we also found that Hispanics in the United States have lower levels of English proficiency than their white or black counterparts. It is well documented that these forms of human capital, especially educational attainment, are important for success in the U.S. labor market, given the restructuring of the U.S. economy that has occurred over the past 25–30 years. As a result, we do find that Hispanics have tended to lag behind whites (although not blacks) in their rates of employment, presence in high-paying occupations, and overall levels of earnings.
A second major conclusion that emerges with respect to Hispanics concerns how their skills are valued, or rewarded, in the U.S. labor market. We consistently find that, after adjusting for the levels of human capital (e.g., schooling and English language proficiency), Hispanics do almost as well as whites with respect to both employment and labor market earnings. This fact is all the more notable, given that such adjustments for differences in these observable measures of human capital do not end up accounting for much of the gaps in labor market outcomes between blacks and whites. Finally, several more refined studies also indicate that there is difference in
the returns in the earnings that Hispanics and whites receive for their schooling and accumulated work experiences. Taken together, this evidence clearly suggests that comparably skilled Hispanics are treated no differently from whites in the U.S. labor market.
The final issue concerns what one learns from generational and temporal changes with respect to what the future will bear for the success of Hispanics in the U.S. labor market. Here our findings are a bit less conclusive. In particular, we have found that there is clear progress in educational attainment and earnings between first- and second-generation Hispanics in the United States, both absolutely and relative to whites. With respect to progress between the second and higher generations, the evidence is less clear. As noted by Smith (2003), one does find evidence of progress between the second and higher generations in educational attainment once one appropriately aligns the data to reflect secular changes. At the same, the corresponding progress in earnings is less clear-cut, especially among younger cohorts of Mexicans. Moreover, forecasting what will happen to Hispanics with respect to their labor market success in the future hinges heavily on the rates and nature of Hispanic immigration to the United States and on how technological and institutional changes alter the requirements for success in the U.S. labor market.
ACKNOWLEDGMENTS
We wish to thank Jose Escarce, Charles Hirschman, Nancy Landale, Seth Sanders, Marta Tienda, and the anonymous reviewers for detailed comments on earlier drafts of this chapter. We also thank all of our colleagues on the National Research Council panel to study Hispanics in the United States, as well as the panel’s staff, for invaluable support, encouragement, and inspiration. Any remaining errors are attributable to the authors.
REFERENCES
Ahituv, A., and Tienda, M. (2004). Employment motherhood, and school continuation decisions of young white, black, and Hispanic women. Journal of Labor Economics, 22(1), 115–158.
Alba, R.D. (1990). Ethnic identity: The transformation of white America. New Haven, CT: Yale University Press.
Altonji, J.G., and Blank, R.M. (1999). Race and gender in the labor market. In O. Ashenfelter and D. Card (Eds.), Handbook of labor economics (vol. 3C, pp. 3143–3259). Amsterdam: North Holland Press.
Antecol, H., and Bedard, K. (2002). The relative earnings of young Mexican, black, and white women. Industrial and Labor Relations Review, 56(1), 122–35.
Antecol, H., and Bedard, K. (2004, Spring). The racial wage gap. Journal of Human Resources, 39(2), 564–583.
Bacolod, M., and Hotz, V.J. (2004, May). Cohort changes in the transition from school to work: What changed and what consequences did it have for wages? Unpublished manuscript, University of California, Los Angeles.
Bean, F.D., and Stevens, G. (2003). America’s newcomers and the dynamics of diversity. New York: Russell Sage Foundation.
Bean, F.D., and Tienda, M. (1987). The Hispanic population of the United States. New York: Russell Sage Foundation.
Bean, F.D., Swicegood, C.G., and Berg, R. (2000, March). Mexican-origin fertility: New patterns and interpretations. Social Science Quarterly, 81(1), 404–420.
Bean, F.D., Trejo, S.J., Capps, R., and Tyler, M. (2001). The Latino middle class: Myth, reality and potential. Claremont, CA: Tomas Rivera Policy Institute.
Becker, G. (1975). Human capital: A theoretical analysis with special reference to education (2nd ed.). New York: Columbia University Press.
Bleakley, H., and Chin, A. (2004). Language skills and earnings: Evidence from childhood immigrants. Review of Economics and Statistics, 86(2), 481–496.
Borjas, G.J. (1993). The intergenerational mobility of immigrants. Journal of Labor Economics, 11(1), 113–135.
Borjas, G.J. (1994). Long-run convergence of ethnic skill differentials: The children and grandchildren of the great migration. Industrial and Labor Relations Review, 47(4), 553–573.
Borjas, G.J. (1995). Assimilation and changes in cohort quality revisited: What happened to immigrant earnings in the 1980s? Journal of Labor Economics, 13(2), 201–245.
Bound, J., and Johnson, G. (1992). Changes in the structure of wages in the 1980s: An evaluation of alternative explanations. American Economic Review, 82(3), 371–392.
Cameron, S., and Heckman, J. (1998). Life cycle schooling and dynamic selection bias: Models and evidence for five cohorts of American males. Journal of Political Economy, 106(2), 262–333.
Cameron, S., and Heckman, J. (2001). The dynamics of educational attainment for blacks, Hispanics, and whites. Journal of Political Economy, 109(3), 455–499.
Card, D. (2001). Estimating the return to schooling: Progress on some persistent econometric problems. Econometrica, 69(5), 1127–1160.
Card, D., DiNardo, J., and Estes, E. (2000). The more things change: Immigrants and the children of immigrants in the 1940s, the 1970s, and the 1990s. In G.J. Borjas (Ed.), Issues in the economics of immigration (pp. 227–269). Chicago, IL: University of Chicago Press.
Carlson, L.A., and Swartz, C. (1988, July). The earnings of women and ethnic minorities, 1959–1979. Industrial and Labor Relations Review, 41(4), 530–546.
Carnoy, M., Daley, H.M., and Hinojosa-Ojeda, R. (1993). The changing economic position of Latinos in the U.S. labor market since 1939. In R. Morales and F. Bonilla (Eds.), Latinos in a changing U.S. economy: Comparative perspectives on growing inequality (pp. 28–54). Newbury, CA: Sage.
Chiswick, B.R. (1977, February). Sons of immigrants: Are they at an earnings disadvantage? American Economic Review, 67(1), 376–380.
Chiswick, B.R. (1978, October). The effect of Americanization on the earnings of foreign-born men. Journal of Political Economy, 86(5), 897–921.
Cotton, J. (1985, December). More on the “cost” of being a black or Mexican-American male worker. Social Science Quarterly, 66(4), 867–885.
Darity, W., Jr., Guilkey, D., and Winfrey, W. (1995). Ethnicity, race, and earnings. Economics Letters, 47(3–4), 401–408.
DeFreitas, G. (1991). Inequality at work: Hispanics in the U.S. labor force. New York: Oxford University Press.
Donato, K.M., and Massey, D.S. (1993). Effect of the immigration reform and control act on the wages of Mexican migrants. Social Science Quarterly, 74(3), 523–541.
Duncan, B., and Trejo, S. J. (2005). Ethnic identification, intermarriage, and the hidden progress of Mexican Americans. (Working Paper #04-05-02.) Austin: University of Texas Population Research Center.
Duncan, O.D., and Duncan, B. (1955, April). A methodological analysis of segregation indexes. American Sociological Review, 20(2), 210–217.
Fairlie, R.W., and Meyer, B.D. (1996, Fall). Ethnic and racial self-employment differences and possible explanations. Journal of Human Resources, 31(4), 757–793.
Grenier, G. (1984, Winter). The effects of language characteristics on the wages of Hispanic-American males. Journal of Human Resources, 19(1), 35–52.
Griliches, Z. (1977). Estimating the returns to schooling: Some econometric problems. Econometrica, 45(1), 1–22.
Grogger, J., and Trejo, S.J. (2002). Falling behind or moving up? The intergenerational progress of Mexican-Americans. San Francisco: Public Policy Institute of California.
Gwartney, J.D., and Long, J.E. (1978, April). The relative earnings of blacks and other minorities. Industrial and Labor Relations Review, 31(3), 336–346.
Heckman, J. (1979). Sample selection bias as a specification error. Econometrica, 47(1), 153-161.
Heckman, J., and Vytlacil, E. (1998). Instrumental variables methods for the correlated random coefficient model: Estimating the average rate of return to schooling when the return is correlated with schooling. Journal of Human Resources, 33(4), 974–987.
Heckman, J., Lochner, L., and Todd, P. (2003). Fifty years of Mincer earnings regressions. (NBER Working Paper No. 9732.) Cambridge, MA: National Bureau of Economic Research.
Hotz, V.J., Xu, L. C., Tienda, M., and Ahituv, A. (2002). Are there returns to the wages of young men from working while in school? Review of Economics and Statistics, 84(2), 221–236.
Katz, L., and Murphy, K. (1992). Changes in the relative wages, 1963–1987: Supply and demand factors. Quarterly Journal of Economics, 107(1), 35–78.
Kilburn, R. (1993). Minority representation in the U.S. military. Unpublished Ph.D. dissertation, University of Chicago.
Kossoudji, S.A., and Cobb-Clark, D.A. (2002). Coming out of the shadows: Learning about legal status and wages from the legalized population. Journal of Labor Economics, 20(3), 598–628.
Levy, F., and Murnane, R.J. (1992). U.S. earnings levels and earnings inequality: A review of recent trends and proposed explanations. Journal of Economic Literature, 30(3), 1333–1381 .
Massey, D.S. (1987, Summer). Do undocumented migrants earn lower wages than legal immigrants? New evidence from Mexico. International Migration Review, 21(2), 236–274.
McManus, W., Gould, W., and Welch, F. (1983). Earnings of Hispanic men: The role of English language proficiency. Journal of Labor Economics, 1(2), 101–130.
Mincer, J. (1958). Investment in human capital and personal income distribution. Journal of Political Economy, 66(4), 281–302.
Mincer, J. (1974). Schooling, experience, and earnings. New York: National Bureau of Economic Research.
Mora, M.T. (1988, September). Did the English deficiency earnings penalty change for Hispanic men between 1979 and 1989? Social Science Quarterly, 79(3), 581–594.
Murphy, K.M., and Welch, F. (1990). Empirical age-earnings profiles. Journal of Labor Economics, 8(2), 202–229.
Neal, D.A., and Johnson, W.R. (1996). The role of premarket factors in black-white wage differences. Journal of Political Economy, 104(5), 869–895.
Neidert, L.J., and Farley, R. (1985, December). Assimilation in the United States: An analysis of ethnic and generation differences in status and achievement. American Sociological Review, 50(6), 840–850.
Passel, J.S. (2004). Mexican immigration to the U.S.: The latest estimates. Washington, DC: Migration Policy Institute.
Passel, J.S., Capps, R., and Fix, M. (2004). Undocumented immigrants: Facts and figures. Manuscript, Urban Institute, Washington, DC.
Perlmann, J., and Waldinger, R. (1997, Winter). Second generation decline? Children of immigrants past and present: A reconsideration. International Migration Review, 31(4), 893–922.
Portes, A., and Rumbaut, R.G. (1990). Immigrant America: A portrait. Berkeley: University of California Press.
Reimers, C.W. (1983, November). Labor market discrimination against Hispanic and black men. Review of Economics and Statistics, 65(4), 570–579.
Rivera-Batiz, F.L. (1999). Undocumented workers in the labor market: An analysis of the earnings of legal and illegal Mexican immigrants in the United States. Journal of Population Economics, 12(1), 91–116.
Rosen, S. (1977, Fall). Human capital: A survey of empirical research. In R. Ehrenberg (Ed.), Research in labor economics (vol. 1, pp. 3–40). Greenwich, CT: JAI Press.
Schoeni, R.F. (1997, Fall). New evidence on the economic progress of foreign-born men in the 1970s and 1980s. Journal of Human Resources, 32(4), 683–740.
Smith, J.P. (1991). Hispanics and the American dream: An analysis of Hispanic male labor market wages, 1940–1980. Santa Monica, CA: Rand Corporation.
Smith, J.P. (2001). Race and ethnicity in the labor market: Trends over the short and long term. In N.J. Smelser, W.J. Wilson, and F. Mitchell (Eds.), America becoming: Racial trends and their consequences (vol. II, pp. 52–97). Washington, DC: National Academy Press.
Smith, J.P. (2003, May). Assimilation across the Latino generations. American Economic Review, 93(2), 315–319.
Trejo, S.J. (1996, July). Obstacles to the labor market progress of California’s Mexican-origin workers. (Working Paper, vol. 4, no. 1.) Berkeley: University of California, Chicano/Latino Policy Project.
Trejo, S.J. (1997). Why do Mexican-Americans earn low wages? Journal of Political Economy, 105(6), 1235–1268.
Trejo, S.J. (2003, Summer). Intergenerational progress of Mexican-origin workers in the U.S. labor market. Journal of Human Resources, 38(3), 467–489.
Waters, M.C. (1990). Ethnic options: Choosing identities in America. Berkeley: University of California Press.
Willis, R. (1986). Wage determinants: A survey and reinterpretation of human capital earnings functions. In O. Ashenfelter and R. Layard (Ed.), Handbook of labor economics (pp. 525–603). Amsterdam: North-Holland.
APPENDIX TABLE A7-1 Average Years of Schooling, by Gender, Detailed Ethnicity, and Nativity
APPENDIX TABLE A7-2 English Proficiency, by Gender, Detailed Ethnicity, and Nativity
|
Ethnicity |
Men, by Nativity |
Women, by Nativity |
||||
|
All |
Foreign-Born |
U.S.-Born |
All |
Foreign-Born |
U.S.-Born |
|
|
Whites |
||||||
|
Percent who speak English |
||||||
|
Only |
|
|
96.9 |
|
|
96.8 |
|
Very well |
|
|
2.5 |
|
|
2.6 |
|
Well |
|
|
0.4 |
|
|
0.3 |
|
Not well |
|
|
0.2 |
|
|
0.3 |
|
Not at all |
|
|
0.007 |
|
|
0.008 |
|
Blacks |
||||||
|
Percent who speak English |
||||||
|
Only |
|
|
96.6 |
|
|
97.2 |
|
Very well |
|
|
2.5 |
|
|
2.0 |
|
Well |
|
|
0.5 |
|
|
0.4 |
|
Not well |
|
|
0.4 |
|
|
0.3 |
|
Not at all |
|
|
0.008 |
|
|
0.008 |
|
All Hispanics |
||||||
|
Percent who speak English |
||||||
|
Only |
17.4 |
5.9 |
38.6 |
18.1 |
6.2 |
37.1 |
|
Very well |
34.4 |
26.3 |
49.2 |
36.1 |
26.3 |
51.7 |
|
Well |
19.9 |
25.8 |
9.2 |
16.3 |
21.0 |
8.6 |
|
Not well |
19.2 |
28.2 |
2.5 |
17.7 |
27.4 |
2.2 |
|
Not at all |
9.1 |
13.9 |
0.4 |
11.8 |
18.9 |
0.4 |
|
Mexicans |
||||||
|
Percent who speak English |
||||||
|
Only |
17.3 |
5.5 |
37.5 |
19.1 |
6.4 |
36.4 |
|
Very well |
31.2 |
20.5 |
49.5 |
33.2 |
19.7 |
51.4 |
|
Well |
19.6 |
25.4 |
9.8 |
14.6 |
18.5 |
9.4 |
|
Not well |
21.0 |
31.7 |
2.7 |
18.5 |
30.4 |
2.4 |
|
Not at all |
10.9 |
17.0 |
0.5 |
14.5 |
24.9 |
0.5 |
|
Puerto Ricans |
||||||
|
Percent who speak English |
||||||
|
Only |
20.3 |
9.1 |
32.9 |
16.1 |
6.7 |
26.7 |
|
Very well |
52.3 |
49.0 |
56.0 |
55.0 |
47.9 |
63.0 |
|
Well |
17.0 |
24.4 |
8.7 |
16.5 |
23.5 |
8.5 |
|
Not well |
8.3 |
13.7 |
2.2 |
9.4 |
16.3 |
1.7 |
|
Not at all |
2.1 |
3.8 |
0.1 |
3.1 |
5.6 |
0.1 |
|
Cubans |
||||||
|
Percent who speak English |
||||||
|
Only |
12.2 |
6.4 |
33.3 |
11.6 |
5.6 |
32.5 |
|
Very well |
45.2 |
41.2 |
59.7 |
48.6 |
44.6 |
62.6 |
|
Well |
16.1 |
19.1 |
5.3 |
14.2 |
17.3 |
3.4 |
|
Not well |
16.8 |
21.0 |
1.4 |
14.7 |
18.5 |
1.3 |
|
Not at all |
9.6 |
12.2 |
0.3 |
10.9 |
14.0 |
0.1 |
|
Ethnicity |
Men, by Nativity |
Women, by Nativity |
||||
|
All |
Foreign-Born |
U.S.-Born |
All |
Foreign-Born |
U.S.-Born |
|
|
Dominicans |
||||||
|
Percent who speak English |
||||||
|
Only |
6.7 |
5.6 |
17.7 |
6.2 |
5.5 |
13.5 |
|
Very well |
29.1 |
25.5 |
67.8 |
26.7 |
22.5 |
74.6 |
|
Well |
25.8 |
27.2 |
11.0 |
21.6 |
22.7 |
9.0 |
|
Not well |
26.6 |
28.8 |
2.7 |
29.0 |
31.3 |
2.4 |
|
Not at all |
11.8 |
12.8 |
0.9 |
16.5 |
18.0 |
0.5 |
|
Salvadorans/Guatemalans |
||||||
|
Percent who speak English |
||||||
|
Only |
4.7 |
4.1 |
26.7 |
5.8 |
5.0 |
27.7 |
|
Very well |
24.1 |
23.2 |
55.2 |
21.7 |
20.5 |
58.5 |
|
Well |
28.8 |
29.3 |
11.6 |
24.7 |
25.2 |
8.7 |
|
Not well |
30.2 |
30.9 |
5.5 |
31.5 |
32.4 |
3.3 |
|
Not at all |
12.2 |
12.5 |
1.0 |
16.4 |
16.9 |
1.8 |
|
Other Central Americans |
||||||
|
Percent who speak English |
||||||
|
Only |
9.8 |
6.5 |
44.1 |
9.7 |
6.6 |
45.1 |
|
Very well |
34.6 |
33.6 |
45.7 |
35.1 |
34.2 |
45.7 |
|
Well |
23.3 |
24.7 |
8.2 |
22.4 |
23.8 |
6.5 |
|
Not well |
21.9 |
23.9 |
1.1 |
21.2 |
22.8 |
2.1 |
|
Not at all |
10.4 |
11.3 |
0.9 |
11.6 |
12.6 |
0.7 |
|
Colombians |
||||||
|
Percent who speak English |
||||||
|
Only |
7.3 |
4.9 |
30.0 |
6.3 |
4.5 |
27.1 |
|
Very well |
36.4 |
34.0 |
57.7 |
31.6 |
28.9 |
63.8 |
|
Well |
28.6 |
30.8 |
8.6 |
26.5 |
28.2 |
5.3 |
|
Not well |
20.8 |
22.8 |
2.7 |
24.8 |
26.6 |
3.1 |
|
Not at all |
6.8 |
7.5 |
1.0 |
10.9 |
11.7 |
0.6 |
|
Peruvians/Ecuadorans |
||||||
|
Percent who speak English |
||||||
|
Only |
6.4 |
4.7 |
28.1 |
6.9 |
5.0 |
28.7 |
|
Very well |
34.9 |
32.8 |
62.5 |
34.4 |
31.8 |
64.5 |
|
Well |
29.1 |
30.9 |
6.2 |
25.7 |
27.5 |
5.6 |
|
Not well |
23.4 |
25.0 |
2.5 |
24.3 |
26.3 |
1.0 |
|
Not at all |
6.1 |
6.6 |
0.7 |
8.7 |
9.4 |
0.2 |
|
Other South Americans |
||||||
|
Percent who speak English |
||||||
|
Only |
10.8 |
7.7 |
37.2 |
9.4 |
6.2 |
36.4 |
|
Very well |
48.2 |
47.3 |
55.8 |
46.4 |
45.1 |
57.6 |
|
Well |
25.7 |
28.0 |
5.9 |
25.7 |
28.3 |
4.8 |
|
Not well |
12.1 |
13.5 |
0.9 |
14.2 |
15.8 |
1.2 |
|
Not at all |
3.2 |
3.5 |
0.2 |
4.2 |
4.7 |
0 |
APPENDIX TABLE A7-3 Annual Employment Rates, by Gender, Detailed Ethnicity, and Nativity
APPENDIX TABLE A7-4 Employment Differentials, by Gender, Detailed Ethnicity, and Nativity
|
Ethnicity/Nativity |
Employment Differentials, Relative to U.S.-Born Whites |
|||||
|
Men |
Women |
|||||
|
(1) |
(2) |
(3) |
(1) |
(2) |
(3) |
|
|
U.S.-born blacks |
−.147 |
−.125 |
−.125 |
−.023 |
−.001 |
−.002 |
|
|
(.001) |
(.001) |
(.001) |
(.001) |
(.001) |
(.001) |
|
All Hispanics: |
||||||
|
All |
−.058 |
.003 |
−.003 |
−.134 |
−.046 |
−.005 |
|
|
(.001) |
(.001) |
(.001) |
(.001) |
(.001) |
(.002) |
|
Foreign-born |
−.051 |
.031 |
.040 |
−.191 |
−.076 |
−.021 |
|
|
(.001) |
(.001) |
(.002) |
(.002) |
(.002) |
(.002) |
|
U.S.-born |
−.071 |
−.043 |
−.036 |
−.040 |
−.002 |
.006 |
|
|
(.001) |
(.001) |
(.002) |
(.002) |
(.002) |
(.002) |
|
Mexicans: |
||||||
|
All |
−.051 |
.027 |
.025 |
−.160 |
−.049 |
−.002 |
|
|
(.001) |
(.001) |
(.002) |
(.002) |
(.002) |
(.002) |
|
Foreign-born |
–.045 |
.062 |
.078 |
–.248 |
–.094 |
–.028 |
|
|
(.001) |
(.002) |
(.002) |
(.002) |
(.002) |
(.003) |
|
U.S.-born |
–.061 |
–.026 |
–.019 |
–.041 |
.005 |
.014 |
|
|
(.002) |
(.002) |
(.002) |
(.002) |
(.002) |
(.003) |
|
Puerto Ricans: |
||||||
|
All |
–.119 |
–.082 |
–.079 |
–.127 |
–.075 |
–.050 |
|
|
(.003) |
(.003) |
(.003) |
(.004) |
(.003) |
(.004) |
|
Foreign-born |
–.146 |
–.095 |
–.084 |
–.188 |
–.122 |
–.088 |
|
|
(.004) |
(.004) |
(.004) |
(.005) |
(.005) |
(.005) |
|
U.S.-born |
−.088 |
−.062 |
−.055 |
−.059 |
−.025 |
−.016 |
|
|
(.004) |
(.004) |
(.004) |
(.005) |
(.005) |
(.005) |
|
Cubans: |
||||||
|
All |
−.038 |
.022 |
−.021 |
−.051 |
–.031 |
.011 |
|
|
(.004) |
(.004) |
(.004) |
(.006) |
(.006) |
(.006) |
|
Foreign-born |
–.039 |
–.016 |
–.001 |
–.069 |
–.040 |
.006 |
|
|
(.005) |
(.005) |
(.005) |
(.007) |
(.006) |
(.007) |
|
U.S.-born |
–.036 |
–.036 |
–.028 |
.006 |
–.005 |
.003 |
|
|
(.009) |
(.009) |
(.009) |
(.012) |
(.012) |
(.012) |
|
Dominicans: |
||||||
|
All |
–.096 |
–.041 |
–.044 |
–.135 |
−.050 |
.014 |
|
|
(.005) |
(.005) |
(.005) |
(.006) |
(.006) |
(.006) |
|
Foreign-born |
−.095 |
−.034 |
−.020 |
−.145 |
−.057 |
.004 |
|
|
(.005) |
(.005) |
(.005) |
(.006) |
(.006) |
(.006) |
|
U.S.-born |
−.104 |
−.080 |
−.071 |
−.025 |
−.003 |
.009 |
|
|
(.017) |
(.016) |
(.016) |
(.021) |
(.021) |
(.021) |
|
Ethnicity/Nativity |
Employment Differentials, Relative to U.S.-Born Whites |
|||||
|
Men |
Women |
|||||
|
(1) |
(2) |
(3) |
(1) |
(2) |
(3) |
|
|
Salvadorians/Guatemalans: |
||||||
|
All |
−.030 |
.064 |
.059 |
−.128 |
.018 |
.083 |
|
|
(.003) |
(.003) |
(.004) |
(.005) |
(.005) |
(.005) |
|
Foreign-born |
−.028 |
.071 |
.085 |
−.133 |
.013 |
.073 |
|
|
(.003) |
(.003) |
(.004) |
(.005) |
(.005) |
(.005) |
|
U.S.-born |
−.071 |
−.037 |
−.029 |
−.044 |
.001 |
.013 |
|
|
(.021) |
(.020) |
(.020) |
(.027) |
(.026) |
(.026) |
|
Other Central Americans: |
||||||
|
All |
−.035 |
.014 |
.012 |
−.087 |
−.021 |
.030 |
|
|
(.005) |
(.005) |
(.005) |
(.006) |
(.006) |
(.006) |
|
Foreign-born |
−.033 |
.023 |
.036 |
−.096 |
−.027 |
.021 |
|
|
(.005) |
(.005) |
(.005) |
(.006) |
(.006) |
(.007) |
|
U.S.-born |
−.051 |
−.043 |
−.037 |
.014 |
.018 |
.028 |
|
|
(.017) |
(.017) |
(.017) |
(.022) |
(.021) |
(.021) |
|
Colombians: |
||||||
|
All |
−.041 |
−.024 |
−.027 |
−.096 |
−.063 |
−.005 |
|
|
(.006) |
(.006) |
(.006) |
(.007) |
(.007) |
(.007) |
|
Foreign-born |
−.039 |
−.019 |
−.006 |
−.105 |
−.069 |
−.016 |
|
|
(.006) |
(.006) |
(.006) |
(.007) |
(.007) |
(.007) |
|
U.S.-born |
−.057 |
−.058 |
−.050 |
.002 |
−.005 |
.006 |
|
|
(.018) |
(.018) |
(.018) |
(.025) |
(.024) |
(.024) |
|
Peruvians/Ecuadorans: |
||||||
|
All |
−.013 |
.013 |
.010 |
−.080 |
−.040 |
.012 |
|
|
(.005) |
(.005) |
(.005) |
(.007) |
(.007) |
(.007) |
|
Foreign-born |
−.015 |
.016 |
.028 |
−.089 |
−.047 |
.003 |
|
|
(.005) |
(.005) |
(.005) |
(.007) |
(.007) |
(.007) |
|
U.S.-born |
.006 |
.005 |
.014 |
.019 |
.014 |
.023 |
|
|
(.019) |
(.019) |
(.019) |
(.025) |
(.024) |
(.024) |
|
Other South Americans: |
||||||
|
All |
−.014 |
−.014 |
−.015 |
−.092 |
−.089 |
−.050 |
|
|
(.006) |
(.006) |
(.006) |
(.008) |
(.008) |
(.008) |
|
Foreign-born |
−.014 |
−.012 |
−.001 |
−.109 |
−.102 |
−.065 |
|
|
(.007) |
(.007) |
(.007) |
(.009) |
(.009) |
(.009) |
|
U.S.-born |
−.016 |
−.028 |
−.021 |
.039 |
.016 |
.025 |
|
|
(.020) |
(.019) |
(.019) |
(.026) |
(.025) |
(.025) |
|
Other Hispanics: |
||||||
|
All |
−.094 |
−.065 |
−.063 |
−.062 |
−.021 |
−.011 |
|
|
(.003) |
(.003) |
(.003) |
(.004) |
(.004) |
(.004) |
|
Foreign-born |
−.009 |
.000 |
.009 |
−.089 |
−.071 |
−.046 |
|
|
(.011) |
(.011) |
(.011) |
(.014) |
(.014) |
(.014) |
|
U.S.-born |
−.103 |
−.072 |
−.067 |
−.056 |
−.015 |
−.009 |
|
|
(.004) |
(.003) |
(.004) |
(.005) |
(.005) |
(.005) |
APPENDIX TABLE A7-5 Self-Employment Rates, by Gender, Detailed Ethnicity, and Nativity
APPENDIX TABLE A7-6 Self-Employment Differentials, by Gender, Detailed Ethnicity, and Nativity
|
Ethnicity/Nativity |
Self-Employment Differentials, Relative to U.S.-Born Whites |
|||||
|
Men |
Women |
|||||
|
(1) |
(2) |
(3) |
(1) |
(2) |
(3) |
|
|
U.S.-born blacks |
−.075 |
−.074 |
−.074 |
−.042 |
−.042 |
−.042 |
|
|
(.001) |
(.001) |
(.001) |
(.001) |
(.001) |
(.001) |
|
All Hispanics: |
||||||
|
All |
−.052 |
−.048 |
−.061 |
−.020 |
−.020 |
−.029 |
|
|
(.001) |
(.001) |
(.002) |
(.001) |
(.001) |
(.002) |
|
Foreign-born |
−.050 |
−.044 |
−.055 |
−.006 |
−.006 |
−.014 |
|
|
(.002) |
(.002) |
(.002) |
(.001) |
(.002) |
(.002) |
|
U.S.-born |
−.056 |
−.054 |
−.066 |
−.036 |
−.036 |
−.039 |
|
|
(.002) |
(.002) |
(.002) |
(.002) |
(.002) |
(.002) |
|
Mexicans: |
||||||
|
All |
−.059 |
−.055 |
−.066 |
−.029 |
−.029 |
−.037 |
|
|
(.002) |
(.002) |
(.002) |
(.002) |
(.002) |
(.002) |
|
Foreign-born |
−.057 |
−.051 |
−.060 |
−.015 |
−.015 |
−.024 |
|
|
(.002) |
(.002) |
(.003) |
(.002) |
(.002) |
(.003) |
|
U.S.-born |
−.061 |
−.060 |
−.071 |
−.041 |
−.041 |
−.044 |
|
|
(.002) |
(.002) |
(.003) |
(.002) |
(.002) |
(.002) |
|
Puerto Ricans: |
||||||
|
All |
−.073 |
−.072 |
−.087 |
−.033 |
−.033 |
−.039 |
|
|
(.004) |
(.004) |
(.004) |
(.003) |
(.003) |
(.003) |
|
Foreign-born |
−.082 |
−.080 |
−.097 |
−.034 |
−.034 |
−.041 |
|
|
(.005) |
(.005) |
(.006) |
(.005) |
(.005) |
(.005) |
|
U.S.-born |
−.065 |
−.063 |
−.076 |
−.031 |
−.031 |
−.034 |
|
|
(.005) |
(.005) |
(.006) |
(.004) |
(.004) |
(.004) |
|
Cubans: |
||||||
|
All. |
010 |
.011 |
−.003 |
−.011 |
−.011 |
−.018 |
|
|
(.006) |
(.006) |
(.006) |
(.005) |
(.005) |
(.005) |
|
Foreign-born |
.012 |
.013 |
.000 |
−.013 |
−.013 |
−.020 |
|
|
(.006) |
(.006) |
(.007) |
(.006) |
(.006) |
(.006) |
|
U.S.-born |
.005 |
.004 |
−.008 |
−.003 |
−.003 |
−.006 |
|
|
(.011) |
(.011) |
(.011) |
(.009) |
(.009) |
(.009) |
|
Dominicans: |
||||||
|
All |
−.029 |
−.026 |
−.039 |
−.009 |
−.010 |
−.022 |
|
|
(.007) |
(.007) |
(.007) |
(.006) |
(.006) |
(.006) |
|
Foreign-born |
−.028 |
−.025 |
−.036 |
−.006 |
−.006 |
−.016 |
|
|
(.008) |
(.008) |
(.008) |
(.006) |
(.006) |
(.006) |
|
U.S.-born |
−.029 |
−.028 |
−.044 |
−.036 |
−.036 |
−.039 |
|
|
(.024) |
(.024) |
(.024) |
(.017) |
(.017) |
(.017) |
|
Ethnicity/Nativity |
Self-Employment Differentials, Relative to U.S.-Born Whites |
|||||
|
Men |
Women |
|||||
|
(1) |
(2) |
(3) |
(1) |
(2) |
(3) |
|
|
Salvadorians/Guatemalans: |
||||||
|
All |
−.054 |
−.049 |
−.062 |
.018 |
.017 |
.003 |
|
|
(.005) |
(.005) |
(.005) |
(.004) |
(.005) |
(.005) |
|
Foreign-born |
−.054 |
−.049 |
−.060 |
.021 |
.021 |
.011 |
|
|
(.005) |
(.005) |
(.005) |
(.005) |
(.005) |
(.005) |
|
U.S.-born |
−.050 |
−.049 |
−.062 |
−.049 |
−.049 |
−.052 |
|
|
(.028) |
(.028) |
(.028) |
(.022) |
(.022) |
(.022) |
|
Other Central Americans: |
||||||
|
All |
−.056 |
−.054 |
−.067 |
−.006 |
−.006 |
−.016 |
|
|
(.007) |
(.007) |
(.007) |
(.006) |
(.006) |
(.006) |
|
Foreign-born |
−.058 |
−.055 |
−.067 |
−.005 |
−.005 |
−.013 |
|
|
(.007) |
(.007) |
(.007) |
(.006) |
(.006) |
(.006) |
|
U.S.-born |
−.035 |
−.035 |
−.046 |
−.009 |
−.009 |
−.011 |
|
|
(.022) |
(.022) |
(.022) |
(.017) |
(.017) |
(.017) |
|
Colombians: |
||||||
|
All |
−.029 |
−.028 |
−.043 |
.037 |
.037 |
.025 |
|
|
(.008) |
(.008) |
(.008) |
(.006) |
(.006) |
(.006) |
|
Foreign-born |
−.028 |
−.027 |
−.041 |
.043 |
.043 |
.033 |
|
|
(.008) |
(.008) |
(.008) |
(.006) |
(.006) |
(.007) |
|
U.S.-born |
−.035 |
−.036 |
−.049 |
−.011 |
−.011 |
−.014 |
|
|
(.024) |
(.024) |
(.024) |
(.019) |
(.019) |
(.019) |
|
Peruvians/Ecuadorans: |
||||||
|
All |
−.031 |
−.030 |
−.045 |
.008 |
.008 |
–.004 |
|
|
(.007) |
(.007) |
(.007) |
(.006) |
(.006) |
(.006) |
|
Foreign-born |
−.030 |
−.029 |
−.042 |
.013 |
.013 |
.004 |
|
|
(.007) |
(.007) |
(.007) |
(.006) |
(.006) |
(.007) |
|
U.S.-born |
−.044 |
−.044 |
−.057 |
−.033 |
−.033 |
−.035 |
|
|
(.024) |
(.024) |
(.024) |
(.019) |
(.019) |
(.019) |
|
Other South Americans: |
||||||
|
All. |
006 |
.006 |
−.011 |
.032 |
.032 |
.023 |
|
|
(.008) |
(.008) |
(.008) |
(.007) |
(.007) |
(.007) |
|
Foreign-born |
.008 |
.008 |
−.008 |
.037 |
.037 |
.030 |
|
|
(.009) |
(.009) |
(.009) |
(.008) |
(.008) |
(.008) |
|
U.S.-born |
−.010 |
−.011 |
−.023 |
−.002 |
−.002 |
−.004 |
|
|
(.025) |
(.025) |
(.025) |
(.020) |
(.020) |
(.020) |
|
Other Hispanics: |
||||||
|
All |
−.038 |
−.037 |
−.046 |
−.027 |
−.027 |
−.030 |
|
|
(.005) |
(.005) |
(.005) |
(.004) |
(.004) |
(.004) |
|
Foreign-born |
.000 |
.000 |
−.014 |
.022 |
.022 |
.016 |
|
|
(.014) |
(.014) |
(.015) |
(.012) |
(.012) |
(.012) |
|
U.S.-born |
−.043 |
−.041 |
−.050 |
−.032 |
−.032 |
−.034 |
|
|
(.005) |
(.005) |
(.005) |
(.004) |
(.004) |
(.004) |
APPENDIX TABLE A7-7 Annual Earnings Differentials, by Gender, Detailed Ethnicity, and Nativity
|
Ethnicity/Nativity |
Log Earnings Differentials, Relative to U.S.-Born Whites |
|||||
|
Men |
Women |
|||||
|
(1) |
(2) |
(3) |
(1) |
(2) |
(3) |
|
|
U.S.-born blacks |
−.440 |
−.347 |
−.348 |
−.050 |
.026 |
.026 |
|
|
(.004) |
(.004) |
(.004) |
(.004) |
(.004) |
(.004) |
|
All Hispanics: |
||||||
|
All |
−.492 |
−.171 |
−.094 |
−.333 |
−.043 |
.016 |
|
|
(.004) |
(.004) |
(.005) |
(.005) |
(.005) |
(.006) |
|
Foreign-born |
−.588 |
−.169 |
−.045 |
−.492 |
−.083 |
.002 |
|
|
(.004) |
(.004) |
(.007) |
(.006) |
(.006) |
(.008) |
|
U.S.-born |
−.307 |
−.175 |
−.133 |
−.124 |
.004 |
.025 |
|
|
(.006) |
(.005) |
(.006) |
(.007) |
(.006) |
(.007) |
|
Mexicans: |
||||||
|
All |
−.542 |
−.141 |
−.057 |
−.397 |
−.027 |
.032 |
|
|
(.004) |
(.005) |
(.006) |
(.006) |
(.006) |
(.007) |
|
Foreign-born |
−.658 |
−.119 |
.024 |
−.633 |
−.053 |
.044 |
|
|
(.005) |
(.006) |
(.008) |
(.008) |
(.008) |
(.011) |
|
U.S.-born |
−.334 |
−.174 |
−.129 |
−.162 |
−.004 |
.019 |
|
|
(.007) |
(.007) |
(.007) |
(.008) |
(.008) |
(.009) |
|
Puerto Ricans: |
||||||
|
All |
−.380 |
−.218 |
−.162 |
−.172 |
−.028 |
.014 |
|
|
(.011) |
(.010) |
(.011) |
(.012) |
(.012) |
(.013) |
|
Foreign-born |
−.463 |
−.251 |
−.162 |
−.279 |
−.101 |
−.037 |
|
|
(.015) |
(.014) |
(.015) |
(.018) |
(.017) |
(.018) |
|
U.S.-born |
−.297 |
−.183 |
−.138 |
−.076 |
.036 |
.060 |
|
|
(.015) |
(.015) |
(.015) |
(.017) |
(.017) |
(.017) |
|
Cubans: |
||||||
|
All |
−.242 |
−.169 |
−.087 |
−.021 |
.025 |
.083 |
|
|
(.016) |
(.015) |
(.016) |
(.020) |
(.019) |
(.020) |
|
Foreign-born |
−.315 |
−.215 |
−.097 |
−.097 |
−.018 |
.053 |
|
|
(.018) |
(.017) |
(.018) |
(.022) |
(.022) |
(.022) |
|
U.S.-born |
.007 |
−.008 |
.036 |
.200 |
.150 |
.168 |
|
|
(.033) |
(.032) |
(.032) |
(.039) |
(.038) |
(.038) |
|
Dominicans: |
||||||
|
All |
−.637 |
−.363 |
−.263 |
−.475 |
−.178 |
−.085 |
|
|
(.019) |
(.019) |
(.019) |
(.022) |
(.021) |
(.022) |
|
Foreign-born |
−.672 |
−.379 |
−.246 |
−.532 |
−.212 |
−.112 |
|
|
(.020) |
(.020) |
(.020) |
(.023) |
(.022) |
(.023) |
|
U.S.-born |
−.267 |
−.175 |
−.115 |
.047 |
.122 |
.152 |
|
|
(.065) |
(.063) |
(.063) |
(.070) |
(.068) |
(.068) |
|
Ethnicity/Nativity |
Log Earnings Differentials, Relative to U.S.-Born Whites |
|||||
|
Men |
Women |
|||||
|
(1) |
(2) |
(3) |
(1) |
(2) |
(3) |
|
|
Salvadorians/Guatemalans: |
||||||
|
All |
−.599 |
−.112 |
−.008 |
−.500 |
.055 |
.153 |
|
|
(.013) |
(.012) |
(.013) |
(.017) |
(.017) |
(.018) |
|
Foreign-born |
−.610 |
−.111 |
.026 |
−.520 |
.051 |
.154 |
|
|
(.013) |
(.013) |
(.014) |
(.018) |
(.017) |
(.018) |
|
U.S.-born |
−.205 |
−.056 |
.001 |
−.048 |
.090 |
.119 |
|
|
(.078) |
(.076) |
(.076) |
(.089) |
(.086) |
(.086) |
|
Other Central Americans: |
||||||
|
All |
−.470 |
−.216 |
−.124 |
−.357 |
−.123 |
−.045 |
|
|
(.019) |
(.018) |
(.019) |
(.022) |
(.021) |
(.022) |
|
Foreign-Born |
−.502 |
−.224 |
−.100 |
−.405 |
−.148 |
−.064 |
|
|
(.020) |
(.019) |
(.019) |
(.023) |
(.022) |
(.023) |
|
U.S.-born |
−.143 |
−.121 |
−.080 |
.092 |
.101 |
.122 |
|
|
(.063) |
(.061) |
(.061) |
(.070) |
(.068) |
(.068) |
|
Colombians: |
||||||
|
All |
−.403 |
−.311 |
−.221 |
−.341 |
−.211 |
−.122 |
|
|
(.021) |
(.021) |
(.021) |
(.024) |
(.024) |
(.024) |
|
Foreign-born |
−.432 |
−.325 |
−.205 |
−.395 |
−.248 |
−.153 |
|
|
(.022) |
(.022) |
(.022) |
(.025) |
(.025) |
(.025) |
|
U.S.-born |
−.150 |
−.178 |
−.129 |
.176 |
.143 |
.167 |
|
|
(.068) |
(.066) |
(.066) |
(.080) |
(.078) |
(.078) |
|
Peruvians/Ecuadorans: |
||||||
|
All |
−.458 |
−.318 |
−.226 |
−.307 |
−.163 |
−.078 |
|
|
(.019) |
(.019) |
(.019) |
(.024) |
(.024) |
(.024) |
|
Foreign-born |
−.493 |
−.339 |
−.218 |
−.357 |
−.196 |
−.105 |
|
|
(.020) |
(.019) |
(.020) |
(.025) |
(.025) |
(.025) |
|
U.S.-born |
−.040 |
−.044 |
.006 |
.155 |
.142 |
.165 |
|
|
(.070) |
(.068) |
(.068) |
(.079) |
(.077) |
(.077) |
|
Other South Americans: |
||||||
|
All |
−.194 |
−.189 |
−.113 |
−.155 |
−.152 |
−.085 |
|
|
(.024) |
(.023) |
(.023) |
(.029) |
(.028) |
(.029) |
|
Foreign-born |
−.227 |
−.213 |
−.115 |
−.205 |
−.185 |
−.114 |
|
|
(.025) |
(.024) |
(.024) |
(.031) |
(.030) |
(.031) |
|
U.S.-born. |
069 |
.012 |
.055 |
.163 |
.075 |
.095 |
|
|
(.072) |
(.070) |
(.070) |
(.081) |
(.079) |
(.079) |
|
Other Hispanics: |
||||||
|
All |
−.319 |
−.184 |
−.152 |
−.168 |
−.033 |
−.013 |
|
|
(.013) |
(.013) |
(.013) |
(.015) |
(.015) |
(.015) |
|
Foreign-born |
−.165 |
−.116 |
−.035 |
−.114 |
−.085 |
−.033 |
|
|
(.041) |
(.039) |
(.039) |
(.048) |
(.047) |
(.047) |
|
U.S.-born |
−.331 |
−.192 |
−.160 |
−.168 |
−.027 |
−.011 |
|
|
(.014) |
(.013) |
(.014) |
(.016) |
(.015) |
(.016) |
APPENDIX TABLE A7-8 Average Years of Schooling, by Gender, Ethnicity, and Generation
APPENDIX TABLE A7-9 Annual Earnings Differentials, by Gender, Ethnicity, and Generation
|
Ethnicity/Generation |
Log Earnings Differentials, Relative to 3rd+ Generation Whites |
||||||
|
Men |
Women |
||||||
|
(1) |
(2) |
(3) |
(1) |
(2) |
(3) |
||
|
3rd+ generation blacks |
−.424 |
−.409 |
−.309 |
−.072 |
−.064 |
.027 |
|
|
|
(.012) |
(.012) |
(.011) |
(.012) |
(.012) |
(.011) |
|
|
All Hispanics: |
|||||||
|
All generations |
−.539 |
−.499 |
−.138 |
−.356 |
−.340 |
−.016 |
|
|
|
(.011) |
(.011) |
(.011) |
(.013) |
(.013) |
(.013) |
|
|
1st generation |
−.644 |
−.606 |
−.133 |
−.521 |
−.509 |
−.052 |
|
|
|
(.013) |
(.013) |
(.014) |
(.017) |
(.017) |
(.017) |
|
|
2nd generation |
−.382 |
−.314 |
−.177 |
−.120 |
−.085 |
.053 |
|
|
|
(.026) |
(.026) |
(.025) |
(.029) |
(.029) |
(.028) |
|
|
3rd+ generation |
−.300 |
−.271 |
−.124 |
−.160 |
−.147 |
.008 |
|
|
|
(.022) |
(.022) |
(.021) |
(.024) |
(.024) |
(.023) |
|
|
Mexicans: |
|||||||
|
All generations |
−.592 |
−.544 |
−.103 |
−.424 |
−.405 |
.003 |
|
|
|
(.013) |
(.013) |
(.014) |
(.017) |
(.017) |
(.017) |
|
|
1st generation |
−.719 |
−.668 |
−.070 |
−.668 |
−.650 |
−.007 |
|
|
|
(.016) |
(.016) |
(.017) |
(.023) |
(.023) |
(.024) |
|
|
2nd generation |
−.444 |
−.381 |
−.190 |
−.174 |
−.142 |
.048 |
|
|
|
(.033) |
(.033) |
(.032) |
(.037) |
(.037) |
(.036) |
|
|
3rd+ generation |
−.337 |
−.307 |
−.131 |
−.210 |
−.197 |
−.007 |
|
|
|
(.024) |
(.024) |
(.024) |
(.027) |
(.027) |
(.026) |
|
|
Puerto Ricans: |
|||||||
|
All generations |
−.402 |
−.376 |
−.189 |
−.192 |
−.175 |
−.023 |
|
|
|
(.035) |
(.035) |
(.034) |
(.037) |
(.037) |
(.036) |
|
|
1st generation |
−.478 |
−.481 |
−.225 |
−.279 |
−.278 |
−.093 |
|
|
|
(.048) |
(.047) |
(.046) |
(.054) |
(.054) |
(.052) |
|
|
2nd generation |
−.357 |
−.306 |
−.182 |
−.135 |
−.102 |
.030 |
|
|
|
(.059) |
(.058) |
(.057) |
(.059) |
(.059) |
(.058) |
|
|
3rd+ generation |
−.236 |
−.162 |
−.054 |
−.081 |
−.051 |
.051 |
|
|
|
(.095) |
(.095) |
(.092) |
(.097) |
(.097) |
(.095) |
|
|
Cubans: |
|||||||
|
All generations |
−.312 |
−.304 |
−.211 |
−.124 |
−.116 |
−.060 |
|
|
|
(.046) |
(.046) |
(.045) |
(.056) |
(.056) |
(.055) |
|
|
1st generation |
−.379 |
−.391 |
−.263 |
−.210 |
−.215 |
−.112 |
|
|
|
(.053) |
(.052) |
(.051) |
(.064) |
(.064) |
(.063) |
|
|
2nd generation |
−.061 |
.021 |
−.012 |
.073 |
.125 |
.041 |
|
|
|
(.102) |
(.102) |
(.099) |
(.122) |
(.122) |
(.119) |
|
|
3rd+ generation |
−.366 |
−.320 |
−.172 |
.365 |
.390 |
.355 |
|
|
|
(.266) |
(.264) |
(.257) |
(.271) |
(.271) |
(.264) |
|


