
5
National Consumer Savings and Costs
Congress asked that this study “address the cost to the consumer, including the additional cost of replacement tires and any potential fuel savings” associated with low-rolling-resistance tires. Congress did not define “low” rolling resistance, and the data examined show a wide range of rolling resistance values among passenger tires currently being sold in the replacement market. These measured rolling resistance values pertain to new tires. The actual rolling resistance of passenger tires averaged over a lifetime of use would be more relevant. The approach taken in this chapter, therefore, is to approximate the savings and costs to consumers if the average rolling resistance of replacement tires used on passenger vehicles were to decline by a given amount. In particular, consideration is given to what would happen to consumer expenditures on motor fuel and tires if the average rolling resistance of replacement tires in the fleet were reduced by 10 percent.
No predictions are made about how or over what time period the assumed 10 percent reduction would take place. Such a change could occur in a number of ways and over various time frames. It could result in part from the development and production of more tires with lower rolling resistance and their gradual or rapid introduction into the replacement market. It could result from changes in the mix of existing makes, models, sizes, and types of tires purchased by motorists, since there is already much variability in rolling resistance among tires in the marketplace. If more tires with lower rolling resistance are purchased by consumers, the average rolling resistance of the replacement tire population would likely decline. The 10 percent reduction could also result, at least in part, from motorists taking better care of their tires, particularly through proper inflation. The occurrence of one or more of the above developments
leading to a 10 percent decline in average rolling resistance is a reasonable expectation.
The monetary savings and costs to consumers of such a reduction in rolling resistance can be quantified. The two consumer expenditure items of interest to Congress are motor fuel and tires. All else being equal, a reduction in rolling resistance is certain to reduce motor fuel expenditures. At issue is how large the savings would be. Chapter 3 indicates that a 10 percent reduction in rolling resistance will cause a 1 to 2 percent reduction in fuel consumption per mile driven. The effect on tire-related expenditures is more difficult to estimate without knowing the details of how the change in rolling resistance is brought about. For example, if rolling resistance is reduced because of better tire maintenance, consumers may end up spending less on tires, because properly inflated tires will have longer wear in addition to providing better fuel economy. In contrast, if the reduction is brought about by the sale of more tires that have reduced wear life, consumers may end up spending more on tires because of the need to replace them more often.
Given the many possible ways to reduce average rolling resistance, the approach taken in this chapter is to present two plausible scenarios that illustrate the potential for impacts on tire expenditures. Under the first scenario, a greater proportion of existing tires with lower rolling resistance and a smaller proportion of existing tires with higher rolling resistance are purchased in the marketplace. Under the second, many new tire designs are introduced that achieve lower rolling resistance through changes in tire materials, particularly in tread composition.
The next section reviews how a reduction in average rolling resistance can affect consumer fuel expenditures. Most of the remainder of the chapter examines the effects on tire expenditures. The chapter concludes by considering the two consumer expenditure items together.
The estimates are developed for consumers as a whole and are presented as national annualized averages. As a group, U.S. motorists make expenditures on motor fuel and replacement tires each year. Estimates are made for how average expenditures may be affected by a reduction in replacement tire rolling resistance. From the perspective of the individual consumer, outlays on fuel and tires are made over different time horizons and in different increments. For example, a tankful of fuel is
purchased about once a week and a set of tires every 3 or more years. The timing and size of these outlays are important in the calculus of individual consumers in making their own purchase decisions. Motorists will value a dollar saved or spent today more highly than one saved or spent in the future. The timing of these expenditure flows is not relevant in quantifying the effects on consumers collectively because timing differences average out. In other contexts, however, the timing of outlays is relevant, especially in considering the response of individual consumers to information on tire energy performance.
CONSUMER FUEL SAVINGS
Chapter 3 suggests that a 10 percent reduction in average rolling resistance would translate to a 1 to 2 percent reduction in passenger vehicle fuel consumption per mile. As noted in Chapter 2, passenger vehicles in the United States are driven an average of 12,000 miles per year and consume about 600 gallons of fuel in the process. A 1 to 2 percent reduction in fuel consumption would equate to fuel savings of 6 to 12 gallons per year.1 The U.S. Department of Energy, in its Annual Energy Outlook 2006, projects an average price for motor fuel of $2.02 per gallon for the next several years (EIA 2005, Table A12). On the basis of a price of $2 per gallon, the savings to motorists from using replacement tires with lower rolling resistance would be $12 to $24 per vehicle per year.
Multiplying these savings by the number of vehicles in the passenger fleet and subtracting out the share of vehicles equipped with original equipment (OE) tires results in an estimate of the collective savings to consumers.2 Tire shipment data presented in Chapter 2 indicate that about 20 percent of tires in the fleet are OE and 80 percent are replacement.3 Accordingly, in any given year, about 20 percent of the fleet, or about
|
1 |
The calculation assumes that motorists will not drive more miles in response to increased fuel economy, which will reduce the effective fuel cost of driving (see discussion of the rebound effect in Chapter 3). |
|
2 |
See Chapters 1 and 2 for fleet data, which are derived from U.S. Department of Energy and U.S. Department of Transportation statistics. |
|
3 |
As explained in Chapter 2, OE tires account for about 20 percent of tire shipments, and replacement tires account for 80 percent. Although the exact percentages of tires in the fleet that are OE and replacement are unknown, this 20:80 ratio offers a reasonable approximation. |
45 million passenger vehicles from the current fleet of 220 million,4 would be unaffected by the 10 percent reduction in the average rolling resistance of replacement tires. The remaining 175 million passenger vehicles that are affected would consume 1 billion to 2 billion fewer gallons of fuel per year (175 million vehicles × 6 gallons to 12 gallons). Users of these vehicles would therefore save $2 billion to $4 billion per year in fuel expenditures.
These estimates assume that other characteristics of the vehicle fleet, such as size, technologies, and miles of travel, do not change. Of course, the passenger vehicle fleet will become larger over time, and vehicle technologies and average miles of travel per vehicle will change. The fuel savings are estimated without an allowance (which would be speculative) for such developments and without anticipating a time frame for the reduction in rolling resistance. This straightforward approach is also used in estimating potential effects on consumer tire expenditures.5
CONSUMER TIRE EXPENDITURES
Consumer expenditures on tires are governed by (a) the frequency of their tire replacement and (b) the costs they incur during each replacement, including the tire’s purchase price and related costs such as the motorist’s time and money spent on tire installation. The first is affected by the tire’s durability characteristics, such as tread wear resistance. Accordingly, information on the effects of reducing new-tire rolling resistance on tread wear, as examined in Chapter 4, is helpful in estimating the frequency of tire replacement. The second is affected by tire production and installation costs, as well as other factors such as the value of motorists’ time. Consideration is given to these factors in the following two scenarios.
|
4 |
This estimated number of in-fleet vehicles with OE tires is consistent with the number of new passenger vehicles entering the fleet over a 3-year period, after which tires are often replaced. |
|
5 |
Brief consideration was given in Chapter 3 to a consumer response to increases in vehicle fuel economy known as the “rebound effect.” By effectively lowering the fuel cost of driving, an improvement in vehicle fuel economy may cause motorists to drive more, which would offset some of the total fuel savings that are anticipated from the fuel economy improvement. Studies of this consumer response suggest that about 10 percent of the expected fuel savings may be offset (Small and Van Dender 2005). This is an example of a second-order effect that is not factored into the estimates of fuel savings because it would not change the order of magnitude of the savings estimate. |
Scenario 1: Changes in Consumer Purchases of Tires Currently on the Market Lead to a Reduction in Average Rolling Resistance
The data analyzed in Chapter 3 indicate how rolling resistance can vary widely among tires, even among those that are comparable with respect to many other characteristics. Differentials in rolling resistance coefficients (RRCs) of 20 percent or more, for example, were found among new tires having the same size, traction characteristics, and speed ratings. One plausible explanation for this observed difference among otherwise comparable tires is that some are designed in ways that make them more energy efficient but that affect operating performance only minimally.
If the differences in rolling resistance were widely known, some consumers might purchase tires now on the market that possess lower rolling resistance, especially if they were persuaded that desired characteristics such as traction, handling, and wear life would not be sacrificed. Presumably, tire prices would also be an important factor in their purchase decisions. The relationship between rolling resistance and tire prices has not been examined up to this point in this report. Price data, however, were collected for the tires in the combined Ecos Consulting and Rubber Manufacturers Association (RMA) data sets. The effect on average tire prices of a change in the distribution of tires purchased to reduce average rolling resistance is considered below. This is followed by an examination of the effects on average wear life if consumers achieve the reduced rolling resistance by choosing tires built with thinner treads.
Price Effects
The tires in the combined Ecos Consulting and RMA data have a wide range of selling prices,6 with some lower than $50 and others exceeding $300. In Figure 5-1 tire prices are plotted against the RRCs of the tires measured when they were new. The scattered pattern suggests that prices
|
6 |
Retail prices were obtained by the committee during October 2005 through searches of popular tire mail order websites, including www.tirerack.com. Prices do not include tax, shipping, balancing, mounting, or other incidentals, such as fees for scrap tire disposal and valve stem replacement, paid by tire buyers. |
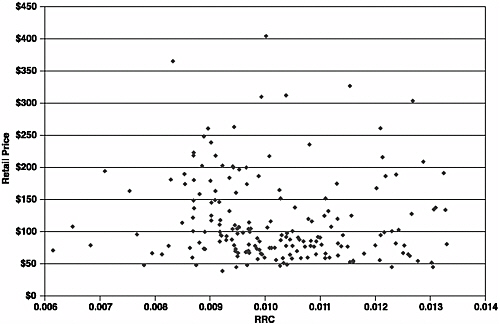
FIGURE 5-1 Retail price versus RRC for tires in combined Ecos Consulting and RMA data.
and rolling resistance are unrelated. As explained in earlier chapters, however, the many other tire characteristics and features that can influence these patterns should be taken into account. The observed scattering of prices might be expected given the wide variety of tires in the data, encompassing dozens of combinations of sizes and speed ratings. To illustrate, Figure 5-2 shows how prices vary in relation to rim diameter and speed rating.
The pattern in Figure 5-2 reveals the importance of examining price and rolling resistance relationships for tires possessing the same size and speed ratings. Table 5-1 examines average tire prices for groups of tires having the following common rim diameters and speed ratings: 14-inch S and T, 15-inch S and T, 16-inch S and T, and 16-inch H and V. Each of these four groups contains at least 15 tires. The data are disaggregated further by the RRC of each tire.
The comparisons in Table 5-1 do not show a clear pattern of tire price differentials relating to rolling resistance. Because few new tires have RRCs below 0.009, the data reveal little about price differences among
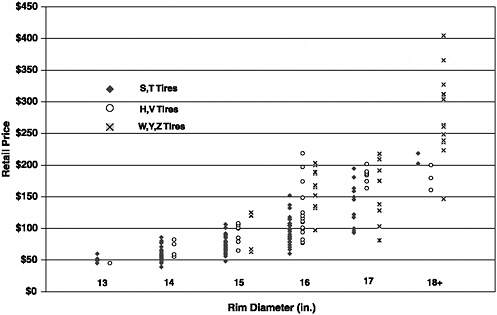
FIGURE 5-2 Retail tire prices by rim diameter and speed rating, combined Ecos Consulting and RMA data.
tires having the lowest RRCs. Most new tires have RRCs between 0.009 and 0.011. For tires with 14- and 15-inch rim diameters, there is no obvious relationship between price and RRC. Only in the case of tires having 16-inch rim diameters is there evidence that lower rolling resistance can be accompanied by higher prices. For the S and T tires in this size group, the price differential is small and seemingly negligible. The only obvious pattern emerges among the H and V tires in the group. In this case, tires with lower RRCs tend to have higher prices, but the pattern is not unequivocal.
Several multiple regressions were also performed that sought to explain tire prices as a function of various tire characteristics. The regressions were conducted separately for tires grouped by rim diameter. The results left a substantial proportion of the variation in tire prices unexplained by the tire characteristics.
In sum, the results from empirical data do not indicate that consumers will necessarily pay more for replacement tires having lower rolling resistance.
TABLE 5-1 Average Tire Prices by RRC Distribution for Groupings of Tires Having the Same Rim Size and Speed Rating, Combined Ecos Consulting and RMA Data
Tire Wear Effects
The findings in Chapter 4 suggest that new-tire rolling resistance can be reduced by a magnitude of 10 percent by reducing tread depth by about 22 percent. At the same time, the data suggest that tires with reduced tread depth exhibit shorter wear life. Indeed, lower Uniform Tire Quality Grading tread wear numerical ratings—by about 5 percent—were observed for each 1/32-inch reduction in tread depth. This is equal to about 9 percent of tread depth for the average tire. If consumers were to purchase more tires with less tread as the main way to achieve lower rolling resistance, they would likely experience shorter wear life and need to replace their tires more often.
Perhaps the simplest way to approximate the effects of shorter wear life on tire replacement expenditures is to use the figures in Chapter 2 indicating that about 200 million replacement tires are shipped in a year
for use on 175 million passenger vehicles. The ratio of vehicles to tires (175 million/200 million = 0.88) suggests that a motorist can expect to purchase a replacement tire an average of every 0.88 year, or a complete set of four tires about every 3.5 years (4 × 0.88 = 3.52).7 If reductions in rolling resistance are brought about by consumers purchasing tires with thinner tread, the frequency of tire purchases would increase by an amount commensurate with the reduction in tire wear life.
Suppose that the average tread depth of new tires purchased decreases by 22 percent. The analyses in Chapter 4 suggest that such a change would reduce new-tire RRCs by about 10 percent and projected wear life by about 10 percent. Accordingly, the number of replacement tires purchased in a year would need to increase by about 10 percent, from 200 million to about 220 million. Motorists would thus purchase a new tire on average every 0.80 year (175 million/220 million), or a complete set of four tires every 3.2 years. In terms of annual tire expenditures, the motorist would purchase an average of 1.25 tires per year (4/3.2), as opposed to the current average of 1.14 tires per year (4/3.5).
The full cost to the consumer of having to buy an average of 0.11 more tires per year will depend on tire prices and other tire transaction and installation costs. The average price of tires in the combined Ecos Consulting and RMA data is $117. The data set, however, contains a large number of high-performance tires. While tires rated for higher speed (H, V, W, Y, Z) are becoming more popular among U.S. motorists, they do not represent 40 percent of replacement tires sales, which is their percentage in the data set. RMA’s Factbook 2005 indicates that tires rated S and T accounted for 73 percent of replacement tire shipments in 2004, while performance (H, V) and high-performance (W, Y, Z) tires accounted for 22 and 4 percent, respectively (RMA 2005, 22). Weighting the price data by these reported sales percentages suggests an average tire price of $97. Hence, consumer expenditures on tires would increase from an average of $110.58 per year (1.14 × $97) to an average of $121.25 (1.25 × $97) per year, a difference of $10.67.
Other costs associated with tire replacement include the expense of installation and the inconvenience and time lost to motorists. These costs are real but difficult to quantify fully. Tire installation (e.g., balancing, mounting, and valve stem replacement) and other associated consumer expenses such as tire disposal fees can vary from $40 to more than $100 for a set of four tires, with $50 (or $12.50 per tire) being the reported average.8 Thus, including these installation costs would add about $1.38 (0.11 × $12.50) to annual tire expenditures, which would bring the total to about $12 more per year ($10.67 + $1.38).
For the 175 million passenger vehicles using replacement tires, the total tire expenditure increase under this scenario would be $2.1 billion per year. In reality, the scenario’s assumption that reduction in tread depth will be the exclusive means of achieving lower rolling resistance is questionable. Tire manufacturers can minimize tread volume and mass by means other than, or in addition to, reducing depth. For instance, tread width, shoulder profile, and section width can be modified to reduce rolling resistance while seeking to minimize adverse effects on wear life. U.S. motorists are known to demand long wear life when they purchase tires, as reflected by the mileage warranties advertised by tire companies. It is improbable that tire manufacturers interested in maintaining customers would sacrifice wear life to any major degree.
In any event, as pointed out earlier, achieving a lower RRC only by reducing tread thickness may not lead to significantly lower rolling resistance on the average over a tire’s lifetime. As it accumulates miles, a tire with thicker tread will soon assume wear and rolling resistance profiles similar to those of an otherwise comparable tire starting out with thinner tread. The fuel savings will occur only during the miles driven before the added tread thickness wears down, if both tires are replaced at the same level of tread wear, and will be limited accordingly. To illustrate with a simplified example, suppose that all tires wear evenly at a rate of 1/32 inch of tread per 5,000 miles and are replaced when tread depth reaches 2/32 inch. Further, suppose that RRC declines evenly by 0.005 per 1/32 inch of tread loss, that one tire starts out with a tread depth of 10/32 inch and an RRC
of 0.01, and that another starts out with a tread depth of 12/32 inch and an RRC of 0.011. The former tire’s average RRC over its 40,000-mile lifetime will be 0.00825, while the latter tire’s average RRC over its 50,000-mile lifetime will be 0.00875. In effect, after 10,000 miles of use, the latter tire will assume the same wear and rolling resistance profiles as the former. Although its RRC starts out 10 percent higher, the latter tire’s lifetime average RRC is only 6 percent higher. The thinner-tread tire will have lower average rolling resistance; however, it will also require replacement 20 percent sooner—not an attractive option from the perspective of consumer tire expenditures or controlling scrap tire populations.
These examples illustrate why reducing rolling resistance by designing tires with less tread depth would have both limited effects on fuel consumption and an undesirable response from motorists—and thus why such an approach would not likely be pursued generally. Indeed, because tire manufacturers must respond to consumer demand for wear resistance, they have sought alternative means of reducing rolling resistance with minimal loss of wear life. Some of these alternatives, including new tread materials, are discussed in the next scenario, along with approximations of their effects on consumer tire expenditures.
Scenario 2: Reducing Rolling Resistance by Changing Tread Composition
Tire manufacturers and their materials suppliers have been actively seeking optimal means of reducing rolling resistance without sacrificing wear life and other aspects of performance. Unfortunately, the study committee is not aware of the various technologies—some proprietary—that have been developed and tried.
However, the important effect on rolling resistance of the tread compound and its constituent rubbers and reinforcing fillers is well established in the literature. Rubbers typically account for between 40 and 50 percent of tread volume and weight, and fillers typically account for 30 to 40 percent (Derham et al. 1988; Bethea et al. 1994; Russell 1993; Gent 2005, 30). Oils and other additives, which are used in processing and as material extenders, account for the rest of the volume and weight.
The tread’s wear resistance, traction, and rolling resistance are determined in large part by the properties of these polymers and fillers, as well
as by their concentrations, dispersion, and adhesion characteristics (Böhm et al. 1995; Wang et al. 2002). Consequently, fillers and polymers, as well as methods for mixing and curing them in the tread compound, have been primary targets of research and development aimed at reducing rolling resistance while preserving acceptable levels of other aspects of tire performance.
As discussed earlier, the predominant filler used in the tread compound is carbon black. A great deal of research has been devoted to modifying carbon black as a means of reducing rolling resistance. Among the approaches investigated have been varying its agglomerated particle size, manipulating its surface structure, and improving its dispersion through reactive mixing and other means (Russell 1993; McNeish and Byers 1997; Wang et al. 2002; Cook 2004). Because the supply of carbon black is a highly competitive business, materials suppliers have devoted much research and development to improving and distinguishing their products with regard to the effects on rolling resistance and other properties.
Silica is the next most common reinforcing filler in the tread compound. Silica has been added to tire rubber for decades, usually in combination with carbon black, largely because it improves cutting and chipping resistance of a tire as well as traction on snow and ice (Derham et al. 1988). However, silica does not develop a natural strong bond with rubber, owing to their different polarities. Silica tends to cluster rather than disperse evenly in the tread compound. This clustering not only makes processing more difficult, it increases the tread’s hysteresis and results in poor wear. In the early 1990s, researchers found that applying organosilane coupling agents to silica during mixing resulted in more uniform filler dispersion and a consequent reduction in rolling resistance. In such applications to achieve lower rolling resistance, the silica–silane usually replaces a portion—seldom more than one-third—of the carbon black in the tread compound. Since this discovery, silica–silane systems have been promoted as a means of reducing rolling resistance without a severe penalty on traction or tread wear.
Replacing or modifying the filler is not the only means of reducing rolling resistance through changes in tread composition. Tread composition can be altered in other ways—for example, through changes in the rubbers, other tread components (e.g., oils, sulfur, zinc), and mixing
processes. Examples of such modifications include the use of functionalized polymers that foster more uniform filler dispersion. Hydrogenated and tin-modified polymers have been used to reduce the rolling resistance of tires that are in production (Bethea et al. 1994; McNeish and Byers 1997). Of course, a more comprehensive approach to reducing rolling resistance would involve not only modifications of the tread compound but also changes in tire geometry and mass, belt and subtread materials, and the design and construction of other tire components such as the sidewall and casing.
The study committee could not examine all possible means of reducing rolling resistance—even means involving only changes in tread composition. Accordingly, the following estimates focus on the added material-related costs associated with a single change in tread composition: the partial substitution of silica–silane for carbon black. This scenario— admittedly simplified—provides an order-of-magnitude estimate of the effects on tire production costs that would be passed along to consumers in the prices paid for replacement tires possessing lower rolling resistance.
Market prices for carbon black and silica vary with supply and demand factors, including energy and transportation costs (Crump 2000). The prices paid by tire manufacturers for these materials are usually negotiated with suppliers and are not publicly available. While price differences between carbon black and silica vary at any given time and among suppliers, silica prices tend to be higher than carbon black prices by about one-third. Reference prices are $45 per 100 pounds of carbon black and $60 per 100 pounds of silica. About 5 pounds of silane, which costs about $3 per pound, is used for every 100 pounds of silica. Hence, the silica–silane combination costs about $75 per 100 pounds, compared with $45 for 100 pounds of carbon black. When silica–silane is used to reinforce tread stock, it seldom replaces more than one-third of the carbon black by volume or weight.
For an average passenger tire weighing 26.6 pounds,9 the full tread band accounts for about 25 percent of the weight, or 6.7 pounds. Most of this tread weight is from the polymers as well as oils and other additives used in the tread compound. If it is assumed that reinforcing filler accounts for
35 percent of the tread’s weight, the filler’s total weight is about 2.3 pounds. If carbon black is used exclusively as the filler, its material costs will be $1.04 per tire ($0.45 per pound × 2.3 pounds). Replacing one-third (or 0.76 pound) of the 2.3 pounds of carbon black with an equal weight of silica–silane will raise the cost of filler material to about $1.26 per tire ($0.45 per pound × 1.54 pounds + $0.75 per pound × 0.76 pound), an increase in filler costs of $0.22 per tire.
Of course, estimates of raw material costs will not capture all manufacturing costs associated with substituting silica–silane for carbon black. The processing of silica–silane differs from that of carbon black. The former usually requires reactive mixing to raise the mixing temperature sufficiently to allow silica and silane to bond. The addition of silane also lengthens the curing time required for tread compounds and produces emissions of ethanol, which is a reactive compound subject to federal and state air quality controls (Joshi 2005). There are reports that silica, which is harder and contains more water than carbon black, can accelerate the wear of mixing devices from abrasion and corrosion (Borzenski 2004). While the added processing time, emissions mitigation, and equipment maintenance may not require large-scale plant investments, they will introduce additional production costs beyond the tread material expenses alone. It is reasonable to assume that these other costs would be at least as large as the silica–silane material expense, which would add another $0.22 to tire production costs and bring the total to $0.44 per tire.
The purpose of these calculations is not to develop a precise estimate of added costs but to get a sense of their scale and potential to translate into higher tire prices. Only the tire manufacturers can offer precise estimates of the effects on production costs and pricing, which are proprietary in nature and will depend in part on fluctuations in material costs and the pricing and cost allocation procedures of individual manufacturers. The estimates, though rough, suggest that the added cost of silica–silane will be less than $0.50 per tire. To be even more cautious, however, the committee assumes a resultant increase of $1 in the retail price of the tire. This added margin factors in the uncertainties noted above with regard to effects on tire manufacturing processes (e.g., emissions mitigation, equipment maintenance) as well as any cost markups that are successfully passed along to consumers. For an average tire priced at $97, a $1
price increase represents a premium of slightly more than 1 percent and would cause consumer tire expenditures to rise by an average of $1.14 per year assuming that tire wear life remains unchanged (since, on average, 1.14 replacement tires are purchased by motorists each year). For the 175 million passenger vehicles equipped with replacement tires, the total expenditure would be about $200 million per year (175 million × $1.14).
The application of silica–silane would likely be accompanied by other changes in tire materials and designs to achieve lower rolling resistance. Therefore, it is not possible to state with certainty that consumers would only pay about $1 more per tire in practice or that the tires would be comparable in all respects—including wear resistance, traction capability, and other properties—with tires having higher rolling resistance. The calculations do suggest that additional tire production costs are likely to result in a modest, rather than a dramatic, change in tire prices.
Unquestionably, an important consideration for consumers is tire wear life. While silica–silane systems are promoted as having wear and traction characteristics comparable with those of conventional tread compounds, the committee cannot verify these claims. Even a relatively small reduction in average wear life, on the order of a few percentage points, would result in corresponding increases in tire purchases and scrap tires. The estimates presented earlier in this chapter suggest that each 1 percent reduction in tire life would cost motorists an average of about $1.20 more per year in tire-related expenditures. Hence, if average tire life is shortened by as little as 5 percent, all or a significant portion of the annual fuel savings associated with lower rolling resistance would be offset.
OVERALL EFFECT ON CONSUMER EXPENDITURES
The time that might be required to achieve a 10 percent reduction in the average rolling resistance of replacement tires is not considered here because it would depend on the specific means of achieving the reduction. At a minimum, such a reduction would likely require at least as many years as required to turn over most of the tires in the fleet. If new technologies were introduced to bring about the reduction, an unspecified amount of time for product development and market penetration would be required. As calculated above, such a reduction in average rolling
resistance would save motorists an average of $12 to $24 per year in fuel expenditures, or $1.20 to $2.40 for every 1 percent reduction in the average rolling resistance experienced by replacement tires used on passenger vehicles.
Estimating the effect of reducing rolling resistance on tire expenditures is further complicated because of the numerous ways by which rolling resistance can be reduced. To gauge these costs, two scenarios were presented. One assumes that informed consumers would purchase more tires with lower rolling resistance from the selection of replacement tires already on the market. This is a conceivable scenario because today’s replacement tires already exhibit much variation in rolling resistance, even among tires that are comparable in size and various performance ratings. Data available on replacement tires do not show a clear pattern of price differentials among replacement tires that vary in rolling resistance. This suggests that such a shift in consumer purchases would not be accompanied by higher average tire prices and tire expenditures as long as wear resistance does not suffer.
A possible concern is that consumers, demanding fuel economy, would purchase more tires with shorter wear life in the event that reducing tread thickness is the primary means employed by tire manufacturers to achieve lower rolling resistance. The estimates developed here suggest that each 1 percent reduction in tire wear life will cost consumers about $1.20 per year in additional tire expenditures. A shift in purchases that favors tires with shorter wear life could therefore result in higher tire expenditures that offset fuel savings. However, this outcome is unlikely as a practical matter. Not only would the fuel savings from this approach be small, but consumers would quickly observe and seek to avoid the trade-off, given their long-demonstrated interest in prolonging tire wear life. Indeed, reducing tread depth does not appear to be the only, or the most common, method for achieving lower rolling resistance among tires already on the market.
Tire manufacturers and their suppliers have been actively researching new materials and technologies to reduce rolling resistance without compromising wear resistance and traction. These materials and technologies tend to be more costly than are those used in conventional tires. Rough estimates of the additional cost of modifying tread composition to reduce rolling resistance suggest a price premium that is on the order of $1 per tire.
In practice, changes in tread composition to reduce rolling resistance tend to be made as part of more comprehensive changes in tire design, construction, and dimensions. The committee could not find comprehensive quantitative information on how such changes, taken together, would affect tire prices and other aspects of tire performance such as traction and wear resistance.
REFERENCES
Abbreviations
EIA Energy Information Administration
RMA Rubber Manufacturers Association
Bethea, T. W., W. L. Hergenrother, F. J. Clark, and S. S. Sarker. 1994. Techniques to Reduce Tread Hysteresis. Rubber and Plastics News, Aug. 29.
Böhm, G. A., M. N. Nguyen, and W. M. Cole. 1995. Flocculation of Carbon Black in Filled Rubber Compounds. Presented to the Society of Rubber Industry, International Rubber Conference, Kobe, Japan.
Borzenski, F. J. 2004. Internal Wear of the Batch Mixer. Presented at International Tire Exhibition and Conference, Akron, Ohio, Sept. 21–23.
Cook, S. 2004. Low Rolling Resistance and Good Wet Grip with Silica. Tire Technology International 2004.
Crump, E. L. 2000. Economic Impact Analysis for the Proposed Carbon Black Manufacturing NESHAP. Report EPA-452/D-00-003. Office of Air Quality Planning Standards, U.S. Environmental Protection Agency, May.
Derham, C. J., R. Newell, and P. M. Swift. 1988. The Use of Silica for Improving Tread Grip in Winter Tyres. NR Technology, Vol. 19, No. 1, pp. 1–9.
EIA. 2005. Annual Energy Outlook 2006 (early website release). U.S. Department of Energy, Washington, D.C.
Gent, A. N. 2005. Mechanical Properties of Rubber. In The Pneumatic Tire (J. D. Walter and A. N. Gent, eds.), National Highway Traffic Safety Administration, Washington, D.C., pp. 28–79.
Joshi, P. G. 2005. Low-VOC Silanes. Tire Technology International 2005, pp. 126–129.
McNeish, A., and J. Byers. 1997. Low Rolling Resistance Tread Compounds: Some Compounding Solutions. Presentation to Rubber Division, American Chemical Society, May 6, Anaheim, Calif.
Modern Tire Dealer. 2006. Modern Tire Dealer’s Facts Issue. www.moderntiredealer.com. Jan.
RMA. 2005. Factbook 2005: U.S. Tire Shipment Activity Report for Statistical Year 2004. Washington, D.C.
Russell, R. M. 1993. Compounding for Wet Grip. Tire Technology International 1993, pp. 14–19.
Small, K., and K. Van Dender. 2005. Fuel Efficiency and Motor Vehicle Travel: The Declining Rebound Effect. Economic Working Paper 05-06-03 (revised December). University of California at Irvine.
Wang, M. J., Y. Kutsovsky, P. Zhang, G. Mehos, L. J. Murphy, and K. Mahmud. 2002. KGK Kautschuk Gummi Kunststoffe 55.


