
2
Uncertainty in Decision Making
This chapter provides guidance on how to identify and characterize the needs for uncertainty information among various users of forecasts, including members of the public, emergency managers, other government decision makers, and private-sector entities, both direct users and intermediaries.
To do so, it is first necessary to understand how decision makers interpret and use uncertainty information. Following a general overview of user types and needs for uncertainty information, Sections 2.2 and 2.3 summarize, respectively, how two streams of research have addressed the question of how decision makers interpret and use uncertain information—one from a descriptive perspective (how decisions under uncertainty are made), the other from a prescriptive perspective (how decisions under uncertainty should be made).
The descriptive perspective identifies psychological factors that influence how users perceive risk and uncertainty and process uncertainty information. These factors can lead to decisions that are quite different from those suggested by traditional “rational” decision models and, in the case of weather and climate forecasts, different from those expected by forecast communicators. The prescriptive perspective, statistical decision theory, considers how the major factors (inputs, preferences or goals, outputs, etc.) affecting a decision can be developed into a model that relates inputs to outputs and expected performance. Quantifying these factors and analyzing the results makes it possible to identify “superior” choices, conditional on the data used and the model’s assumptions. While the psychological perspective suggests that the statistical decision theory does not fully describe real-world decision making, such a process may aid decisions and improve understanding of decision making by reducing complexity and focusing the analysis.
Following the sections on prescriptive and descriptive approaches, Section 2.4 discusses how National Weather Service (NWS) and the Enterprise might apply this knowledge to better understand users’ needs for uncertainty information. There is a vast and growing literature on psychological issues associated with processing of uncertainty information and different methods of communicating user-specific probability and other uncertainty information. The committee did not review and digest this literature and parallel literatures (e.g., on the communication of risk information in health and medicine) to the point of making recommendations for the design of specific forecast products. Instead, and given that the need for probabilistic forecast products will grow, the committee recommends a process by which NWS can develop an effective system of provider-user interactions that will lead to the design and testing of effective forecast formats. Detailed recommendations about the specifics of the process are distributed throughout the chapter. Some of the recommendations are further developed in Chapter 4.
2.1
USER TYPES AND NEEDS FOR UNCERTAINTY INFORMATION
2.1.1
General User Types and Needs for Uncertainty Information
As forecast skill has increased in recent years, forecasts have become an important component of everyday and hazardous-weather decision making for many segments of society and the U.S. economy. Users of forecasts generated by the Enterprise range from members of the public to those with significant training in statistics and risk management. These different groups of users are diverse in both information desires and needs and their ability to process uncertainty information. NWS, in support of its mission to protect life and property and enhance the national economy, provides forecast information to some users directly, and to some users indirectly through intermediaries such as the media and other private-sector entities.
There are two broad categories of NWS forecast users (Figure 2.1): individuals or organizations who use the forecast directly in their operational decisions or their strategic planning, and organizations or institutions that act as inter-
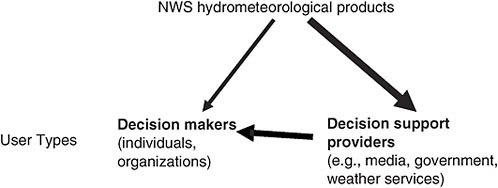
FIGURE 2.1 User categories for NWS products and the flow of forecast information and products among them. Line thickness qualitatively illustrates the relative magnitude of flow. SOURCE: Committee on Estimating and Communicating Uncertainty in Weather and Climate Forecasts.
mediaries between NWS and the public. Those include the media, government organizations, and weather services. The psychological factors in interpretation and use of uncertainty information apply mostly to individual end users. However, some intermediaries (such as the media) can exhibit similar understanding of probabilistic information. In addition, forecast products and formats that work for the NWS scientists who develop them may not be understandable to and usable by less specialized information processors.
The decision-support systems and analytic decision methods discussed in Section 2.3 are found to a far greater extent among users who get their information from the intermediaries listed on the right-hand side of Figure 2.1. Whether the decision processes that utilize hydrometeorological forecasts are informal and intuitive or formal and analytic, forecast producers need to be cognizant of how forecast information gets used to decide on how to optimally present its uncertainty.
Weather and climate affect nearly all segments of society, and there is a multitude of weather- and climate-related decisions and decision makers. More specifically, decision processes and their consequences vary on at least the following dimensions:
-
Forecast user: for example, individual, institution, or Enterprise member/intermediary;
-
Sector: for example, travel, tourism, energy, water, agriculture, insurance;
-
Type of decision: for example, emergency response, routine/recurrent operation, or adaptive long-term management plan;
-
Time or space scale: for example, imminent flood management at a location, or prediction of global market prices for commodities in a future season, or long-term corporate or national investments in infrastructure;
-
Problem complexity: for example, single objective with a few known inputs, or multiple objectives with many inputs/outputs and sources of uncertainty;
-
Decision processes: for example, analytic versus intuitive; exhaustive analysis of response options versus semiautomatic decision rules or response triggers, and framing of outcomes as gains or losses; and
-
Consequence of decision: for example, carrying an umbrella unnecessarily; saving lives and property.
In general, users want forecasts to help them make a decision: What clothes do I wear? Do we send out snowplows, and if so, when? Do we purchase additional fuel supplies for the coming months, and if so, how much? Do we order mandatory evacuations?1 The decisions made with hydrometeorological forecasts are so numerous and variable that this report cannot identify and specify the information needs of each individual user or user community. Thus, this section explores user needs for uncertainty information by discussing broad user communities and presenting examples. Guidance to NWS on how to build capacity to identify its users’ needs in greater detail is presented in Section 2.4
2.1.2.
Specific User Types and Needs for Uncertainty Information
Although NWS has not established a comprehensive formal method for incorporating uncertainty information into its services and products based on user needs,2 it does have
snapshots of those needs. For example, according to a recent customer satisfaction survey commissioned by NWS, most NWS customers surveyed want uncertainty information, but they are significantly less interested in probability information. With regard to the Advanced Hydrologic Prediction Service, NWS reports that although the available probabilistic information is utilized by specialized users, it has yet to be widely utilized by members of the public or even emergency managers. Nonetheless, these same users do understand and use qualitative uncertainty information.
Hydrometeorological forecasts are used in multiple ways that include variations in the time horizon of the forecast, the type(s) of variables being predicted, their geographic specificity, and other factors. This section discusses the different uses to which hydrometeorological forecasts can be put from a more abstract decision-making perspective. The examples provided differ on three continua. The first is along the dimension from simple, binary or go/no-go decisions that rely on some criterion cutoff to more complex, continuous decisions, such as deciding on the planting density of a crop as a function of a seasonal precipitation forecast. The second continuum ranges from little or no lead time to make a decision to decisions with longer lead time that often allow for adjustments along the way. The third continuum ranges from decisions of little consequence to decisions with severe consequences. Whereas decisions with low stakes occur very frequently (e.g., should I carry an umbrella today?), the consequences of the rare decisions with high stakes and thus the importance of transmitting forecasts in those situations in the most effective and socially beneficial way are many orders of magnitude greater.
One of the three examples in this discussion depicts short-term warning of an approaching hurricane (Box 2.1), and forecasts and warnings are directed at intermediaries but also at end users. This example involves high stakes, the loss of human life, and major physical destruction. The second and third examples (Boxes 2.2 and 2.3) involve the communication of a seasonal climate forecast to analytically more specialized users and intermediaries in different sectors. In these cases, the time urgency and the targeting of the message at analytically less well trained recipients make it less desirable to transmit the probabilistic nature of the forecast and more important to hit the right emotional tone and level of the message conveyed by the forecast.3
Much can be learned about users’ needs for forecast uncertainty information from the experience of the private meteorological sector.4 For example, according to one major private weather forecasting company, although its clients differ widely in their uses of forecasts, there are common themes in their needs for uncertainty information. Many of the company’s customers want to know the “worst case” and the forecaster’s “best guess” (i.e., most likely outcome), as well as the level of confidence the forecaster has in their own forecast (often phrased as “What would the forecaster do in their situation?”). Their users frequently assess uncertainty by seeking multiple sources of information, given its relatively easy availability on the Internet. Rather than a continuous probability distribution function (see Box 1.1), many of their users also prefer a presentation of high-, medium-, and low-likelihood events (expressed quantitatively, a 10/80/10 percent distribution in which the middle 80 percent corresponds to the medium likelihood). Many of their customers also want decision-support tools that translate uncertainty forecasts into risk analysis.
Finally, much can also be learned from the experience of the international community in understanding user needs. Some of these international experiences may not be directly applicable to NWS, since hydrometeorological services operate differently and have different missions in different countries (particularly with respect to roles of public and private sector), but it still can be informative.
2.1.3
Constraints and Limitations on Use of Uncertainty Information
While users may seek uncertainty information, they may not always need it or be able to use or to act upon it. For instance, state departments of transportation reportedly want probability information on road weather, but researchers find that they may not actually know what they are really asking for.5 As discussed in more detail in Section 2.2.1.4, users have a range of numeracy and analytical skills, and many users, even sophisticated ones, may not be able to process and manage uncertainty information, either manually or by computer. Emergency managers in Los Angeles, for instance, report that they are grappling with more mundane data problems such as accessing, exchanging, and verifying data, not to mention reviewing, understanding, and interpreting such data.6 Users also require time to incorporate new information into their decisions; for example, tactical decision making in the aviation industry involves extremely short timescales, which can complicate the use of uncertainty information. Moreover, the information provided must also be compatible with the capabilities of the science. In the long term, providing information that is scientifically indefensible will not benefit users’ decisions and thus will not satisfy their wants and needs.
The provision of more information is also not always desirable because additional information can delay or complicate action, with great costs in situations of time pressure and high stakes, especially when information besides hydrometeorological forecast information plays an important role.7
|
3 |
See related material in Box 4.3. |
|
4 |
Presentation by Jim Block, September 2005. |
|
5 |
Presentation by Bill Mahoney, September 2005. |
|
6 |
Presentation by Ellis Stanley, August 2005. |
|
7 |
The provision of uncertainty information is different from the production of such information. As noted in Chapter 3 in particular, the capability to produce uncertainty information for users, in and of itself, is valuable and indeed critical for creating forecast products tailored for a specific use. |
|
BOX 2.1 Hurricane Katrina Forecasts of extreme weather events such as tornadoes and hurricanes that are associated with large socioeconomic impacts must communicate important information to many types of users ranging from members of the public to decision makers in industry and government. Such forecasts generally provide a small lead time (e.g., up to 3 days in the case of hurricanes; see Figure 2.2) for decision makers. In the case of Hurricane Katrina, which hit the Gulf Coast in late August 2005, everyone in the affected region had to make weather-related decisions, many of them with life-death consequences. The consequences or outcomes related to decisions varied widely among users. Many decided to stay and either lost their lives (nearly 1,500 individuals died) or were stranded in the flooded areas in and around New Orleans. Nearly everyone in the region experienced some unavoidable economic loss. However, some organizations (e.g., regional railroads) used the forecasts of the projected hurricane path to make critical decisions (e.g., remove trains from the city prior to landfall) to minimize losses. Although the hurricane track forecasts were provided with uncertainty information (e.g., the cone of uncertainty) the short decision period of less than 48 hours forced a relatively limited decision in most situations (e.g., evacuation of at-risk locations and oil and natural gas platforms). Decision-support systems that highlight the likelihood of potential consequences, and provide 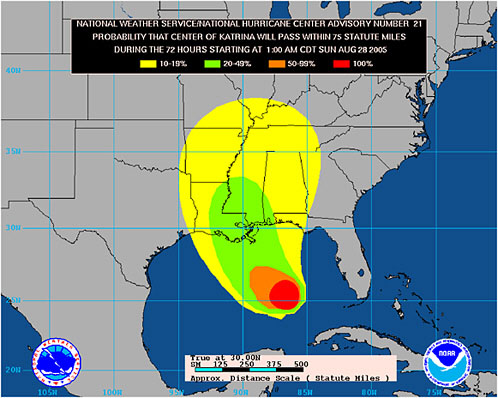 FIGURE 2.2 72-hour NOAA hurricane strike probability forecast from August 28, 2005, preceding Katrina’s landfall. SOURCE: National Hurricane Center. |
|
information on the continuously changing evacuation times and conditions, could be of great value to a number of key groups, such as emergency managers, in these high-pressure decision situations. However, it is not yet clear to what degree such tools were used during Hurricane Katrina. A key approach in catastrophic events is to communicate information in a clear, consistent manner. In addition, those disseminating information must understand and communicate the accuracy of the forecast and the potential consequences. For an emergency manager it may be critical to receive forecast uncertainty information to decide whether or not (and where) to order an evacuation and to put in the necessary support services (e.g., national guard, evacuation vehicles, communication methods, financial support services). The affected public needs to decide whether and how to act based on an evaluation of their situation, the emergency manager directive, and their access to the services. As to the communication aspect, care is needed when comparing an ongoing event to one that occurred earlier. For example, comparisons of Hurricane Katrina with Hurricane Camille, which occurred in 1969, might have triggered an undesirable response by some (based on their memory). Showing worst-case scenarios, such as the levees failing and the entire Ninth Ward of New Orleans under water, might have created a different response. However, someone would still have to decide to show such scenarios and how to present them. That decision would need to be informed by prior analyses of potential consequences and of what to do as a function of the assessed uncertainty of the forecast, and of the consequences. Hurricane wind and rain forecasts are but one part of the uncertainty associated with levee failure. |
|
BOX 2.2 Seasonal Energy Decisions Deregulation of the energy markets in the 1990s and the success of recent long-lead winter seasonal temperature forecasts (e.g., in 1997-98) have altered how power-utility decision makers view the use of climate information and seasonal forecasts (Changnon et al., 1995). Lead times associated with weather-sensitive utility decisions vary from a week to months. Primary applications of seasonal forecasts within utilities include power trading, load forecasting, fuel acquisition, and systems planning. Energy companies consider factors that often change, including those that are not weather-related. This creates complex decision schemes and the need for decision-support systems. For example, use of the winter temperature forecast depends not only on the accuracy or confidence in the forecast, but on whether other factors such as current natural gas supplies dominate over the forecast information. The consequences of weather-related decisions can be extremely large for a utility. Prior to the El Niño winter of 1997-98, many Midwestern power traders used the forecasted warm, dry winter conditions to alter their purchasing decisions, thus saving consumers millions of dollars (Changnon, 2000). The development and use of “weather derivatives” during the 1990s provided a means for power traders to insure against weather and climate risks (Dutton, 2002; Changnon, 2005). On average approximately $4 billion worth of weather contracts are sold in the United States each year. Other utility users of seasonal forecasts, including those in fuel acquisition and system management also must make economically important decisions that are based on a full understanding of the potential benefits and losses of such decisions. Utility companies are generally comfortable with probability-based forecasts but are often interested in obtaining climatological information and explanations of the forecasts (Changnon et al., 1995). In addition, utility officials have identified a number of hindrances to the use of forecasts including forecasters not communicating the level of accuracy of winter forecasts, forecast information that is difficult to understand and integrate into existing decision-support systems, and lack of access to forecast experts who could enhance use of information by providing a level of confidence in a given forecast (Changnon et al., 1995). |
As discussed in more detail in Chapter 4, when developing products to communicate forecast uncertainty (and deciding where to expend resources in doing so), it is necessary to consider user needs and capabilities rather than simply providing a large amount of information and expecting it to be useful or used. For example, many road weather decisions are primarily driven by budgets.8 Some transportation agencies also prefer a deterministic rather than probabilistic forecast because the weather of interest has such severe consequences that they will treat the roads in the event of any chance of precipitation (and would also prefer not to have field staff, aided
|
BOX 2.3 Sacramento Floods and Folsom Reservoir Operation Like New Orleans, Sacramento, which lies in the flood plain of the American and Sacramento rivers, is one of the U.S. cities most vulnerable to flooding (NRC, 1995, 1999a, 2000). Major floods in the years immediately following the Gold Rush of 1849, in particular the flood of 1861-62, highlighted Sacramento’s vulnerability. Initial efforts to control floods purely by levees were shown to be ineffective by the 1907 flood, and by 1956 a comprehensive system of levees, bypasses, channel improvements, and dams, including Folsom Dam on the American River, was largely implemented. The development of design criteria for Folsom Dam entailed the use of the historical hydrometeorological data to provide the city with protection from a 500-year flood event. Folsom Reservoir was developed as a multipurpose reservoir for hydropower, flood control, recreation, and water supply. Operating rules were developed for the reservoir using historical data, as well as synthetic flows generated from time-series analysis—but not hydrometeorological forecasts. These rules specify upper and lower limits on storage volumes retained for future flood control, water supply, and energy production as a function of calendar date. The rules are derived from long simulations of system operation to meet target demands under acceptable levels of reliability for each aspect of operation. Thus, the physical infrastructure and its operation rules are developed in the context of statistical decision theory (Section 2.3) using probabilistic information on supply and flood volume and timing derived from the historical record. A major flood not included in the design studies for the Folsom Dam occurred in 1997. As was the case with a record flood in 1986, the 1997 flood brought the system to the brink of failure—levees were nearly overtopped. With the new flood taken into consideration, the estimate of the degree of flood protection may be revised to be as low as the 80-year flood level (NRC, 1999a). It is unclear whether the occurrence of two very significant floods in the past two decades is due to sampling variability (i.e., uncertainty in the estimation of the flood occurrence probabilities) or climate change (i.e., a lack of representativeness of the historical record used for system design). The inability to resolve the nature of this uncertainty, combined with other scientific, economic, and political issues, has led to inaction regarding construction of new infrastructure to adequately protect Sacramento from flooding. Consequently, adaptive system management using probabilistic inflow forecasts and improvements to the release structures have emerged as the primary approaches to manage the reservoir operations against hydroclimatic risk. Along these lines, the U.S. Army Corps of Engineers (USACE) is studying alternatives to a pre-release scenario on the basis of hydrometeorological forecasts (USACE, 2002). Development of adaptive system management under inflow forecast uncertainty is a challenging problem for the multipurpose Folsom Reservoir. Multiple time scales need to be considered for the operation of the system. Probabilistic weather forecasts at 0- to 7-day lead times would be needed in conjunction with monitored watershed hydrology to estimate flood volume probabilities to aid decisions on advanced releases of water in anticipation of a flood. Probabilistic forecasts of monthly and seasonal rainfall would be needed to generate probabilistic inflow forecasts to assess reservoir refill probabilities by the end of the wet season. The consequences of excess advanced release could be the inability to fill the reservoir by the end of the wet season and, consequently, an inability to meet future energy and water demands. Multidecadal scenarios of forecasts would be needed to assess whether modifications in operating rules to take advantage of probabilistic forecasts would indeed translate into risk reduction and benefits relative to the existing default policies in the long run. Implementation of modified rules by the managers in the absence of long-term performance simulations is unlikely. Initial work in these directions has started as a collaborative effort of researchers, forecasters, and managers (Georgakakos et al., 2005). This is an example of a system vulnerable to hydroclimatic variability for which there is the technical ability to use probabilistic hydrometeorological forecasts in an analytic framework for risk reduction. It also represents a good opportunity for the development of a testbed (see Section 3.1.6). |
with uncertainty information, second-guessing management decisions). In agriculture, many users’ decisions are affected more by economic factors such as export market conditions, than by hydrometeorological forecasts.9 Water resources managers’ decisions are dominated not by hydrometeorological forecasts but instead by regulations, costs, power markets, politics, and, of late, terrorism threats.10 Organizations often also establish standard operating procedures (e.g., with specific roles and responsibilities for each position) that have developed over many years and may not easily adapt to inputs of new information (e.g., Box 2.4). And some users do not even utilize existing forecast products and tools. For example, by law, the USACE cannot make reservoir management decisions based on forecasts.11 When they do use forecast information, many water resources and agricultural users prefer scenarios and collections of past observed events that “look like” what they expect to see in the future (analogs), instead of simply probability information.
Users process information both emotionally and rationally. The next two sections discuss ways in which users might deal with probabilistic forecasts from the perspective of the recent descriptive and psychological literature on decision making under uncertainty. The elements of statistical decision theory
|
BOX 2.4 Example of the Complex Ways that Uncertain Hydrometeorological Information Can Interact with User Decision Making Flood managers often make high-stakes decisions based on complicated and usually incomplete data and information amidst not only much uncertainty but also constant change. The interaction between hydrometeorological uncertainty and flood management decision making was explored in a study by Morss et al. (2005). Like many groups of users, flood managers are not a homogeneous group; rather, the group includes decision makers from a variety of disciplines who operate under the priorities and values of their respective constituencies and communities. Their decisions must often be made quickly, using whatever information is available at the time, and the options available to them frequently must be taken in untidy, discrete chunks and not continuously along an elegant distribution of probabilities. And in many cases, flood management decisions are, in essence, already made for them, determined well in advance by land-use patterns, existing infrastructure, and rigid operating rules. In such an environment, these resource constraints—in addition to technical capacity, familiar and comfortable routines, and even personal relationships with trusted advisers—triumph over scientific information, especially when different sources of hydrometeorological information and guidance conflict. Flood managers thus often retreat to simple analyses and actions that, while perhaps not fully incorporating the best science and uncertainty information available, are nonetheless logical and defensible. Based on their findings and the experience of others, Morss et al. (2005) recommend that to provide usable scientific information, scientists must invest time and effort to develop long-term relationships with flood managers, providing a two-way street for ongoing interaction and feedback. For information to be used, scientists must also make hydrometeorological information directly applicable and practical for a flood manager’s situation and environment. Such an approach should eventually lead to the familiarity with, trust in, and credibility of scientists that flood management practitioners seek when making critical decisions and thereby allow them to better incorporate hydrometeorological information into those decisions. As noted earlier, for some users a key component of this information is detailed forecast and historical information for user-based verification. |
that may constitute an input into such processes are then discussed in the subsequent section. The formal analyses of the statistical decision analysis approach may be internalized in many businesses (e.g., for decisions on maintenance, inventory and supply chain management, infrastructure and strategic planning, and insurance). The opportunity for the use of probabilistic forecasts by different users may vary dramatically, and different types of efforts (e.g., modification of an existing decision-support system, or a detailed analysis of factors that determine decisions and the “safe” introduction of probabilistic information into that process) may need to be stimulated by the Enterprise to make forecasts useful to these groups.
2.2
PSYCHOLOGICAL FACTORS IN INTERPRETING AND USING UNCERTAIN INFORMATION
This section reviews some established results from the psychology of risk and uncertainty; that is, what is known about the way in which people deal with risk and uncertainty and how they understand and utilize uncertainty information? It begins by describing several psychological dimensions relevant to the communication of uncertainty information on which potential users of weather and climate forecasts are known to differ. Most of these differences derive from the fact that people process uncertainty information with the help of two systems, an experiential/emotional system and an analytic system. These two processing systems operate for everyone, but the degree of sophistication of the analytic processing system and the attention paid to it by the decision maker strongly differ as a function of education and training, and by the current rules of practice in an organization. This section discusses the implications that this and other individual differences might have for the design of forecast uncertainty products. Section 2.2.2 describes three complications in the communication of uncertainty information that lie at the root of possible user misinterpretations or rejections of probabilistic forecasts and point the way to user needs.
2.2.1
Psychological Heterogeneity in Users
The psychological heterogeneity of users makes it impossible for any single forecast product to satisfy the needs and constraints of all users. Factors that influence the way in which users perceive uncertainty and make decisions include the operation of different information-processing systems, how information about possible events and their likelihood is obtained, the different emotional impact of gains versus losses, and the degree of numeracy and personality of a particular user.
2.2.1.1
Two Processing Systems
Research from cognitive, social, and clinical psychology suggests that people process information in two distinct ways when making judgments or arriving at decisions (Epstein,
TABLE 2.1 Two Human Information-Processing Systems
|
Emotionally Driven Experiential System |
Analytic System |
|
Encodes reality in concrete images, metaphors, narratives linked in associative networks |
Encodes reality in abstract symbols, words, numbers |
|
- Experiential |
- Analytic |
|
- Intuitive |
- Logical |
|
- Vivid |
- Abstract |
|
- Affective |
- Deliberative |
|
SOURCE: Marx et al. (2006). |
|
1994; Chaiken and Trope, 1999; Sloman, 1996; Table 2.1). The first, evolutionarily older system works on the basis of affective associations and similarity; it teaches us, for example, to avoid the hot stovetop that caused us pain when touched, and to avoid similar stovetops in the future. This associative system is intuitive, automatic, and fast. It maps uncertain and adverse aspects of the environment into affective responses (e.g., fear, dread, anxiety) and thus represents risk as a feeling (Loewenstein et al., 2001). It requires real-world experience as input (and more experienced decision makers make better decisions using it than novices), but its basic mechanisms are present in every healthy infant and do not need to be learned.
The second processing system works by analytic algorithms and rules, including those specified by formal models of judgment and decision making (Section 2.3), but also less formal rules like those embodied in customs or proverbs. It translates experience into symbolic representations (words, symbols, or numbers) that can be manipulated by rules and algorithms. These rules need to be learned and are taught both formally (e.g., college courses on probability theory) and informally (e.g., culture-specific rights and obligations that are transmitted in the form of proverbs or professional codices). Unlike the associative system, the analytic processing system does not operate automatically, and its operation requires effortful conscious awareness and control.
The two processing systems typically operate in parallel and interact with each other. Analytic reasoning cannot be effective unless it is guided by emotion and effect (Damasio, 1994). In many if not most instances, the two processing systems arrive at similar decisions or conclusions. In those cases where the decisions or conclusions disagree, however, the affective system usually prevails, as in the case of phobic reactions, where people know that their avoidance behavior is at best ineffective and possibly harmful to them but cannot suspend it. Even in seemingly objective contexts such as financial investment decisions, emotional reactions (e.g., worry or dread) to investment opportunities are just as important as statistical variables (e.g., outcomes and their probabilities) to predict perceptions of risk (Holtgrave and Weber, 1993). If perceptions and reactions to risk were driven mostly or exclusively by statistical probability distributions, they would not be influenced by the way a particular hazard is labeled. Yet, reports about incidences of “mad cow disease” elicit greater fear than reports about incidences of bovine spongiform encephalitis or Creutzfeld-Jacob disease, a more abstract, scientific label for the same disorder (Sinaceur and Heath, 2005).
In another example, different labels for the same NWS forecast product have been found to evoke different associations and feelings. Broad et al. (2006) examined media interpretations from local Florida newspapers of the National Hurricane Center (NHC) hurricane forecast product, referred to by NHC as the cone of uncertainty (Figure 1.6). A search of Lexis/Nexis and the Miami-Dade Public Library System Databases identified 101 articles in 14 daily papers for the period of January 1, 2004 to August 16, 2005. As shown in Figure 2.3, “cone of uncertainty” and “cone of probability” were the most common terms used by the newspapers to refer to the forecast product. Jardine and Hrudey (1997) suggested that people interpret the word “probability” (the chance that a given event will occur) incorrectly as “probable” (likely to happen), implying that the product label “cone of probabil-ity” may lead some to conclude that the depicted hurricane track forecasts are more certain than they in fact are. NHC wisely does not use the term “cone of probability,” preferring instead “cone of uncertainty.” Other labels generated by the media for this forecast product can be expected to lead to different misinterpretations on the part of the public; for example, the term “cone of error” may be expected to reduce confidence in the product (see below), and other observed labels like “cone of death” or “cone of terror” may engage the emotional processing system and may induce fear or panic, rather than analytic evacuation contingency planning.
There is not a sharp separation between experiential and analytic processing. Decisions typically integrate both types of processing. The role of analytic processes in the understanding of hydrometeorological uncertainty and in decisions involving such information has, however, often been overestimated and the role of experiential processes has been ignored (Marx et al., 2006). A better appreciation of experiential processing may point the Enterprise toward improved risk communication strategies.
2.2.1.2
Decisions from Personal Experience versus Decisions from Description
Personal experience is a great, albeit painful way to learn. The single painful touch of a hot stove produces substantial learning. The ability to understand and utilize the cautionary tales and anecdotes of others extends the range of personal experience. The ability to combine the personal experiences of many into statistical summaries or to derive forecasts of probabilities from theoretical or statistical models is an additional powerful evolutionary accomplishment that
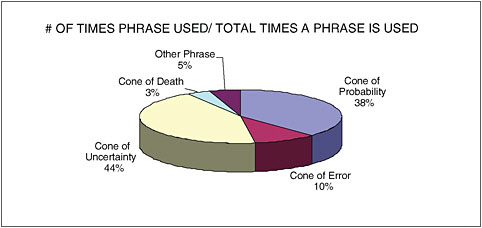
FIGURE 2.3 Percent time that different phrases were used to describe the cone of uncertainty. SOURCE: Broad et al. (2006).
dramatically increases the ability to learn in less costly ways. Recent work has compared the two ways of learning about the possible outcomes of decisions and actions (Hertwig et al., 2004; Weber et al., 2004; Hertwig et al., 2006). Formal models of decision making under risk and uncertainty (such as statistical decision theory, discussed in Section 2.3) have predominantly focused on analytic decision making, even though researchers have long been aware that abstract statistical evidence is typically at a disadvantage when people have a choice between it and concrete personal experience.
Concrete, personal, or vicariously related experience is processed by the experiential system and the generated effect is an effective motivator of action. More pallid statistical information is processed by the analytic system, whose output tends to have less weight in actions or decisions, unless decision makers have been trained to pay conscious attention to statistical information and its implications. In daily life, decision makers often learn about outcomes and their probabilities as a function of their profession or role. Doctors, for example, learn about health outcomes of treatment decisions in a different way than the public. Consider the decision whether to vaccinate a child against diphtheria, tetanus, and pertussis (DTaP). Parents who research the side effects of the DTaP vaccine on the National Immunization Program Web site will find that up to 1 child out of 1,000 will suffer from high fever and about 1 child out of 14,000 will suffer from seizures as a result of immunization. Although doctors have these same statistics at their disposal, they also have access to other information not easily available to parents—namely, the personal experience, gathered across many patients, that vaccination rarely results in side effects. Few doctors have encountered one of the unusual cases in which high fever or seizures follow vaccination. If the importance assigned to rare events differs as a function of how one learns about their likelihood, then doctors and patients might well disagree about whether vaccination is advised.
Related to the distinction between analytic and experiential processing is the distinction between decisions made from description versus decisions made from experience. An example of a description-based decision is a choice between two lottery tickets, where each ticket is described by a probability distribution of possible outcomes (i.e., statistical summary information). In contrast, when people decide whether to back up their computer’s hard drive, cross a busy street, or invest in a new water system to irrigate their crops, they often do not know the complete range of possible outcomes, let alone their probabilities. Instead people typically decide based on past personal experience. Research has shown that the weight given to small-probability events differs dramatically between the two processing systems (with much greater weight given to small-probability events when small probabilities are provided as a statistic than in decisions from experience), demonstrating that the way in which information is acquired is an important determinant in the outcome of decisions that involve small-probability events (Hertwig et al., 2004, 2006; Weber et al., 2004). Decisions from personal experience put a large premium on recent events. By definition, rare events have not occurred very often in recent experience and their possible consequences thus get discounted more than they should. On those rare occasions where the rare event did occur in recent history, people will overreact to it, making decisions from experience also more volatile than decisions from statistical description.
These results have important consequences for the management of small-probability risky events. If people base their preparations for a rare event like a tornado or hurricane on their past personal experience with such events, they will most likely underprepare for them. Marx et al. (2006) discuss
ways in which experiential and analytic processes might better be jointly utilized and combined in risk communications, though research in this area is still in its infancy.
2.2.1.3
Different Risk Attitudes for Gains and for Losses
The most successful behavioral model of risky decision making is prospect theory, first formulated by Kahneman and Tversky (1979) and later refined by Tversky and Kahneman (1992). The theory deviates from its economic competitor, expected utility theory, in a small number of important ways. Expected utility theory assumes that people evaluate the outcome of a decision in terms of its absolute effect on their wealth or well-being. Most applications of expected utility theory find people to be risk-averse. Risk aversion is a label that describes a concave utility function that predicts a decision maker will prefer receiving $10 for certain to a 50 percent chance of receiving $20. Prospect theory, on the other hand, assumes that people evaluate the outcome of a decision in a relative fashion (i.e., as a relative gain or relative loss from a reference point). The reference point is typically the status quo but can also be the outcome the decision maker expected to achieve. When expecting a price of $50 per ton of wheat, a farmer will experience an obtained price of $45 not as a gain, but as a relative loss. The reason that the relative evaluation of an outcome (as a gain or as a loss) matters is that people have been shown to be risk-averse primarily when they perceive themselves to be in the domain of gains. Most people would prefer to be certain of receiving $100, rather than taking their chances at a 50:50 gamble of getting $200 or nothing. In the domain of losses, on the other hand, people tend to be risk-seeking. Most would prefer to take their chances at a 50/50 gamble of losing $200 or nothing, rather than being certain of losing $100. Risk seeking is a label that describes the convex loss part of the utility function which predicts that a decision maker will prefer a 50/50 gamble of losing $20 or nothing to losing $10 for sure. In addition, losing $20 feels a lot worse than winning $20 feels good (Figure 2.4), a widely observed phenomenon that has been called loss aversion. The existence of loss aversion and of different risk attitudes for perceived gains versus perceived losses mean that one can influence which option a decision maker selects by modifying the reference point used to evaluate the outcomes of the decision.
2.2.1.4
Numeracy
A challenge to risk communication is the difficulty of expressing quantitative risk information in an easily comprehensible form. Cognitive limitations cause biases in the human ability to interpret numerical probabilities; particularly small probabilities are especially difficult to interpret. Under some conditions, people overestimate them, and under others, they round down to zero (Tversky and Kahneman, 1974; Nicholls, 1999). These difficulties in interpreting
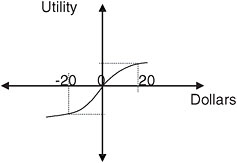
FIGURE 2.4 Different risk attitudes for perceived gains and losses. Losing $20 feels a lot worse than winning $20 feels good. SOURCE: Committee on Estimating and Communicating Uncertainty in Weather and Climate Forecasts.
probabilities and other quantitative and analytic information are compounded by the limited instruction and training of their analytic processing system received by a large proportion of the U.S. population. The “numeracy” scale that assesses basic quantitative processing skills and that is used extensively in the medical risk communication community to assess the quantitative sophistication of users of medical risk information has been administered to large samples of the U.S. population, with discouraging results (Lipkus et al., 2001). Yet, numeracy and the related ability to follow printed guidelines on how to interpret graphs (e.g., the cone of uncertainty of a hurricane track forecast) are crucial if users are to correctly understand and utilize probabilistic forecast products that are typically designed for processing by the analytic processing system.
The failure of both end users and even the (presumably more sophisticated) media to correctly interpret the cone of uncertainty resulted, in the aftermath of Hurricane Charley (Figure 1.6), in such frustrated statements by members of NHC as “if anything needs improvement, it is the interpretation skills of the local weather media” (Broad et al., 2006). More important perhaps is the realization that forecast products, provided either to end users or intermediaries, need to be designed with full defensive awareness of the limitations in numeracy and analytic processing skills that they may encounter.
2.2.1.5
Personality Characteristics
Personality characteristics have been shown to influence how people make decisions under uncertainty (Hansen et al., 2004). Self-regulation theory (Higgins, 1999) distinguishes between two systems, the promotion and the prevention systems, with distinct survival functions. The promotion system is concerned with obtaining nurturance (e.g., nourishing food) and underlies higher-level concerns with accomplish-
ment and advancement. In contrast, the prevention system is concerned with obtaining security and underlies higher-level concerns with safety and fulfillment of responsibilities. The two systems have been shown to employ qualitatively distinct means to achieve desired end states. Promotion-focused individuals are inclined to utilize “approach means” to attain their goals. For instance, a promotion-focused student seeking a high exam score might study extra material or organize a study group with fellow classmates. Conversely, individuals with a prevention focus tend to use “avoidance means” to attain their goals. For example, a prevention-focused student seeking a high exam score (or rather, trying to avoid a low exam score) might ensure that they know the required material and will avoid distractions prior to the exam. Hansen et al. (2004) found that prevention-focused farmers were more likely to seek to minimize post-decisional regret than promotion-focused farmers. They also remembered a greater number of flooding events and were more likely to purchase crop insurance.
Promotion uses hope to motivate action, whereas prevention uses fear to do the same. Promotion-focused decision makers can be expected to pay greater attention to the upside of possible outcomes. Prevention-focused decision makers, on the other hand, will pay greater attention to the downside or worst cases. Many forecast products have the potential to either promote opportunity or to prevent loss or calamity. Seasonal climate forecasts, for example, allow farmers to maximize economic gain by selecting seasonally appropriate seed corn. They also allow emergency managers to prevent mass starvation in the case of a drought, by planning the timely purchase of feed corn. The Internet has made the customization of information a lot easier. It is not inconceivable that future Web users of NWS forecasts could first answer two or three simple questions about the purpose to which they plan to put the requested forecast, based on which they would receive the forecast in an appropriately tailored version.
2.2.2
Misinterpretations of Uncertainty and Probabilistic Forecasts
There is a danger that users will misinterpret the very meaning of the forecast variable and/or the uncertainty associated with that variable. Users also have a distinct psychological reaction to the notion of uncertainty in estimates of uncertainty, or ambiguity.
2.2.2.1
Interpretation of a Weather or Climate Event
Forecast providers may not be aware that the definition of the event they are forecasting may not be obvious to the users. Following up on an earlier study by Murphy et al. (1980), Gigerenzer et al. (2005) asked a small sample of respondents in five cities with different degrees of exposure to probabilistic forecasts—Amsterdam, Athens, Berlin, Milan, and New York—what was meant by the probability of precipitation (PoP) forecast of a “30 percent chance of rain tomorrow,” in both a free-response and a multiple-choice format. Only in New York did a majority of respondents supply the standard meteorological interpretation, namely, that when the weather conditions are like today, in 3 out of 10 cases there will be (at least a trace of) rain the next day. In each European city, this alternative was judged to be the least likely one. The preferred interpretation in Europe was that it will rain tomorrow “30 percent of the time,” followed by “in 30 percent of the area.” The authors of the study concluded that the forecast providers ought to explicitly specify the situation, or reference class, to which the single-event probability refers.
The more general point of this example is that perceptions and interpretations of NWS technical staff may not be universally shared by members of the public and that the heterogeneity in reactions and interpretations might be wider than NWS appreciates.
2.2.2.2
Interpretations of Probabilities (Words, Numbers, Frequencies)
A common and seemingly simple way of communicating the uncertainty of an event is by providing a probability estimate of its occurrence, as for example the PoP forecast. This is also a common format in other areas, for example, the communication of health risks, where drug package inserts provide information about the probability of a series of side effects, conditional on taking the medication.
Concerns about people’s ability to process numerical probability information (i.e., their low numeracy levels; Section 2.2.2.4) have given rise to the suggestion to replace the numeric communication of probability information with verbal expressions, which may be less intimidating or taxing to nonspecialist recipients of uncertainty information. There are, however, a host of reasons for why this idea may not be practical. Wallsten et al. (1986) collected information about the numeric equivalents that members of the public would assign to common probability words such as “probable,” “possible,” and “unlikely.” The likelihood ranges people assign to many common probability words is very wide (Figure 2.5), meaning that their use in communicating probability levels may not be very precise or diagnostic. Furthermore, the numeric interpretation of probability words depends on a host of other factors, including the base rate of the event that it describes (Wallsten et al., 1986) and the severity of the consequences of the event (Weber and Hilton, 1990; Weber, 1994). Thus, people will assign a higher numeric interpretation to “good chance” when it describes the probability of rain in London rather than rain in Cairo, and when it describes the probability of cancer rather than a sprained ankle.
Similar issues have been raised for the communication of climate change uncertainty. For the IPCC’s Third Assessment
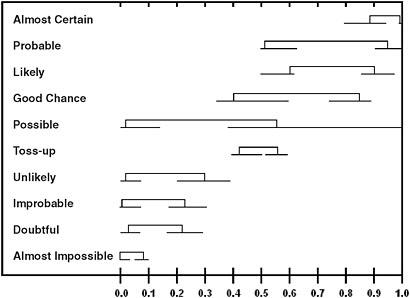
FIGURE 2.5 Range of interpretations of different verbal uncertainty terms. SOURCE: Wallsten et al. (1986).
Report (TAR), Moss and Schneider (2000) assessed several means for characterizing climate change uncertainties and prepared a guidance paper for use by all TAR authors. Noting the need for a consistent approach, Moss and Schneider (2000) proposed not only a general process for assessing uncertainties but also several specific tools that could be used to communicate them. They decided to deal with the problem that words used as descriptors of probability can hold very different meanings to different stakeholders, with the recommendation that verbal descriptions of scientific information must be calibrated consistently. For the purpose of communicating uncertainties in the TAR report, they mandated that verbal confidence descriptors—probability expressions of a specific type—should be used in accordance with the numeric equivalents shown in Table 2.2.
TABLE 2.2 Quantification of Verbal Confidence Descriptions in IPCC’s Third Assessment Report
|
Verbal Descriptor |
Likelihood Ranges |
|
|
From |
To |
|
|
Very High Confidence |
0.95 |
1.00 |
|
High Confidence |
0.67 |
0.95 |
|
Medium Confidence |
0.33 |
0.67 |
|
Low Confidence |
0.05 |
0.33 |
|
Very Low Confidence |
0.00 |
0.05 |
|
SOURCE: Moss and Schneider (2000). |
||
Given the lack of precision of probability words and possible confusion in their interpretation, the routine use of verbal probability expressions in the communication of uncertainty has its dangers. People seem to be aware of the ambiguity inherent in the verbal communication of uncertainty. When asked whether they preferred to receive uncertainty information either verbally or numerically, most people preferred the greater precision of the numerical format. When asked about their preference in communicating uncertainty information, on the other hand, people preferred to provide verbal forecasts, because their greater ambiguity made it less likely that they would turn out to be wrong (Wallsten et al., 1993).
Gigerenzer and Hoffrage (1995) showed that many misinterpretations of numeric probabilities are improved when such information is communicated in the form of a relative frequency. Thus, people may not pay sufficient attention to the fact that a disease has a base rate of 0.005 of occurring in a population, but are much more likely to use this information accurately when they are told that it has a 1-in-200 chance of occurrence (see also the discussion of frequentist interpretation of probabilities—Box 1.1). While the use of relative frequencies is no panacea (Mellers et al., 2001), it seems to be a more effective communication format because it allows people to connect probabilistic information to their personal experience base, where information is typically stored in the form of event counts. In addition, use of relative frequencies can help clarify the nature of the target event and reduce the possibility of misunderstanding it.
Finding: The use of verbal probability expressions does not appear to be an effective way to communicate uncertainty information to less analytic users, suggesting that better ways should be found to communicate such information numerically. Errors in the interpretation of numeric probability information are often reduced when probabilities are described in terms of relative frequencies
Recommendation 2.1: For users who have difficulty with numeric probabilities and prefer a less analytic approach, forecast uncertainty should be expressed using relative frequencies rather than probabilities.
2.2.2.3
Reactions to Uncertainty in Estimates of Uncertainty
People react in different ways to the different sources of uncertainty in forecasts. Decisions whose outcomes are known only probabilistically are referred to as decisions under risk when the likelihood of different events is known precisely (e.g., the probability of getting a “head” when tossing a fair coin) and as decisions under uncertainty when the likelihoods themselves are uncertain (e.g., the probability of precipitation tomorrow). The past half-century has seen a lot of theoretical and empirical work that provides further distinctions between different types of uncertainty as well as sources of uncertainty. Uncertainty about probability has been called ambiguity (Ellsberg, 1961) or vagueness (Wallsten, 1990). Whereas ambiguity is sometimes expressed and modeled as second-order uncertainty (uncertainty about the degree of uncertainty), Camerer and Weber (1992) endorse the more general definition of ambiguity as uncertainty about probability, created by missing information that is relevant and could be known.
It has long been known that people are risk-averse; that is, they do not like uncertainty and will settle for certainty equivalents that are smaller than the expected value of risky choice options (Bernoulli, 1738), at least in the domain of gains (Section 2.2.1.3). A more recent discovery is the fact that people and organizations are also ambiguity-averse (Ellsberg, 1961). People prefer to bet on a lottery where they know the precise odds of winning over a lottery that has the same expected probability of winning, but less well specified probability levels or more second-order uncertainty. Not knowing important information is aversive and makes people shy away from making any decision at all in such a situation (Heath and Tversky, 1991). Similarly, insurance companies are often unwilling to insure ambiguous risks (i.e., new risks with no record of losses on which actuarial estimates of the probability of a loss can be placed). Just as risk aversion is typically mediated by an emotional rather than cognitive response, so is ambiguity aversion. Not knowing the precise probability level makes us feel uncomfortable, and feelings of worry or discomfort translate into avoidance. When other factors, such as familiarity with the domain of the decision problem reduce the feelings of worry or discomfort, ambiguity aversion disappears or turns into ambiguity seeking. For example, when people with expertise in a sport like college basketball are given the choice between betting on a risky lottery (i.e., on a lottery with well-specified probability levels) or on a college basketball game where the probability of winning is more ambiguous, they tend to prefer betting on the ambiguous basketball game (Fox and Tversky, 1995). People have also been found to react differently to uncertainty from different sources. Uncertainty arising from a stochastic environment (called aleatory uncertainty) is seen as less aversive than uncertainty arising from incomplete and/or unreliable observations (called epistemic uncertainty), presumably because the latter can be reduced, at least in principle (Heath and Tversky, 1991; Wallsten et al., 1997).
Confidence in a probabilistic forecast is a way of expressing second-order uncertainty and often reflects the internal or external conflict experienced in making the forecast (Weber et al., 2000). While confidence could just be seen as an expression of subjective probability, the confidence information that people provide about a judgment they made tends to reflect their internal conflict in arriving at that judgment rather than to reflect the probability of being correct. Forecasters’ Area Forecast Discussions have been reported to be one of the most accessed pieces of information on the NWS Web site, probably in part because these discussions convey forecasters’ confidence and their reasoning behind it. Using another example from the climate-change arena, Moss and Schneider (2000) in their recommendation for the communication of uncertainty in the third assessment report of the IPCC, also suggest that level of agreement or consensus (the complement of degree of conflict) is qualitatively different from other sources of uncertainty. They propose to communicate both sources of uncertainty separately (in this case, qualitatively and verbally; Table 2.3), rather than to incorporate or compound the two into an overall probability level or confidence interval for the target event. Although this distinction between two (or more) different contributors to forecast uncertainty may not apply to all forecasts, the distinction is important both for general users of uncertainty information and for forecasters, who may feel some responsibility to reduce uncertainty due to differences in agreement
TABLE 2.3 Suggestion to Conceptually Separate Level of Agreement and Amount of Evidence as Sources of Uncertainty
|
|
|
AMOUNT OF EVIDENCE |
|
|
|
|
Low |
High |
|
LEVEL OF AGREEMENT AND/ OR CONSENSUS |
Low |
Speculative |
Competing explanations |
|
High |
Established but Incomplete |
Well established |
|
|
SOURCE: Moss and Schneider (2000). |
|||
about forecasts but no responsibility for uncertainty due to insufficient evidence.
Finding: Different types and sources of uncertainty in hydrometeorological forecasts are processed by the transmitters and recipients of uncertainty information in different ways.
Recommendation 2.2: The Enterprise should signal to users the different sources of uncertainty in their probabilistic forecasts and risk communication products.
2.3
STATISTICAL APPROACHES TO DECISION MAKING UNDER UNCERTAINTY
This section explores objective, statistical approaches to decision making under uncertainty as opposed to the psychological factors covered in the preceding section. In statistical decision theory all sources of uncertainty are assessed and their impact on a process of interest is quantified so that a “best” decision can be made. For decisions that use weather or seasonal climate forecasts, the sources of uncertainty include not just atmospheric processes but also any other processes that influence the consequence of the event. For instance, agricultural outcomes may be influenced by uncertainty in the market price of the product, as well as by the local weather forecast. These objective approaches provide a user with a decision, but in a practical sense individual users are not bound by these objectively produced decisions, and the psychological factors discussed in Section 2.2 will still be in play. A key advantage of analytical approaches such as statistical decision theory is that, if properly developed, they provide a formal structure for eliciting and integrating all information relevant to a particular decision process. Thus, the context for the use of hydrometeorological forecasts, as well as the sensitivity of the decisions to these forecasts, can be made clear.
The following section begins with a brief historical context and then discusses the basic concepts associated with statistical decision theory, linking to a series of examples that seek to convey some of the issues that emerge in considering decision making under uncertainty and risk in the hydrometeorological context. The section closes by outlining findings in the application of statistical decision theory, with an eye toward implications for NWS.
2.3.1
Historical Context
There is a long history of the use of concepts from statistical decision theory12 for the management of risk in the agriculture, water, energy, insurance, emergency planning, and business communities. The hydrometeorological community, as a provider of probabilistic information, participated in the evolution of this literature as well (e.g., Thompson and Brier, 1955; Epstein, 1962; Glahn, 1964; Murphy, 1976; Katz et al., 1982; Brown et al., 1986; Murphy and Ye, 1990; Wilks and Hamill, 1995).
The statistical decision theory framework has addressed both the derivation of “optimal” decisions in the presence of uncertainty and the associated value of information (e.g., improved forecasts or more data). The literature on statistical decision theory is quite mature with respect to both theory and to the development of case studies and examples. However, the frequency of applications for real-world decisions varies widely depending on the sector, the setting, and the dimension of the problem. Typically, decision-support systems that use statistical decision theory are developed on a case-by-case basis for a particular application, and generalized applications that facilitate their broader use are not readily available. Even if generalized applications were available, the data requirements and peculiarities of each problem might necessitate significant modifications. Where decision-support systems are used most routinely, they are embedded in either legal guidelines (e.g., federal water project design guidelines), are part of a specific corporate culture, or are developed as part of a customized software package for a production scheduling, inventory management, or protective response.
NOAA/NWS has historically supported decision-support systems in water resources management (Fread et al., 1995; Changnon, 2002; Georgakakos and Carpenter, 2005; Power et al., 2005). For example, streamflow observations and forecasts are considered in the operation of some large reservoir facilities that have competing objectives such as flood control, hydroelectric power production, ecosystem health, recreation, river transportation, and others. Disaster management agencies also routinely use flood forecasts. The decision-support systems in these cases may use simulation models for scenario analysis, or linked simulation and optimization tools.
2.3.2
Illustration of Seasonal Climate-related Use Scenarios
Analytic processing, of which statistical decision theory is a common example, can serve to summarize and focus the available information. A starting premise of statistical decision theory is that the key elements that characterize the decision problem can be and have been identified. This entails the identification of
-
the decision maker’s objectives, formalized by a numerical utility function that measures preferences with respect to different consequences;
-
all actions available to the decision maker;
-
the possible consequences of these actions; and
-
the conditional probability distribution of each consequence given each action.
The conditional probability distribution may be derived from models of system dynamics or specified subjectively. In addition, it should include consideration of the underlying sources of uncertainty, whether they relate to information or to model/knowledge attributes. Once these four elements have been defined, the expected utility or the average utility associated with each action can be computed and the different actions can be ranked as to their expected utility given information about the current or projected state of the world.
Consider three situations for decision making using hydrometeorological information: determinism, uncertainty, and ambiguity. Determinism is a situation where the system dynamics and the available amounts of each input are known (including all model parameters), consequences (outputs) can be predicted perfectly, and the utility of each level of output is known. The resulting optimization problem is well defined and one can mathematically determine the decisions that maximize utility. Uncertainty is a situation where one or more of the inputs or model parameters are not known with certainty but its probability distribution is known precisely. In this case, the probability of each outcome must be evaluated, and the average expected utility13 is calculated as a function of decision choices. The decisions that maximize expected utility are considered optimal. Ambiguity exists when the probability distributions of interest, in addition to one or more of the model parameters, are not known precisely and must be estimated (see also Section 2.2.4). In this case, a two-step process is used. The probability of each outcome for each decision is estimated by considering each possible probability distribution of each input, weighted according to its probability of occurrence. These probability distributions may be estimated objectively or subjectively. Expected utility is then computed and maximized. A condition of decision making under uncertainty is approached as the precision of information about the underlying probability distributions (forecasts) increases. Conversely, with less precise information as to the underlying probability distributions, the decision maker is exposed to a higher degree of variability in potential outcomes and hence in expected utility.
These three situations (determinism, uncertainty, and ambiguity) are demonstrated in the hydrometeorological context in Boxes 2.5 through 2.7. The boxes should be read sequentially as they build upon one another. The examples provide an insight into the kinds of considerations that may influence the use or applicability of forecast information. They strive to make clear the danger of a forecast agency supplying probabilistic forecast information without the supporting guidance that went into the forecast (see Chapters 3 and 5).
|
BOX 2.5 Determinism Many retail goods are sensitive to seasonal factors (e.g., snowblowers, seasonal clothing, umbrellas). Consider the example of a retailer located in New York purchasing a stock of winter coats. The retailer has information on how demand for coats has historically varied with the seasonal temperature. He has a fixed budget, and plans to stock two types of coats. The first is a fashion brand whose demand is relatively insensitive to climate, and the second one is a generic brand whose demand is quite responsive to temperature early in the season. Any stock left over at the end of the season is usually liquidated with a higher markdown on the fashion brand than on the generic brand. The storage and hanger space that can be devoted to the coats is also limited. The inputs into the retailer’s decision are budget, storage space, hanger space, unit costs, selling and liquidation prices of each coat, and the equation for the demand for each coat at a specified price as a function of seasonal temperature. The decisions are the number of each type of coat to order, and a system mechanics model is specified by the demand equations and the capacity and budget constraints. The outputs are the numbers of each coat sold during the season and the number liquidated at the end of the season. The utility is the profit derived from the operation as the difference between the total revenue and the total cost (when the potential for catastrophic loss can be ignored, and when factors other than profit are negligible components of value). The decision problem is readily solved mathematically given this information, provided all parameters are known precisely and the forecast temperature for the season is known perfectly. |
Often competing goals lead to the need for weather and climate forecasts that are compatible across different space and time scales. To emphasize this point, Box 2.8 revisits the Folsom Dam example (Box 2.3) and highlights the need for multiscale consistency in seasonal climate forecasts from a user perspective. In addition, this example shows that even when the complexity of the decision process increases dramatically, formal analysis and quantification of forecast probabilities and their uncertainty may be helpful to evaluate competing proposals from multiple agencies and stakeholders, each of whom may have different utilities and catastrophic risk thresholds.
2.3.3
Statistical Decision Theory in Decision-Support Systems: Findings on Uses in Relation to Hydrometeorological Forecasts
Decision-support systems based on statistical decision theory have an analytic basis, are informed by user needs,
|
BOX 2.6 Uncertainty Now consider that the temperature for the upcoming season (as discussed in Box 2.5) is not known with certainty. Rather, its probability distribution is known quite reliably because the temperature records in New York extend back nearly 200 years (and long-term variations are not considered). Since the demand for the fashion brand is not expected to be climate sensitive, the retailer considers his key decision to be the number of utility coats to order given the probability distribution of temperature. Since the demand for coats as a function of temperature is known precisely, the number of coats sold during the season and the number liquidated at the end of the season for each possible value of temperature can be computed. Given the probability of experiencing each temperature, one can also compute the contribution to the expected utility as the product of the probability of that temperature and the net profit from the sale of the corresponding number of coats at the regular and liquidation prices. This process is repeated for each candidate decision level (i.e., number of coats to buy). In other words, the retailer computes the expected utility through an evaluation of the potential profits for each possible temperature weighted by the probability of that temperature. The optimal coat order is the one that maximizes expected utility. Consistent with the discussion in the beginning of this chapter, this is a strategy for long-term or static risk management. If the coat costs and other market conditions do not change from year to year and the probability distribution of temperature is invariant, then under this criterion the retailer would make the same decision each year. The profits realized would vary from year to year but would average to those indicated by his optimal solution based on expected utility. Indeed, the success of the plan is predicated on long-term performance and the ability to average over good and bad years. The last observation points to an apparent flaw in the approach in that the expected utility approach as presented above does not consider the potential of catastrophic loss. Suppose, for instance, that in a given year the temperature is anomalously warm and very few coats are sold, leading to a large loss for the retailer. If the loss is large enough, the retailer may not be able to stay in business. If this low-probability event were to occur early in the sequence of years, the opportunity to achieve maximum expected utility is lost since the retailer is not in business long enough to average across bad and good years. This situation can be addressed in several ways. First, the utility function could be modified to recognize this situation and heavily penalize outcomes that translate into the catastrophic failure of the business. This will lead to a different optimal solution for the coat order but may expose the retailer to lower average profit and may still lead to catastrophic failure with some probability. The severity of the penalty on catastrophic failure reflects the retailer’s risk aversion, which may or may not be easily revealed in practice. Another approach is to add a second decision. This may be a decision to purchase index insurance on temperature. The insurance would require a premium and would pay off a known multiple of the premium if the temperature were to exceed a prescribed value. The decisions now are the number of coats to order and the size of the insurance premium to purchase. Given the probability distribution of temperature, the economic information and the new utility function that includes the profits and the insurance payoffs, the retailer can now determine the optimal decisions as before by maximizing his expected utility over both choices. This approach decomposes the management of catastrophic risk from routine risk and is becoming increasingly popular as a way to manage static risk. |
|
BOX 2.7 Ambiguity Now consider a final modification of this example in which the retailer uses NWS seasonal temperature forecasts. These forecasts are available as tercile probabilities for the region; that is, a probability is attached to each of three possible states of the forecast temperature: above normal, normal, or below normal. When the skill of the forecast is not significant, NWS instead releases the long-term probability distribution of temperature (i.e., the climatological average distribution) in which there is a 0.33 (33 percent) probability for each temperature tercile category. When considering how he might use these forecasts, the retailer has two related questions. First, should he start using the forecast to modify his decision each year instead of using the same decision each year based on the long-term risk analysis using a well-established temperature probability distribution? Second, how does he evaluate the decision for the coming year? At first glance the second decision problem seems straightforward. Instead of using the probability of 0.33 for each category to define the long-term risk, use the published NWS probabilities (e.g., 0.5, 0.3, 0.2) as the characterization of the dynamic temperature risk for the coming season and repeat the analysis of maximum expected utility as in Box 2.6 to determine the optimal coat order for the upcoming season. However, in light of the discussion in Box 2.6, the retailer is quite concerned with catastrophic failure. Unfortunately, the NWS tercile forecast provides no information on low-probability events and cannot address that question. Further, the tercile forecast imposes an arbitrary discretization of the temperature data (i.e., above normal, normal, below normal) that may not match the ranges of temperature over which coat demand is most sensitive. In public meetings organized by NWS to publicize its forecast products, the retailer asks for temperature forecasts with higher temperature resolution (i.e., more categories, or a fitted probability distribution). An NWS scientist comments that, given the number of ensembles it is able to run, NWS does |
|
not believe it can reliably offer information on low-probability events or the full distribution. A private-sector intermediary in the audience mentions that she has come up with an algorithm that takes the NWS tercile forecast and can generate a full temperature probability distribution for it. The retailer wonders whether it would also be possible to estimate the reliability of the forecast probability distribution. The intermediary answers that she could do this if NWS provided estimates of the uncertainty in its forecast tercile probabilities. Indeed, she would like the tercile forecast and its estimated uncertainty for each year instead of average climatology in some years and forecasts in others. She says it would be even better if the raw ensemble data used to compose tercile forecasts were available for all years for which forecasts were made—including retrospective forecasts (hindcasts). With such information she could select the best probability distribution to fit and assess the uncertainty in its parameters. The NWS scientist wonders how the retailer would use this information. Consider its application to the coming season and assume that the forecast probability distribution is now available at the desired temperature resolution, and with minimal uncertainty. The analysis in Box 2.6 can now be repeated under the new (dynamic) risk setting, and the optimal amount of insurance and coats to buy can be evaluated. The retailer’s insurance provider may of course be using the same or other forecast source and could change the premium associated with a particular temperature threshold. Even if the NWS probabilistic temperature forecasts have very low uncertainty, the retailer may wish to evaluate whether a long-term strategy of using the historical temperature probability distribution (i.e. the static risk management strategy) with a fixed order size (assuming nonchanging economics) is inferior to a strategy of using the forecast (dynamic risk management) where the order size could potentially change dramatically from year to year. In addition to the variability in annual profits and cash flow, there may be relationships with the supply chain vendors to consider any transaction costs involved in changing the order size. To address this question, the retailer could apply both strategies over a number of years and evaluate whether, on average, the long-term use of the forecast probabilities and dynamic risk management overcomes the increased transaction costs. Thus, the first assessment the retailer might make is whether a dynamic risk management strategy would actually be superior to a static risk management strategy, assuming that the NWS probability forecasts accurately capture the probability distribution of temperature on a season-by-season basis. This is the approach implied by various documents publicized by NWS and other forecast providers who show seasonal climate forecast probability distributions as a “shift” in the climatological or historical probability distribution. But this approach still does not address the issue of uncertainty in the estimated forecast probability distribution. The uncertainty in the probability distribution of historical temperature in New York is closely related to the length of record used for its estimation. In contrast, the uncertainty in the seasonal forecast may depend on a variety of factors, including the number of ensemble members in each forecast model; the number of models whose forecasts are combined; the number of years over which the model results were tested and the model parameters recalibrated; and how representative the equations, resolution, and numerical accuracy are for the underlying processes modeled. For the sake of illustration, assume that the needed estimate of uncertainty in the probability distribution in the retailer’s decision process is available. The retailer can now revisit the problem as described in Box 2.6 in the following way. The uncertainty in forecast probabilities is represented as the probability of the parameters taking specific values. For example, consider two forecasts—A and B—where both forecasts have the same average but forecast B has higher uncertainty (i.e., it has a higher spread in the tercile probabilities):
Using this information about the uncertainty in the forecast, the retailer can now reevaluate the decisions that maximize his expected utility. The uncertainty distribution for forecast A suggests that there is equal likelihood that the temperature probability distribution could be A.1, A.2, or A.3. The retailer could compute the expected utility for a particular number of coats to order using the three category probabilities given for each of A.1, A.2, and A.3 and then calculate the overall average expected utility using the estimated probability (1/3) for each forecast. The process would be repeated for forecast B. If the utility function is nonlinear, the expected utility from forecast A will not equal the expected utility from forecast B even though the published tercile forecasts are the same (i.e., the uncertainty information as to the probabilities matters). Since most utility functions are asymmetric and nonlinear (i.e., the unit profit realized from liquidation sales and regular sales is quite different), and the uncertainty distribution for the probability forecast is not symmetric (whereas it is symmetric in the example above), the optimal solution considering uncertainty is usually not the same as when only the risk (i.e., the average or “known” probability distribution as in Box 2.6) is considered. This highlights the need for NWS to provide not just the forecast probability distribution but also the background information that allows the uncertainty distribution to be computed by each user in the context of their decision problem and its associated utility functions. |
|
BOX 2.8 Further Analysis of the Folsom Dam Example (Box 2.3): The Need for Multiscale Consistency Consider the decisions to be made by stakeholders in Folsom Dam given a rainfall forecast for Folsom Dam for the next three days (January 31 to February 2) and one for the balance of the wet season from January to May. The outcomes of interest could be (1) whether Sacramento floods, (2) whether the reservoir fails to fill by the end of the May and hence there is a deficit in both energy production and water supply, and (3) how much revenue is generated by water and energy releases between now and May. The inputs could include the rainfall forecast for the two time periods, the watershed conditions over the next three days and the season so that rainfall could be converted to streamflow coming into Folsom Lake, the water and energy demands between January and May, the unit prices of water and energy, the relationships between volume of water in the dam and the rate of outflow during flood conditions, the volume and the surface area, and the surface area and evaporation among other things. The system dynamics model would convert rainfall over the watershed to inflow into the reservoir, water volume in the reservoir and releases to energy and keep track of the mass balance in the reservoir from day to day until May. The decisions to be made are the volume of water to release now in advance in anticipation of a flood in the next three days, the amount of water to release for water supply and energy between now and May. The utility derived from the outcomes may be given by the revenues generated from water and energy supply, less the damages caused by a flood. Generally, additional factors beyond the direct economics of the outcomes may be considered in defining the utility. For instance, there may be specific targets for energy production and if these are missed institutional credibility may be at stake. Similarly, there may be a value assigned to ensuring that flooding is avoided altogether since a variety of emergency preparedness activities that may result in social and individual costs are then avoided. Other goals may pertain to the maintenance of a downstream fishery and ecological habitat through environmental releases from the dam that maintain adequate water quantity and quality downstream, and recreation and fisheries benefits that may be derived from keeping the reservoir at certain target levels. Typically, the decision process might require proposals for the modification of system operation by the reservoir operator, an interest group, or both followed by the evaluation of each proposal through a long-term simulation of the system mechanics model. Such a modification might be a specific formula for advance release that is tied to a weather forecast, or for retaining a prescribed amount of water in storage given current storage and a seasonal climate forecast. The evaluation of each proposal would entail assessing each outcome and the expected utility of interest to each stakeholder group. As in Boxes 2.5 through 2.7, these assessments would need the historical climate probabilities and the probabilistic weather and climate forecasts (and their associated uncertainty distributions). The weather and climate forecasts would need to be compatible in the sense that the conditional forecast probability of January through May seasonal rainfall is correct given the three-day forecast. The forecast compatibility issue is critical for successful application of probabilistic forecasts in these complex decision processes. For example, the historical data for the American River above Sacramento show that if major floods occur in January, there is a high probability that the subsequent wet season will be anomalously dry. This creates a potential double-jeopardy situation for managing the dual objectives of flood control and water/energy production using probabilistic forecasts. If the operator lowers the reservoir storage using an advance release in anticipation of a flood given the three-day rainfall forecast and the rainfall does not materialize in this period because the storm tracked just north or south of the basin, then whether or not the subsequent season is wet or dry becomes critical for meeting the target water demands. The decision to make the advance release would be questioned by the other stakeholders. Indeed, the entire advance release proposal could be abandoned if the simulations over a historical period demonstrated adverse outcomes by using a probabilistic forecast process in which the three-day and seasonal rainfall forecasts individually or collectively led to misinformation. |
and are readily updated and a key building block that will underpin the systematic use of probabilistic hydrometeorological forecasts. This section lists eight findings14 on areas that could profit from further development of such systems and provide NWS with a framework to identify opportunities for action—in partnership with others in the Enterprise as appropriate.
2.3.3.1
A Formal, Analytic Approach Such as Statistical Decision Theory Has Value
Section 2.2 established that many cognitive and emotional factors are involved in decisions and many decisions do not reflect the “rational” outcome of utility maximization. However, a formal, statistical decision theory approach still has value for several reasons. First, in many situations the metrics may be clearly defined, and a corporate structure may decree such analyses as part of a systematized risk management system. In these cases, a decision maker may choose to conform to the decisions indicated by the mandated analytic process and reduce the personal risk involved in
varying from the system. Second, even where the decision process is marked by higher complexity as in the Folsom Dam example (Boxes 2.3 and 2.8), using an analytic process can be useful in making the diverse sources of information, their uncertainty, and the potential outcomes tractable for cognitive processing, particularly if the process leads to an iterative sequence of analysis and discussion. Third, since each user’s utility function and risk preferences are different, it would be more effective to provide (1) a probability forecast, (2) the means to assess the time variation of the forecast’s uncertainty distribution, and (3) the historical forecast data and corresponding observations so that the user can verify the performance in the context of their utility function. The user could then either modify the decision process to include a decision on whether to use the forecast system or, alternatively, use it at times when the indicated uncertainty leads to a superior result.
2.3.3.2
The Decision Problem Is Typically Cast as a Risk Management Problem
Two types of risk are usually considered: (1) the management of the variability of outcomes due to the random nature of process inputs and (2) the management of catastrophic risk. The decision structures to manage these two types of risk are not necessarily the same.
For weather and climate forecast-related risk management, it is important to consider the traditional context of risk management that existed in the absence of formal forecasts. Where physically or economically feasible, users may seek to reduce their exposure to risk in the long run (i.e., static risk). The residual dynamic risk may still be managed using time-varying forecasts, suggesting the need to examine the integrated management of risk across events over multiyear time scales. The examples in Boxes 2.5 to 2.8 highlight that static risk management is used in many cases and provides the context in which available actions and options enabled by information as to dynamic risk have to be evaluated. At longer time scales, uncertainty about climate change as well as uncertainties in physical and socioeconomic factors become large and need to be considered as part of a predictive and monitoring strategy in the context of infrastructural, financial, or other structural decisions made to reduce exposure to long-term risk. Similarly, event or weather predictions require both monitoring and forecast information to be effectively communicated for risk characterization and mitigation. Finally, consistency in forecasts across multiple time scales (weather to seasonal climate) is often needed for dynamic risk management, since many decision problems have multiple targets and time lines.
2.3.3.3
Knowing the Level of Uncertainty in the Available Information Allows the Decision Maker to Assess the Value of Reducing the Uncertainty
There is a cost associated with the generation or acquisition of information to reduce uncertainties. Nonetheless, uncertainty reduction can translate into increased utility for a decision maker through a reduction in the variance (and bias) of realized utility. Thus, if the uncertainty in a particular source of information (e.g., a probabilistic forecast) can be quantified, the decision maker can evaluate the value of additional information in reducing the uncertainty and hence of enhancing the aggregate utility or reducing the risk of exposure to catastrophe. The value of forecasts and the associated uncertainty reduction will vary by user since utilities of outcomes vary by user. In the absence of information about decision consequences and their utilities, a formal quantification of the value of the forecast is not possible.
2.3.3.4
Expected Utility Frameworks Require the Ability to Spread Risk Exposure
The idea of expected utility (and its variants) implies that the user is able to average their exposure to risk in some way, either over time with repeated applications of a forecast or over different operations (e.g., multiple stores, across unrelated assets and operations, or by insuring a wide variety of users who have uncorrelated risk factors). If this is not possible, for instance for a homeowner in the event of an impending hurricane, then the framework is not easy to apply, and the utility of the probabilistic forecast information may be difficult to assess for the homeowner. However, since emergency managers average over the potential outcomes for many homeowners, they could use such a framework with probabilistic content, provided that the necessary information on potential consequences was also available. Indeed, this is one reason why many users may first seek to manage long-term or static risk (e.g., through hurricane insurance in this case) and then manage the residual dynamic risk. The situation is complicated by the presence of multiple actors with varied goals and potentially incommensurate utilities and roles in the decision and implementation process. This also suggests that NWS cooperation with “large users,” who are capable of averaging risk across enterprises, locations, and time, would be beneficial for the development of decision-support systems that can use probabilistic forecasts and readily demonstrate economic and social value from such use. These sectors include water supply, flood and drought hazard management, energy production and management, insurance, environmental regulation and management, transportation, aviation and the travel industry, retail and seasonal goods manufacturing, and construction industries. Collectively, these sectors are a significant contributor to the national economy.
2.3.3.5
Outcomes Depend on Many Factors in Addition to the Hydrometeorological Conditions
Even if the uncertainty in hydrometeorological forecasts is low, the value of such forecasts may also be low if another factor critical to the decision is highly uncertain. A variety of factors will introduce a variety of uncertainties, and not all of these uncertainties will be objectively quantifiable. Consequently, all analyses are conditional upon the vagaries of specific choices of uncertainty quantification, be they objective or subjective.
2.3.3.6
Decision Support Has Value at All Scales of User
Decision-support systems can be valuable for situations where the scale of the user or the application is very small15 or very large and complex.16 Although the production of customized decision-support systems is necessary, either some potential users may be unable to pay to develop or support such systems, or this development may require commitments by many partners to fund and maintain. In the latter case, and given the multiple users and goals in such a coalition of partners, additional processing of the information may be needed to reveal the outcomes, their differential utilities, and the dependence of these outcomes on intermediate variables and various sources of uncertainty in the analysis.
In the context of applying probabilistic hydrometeorological forecasts into decision-support systems, retail, tourism, travel, agricultural supply chain management, insurance, and energy are obvious areas of application. Customized decision-support systems are used for risk management in industries in each of these areas, as are private-sector-generated hydrometeorological forecasts with associated uncertainty information.
The specialized users most likely to adopt decision-support frameworks, and the intermediaries that work with them, are likely to require more detailed information than is currently provided by NWS hydrometeorological forecast products—both in terms of spatial and temporal detail and in terms of the resolution of the probability distributions and their uncertainty. Other public-sector agencies (e.g., the Federal Emergency Management Agency) would need to support such an effort by developing databases on consequences (e.g., assets at risk, costs of relocation, costs of false alert) and committing to the use of the hydrometeorological forecast information with a decision-support system. This mismatch could be reduced if action is taken on the recommendations in Chapters 3 and 5.
2.3.3.7
There Has Been Limited Penetration of Probabilistic Information to User Communities Through Decision-Support Systems
Despite the likely benefits of the use of probabilistic, hydrometeorologically influenced decision-support systems, such systems have achieved limited penetration into user communities. Reasons for this may include the following:
-
a lack of awareness of products that could be available and how to acquire them;
-
the limited format of the forecasts that are issued, including the lack of information as to the uncertainties associated with extreme (catastrophic) events, and to the multiple time scales of interest to the decision maker;
-
the perception of poor skill in forecasts, or the inability to verify the uncertainty (ambiguity) in the forecasts and assess it relative to a baseline;
-
an inability to access historical error/verification information or estimated forecast uncertainty;
-
an assessment that the uncertainty associated with the forecasts is not low enough to justify their use over using climatological probabilities;
-
a formal assessment that the sensitivity of the decisions to weather/seasonal climate is too low to use the information;
-
an assessment that transaction costs or organizational factors outweigh the benefits of managing dynamic risk using forecasts versus maintaining a steady operational policy; and
-
an assessment that the measures taken to reduce long-term climate-related risk have effectively eliminated the need to use routine forecasts (and if so, perhaps there is interest in extreme forecast for event management).
In addition to developing a greater understanding of the relative importance of these factors in limiting the use of probabilistic hydrometeorological forecasts in decision-support systems, the Enterprise will be better positioned to generate and communicate uncertainty information that meets users’ needs through such tools if NWS and its partners explore
-
whether the spatial or temporal resolution of the products leads to a mismatch with NWS products, and if the users have access to intermediaries who can provide bridging products;
-
whether there are vendors who can provide decision-support systems that integrate access to and analysis of NWS products and that satisfy user needs for bundling such products; and
-
whether users perceive potential financial gains through reduced insurance costs or other ways if they implement decision-support systems that promote adaptive short- and long-term management of routine and catastrophic hydrometeorological risk.
2.3.3.8
Public Agencies Tend Not to Consider Hydrometeorological Uncertainty in Their Models Despite Most Environmental Risk Management Being Inherently Multiscale
Public agencies involved in environmental, water, and energy resource management have a variety of modeling and information management tools that use climate information. For example, USACE, Bureau of Reclamation, Departments of Energy and Agriculture, Environmental Protection Agency, Forest Service, and Geological Survey all have freely available models that have climate as a primary driver. For the most part, these models have been developed as simulation tools with the intention of managing long-term climate risk. Consequently, their management applications relate to infrastructure sizing and design for mitigating long-term risk, planning, regulatory and operation rule evaluation and formulation, and assessment of impacts of specific practices on environmental attributes. Some of these models have explicit probabilistic inputs and outputs, whereas others are simulation models whose outputs and inputs could be treated as probabilistic. Most have very limited, if any consideration of probabilistic hydrometeorological forecasts, given that their legacy goes back to the 1950s or 1960s in some cases. In what represents a fundamental shift in management thinking and an opportunity for stronger links between forecast producers and manager-users of forecasts, however, the USACE, the main policy-establishing agency for water resources management through large reservoir facilities in the United States, will now consider reservoir operations based on forecasts.17
Almost all of these agencies recognize the need for characterizing and managing uncertainty as part of their mission. However, often due to legal strictures and sometimes due to inertia, there is limited consideration of factors other than long-term risk because it matches a regulatory purpose. Nonetheless, most environmental risk management problems are inherently multiscale (both temporally and spatially). While most of these agencies have operational responsibilities to ensure long-term performance, they are also responsible for responding to events or operational exigencies that result from the residual dynamic risk. If NWS seeks to enhance applications of its probabilistic products within the public sector, launching joint initiatives to consider a comprehensive approach to environmental risk management driven by probabilistic hydrometeorological products and also by changing landscape and social settings would be an important goal. The second point of NWS engagement with the other federal agencies could be to participate with them in addressing one or two high-profile environmental or agricultural projects where probabilistic seasonal forecasts could have a significant impact. This would provide a concrete example of multiagency proactive efforts to bring science forward to address emerging problems. It would also bring engagement from the academic and other communities interested in tackling complex decision problems through innovation in the decision sciences. In addition, NWS would learn more about what probabilistic products to provide.
In general, as NWS moves forward in its interaction with and support of users of sophisticated decision-support systems, it will need to be cognizant that the use of new forecasts in old decision-support systems tailored for deterministic forecasts may actually degrade the system performance (e.g., Yao and Georgakakos, 2001), unless the underlying decision rules are also modified to account for the uncertainty information and updated.
2.4
GUIDANCE ON IDENTIFYING AND CHARACTERIZING USER NEEDS
This section provides general guidance on how to identify and characterize user needs. It builds on material from the preceding two sections that describes how decision makers interpret and use uncertain information. The complexity of this task—with a large number of interacting factors influencing the effectiveness of different communication formats and their use in forecast-related decisions—puts any precise specification of user needs far beyond the ability of a single committee. (The private sector, for example, spends millions of dollars each year on customer research.) Instead, the committee recommends a process by which NWS can develop an effective system of provider-user interactions that will lead to identification of user needs and the design and testing of effective probabilistic forecast formats.
2.4.1
Problems with Existing Assessments of User Needs
As mentioned previously, NHC collected user data about their cone of uncertainty format of hurricane track forecasts in the aftermath of Hurricane Charley. It requested public comments on the original graphic and two new alternatives on its Web site and asked respondents to vote for their preferred graphic from among the three options. This was not a representative survey of the general population. Because it was conducted online, participation was strongly biased toward those with Internet access and, perhaps more importantly, a preexisting interest in NHC and its Web site. The call for comments was advertised by issuing a Public Information Statement to the media, emergency managers, the private sector, and on the Tropical Prediction Center Web site. Thus, the survey was based entirely on individuals self-motivated to take the survey. This almost certainly produced a highly skewed sample. In addition, no demographic information was collected, making it impossible to determine the representativeness of the sample on even demographic characteristics. These are problems that could have been easily avoided had NWS consulted expertise on survey design and sampling.
TABLE 2.4 Preferences of Respondents as Determined by NHC Reviewers
|
Preference |
Number of Respondents |
|
Option 1 |
540 |
|
Option 2 |
121 |
|
Option 3 |
201 |
|
No preference |
33 |
|
Cannot determine |
67 |
|
Total |
962 |
|
SOURCE: Broad et al. (2006). |
|
Another problem with the NWS survey is its choice of metric by which the appropriateness of a forecast format is being evaluated. Asking people for their preference among alternative displays, especially when one of them is the well-publicized status quo alternative, turns out to be a bad choice. The fact that the majority of respondents (540 out of 962; see Table 2.4) indicated that they preferred the status quo option is not surprising to behavioral scientists.
There are at least two well-established psychological mechanisms that would give rise to this result. The first is the effect of familiarity, and in particular the emotional comfort derived from familiarity, which has been shown to lead to irrational perceptions of lower risk in the context of financial investment decisions that lie at the root of such problematic investment behavior as insufficient diversification (Huberman, 2001; Weber et al., 2005). Another mechanism is loss aversion (i.e., the fact that people’s disutility when giving things up is greater than their utility when acquiring the same things) and the status quo bias it has been demonstrated to lead to (Samuelson and Zeckhauser, 1988; Johnson and Goldstein, 2003). Anecdotal evidence for the operation of the familiarity and status quo bias comes from the open-ended responses to the NHC question: “Those of us that have lived in the path of these storms are familiar with, and used to, the way you have been clearly warning us and informing us. Please do not let a few people, who may not have been paying attention, cause you to change your system unless you believe … know … that you have a better system.”
2.4.2
One Size Does Not Fit All
The population of NWS forecast product users is diverse. One cannot talk to just a subset of users and assume knowledge gained accurately represents the range of user needs. Even within a class of user (e.g., “emergency manager,” “public”), there is a lot of diversity in capacity, constraints, and information needs and desires. A specific user’s needs may also change across situations (e.g., emergency managers may need different information about future rainfall when there has recently been flooding than when it has been dry, and they may need different information during the day than at night). Furthermore, the situation is also not static: users’ needs evolve as their decision context, level of knowledge, or information capabilities change. So one size certainly does not fit all, and even well-characterized user needs will need to be revisited. This suggests that understanding user needs is a large and evolving task, but one that is critical to successful provision of uncertainty information for the nation’s benefit. Fortunately, entities within the private sector and academia have experience in characterizing user needs and would be valuable partners in this Enterprise-wide endeavor.
Information about the wide variety of user needs for uncertainty information is also available in previous NRC reports, which find that the value or usefulness of forecast uncertainty information depends on users’ capacity to take action to help them change, or at least cope with, the future. For example, NRC noted in A Vision for the National Weather Service: Road Map for the Future (1999b) that the Enterprise must think less about information “in terms of what it is about” and more in terms of “how it will be used.” In Making Climate Forecasts Matter (1999c), NRC also noted the importance of user informational needs, situational factors (e.g., social, economic, environmental), and coping strategies. For instance, does a user have alternatives or contingency plans that can be implemented? In other words, it is important not simply to provide uncertainty information, but to communicate uncertainty information in a way that can actually help users solve a problem or improve their situation.
It is tempting to think that one way of dealing with heterogeneous user needs is to provide everyone with all available information, with the assumption that unnecessary information will simply be ignored. Unfortunately this is not a viable strategy. Unnecessary information can delay or complicate action, with great costs in situations of time pressure and high stakes. Such information can also be misinterpreted, as in the case of the “skinny black middle line” in the cone of uncertainty (Figure 1.6). When people misunderstand the information, they tend to make worse decisions. Finally, too much information packed into a graphic is often confusing (Tufte, 2001) and poorly designed or produced visuals are worse than no visual at all (Hager and Scheiber, 1997). There is a difference between the provision of too much information to users and the generation of information that could be provided to users. The potential availability of a wide range of different forecast information helps to ensure that the best information for a particular user group is available.
Finding: The utility of a forecast has many user-specific and contextual constraints. Consequently, it is valuable to approach questions of forecast utility in a structured manner. Basic principles of relevance will need to be applied, such as disclosure of all the information available, disclosure of sources, and truthfulness in reporting. In the spirit of openness, transparency, and disclosure, it will also be useful to consider ways to make multiple forms of presentation avail-
able to all, and to accompany them with a menu of recommendations for use by different user groups and situations.
Recommendation 2.3: The utility of any forecast uncertainty product should be evaluated within the individual, social, and institutional contexts of the recipient. What to include and not include should in part be a function of the intended user and their ability to handle different sorts of information. Those developing risk communication products should consider a set of basic questions:
-
Who, specifically, are your intended users? Are they other scientists and meteorologists? The public? Particularly vulnerable populations? Particular economic sectors? Local, state, or national officials? Each user may need a specifically tailored product.
-
What information does the user want? This may be quite different from the information currently provided. Not giving the user the information they want can be dangerous. If people do not find the information they are looking for in a graph or in some risk communication, they might misinterpret other information for what they are looking for.
-
What information do the users need to make informed decisions, whether they realize it or not? Do they really, for example, need to understand the uncertainty in hurricane track forecasts? Is this more important than other information (e.g., projected wind speeds, storm surge, flooding risks)?
-
Does the information provide enough detail for its intended users to assess their risk exposure and plan action (Fischhoff, 1994)? In the case of hurricanes, for example, some individuals and areas are more vulnerable to storm surge (e.g., coastlines), others to wind speed (e.g., trailer parks), while others are more vulnerable to the loss of electricity (e.g., elderly who rely on refrigerated medication). Merely knowing the likelihood that a hurricane might strike a particular area does not provide the more specific information people need to consider when assessing the risks and choosing a course of action.
-
What other information is the intended user currently using to make decisions? Will the new product provide something new and useful, will it simply repeat other information, or worse, will it provide distracting or contradictory information and lead to more confusion and flawed decision making?
-
Does the intended user operate decision-support tools based on statistical decision theory and need detailed information on the uncertainties associated with probabilistic forecasts? Mechanisms may be needed for providing this information, either through ensembles and historical verification information, or through a Bayesian estimation process that properly considers the multiple sources of uncertainty in the forecast and generates an appropriate uncertainty distribution.
2.4.3
Engaging the Social and Behavioral Sciences
The discussions in the preceding sections indicate that social and behavioral science expertise is needed at several levels and for several tasks within NOAA. Although it may be possible to outsource many of these tasks and/or to commission the research18 and testing of products necessary for the design of successful probabilistic forecast products, it may be less expensive and more effective (in terms of organizational emphasis and carry-over from task to task and product to product) to also acquire in-house social and behavioral science expertise. This would be beneficial not only to NOAA but to the behavioral decision community as well. Decision making under hydrometeorological uncertainty is an area where theory and empirical insights have obvious and immediate implications, and it is quite surprising that there has not been more work in this area of application compared to, for example, medical decision making.
Finding: Social and behavioral science expertise will help NOAA identify and solve possible user confusions and misinterpretations of both existing and future (probabilistic) forecasting products. These scientists would also support better processes in the design and evaluation of forecasts.
Recommendation 2.4: NOAA should acquire social and behavioral science expertise including psychologists trained in human cognition and human factors, with training in behavioral decision theory, statistical decision theory, survey design and sampling, and communication theory, with special focus on graphics and product development.
SUMMARY
This chapter provides guidance on how to identify and characterize needs for uncertainty information among various users of forecasts. To do so, it first discusses the different types of forecast users and general user needs for uncertainty information, along with several examples of specific users’ needs. Because users’ information needs derive largely from their use of that information in decision making, the chapter then reviews how decision makers interpret and use uncertain information, from two related perspectives. The descriptive perspective of psychology provides insights about the cognitive and affective processes involved when people make intuitive decisions that involve uncertainty. The prescriptive perspective of statistical decision theory provides insights into how uncertain information is used in analytic decision-making processes, and it supports the explicit incorporation of uncertain information into decisions through decision-
support systems. This review of background knowledge is provided both to help NWS and the Enterprise understand key relevant concepts in decision making under uncertainty and to support recommendations on how to identify and characterize users’ needs for uncertainty information. The final section of the chapter discusses how NWS and the Enterprise might apply this knowledge to better understand users’ needs for uncertainty information.
The psychological perspective indicates that there is a variety of ways in which people use prior personal experience, available forecasts, and other sources of information to decide on an appropriate action in a given situation. How people make decisions depends on their abilities, training, and personality, the question to be answered, and the information available. This complexity makes it clear that NWS cannot provide a single forecast product that would satisfy all users. Instead, the committee recommends designing a variety of methods to present and distribute uncertainty information, as a function of type of users and type of decisions. Determining which presentation formats best provide different users with the information they need will require effective, frequent NWS-user-Enterprise interactions and a sustained, coherent social and behavioral science research effort. The prescriptive perspective provides a framework for NWS and the broader Enterprise to identify users and application areas that are most likely to benefit from uncertainty information.
The detailed recommendations in this chapter (along with those in Chapter 4) point NWS and the broader Enterprise toward a process that will help them generate precise questions about various users’ needs for uncertainty information and reliable and valid answers. If implemented, this process will help NWS address users’ needs for uncertainty information into the future as users’ needs, forecasting capabilities, and technologies evolve.


