
2
The Scientific Background
2.1
RADIO ASTRONOMY
The discovery of radio emission from celestial objects was made by Karl Jansky of the Bell Telephone Laboratories in 1932 as a by-product of studies of system and thermal noise in radiocommunication systems. Since this initial discovery, radio astronomers have made many important discoveries, including several recognized by the awarding of Nobel Prizes (Box 2.1). The science of radio astronomy has grown remarkably, becoming a major tool of modern astronomy and astrophysics.1
Many scientifically important parts of the spectrum have been protected for astronomical research. With the discovery of new astronomical objects and the development of better equipment and techniques, radio astronomers regularly use frequencies from the lowest allocated radio astronomy band at 13.36-13.41 MHz to frequencies above 1000 GHz. However, much needs to be done to protect the current allocations and to meet the needs of modern research. Following are areas of particular importance:
-
Many of the currently allocated bands have insufficient bandwidths. Originally, given the technology available to radio astronomy, bandwidths of approximately 1 percent of the center frequency were adequate. With modern technology, more bandwidth is essential for high-sensitivity measure-
|
BOX 2.1 Nobel Prizes Awarded for Contributions Made by Radio Astronomers 2006—John C. Mather and George F. Smoot for their discovery of the blackbody form and anisotropy of the cosmic microwave background radiation which trace the fluctuations responsible for all the structures seen in the universe. 1993—Russell Alan Hulse and Joseph Hooton Taylor, Jr., for the discovery of a new type of pulsar, a discovery that has opened up new possibilities for the study of gravitation. 1978—Arno Allan Penzias and Robert Woodrow Wilson for their discovery of cosmic microwave background radiation. 1974—Sir Martin Ryle and Antony Hewish for their pioneering research in radio astrophysics: Ryle for his observations and inventions, in particular of the aperture synthesis technique, and Hewish for his decisive role in the discovery of pulsars. |
-
ments, which depend on averaging for noise reduction.2 The Doppler shift of spectral lines that is due to the expansion of the universe also necessitates going outside of these allocated bands.
-
Most bands are shared with active services. Obvious strong signals of terrestrial origin can often be excised from collected data, but weak signals defy editing and may therefore by more pernicious, contaminating long-term wideband averages without being apparent in individual data.
-
The radio astronomy bands are not adequately protected from transmissions in adjacent bands. This is particularly a problem with orbiting transmitters, because their modulation techniques are often inefficient and terrain around observatories does not provide shielding.
-
Some allocations apply to limited areas of the world, providing no protection at all in other areas.
-
There are large intervals between some of the allocated bands. In order to determine the spectral distribution of radio source emission, bands were assigned to radio astronomy at approximately octave intervals.
The frequency range of radio astronomy observations now extends above 3 THz (with measurement of the 3438 GHz transition of 13CO and the detection of the 13→12 transition of CO at 1497 GHz), blurring the distinction between radio astronomy and infrared astronomy. With the advent of Earth-to-space telecommunications near 1 µm wavelength (300 THz) and the need to regulate for avoiding interference with optical observatories, the distinction between different kinds of astronomy will eventually vanish from the regulatory perspective. Use of the radio spectrum for communications and other commercial purposes developed first at the lower frequencies (longer wavelengths) because the technol-
ogy required is generally simpler and less expensive. However, during the past several decades, continuing improvements in technology have allowed the extension of use to millimeter and shorter wave-lengths (higher frequencies). Hence, the longer wavelengths were filled up first, and only now are commercial interests beginning to move to millimeter wavelengths. Interference has always been a serious issue at the long wavelengths, but the problem is moving to shorter wavelengths as these become used more extensively.
2.1.1
The Radio Spectrum
Radio emissions arise under conditions that are different from those which produce visible radiation. The light waves studied by optical astronomers originate from such objects as stars and circumstellar nebulae. Celestial radio waves, however, come from diverse environments, including the primordial fireball of the big bang, the cold gas between the stars, electrons spiraling in the magnetospheres of neutron stars, and relativistic jets from black holes. Radio astronomy is also sensitive to processes at work in the universe that are not accessible to observations at other wavelengths, and the study of the universe at radio wavelengths often reveals new classes of objects. Moreover, the study by radio astronomers of the same celestial objects that optical astronomers study provides fresh insights into the physical processes that are not probed at other wavelengths.
Astronomical studies provide a laboratory in which matter can be seen over a wide range of physical conditions, the extremes of which cannot now or in the foreseeable future be reproduced on Earth. Extremes of density, temperature, pressure, and unusual chemical compositions can all be found at various places in the universe and are under close study by astronomers.
2.1.2
Types of Radio Emission
The spectrum of the celestial radio waves reaching the surface of Earth contains a broad continuum that covers the whole range of frequencies that can penetrate Earth’s atmosphere, together with a large number of atomic and molecular spectral lines, each of which is confined to a narrow frequency range.
2.1.2.1
Radio Continuum
The discovery of radio sources and the bulk of current knowledge about their nature and distribution and about the processes responsible for the radio emission from them have come through observations of the continuum radiation. Continuum observations consider the broad variation of emission with frequency (see Figures 2.1 and 2.2). Individual measurements are made with broadband detectors that span tens to hundreds of megahertz and are therefore sensitive to interference over a large range of frequencies, from meter to millimeter wavelengths (tens of hertz to hundreds of gigahertz). The radio continuum arises from three principal mechanisms, all of which have major application in the study of astronomical objects:
-
Blackbody radiation emitted by all objects according to their physical temperature,
-
Free-free emission produced in an ionized gas of freely colliding electrons and protons with an intensity proportional to the temperature of the electrons, and
-
Nonthermal emission mostly produced by the synchrotron process, in which very high speed electrons spiral around magnetic-field lines. This mechanism is found in the disks of normal galaxies, in
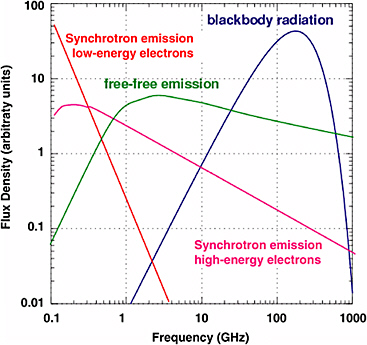
FIGURE 2.1 Continuum spectra produced by various emission mechanisms.
-
the remnants of supernova explosions, and in unusual types of galaxies known as radio galaxies and quasars.
Observations of continuum intensity determine the characteristic spectra of sources, but because the distribution of continuum radiation with frequency is relatively smooth, observations of this kind do not need to be made at specific or closely adjacent frequencies. Radio-frequency bands spaced at intervals of about an octave of the spectrum are normally satisfactory.3 The spectrum (strength) of continuum
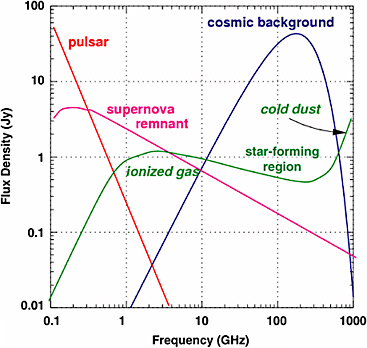
FIGURE 2.2 Spectra of typical continuum radio sources. The flux levels shown correspond to the strongest known sources. A jansky (Jy) is 10−26 W m−2 Hz−1.
radiation varies only slowly with frequency, so one can use a wide receiver bandwidth and obtain the same signal level across the band. Using a wide signal bandwidth allows high sensitivity to be obtained because the Gaussian noise is averaged down more efficiently. The signal-to-noise ratio obtained is proportional to the square root of the bandwidth. Bandwidths of some hundreds of megahertz or more are commonly used for single antennas, arrays such as the Very Large Array (VLA), and very long baseline interferometry (VLBI). Also, the radio emission from very distant sources such as quasars and radio galaxies is generated largely by the synchrotron mechanism, which does not give rise to radio lines (i.e., it is over a continuum of frequencies).
VLBI relies heavily on the continuum bands, and, in general, observations of the most distant radio sources made by any radio astronomy instruments depend on continuum radiation. Observations of
spectral lines, however, are only possible in physical conditions that allow the existence of atoms or molecules, mainly the interstellar medium and the outer envelopes of stars.
Continuum bands, particularly those at frequencies below 3 GHz, are also valuable for the study of pulsars (see § 3.2.6).
2.1.2.2
Spectral Lines
Spectral line radiation is emitted when an atom or molecule changes energy levels. The radiation is emitted at a specific frequency and thus results in a line in the radio spectrum (Figure 2.3). Radio techniques allow spectral lines to be observed with very high frequency resolution that cannot be attained by techniques commonly employed at other wavelengths. As a consequence, many experiments, including the fundamental detection of new molecular species, can only be carried out in the radio part of the spectrum.
Each type of atom and molecule has its own unique set of spectral lines. The radio spectral lines of atoms arise from hyperfine transitions or electron recombination. One of the most fundamental and widely observed lines occurs at 1420 MHz; it arises from neutral (nonionized) atomic hydrogen. Studies of this line provide an important tracer of the most abundant element in the universe within the interstellar clouds in the Milky Way and other galaxies. Molecular lines typically come from changes in the
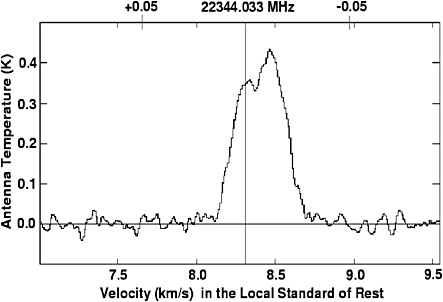
FIGURE 2.3 Spectral line emission from the molecule CCS in molecular cloud B335. From T. Velusamy, T.B.H. Kuiper, and W.D. Langer, “CCS Observations of the Protostellar Envelope of B335,” Astrophysical Journal, Vol. 451, pp. L75-L78, 1995. Courtesy of the authors.
rotational energy of the molecule. Studies of the abundant carbon monoxide (CO) molecule at 115, 230, and 345 GHz provide fundamental information about the nature and distribution of the densest forms of the interstellar medium.
Many spectral lines from a variety of atomic species and from a large number of molecules have been found in interstellar space and in the atmospheres of stars, planets, and comets. The explosion in the discovery of new species has led to the development of a new and exciting branch of astronomy: astrochemistry. The study of astrochemistry emphasizes the synthesis of interstellar molecules and the evolution of dense interstellar gas, including its role in the formation of stars and later stages of the lives of stars. Since planets form as a by-product of star formation, knowledge of interstellar chemistry and the origins of molecular species is vital to an understanding of the early planetary chemistry and the origin of life. Spectral lines from over a hundred different molecules have now been detected in interstellar clouds (Table 2.1). Many of these are quite complex organic molecules, which raises questions about how far interstellar chemical evolution progresses toward creating the chemical precursors of life and how widespread the phenomenon of life might be in the universe.
With a better understanding of interstellar chemical evolution, it has also become possible to use the relative strengths of lines of certain molecules to determine the physical and chemical conditions in interstellar clouds and circumstellar envelopes. Thus, some specific molecular lines have proved to be exceptionally valuable diagnostic tools that require special attention. Appendixes C and D in this handbook respectively list the spectral lines below and above 300 GHz considered by the International Astronomical Union (IAU) to be the ones most important to astronomy (as of 2005) and, if they lie in an allocated band, their protection status is listed. In addition to the value of some molecular lines as diagnostic tools, since molecular transitions occur throughout the electromagnetic spectrum, observations of transitions of interstellar molecules at all frequencies improve our understanding of the physical nature and composition of the interstellar medium. For this reason, it is important that all spectrum users take all practical steps to minimize pollution of the spectrum with unnecessary emissions.
Observing spectral lines also allows astronomers to study kinematics and to determine distance from the shifting of the lines due to the Doppler shifts of the line centers arising from relative motion of the emitter and observer. In addition, the width of the lines provides important information about the physical conditions in and surrounding the emitting source and about motions within the source.
2.1.3
Sources of Radio Emission
Some of the sources of radio waves are believed to be at the farthest limits of the known universe. Because these sources are so far away, the radio waves have been traveling for many billions of years and thus provide information about the condition of the universe a very long time ago (see Figure 2.4).
The evolution of tiny fluctuations in the density of the universe into galaxies and clusters of galaxies is one of the most exciting research areas in modern astrophysics. The existence of the density fluctuations was revealed by NASA’s Cosmic Background Explorer (COBE) mission and imaged by its Wilkinson Microwave Anisotropy Probe (WMAP) mission (see Figure 2.5), both satellites operating at radio frequencies. While the WMAP results are from a space mission, ground-based and balloonborne cosmic microwave background (CMB) experiments continue to play vital roles in the study of the small-scale structure of the CMB and its polarization. Radio astronomy serves as the best way to study the CMB, which has yielded a remarkable picture of the initial evolution of the universe (see Figure 2.6).
Studies are just beginning of the epoch of re-ionization (EoR), during which radiation from the first generation of stars and galaxies (re)ionized the universe (see Figure 2.7). Observations of neutral
TABLE 2.1 Astrophysical Molecules, Grouped by Number of Atoms, Found in Interstellar Clouds of Various Sorts
|
Number of Atomsa |
|||||||||||
|
2 |
3 |
4 |
5 |
6 |
7 |
8 |
9 |
10 |
11 |
12 |
13 |
|
H2 |
C3 |
c-C3H |
C5 |
C5H |
H6C |
CH3C3N |
CH3C4H |
CH3C5N? |
HC9N |
CH3OC2H5 |
HC11N |
|
A lF |
C2H |
l-C3H |
C4H |
l-H2C4 |
CH2CHCN |
HCOOCH3 |
CH3CH2CN |
(CH3)2CO |
|
|
|
|
AlCl |
C2O |
C3N |
C4Si |
C2H4 |
CH3C2H |
CH3COOH? |
(CH3)2O |
NH2CH2COOH? |
|
|
|
|
C2 |
C2S |
C3O |
l-C3H2 |
CH3CN |
HC5N |
C7H |
CH3CH2OH |
CH3CH2CHO |
|
|
|
|
CH |
CH2 |
C3S |
c-C3H2 |
CH3NC |
HCOCH3 |
H2C6 |
HC7N |
|
|
|
|
|
CH+ |
HCN |
C2H2 |
CH2CN |
CH3OH |
NH2CH3 |
CH2OHCHO |
C8H |
|
|
|
|
|
CN |
HCO |
CH2D+? |
CH4 |
CH3SH |
c-C2H4O |
CH2CHCHO |
|
|
|
|
|
|
CO |
HCO+ |
HC3N |
HC3NH+ |
CH2CHOH |
|
|
|
|
|
|
|
|
CO+ |
HCS+ |
HCNH+ |
HC2NC |
HC2CHO |
|
|
|
|
|
|
|
|
CP |
HOC+ |
HNCO |
HCOOH |
NH2CHO |
|
|
|
|
|
|
|
|
CSi |
H2O |
HNCS |
H2CHN |
C5N |
|
|
|
|
|
|
|
|
HCl |
H2S |
HOCO+ |
H2C2O |
HC4N |
|
|
|
|
|
|
|
|
KCl |
HNC |
H2CO |
H2NCN |
|
|
|
|
|
|
|
|
|
NH |
HNO |
H2CN |
HNC3 |
|
|
|
|
|
|
|
|
|
NO |
MgCN |
H2CS |
SiH4 |
|
|
|
|
|
|
|
|
|
NS |
MgNC |
H3O+ |
H2COH+ |
|
|
|
|
|
|
|
|
|
NaCl |
N2H+ |
NH3 |
|
|
|
|
|
|
|
|
|
|
OH |
N2O |
SiC3 |
|
|
|
|
|
|
|
|
|
|
PN |
NaCN |
C4 |
|
|
|
|
|
|
|
|
|
|
SO |
OCS |
|
|
|
|
|
|
|
|
|
|
|
SO+ |
SO2 |
|
|
|
|
|
|
|
|
|
|
|
SiN |
c-SiC2 |
|
|
|
|
|
|
|
|
|
|
|
SiO |
CO2 |
|
|
|
|
|
|
|
|
|
|
|
SiS |
NH2 |
|
|
|
|
|
|
|
|
|
|
|
CS |
H3+ |
|
|
|
|
|
|
|
|
|
|
|
HF |
SiCN |
|
|
|
|
|
|
|
|
|
|
|
SH |
AlNC |
|
|
|
|
|
|
|
|
|
|
|
FeO(?) |
SiNC |
|
|
|
|
|
|
|
|
|
|
|
NOTE: Molecules in boldface type have been found in Comet 1995 O1 Hale-Bopp. H2O+ and C2H6 are seen in the comet, but not in interstellar clouds. The latest data can be obtained from Dr. Alwyn Wootten, National Radio Astronomy Observatory, http://www.cv.nrao.edu/~awootten/; accessed March 1, 2006. aA lower-case “c” indicates a cyclic structure; a lower-case “l,” a linear structure; and a “?,” a tentative identification. |
|||||||||||
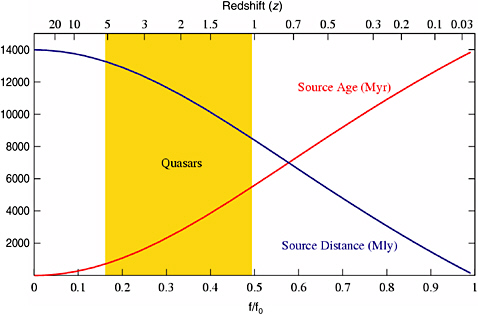
FIGURE 2.4 The distance and age of radio sources as a function of Doppler shift due to the expansion of the universe (logarithmic scales). The parameter z is known as the redshift. Myr, million years; Mly, million light-years.
hydrogen (HI) at redshifts of z = 6 to 15 (88-200 MHz) will probe the EoR. Indeed, HI may be observable in absorption against the cosmic background radiation itself at a redshift of z = 30 (45 MHz).
The history of the clustering of galaxies in the universe can be studied by surveys/observations of the Sunyaev-Zel’dovich (SZ) effect. The ionized gas that collects in the central region of a cluster of galaxies scatters the cosmic background radiation, producing a depression in the intensity of the background radiation at the location of the cluster. The radio data can be combined with x-ray observations to yield the redshift of the cluster. Large SZ surveys will trace the history of clustering of galaxies from early epochs. These surveys are conducted at millimeter wavelengths.
A new class of objects, submillimeter galaxies, is thought to represent galaxies in the earliest stages of evolution. The discovery of these objects has been one of the key developments of recent years. The emission from submillimeter galaxies arises from dense gas and dust heated by newly formed stars in the system. Because this emission is intrinsically bright and because, for objects at great distances, it is redshifted from the far-infrared into the submillimeter/millimeter band, these objects can be detected to great distances. At this time, submillimeter galaxies have been detected out to a redshift greater than 6, and modern instruments under construction will be able to see them at even greater distances, out to redshifts of z ~ 10. By studying objects at different distances, then, it is possible to view the evolutionary history of the development of galaxies and the star formation that occurs within them. Supermassive
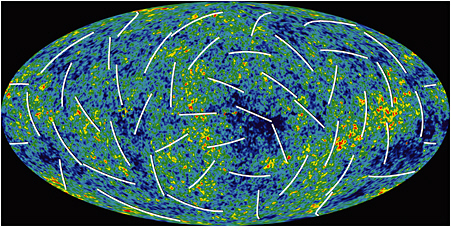
FIGURE 2.5 The microwave sky. The Wilkinson Microwave Anisotropy Probe (WMAP) has produced a new, more detailed picture of the infant universe. Colors indicate “warmer” (red) and “cooler” (blue) spots. The white bars show the “polarization” direction of the oldest light. This new information helps to pinpoint when the first stars formed and provides new clues about events that transpired in the first trillionth of a second of the universe. Courtesy of the NASA/WMAP Science Team.
The panel notes that the WMAP radiometers operated in five frequency bands, at 23, 33, 41, 61, and 94 GHz. Except for the highest band, these frequencies do not fall within Radio Astronomy Service bands; furthermore, the satellite was located at the L2 point (second Lagrange point) and had shielding to protect against radiation from the direction of the Sun and Earth.
nuclear black holes are believed to be ubiquitous in nearby, normal galaxies and a natural part of massive galaxy formation.
The most powerful radio sources known are quasars, which are distant, compact objects that emit radio energy at a prodigious rate. A quasar resides in the nucleus of its host galaxy, and the optical emission from the quasar exceeds the total starlight in the host galaxy. As a result, the host galaxy is difficult to observe at these wavelengths. The most distant quasars have been detected with z beyond 5 (f/f0 = 0.17 to 0.2; see Figure 2.4). The study of quasars involves fundamental physics, in the continuing attempt to understand their sources of energy. The nuclei of some other classes of galaxies show great activity and unusual energy production. Even the nucleus of our own Galaxy is a small-scale version of an active nucleus and can best be studied by radio methods. It is becoming increasingly evident that these galactic nuclei, including those of our own Galaxy, are powered by black holes.
Many distant galaxies are unusually strong continuum emitters of radio waves but are relatively faint when viewed with an optical telescope. These radio galaxies are the subject of many investigations attempting to discover the source of their radio energy and the circumstances of the explosive events that seem to have occurred in many of them.
Studies of galaxies depend heavily on observations of spectral lines at radio wavelengths. These observations provide information on the kinematics of the gas in the galaxies and on the nature of the star-forming interstellar medium within them. The 21 cm HI line and the millimeter-wave CO lines are typically used to trace the atomic and molecular phases of the interstellar medium in galaxies. The 21 cm
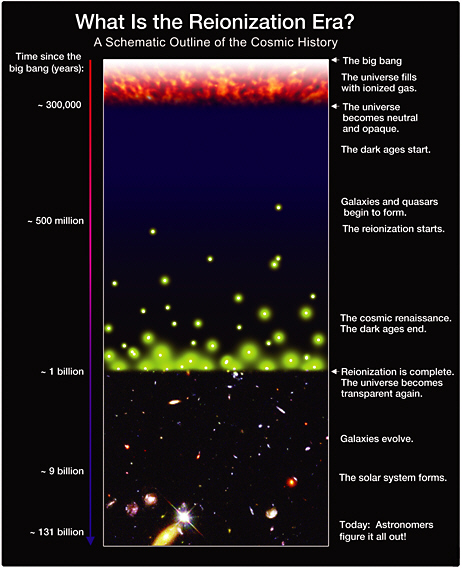
FIGURE 2.6 The history of the universe, the earliest epoch based in part on the Wilkinson Microwave Anisotropy Probe image of the cosmic background fluctuations that illustrate the “tiny density fluctuations.” Courtesy of S.G. Djorgovski et al. and Digital Media Center, California Institute of Technology.
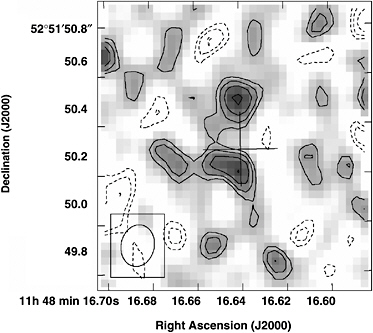
FIGURE 2.7 A Very Large Array image of CO (J = 3 − 2) emission in Sloan Digital Sky Survey (SDSS) J1148, showing the (possible) merger of two galaxies at a redshift of z = 6.4, in the epoch of reionization (see F. Walter, C. Carilli, F. Bertoldi, K. Menten, P. Cox, K.Y. Lo, X. Fan, and M.A. Strauss, “Resolved Molecular Gas in a Quasar Host Galaxy at Redshift z = 6.42,” The Astrophysical Journal, Vol. 615, Pt. 2, pp. L17-L20, 2004; the rest frame emission frequency is 345 GHz, but the observations were made at 345/7.4 = 47 GHz). Courtesy of Chris Carilli, National Radio Astronomy Observatory, and Fabian Walter, Max Planck Institute for Astronomy.
HI line has also been extensively used to learn about the gravitational potential of the galaxies; this work led to the realization that a substantial fraction of the masses of galaxies is made up of material that is not visible. The “dark matter” that is implied by these observations and confirmed through other observational tests, such as the study of the cosmic microwave background, is one of the most important areas of research in modern astrophysics. For galaxies that are gas-rich and optically faint (or even optically “dark,” i.e., containing too few stars to be seen), the measurement of the 21 cm HI line gives an accurate measure of the distance, thereby allowing a unique but important view of local large-scale structure (e.g., see Figure 2.8). HI also traces the debris remnants of tidal encounters among galaxies. Ongoing and future experiments will conduct these observations at lower frequencies and thus higher redshifts, allowing us to explore how the gas content of galaxies varies not only across space but also over cosmic time.
Our own Milky Way Galaxy is difficult to observe at optical wavelengths, since these wavelengths of light are blocked by clouds of interstellar dust. Radio waves, however, can penetrate these clouds and
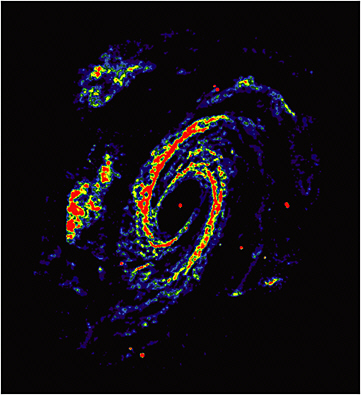
FIGURE 2.8 Very Large Array image of galaxy M81, a spiral galaxy about 11 million light-years from Earth and about 50,000 light-years across. The image was made using data taken over more than 60 hours of observing time. The spiral structure is clearly evident in this image, which shows the relative intensity of emission from neutral atomic hydrogen gas. In this pseudocolor image, red indicates strong radio emission and blue, weaker emission. Courtesy of National Radio Astronomy Observatory/Associated Universities, Inc.
allow astronomers to obtain a view of the entire Galaxy. Studies of the location and composition of interstellar clouds using radio observations provide fundamental information about the structure and evolution of the Galaxy that could not be obtained by other means.
Radio astronomy has also provided new information about the early and late stages of the lives of stars, stages that are important in the evolutionary process but that are not well understood. Strong and localized sources of radiation in spectral lines of the hydroxyl, water, and silicon monoxide molecules are found in the shells of objects that appear to be in the process of becoming stars. Some compact sources of thermal continuum radiation, which are embedded in dense clouds of dust, also seem to be protostellar objects. Recently, giant breeding grounds of massive new stars, and dark clouds where stars similar to the Sun are born, have been detected. Millimeter and submillimeter radio telescopes and interferometers are leading astronomers to a new era in the understanding of the star-formation process.
At the other end of the stellar life cycle, radio astronomers study the circumstellar envelopes of evolved, post-main-sequence stars, which shed material into the interstellar medium during the latter stages of their evolution. The most massive stars eject material in a supernova explosion at the end of their lives as stars. The supernova remnants that are left behind by this process may also be studied. Finally, radio astronomers have also discovered numerous very dense and compact neutron stars, which are the remnants of supernova explosions. A rapidly rotating neutron star often is observed as a pulsar, a periodic radio source, which emits a narrow beam of coherent radiation as the neutron star rotates. Pulsars have a period that ranges from on the order of a millisecond to many seconds. Therefore, they provide exquisite time resolution, are excellent clocks, and may prove to be the best time standards on some scales. Pulsars permit the study of the fundamental physics effects of general relativity.
In the solar system, the Sun has always been an important object for study by radio astronomers. Radio astronomy complements optical astronomy for study of the Sun. Observations of coronal mass ejections are of particular importance to “space weather” studies. The slowly varying component of solar radio emission has been found to provide one of the best indicators of the variation of solar activity over the Sun’s 11-year cycle. In addition, the intense and rapid bursts of solar radio emission are providing greater understanding of what happens on the Sun during active periods and the way the Sun influences events in Earth’s atmosphere, near-Earth space, and other portions of the solar system.
Comets are objects in the solar system that are thought to contain the most pristine material remaining from the origin of the solar system. As comets pass near the Sun, the volatile ices in the comet are sublimated; the gas that is produced flows out from the nucleus to form the comet’s coma. Radio observations of this material provide the best way to measure the detailed molecular composition of the cometary ices and allow new insights into the composition of the protosolar cloud that formed the Sun and planets.
Finally, radio observations of the planets provide new information that cannot be achieved by other techniques. For example, the planet Jupiter produces frequent bursts of radio waves; their study by radio astronomers first determined the rotation period of the planet’s core and showed the coupling between Jupiter’s magnetosphere and the satellite Io. This has been confirmed and extended by measurements in the vicinity of Jupiter from the Pioneer and Voyager spacecraft. Radio measurements of the deep atmospheres of Venus and the outer planets provide the only means to probe these regions remotely and inform models of planetary formation. Millimeter-wave spectroscopic measurements of the upper atmospheres of Venus, Mars, and Saturn’s satellite Titan provide some of the best information on the atmospheric photochemistry and circulation that is available. As illustrated in Figure 2.9, ground-based radio observations complement optical observations in providing the long-term monitoring necessary to study the seasonal cycles on Titan.
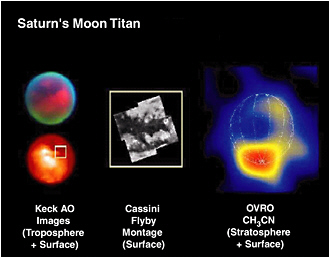
FIGURE 2.9 Left: Ground-based K-band Keck Observatory adaptive optics (AO) images of the leading and trailing hemispheres of Saturn’s moon Titan. The color stretch in the image at the top highlights troposphere haze (blue) and polar clouds (green). Middle: Cassini high-resolution montage of the Fensal-Aztlan region of Titan from the September 7, 2005, flyby. Right: Owens Valley Radio Observatory (OVRO) 0.9 arcsec image of the acetonitrile emission from the southern polar stratosphere and upper troposphere. Only long-term monitoring with ground-based radio, millimeter, and submillimeter observatories and optical and infrared facilities can provide the very long baselines needed to study the seasonal cycles of this moon. Courtesy of Antonin Bouchez, W.M. Keck Observatory (left); NASA/Jet Propulsion Laboratory-California Institute of Technology (middle); and Mark A. Gurwell, Harvard-Smithsonian Center for Astrophysics/Owens Valley Radio Observatory (right).
2.1.4
Radar Astronomy
While astronomy is largely a passive activity, there is one exception. Operating in the Radiolocation Service bands at 2380 MHz and 8560 MHz, powerful radars at the Arecibo Radio Observatory and the NASA Goldstone Deep Space Communications Complex, respectively, are used to study the surfaces of the Moon, Mars, Mercury, and Venus and the satellites of Jupiter and Saturn. The radars are also powerful instruments for studying asteroids and comets. For near-Earth asteroids, such as Toutatis and Geographos, detailed information has been obtained on the shape, surface composition, and kinematics.
Although the transmitters are powerful (about 500 kW), the returned signals are very weak. Thus, interference from other active services can have a deleterious effect on the scientific data.
2.1.5
Very Long Baseline Interferometry
The technique of very long baseline interferometry allows radio astronomers to link radio telescopes many thousands of kilometers apart. VLBI provides highly accurate measurements of the structure of distant radio sources and molecular emission regions in space.
The angular resolution achieved by VLBI depends not on the size of the individual telescopes but on the distance between them. Data from individual telescopes are recorded simultaneously on high-data-rate recording systems (using very stable oscillators synchronized by atomic clocks). The recorded medium is shipped to a central correlator facility, and the data are processed to produce an interferometer system with baselines spanning continents and oceans.
For this technique to be fully exploited, telescopes in different countries must observe together on exactly the same frequency. Thus, it is necessary that the same passive frequency bands be protected in all of the regions of the world. The United States has built a dedicated system of VLBI telescopes, from Hawaii across the continent to the Virgin Islands, called the Very Long Baseline Array (VLBA; see footnote US311 in Box 4.1).
Originally developed as a radio astronomical technique for the high-resolution imaging of astronomical objects, VLBI has found many applications in Earth-based science, a notable example being the sensitive monitoring of crustal motions on Earth. The positional accuracy provided by the Global Positioning System (GPS) depends on the precise knowledge of irregularities of Earth’s rotation provided by VLBI measurements of distant quasars. Using large numbers of time-difference measurements from many distant quasars observed with a global network of antennas, VLBI determines with unequaled precision the terrestrial reference frame (antenna locations on Earth), the celestial reference frame (quasar positions in the sky), and Earth’s orientation in space. VLBI observations are now doing precision astrometry, measuring the motions of galaxies in the Local Group, the distance to the galactic center of the Milky Way with extreme precision, and observing the motions of stars in orbit around black holes in external galaxies. This capability is unique, and no other wavelength regime can compete for this kind of resolution. These time-difference measurements are precise to a few picoseconds. This high precision is made possible by simultaneous continuum observations in several discrete channels spanning over 100 MHz around 2300 MHz and spanning 500 MHz or more around 8600 MHz.
Although it is not possible to make such precise measurements using only bands allocated to the passive services, these measurements are possible because some interference can be tolerated at some of the antennas part of the time. However, the recent activation of broadcast satellites in the 2300 MHz band is making these measurements more difficult. The broadcast satellites and other sources of interference may make it necessary to move geodetic observations to the 31 GHz band, where 500 MHz is protected for radio astronomy and other passive services.
The need for global protection of the continuum bands used by VLBI became more urgent with the successful deployment in 1997 of the first orbiting VLBI antenna. Space antennas can greatly increase the angular resolution achievable with VLBI techniques. Because of the limited aperture size of orbiting antennas, the success of such projects depends crucially on being able to observe with many large ground-based antennas around the world.
2.1.6
Exploration of the Universe: Three Examples of Major Research Themes and Their Need for Protected Spectrum
2.1.6.1
The Origin and Evolution of Galaxies
Radio astronomy offers the means to study the evolution of galaxies from the very earliest times in the universe. At low frequencies, future facilities will have the sensitivity to detect the signatures left by the re-ionization of the universe induced by the first generation of galaxies and their constituent stars. The first supermassive black holes, formed in the cores of these galaxies, will also be detectable by these low-frequency facilities.
Submillimeter galaxies are detected with the use of ultrawideband continuum detectors and bolometers, which make use of most of the available frequency space within the millimeter and submillimeter atmospheric windows. The sensitivity of the measurements is greatly enhanced by the use of wide bandwidths, which places a premium on continuous, interference-free allocations for radio astronomy. Moreover, for follow-up work, it is important to measure the redshift of these objects via molecular-line observations. The redshifts of new objects are not known a priori, and these lines may be redshifted to any lower frequency. The ability to determine a redshift is directly related to the ability to cover the widest possible bandwidth in a search; therefore, it is important to preserve portions of the spectrum to allow this fundamental information to be measured. To study early galaxies as well as other objects, astronomers use radio astronomy data synergistically with the optical data from the Hubble Space Telescope, infrared data from the Spitzer Space Telescope, and x-ray data from the Chandra X-ray Observatory.
2.1.6.2
Prebiotic Chemical Evolution
The role of interstellar prebiotic chemistry in the origin of life will be better understood when there is a more complete inventory of complex organic molecules. These will be extraordinarily difficult to detect because they are probably much less abundant as compared with simple molecules and because their emission is spread over a much larger number of spectral lines. Such molecules will likely be detected via intensive searches across many wavelength bands, where numerous transitions can be measured in a self-consistent, physically connected data set. Preliminary modeling for such molecules suggests that at temperatures corresponding to warm molecular clouds, these species peak in emission in the millimeter windows.
2.1.6.3
The Search for Extraterrestrial Intelligence
One of the most exciting possible discoveries would be the detection of artificial radiation of nonhuman origin. In 1959, Cocconi and Morrison published a paper suggesting that the technology of radio astronomy had progressed to the point that interstellar communication between ourselves and a very distant civilization might be possible.4 They suggested the 1420 MHz line of neutral hydrogen as an obvious universal communication channel. Independently, Frank Drake made the first radio search for extraterrestrial intelligence (SETI) using the Tatel Telescope of the National Radio Astronomy Observatory (NRAO) equipped with a single-channel, narrowband spectrometer and a receiver tuned to 1420 MHz. Project Ozma, as this search was called, was conducted in the spring of 1960. It examined two nearby solar-type stars for a few hundred hours. It was the first of nearly 60 searches that have been made over the past three decades, most of them at radio frequencies.
Footnote 722 (renumbered by the World Radiocommunication Conference [WRC] of 1995 as 5.341) was added to the radio regulations during the 1979 World Administrative Radio Conference (predecessor of the WRC). It recognizes the interest of the radio science community in this passive search technique. Since 1960, improvements in receiver technology and digital signal processing equipment, intended primarily for use in radio astronomy, have enabled far more sensitive and sophisticated
searches for extraterrestrial technologies to be conducted. Making use of receiver instrumentation developed for radio astronomy, these searches have remained clustered about the frequencies of natural atomic and molecular emission lines and within the protected radio astronomy bands. Plausible arguments can be made for searching at these “magic frequencies,” but most of the microwave window has remained unexplored. We can of course only speculate on the likelihood of civilizations with matching technology.
The SETI Institute has initiated a systematic search for signals throughout the 1 to 10 GHz frequency range that represents the clearest microwave window through the terrestrial atmosphere. This search is based on state-of-the-art signal processing equipment and wideband, low-noise receivers and feeds developed specifically for the effort. The search is being conducted with two complementary strategies, a targeted search of the nearest one thousand solar-type stars employing the Allen Telescope Array and an all-sky survey. Although this search will be much more comprehensive than any other ever undertaken, it is still a limited search.
Because of the technical challenges alone, SETI is an important scientific endeavor. SETI experiments require advanced methods of signal processing as an attempt is made to recognize and interpret weak signals of unknown intensity, frequency, and temporal characteristics amidst a background din of terrestrial and cosmic noise. As with more traditional astronomical studies of weak cosmic radio emission, terrestrial interference poses the greatest challenge to this microwave search.
2.2
REMOTE SENSING OF EARTH
2.2.1
Overview
The spectrum services and systems (see Table 1.1 in Chapter 1) that support the Earth sciences include the Earth Exploration-Satellite Service (EESS), the Radio Astronomy Service (RAS), the Space Research Service (SRS), the International Global Navigation Satellite System (GNSS) (IGS), the Meteorological Aids Service (MetAids), the Meteorological Satellite Service (MetSat), and the Space Operations Service (SOS). The EESS is dedicated to the measurement of all phenomena that can affect Earth’s habitat and its environmental quality, including measurements for both research and operational purposes (Box 2.2). Accurate weather forecasts and timely warnings of severe weather save lives. The lives of people everywhere on Earth are affected by environmental conditions of the land, the oceans, and the atmosphere. Data collected by active and passive sensors are distributed worldwide and are used to benefit developing and developed countries alike. Spaceborne sensors are the only tools that can provide environmental data repetitively on a global scale. Use of active and passive microwave sensors removes the need for sunlight and permits penetration of clouds, thus providing nighttime as well as all-weather coverage. In addition to using spectrum for active and passive sensing from space, the Earth science services use spectrum for command, tracking, data acquisition, and communications and for ground-based radiometry of the atmosphere.5 Ground-based passive and active microwave sensors
|
BOX 2.2 The 1995 Australia Prize The Australia Prize, renamed the Prime Minister’s Prize for Science in 2000, is awarded annually by the Australian government to an individual “for an outstanding specific achievement in a selected area of science and technology promoting human welfare.” In 1995, the Australia Prize was awarded to Dr. Richard Moore, Professor Emeritus of Computer and Electrical Engineering at the University of Kansas, for his work in pioneering “the field of microwave-based remote sensing that helped revolutionize mapping and monitoring of the Earth’s surface.” Dr. Moore was recognized for his invention of the scatterometer and the promotion of space-borne synthetic aperture radar (SAR), both of which use a microwave beam to map the natural environmental characteristics of Earth. Utilizing Dr. Moore’s techniques on a space platform, scientists were for the first time able to conduct large-scale measurements of environmental parameters such as soil moisture, plant respiration, and wind vectors in remote oceanic regions. In fact, it was these experiments that led to the discovery of ancient river beds beneath the Sahara Desert and deserts of northwestern Australia. Today, remote-sensing instruments designed, developed, and promoted by Dr. Moore are used worldwide for monitoring forests, monitoring oceanic parameters such as sea-surface temperature and wind speed, identifying and tracking hurricanes and other extreme weather phenomena, and generally collecting data on global weather and climate trends. SOURCE: Australian Department of Education, Science and Training, “1995 Australia Prize,” available at https://sciencegrants.dest.gov.au/scienceprize/Pages/Doc.aspx?name=previous_winners/Aust1995Moore.htm, accessed Feb-ruary 7, 2007. |
utilize many of the same bands used by satellites to provide additional complementary measurements of the atmosphere.
Microwave sensors can detect variations in Earth parameters not readily detected at optical wavelengths. They can measure temperature, humidity, cloud, and trace gas profiles; surface soil moisture; ocean and estuarian salinity; sea-surface temperature; land-surface roughness and biomass; ocean-surface wave height and sea state; and the moisture content and melt character of ice and snow. Snow-and ice-covered areas and bodies of water can be mapped under all weather conditions and with penetration depths not possible at optical or infrared wavelengths.
Observations of Earth’s atmosphere, land areas, and oceans in the radio part of the electromagnetic spectrum have become increasingly important in understanding Earth as a system. Currently operational satellite instruments, including the Advanced Microwave Sounding Unit (AMSU) and instruments on the Defense Meteorological Satellite Program’s passive microwave weather satellites (the Special Sen-sor Microwave/Imager [SSM/I] and Special Sensor Microwave/Temperature [SSM/T]), provide key meteorological data sets. Remote sensing satellite missions such as NASA’s Earth Observing System (EOS) and the Tropical Rainfall Measurement Mission (TRMM) are providing information about water on a global basis and about rainfall amounts and patterns in the tropics. Current and future missions are expected to improve measurements of atmospheric temperature, water vapor and precipitation, soil moisture, concentrations of ozone and other trace gases, and sea-surface temperature and salinity. These multiyear, multi-billion-dollar missions are international in scope, reflecting the interests of many
countries in obtaining accurate meteorological, hydrological, and oceanographic data and measurements of land-surface features and trace gases in the atmosphere.
The outcome of such remote sensing missions are improvements in weather forecasting; severe-storm monitoring; water resource, land, and biota management; and global climate and atmospheric chemistry models. The long-term economic impact of the information from remote sensing satellites is substantial, in both the production of food and other agricultural products and the operation of businesses and industries that are dependent on both local weather and long-term climate stability. Each year many thousands of lives are saved through advanced warning of dangerously inclement weather, for example, hurricanes, tornadoes, severe thunderstorms, and flash floods. Remotely sensed information from passive and active microwave sensors is also used increasingly to provide scientifically based guidelines for environmental policy.
2.2.2
Passive Sensing
2.2.2.1
Techniques
All matter emits, absorbs, and scatters electromagnetic energy to varying degrees. Water in its various phases (gas, liquid, and solid) exhibits particularly strong characteristic absorption, emission, and scattering features in the microwave portion of the electromagnetic spectrum. Passive sensors measure the electromagnetic energy emitted and scattered by Earth and constituents in the atmosphere.
Atmospheric gases emit and absorb microwave energy at discrete resonant frequency bands described by the laws of quantum mechanics. Atmospheric molecules of H2O, for example, have resonances at 22.235 and 183.10 GHz; frequencies near these resonances are needed for the measurement of water vapor by passive spaceborne sensors. Other atmospheric constituents with resonant frequency bands in the microwave spectrum include O2, O3, CO, NOx, and ClO. Measurements taken near the resonances of these gases can be used to determine the amount of the particular gas in the atmosphere and to obtain atmospheric temperature profiles. The frequency allocations needed for these measurements are rigidly determined by the location of the resonant frequency bands.
The energy emitted from any surface is a function of the frequency, surface roughness and dielectric properties, polarization, angle of incidence and aspect, and subsurface microstructure. Measurements of oceanic roughness are used in the study of ocean structure and winds over sea surfaces. Measurements of O2 absorption are used to determine surface pressure over oceans, and measurement of surface roughness and dielectric constant variations are used in studies of ice, snow, and land parameters. Increasingly, these measurements are being used in operational environmental models for weather- and climate-forecasting purposes. Hydrological prediction services are beginning to use these data for river forecasting and flood control, fire-danger forecasting, and drought assessment and prediction.
The choice of frequency for surface measurements by passive sensors is not as tightly constrained as that for atmospheric gas measurements, since surface characteristics of land (Figure 2.10) and water (Figure 2.11) such as soil moisture and wind speed affect microwave emissions over a broader range of frequencies. However, the sensing of many surface phenomena requires simultaneous measurements at several frequencies in order to measure any single phenomenon because the energy emitted at any given frequency is determined by several overlapping phenomena. Sensing bands spaced at intervals of about an octave of the radio-frequency spectrum are needed within the frequency range from approximately 1 to 200 GHz. The selection of specific allocations can be based on the feasibility of sharing frequencies with other allocated radio services. Below 20 GHz, constraints on the parameters of active radio services may be needed to make sharing feasible.
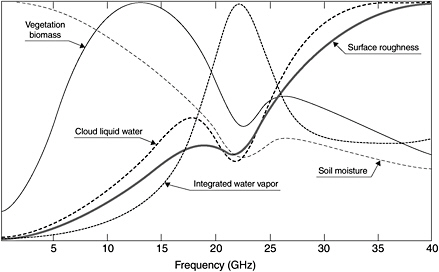
FIGURE 2.10 Relative sensitivity of brightness temperature to geophysical parameters as a function of frequency (over land surfaces).
Extensive studies have been carried out in the International Telecommunication Union’s Radiocommunication Sector (ITU-R) to quantify the frequencies needed for passive sensor measurements. The results are documented in Recommendation ITU-R RS.515.
2.2.2.2
Passive Sensors
A major component of Earth remote sensing systems consists of spaceborne passive microwave radiometers. These sensors are similar in their basic design to radio astronomy receivers. Their use for remote sensing, however, differs in important ways from their application in radio astronomy. A fundamental difference in potential interference sources results because spaceborne sensors point toward Earth from space, in contrast to radio telescopes which point to space from Earth. Radio sources on Earth, particularly those transmitting toward space and which may be benign to radio astronomers, are typically incompatible with spaceborne EESS sensors. Another difference arises owing to the rapid motion of satellite-based sensors through space, which limits the integration time available for sensor measurements to seconds, compared with the longer integration times used by stationary radio telescopes. Thus, EESS remote sensor sensitivities are different from those achieved by radio telescope receivers. However, the maximum antenna gain must be considered in interference calculations, since Earth-viewing sensors are not able to avoid pointing at interference sources as they orbit Earth.
The instrument sensitivity needed to determine physical properties depends on the required observational accuracy. For example, users determining open-ocean salinity over a 30 to 36 parts per thousand range need accuracies of as low as 0.05 parts per thousand for use in numerical ocean models. In the
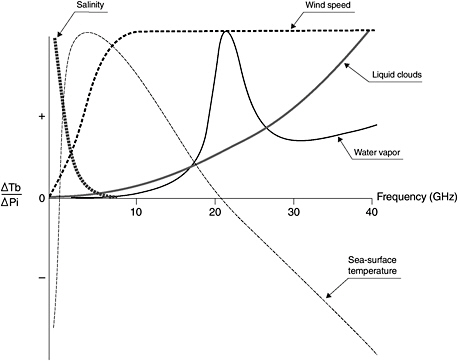
FIGURE 2.11 Relative sensitivity of brightness temperature to geophysical parameters as a function of frequency (over ocean surface).
1-2 GHz range, a measurement sensitivity of ~0.03 K would yield the requisite accuracy. Frequencies above 3 GHz are not sensitive to salinity variations and could not be used as a substitute for the 1-2 GHz range.
Performance criteria for spaceborne passive remote sensors have been studied in the ITU-R. Necessary bandwidths and sensitivities defined in terms of ΔTe for various measurements are found in Recommendation ITU-R RS.1028. The ITU-R recommends that in shared frequency bands (except absorption bands), the availability of passive sensor data shall exceed 95 percent from all locations in the sensor service area in the case where the loss occurs randomly, and that it shall exceed 99 percent from all locations in the case where the loss occurs systematically at the same locations. For three-dimensional measurements of atmospheric temperature or gas concentration, the availability of data shall exceed 99.99 percent. Interference criteria have also been defined by the ITU-R. Permissible interference levels in dBW and interference reference bandwidths are contained in Recommendation ITU-R RS.1029. In bands that are allocated to the EESS on an exclusive basis, it has been determined by the ITU that “all emissions shall be prohibited.”
2.2.3
Active Sensing
2.2.3.1
Techniques
Active sensors, such as terrestrial, airborne, or spaceborne radars, receive signals that they have transmitted after these signals have been reflected by land or ocean surfaces or by atmospheric hydrometeors. Major types of active sensors include the radar scatterometer, radar altimeter, image-forming radar, precipitation radar, and cloud-profiling radar.
Bandwidth requirements for active sensors vary with the type of sensor application. Scatterometers are typically narrowband, low-resolution devices requiring about 1 MHz of bandwidth. Synthetic aperture radars (SARs), precipitation radars, and cloud-profiling radars are medium-bandwidth devices; they can be designed to satisfy measurement resolution requirements in less than 100 MHz of bandwidth. Altimeters, however, require wide bandwidth, typically up to 600 MHz or more, to achieve centimeter measurement accuracy. Ultrawideband radars for snow-depth profiling are now in experimental development and require several gigahertz of bandwidth but operate over a limited spatial extent.
Because the reflected signal received by an active sensor depends on the dielectric properties of the surface and its roughness, the necessary frequencies for active sensing are determined by the phenomena to be measured. Generally speaking, bands spaced about an octave apart are needed, as in the case of passive sensor surface measurements and radio astronomy continuum measurements. The frequency bands to accommodate active sensor measurements range from below 1 GHz for surface measurements up to 150 GHz for cloud measurements. Within a set of approximately octave-spaced bands, the precise frequencies to be used are not critical. Thus, other factors such as sharing potential with other radio services need to be considered. Sharing between active spaceborne sensors and terrestrial radars (the radiolocation service, in ITU parlance) has been shown to be feasible with certain design constraints; the bands allocated for active sensing are all also allocated to the radiolocation service.
Active sensor frequency and bandwidth requirements have also been studied in the ITU-R. They can be found in Recommendation ITU-R RS.577.
2.2.3.2
Active Sensors
Current and planned Earth remote sensing systems include active spaceborne sensors, such as scatterometers, image-forming radars such as synthetic aperture radars, radar altimeters, precipitation radars, and cloud-profiling radars. Applications of active sensors include the measurement of soil moisture, snow, ice, rain, clouds, atmospheric pressure, and ocean wave parameters, and the mapping of geologic and geodetic features and vegetation.
Multispectral images obtained by SARs operating at 1215-1300 MHz, 5250-5350 MHz, and 9500-9800 MHz are used to study Earth’s ecosystems, climate, and geological processes, the hydrologic cycle, and ocean circulation. Altimeter measurements in the 5250-5350 MHz, 13.4-14 GHz, and 35-36 GHz bands provide data to study ocean-surface height and wave dynamics and their effects on climatology and meteorology. Spaceborne scatterometer measurements of ocean-surface wind speeds and direction in the 5250-5350 MHz, 9500-9800 MHz, and 13.25-14 GHz bands play a key role in understanding and predicting complex global weather patterns and climate systems. The TRMM uses a precipitation radar in the 13.4-14 GHz band to provide data on rainfall in the important intertropical convergence zone. The Global Precipitation Mission is a follow-on to the TRMM mission due to be launched toward the end of this decade and will incorporate radar bands at 35-36 GHz. The Cloudsat mission, launched in May 2006, measures clouds using the recently allocated band at 94-94.1 GHz.
Performance and interference criteria for active spaceborne sensors have been extensively studied. Performance criteria for active sensors have been defined in terms of the precision of measurement of physical parameters and the availability of measurements free from harmful interference. Interference criteria are stated in terms of the interfering signal power not to be exceeded in a reference bandwidth for more than a given percentage of time. The processing of SAR signals discriminates against interference depending on the modulation characteristics of the interfering signal and can materially improve the potential for sharing frequency bands.
Performance and interference criteria for active spaceborne sensors can be found in Recommendation ITU-R RS.1166.
2.3
THE ECONOMIC VALUE OF THE SCIENCE SERVICES
2.3.1
Investments in Infrastructure
As explained above, radio astronomy and Earth science require the operation of many facilities with different instruments and locations, including the vantage of space. Countries around the world that have made major investments in the development of radio astronomy and Earth science include Argentina, Australia, Brazil, Canada, China, Germany, France, India, Italy, Japan, The Netherlands, Russia, the United Kingdom, and the United States. As a return on those investments, radio astronomy and Earth remote sensing have, over the past half century, made fundamental new discoveries and have brought us closer to understanding both the nature of the universe and our immediate environment. The rapid rate of important discoveries in radio astronomy and Earth science will surely continue if the radio-frequency bands for the passive services are protected.
The United States alone plans to invest over $7 billion in the National Polar-orbiting Operational Environmental Satellite System (NPOESS) over the lifetime of the program to fulfill its identified operational and climate-monitoring needs. NPOESS is considered critical to the ability of the United States to maintain the continuity of data required for weather forecasting and global climate monitoring. NPOESS passive microwave sensors utilize frequencies ranging from 6 GHz to above 190 GHz to obtain more than 22 separate remotely sensed environmental parameters.
2.3.2
Technologies and Techniques
Because scientific discoveries are usually made at the limits of instrumental sensitivity, radio astronomy and remote sensing have contributed significantly to the development of new technology for medical, commercial, industrial, and defense purposes. Radio astronomy has been a copious source of transferable technology, algorithms, and trained individuals interested in applying remote sensing and receiver expertise in a variety of sectors, and especially in telecommunications.6 Some examples are listed below:
-
Originally developed as a radio astronomical technique for the high-resolution imaging of astronomical objects, very long baseline interferometry was used for applications in Earth science—for example, the determination of geophysical parameters used in studying plate tectonics, polar wandering,
-
latitude measurements, and variations in Earth’s rotation, and the identification of potential earthquake zones through the precise measurement of fault motion. VLBI has since been replaced by the Global Positioning System.
-
The VLBI reference frame of celestial coordinates, based on extremely distant radio sources, is basic to the periodic calibration of the GPS reference clocks.
-
Pulsar observations, VLBI, and applications of Einstein’s general theory of relativity play a major role in precision navigation and geodesy—including that of spacecraft—and timekeeping.
-
VLBI instrumentation is the source of the technology used to locate interference to commercial satellite uplinks.
-
Using radio astronomy and laboratory experiments, Sir Harold Kroto made the surprising discovery that long linear carbon chain molecules existed in interstellar space and also in stars. During laboratory attempts to understand how these species can to be so abundant, fullerene molecules were discovered.7 Kroto shared the Nobel Prize in chemistry in 1996 with Richard Smalley and Robert Curl.
-
Astronomers played a significant role in refining the hydrogen maser clock, which is now an important frequency standard in applications requiring high-precision (1:1015) frequency stability over periods of ~1000 seconds.
-
Computerized x-ray tomography employs software and methods originally developed for mapping radio sources. The data-intensive computing and storage systems that are developed for signal processing in areas such as pulsar searches have wide applications elsewhere.
-
Extremely sensitive, low-noise receiver technology developed for radio astronomy has been used in implementing the Enhanced 911 emergency service.
Radio astronomers have adapted their methods of measuring microwave temperature for the noninvasive detection of tumors and other regions of vascular insufficiency. Microwaves have poorer angular resolution than infrared has but are more sensitive to deep-tissue temperatures. The combination of microwave and infrared thermographic data provides a true-positive detection rate of 96 percent, better than either alone, for breast cancer.8 Astronomers were the first to employ conical (circularly polarized) feed horns, which later became popular on satellite transmitters because both polarizations could be transmitted by the same feed horn, linear polarizations requiring spatially separated crossed rectangular feeds.
2.3.3
The Value of Satellite Remote Sensing
Satellite remote sensing is one of the cornerstones of meteorology, oceanography, and environmental science, supporting analysis and research that provide assessments, predictions, and warnings to the public. Weather- and climate-sensitive industries account for about a quarter of the U.S. gross domestic product. Droughts, severe storms, and floods alone account for more than $20 billion in damage annually in the United States. The impact of El Niño events on the U.S. economy is estimated at $25 billion.9 Without satellite remote sensing, the ability of the atmospheric and oceanic science community to monitor, analyze, and predict environmental conditions would be drastically diminished. Satellites
|
7 |
The Royal Society Web site, http://www.royalsoc.ac.uk/page.asp?id=1527; accessed April 21, 2006. |
|
8 |
National Research Council, Working Papers: Astronomy and Astrophysics Panel Reports, National Academy Press, Washington, D.C., 1991, p. 307. |
|
9 |
Stanley A. Changnon, Gerald D. Bell, David Changnon, Vernon E. Kousky, Roger A. Pielke, Jr., and Lee Wilkins, El Niño, 1997-1998: The Climate Event of the Century, Oxford University Press, New York, 2000. |
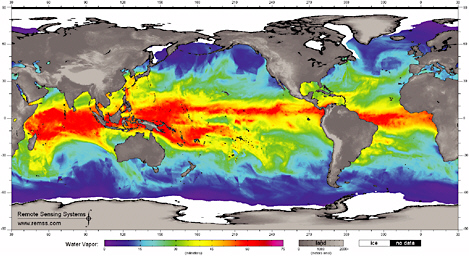
FIGURE 2.12 Global composites of water vapor for the 3-day period ending April 25, 2003, available at http://www.ssmi.com, accessed November 20, 2006. Courtesy of Remote Sensing Systems, Inc.
provide the only means of obtaining accurate assessments of land- and sea-surface and atmospheric conditions on a global scale.
Satellite remote sensing has long been used to estimate sea-surface temperature through passive radiometry. Sea-surface temperature impacts the atmosphere as a forcing field, coupling between the ocean and atmosphere through sensible and latent heat and freshwater fluxes. Until recently, cloud cover severely limited sea-surface temperature retrievals, but microwave techniques are now routinely used to see through clouds to provide accurate sea-surface temperature retrievals under almost all weather conditions. Figure 2.12 shows global fields of sea-surface temperature, surface wind speed, water vapor, cloud liquid water, and precipitation rate coverage in a 3-day composite. The availability of complete coverage with relatively fine temporal and spatial resolution is crucial to models of ocean and atmosphere coupling and variability. It has also provided new insights into the mechanism of transport of moisture over the globe, for example, the identification of intense trans-Pacific jets of moisture (“atmospheric rivers”) that facilitate most of the meridional transport of water vapor from the tropics to the middle latitudes, along with the production of devastating winter storms along the western U.S. coast.
Satellite remote sensing contributes greatly to surface-oriented science. Examples include the Shuttle Radar Topology Mission, which provided a consistent, near-worldwide, digital elevation model for the first time and the breakthrough glacial observations made with Radarsat, which mapped the entirety of Antarctica. Radarsat, along with in situ GPS-based measurements, is providing the first large-scale measurement of glacial motions, critical for climate studies. Further, interferometric synthetic aperture radar (InSAR) and differential InSAR are providing new tools used to measure subtle movements in Earth’s crust, for example, the subsidence areas exhibiting soil compaction or water table retreat or the buildup of surface strain along crustal fault lines.
Some examples of valuable microwave satellite remote sensing applications are listed below:
-
The detection of forest fires through smoke by their microwave radiation;
-
The measurement by passive remote sensing techniques of the temperature of Earth’s atmosphere; surface properties including soil moisture, snow cover, and sea ice; the distribution of water vapor, cloud water, precipitation, and impurities such as carbon monoxide; and vegetation biomass properties;
-
The monitoring of trace gases, such as ozone, important to atmospheric chemistry, air quality, and greenhouse warming;
-
Early and accurate warnings of natural land-related disasters, and the mitigation of such events;
-
Systematic environmental monitoring and the generation of information relevant to better management of natural resources, including forests, agricultural lands, wetlands, and freshwater;
-
The mapping of conditions with potential for malaria outbreaks and other disease vectors;
-
Studies of human impact on the environment—for example, urban development, deforestation, and diversion of natural waterways; and
-
The measurement, via the newly allocated EESS secondary active band at 432-438 MHz (via footnote 5.279A), of Amazonian biomass (in conjunction with higher-frequency radar measurements of the top of the vegetation), as well as allowing measurements of soil, underlying brush cover, and soil prone to landslides in the western United States.
The potential loss of any critical band for the EESS could be expected to result in significant costs to society, resulting from reduced ability to forecast weather and the environment, manage resources, and predict disruptive climate changes.
As of this writing, the costs of severe weather events alone are often in the hundreds of millions of dollars per event. NOAA’s National Weather Service forecasts, warnings, and the associated emergency responses result in a $3 billion savings in a typical hurricane season. Two-thirds of this savings, $2 billion, is attributed to the reduction in hurricane-related deaths, and one-third of this savings, $1 billion, is attributed to a reduction in property-related damage because of preparedness actions. Errors in temperature and precipitation forecasting for even benign meteorological events such as local or regional heat or cold waves can cost U.S. utilities approximately $1 million per degree Fahrenheit daily as a result of an impaired ability to match energy supplies with demand.10 While it is difficult to ascribe forecast errors to interference occurring within any specific microwave band, it is noted that undetected interference in any passive microwave band can seed the growth of large errors in numerical weather-prediction models. (See also §3.7.1 and §3.9.1.) The costs of such forecasting errors are typically largest in areas of highest population density and thus of greatest spectral demand.
The prediction of climate changes on all timescales remains a nascent field, but it shows increasing promise as global modes of oscillation such as the El Niño-Southern Oscillation, Pacific Decadal Oscillation, and North Atlantic Oscillation; teleconnections of these modes to regional climate; and coupling of major large-scale climate subsystems are better understood. While the key predictors of climate events remain a subject of debate, measurements of global moisture, cloud, snow, ice, and thermal distribution remain key values that are unquestionably connected to regional weather patterns. As the ability to predict short-term climate improves, the utility of such measurements in making
accurate climate predictions on both the short (monthly) and long (annual to decadal) timescales is anticipated to increase. Benefits to U.S. agriculture by altering planting decisions based on improved El Niño forecasts have been estimated at $265 million to $300 million annually, throughout El Niño, normal, and La Niña years. Costs associated with errors in predicting the onset of regional climate changes could thus easily amount to hundreds of millions of dollars per year.11
2.3.4
Education for Scientific Literacy
Astronomy is a compelling subject, as shown by public attendance at planetariums, the number of astronomy and space magazines, and the very large number of astronomy clubs and amateur astronomers. This interest serves as an effective basis for using astronomy in the curriculum for kindergarten through grade 12 to improve the scientific literacy of tomorrow’s leaders and managers. Although at first glance they would seem too esoteric for such a purpose, radio telescopes have in fact proven very effective in education. For example, high school students across the United States are able to carry out research programs with the Goldstone Apple Valley Radio Telescope, based at NASA’s tracking complex in California. Australia and Spain are instituting similar programs at their NASA tracking complexes.
The Massachusetts Institute of Technology’s Haystack Observatory staff has developed a Small Radio Telescope (SRT) and high school lesson plans as a tool to introduce students to the basics of radio astronomy. The SRT is now available as a kit, and more than 85 SRTs are now in use around the world.
Earth remote sensing data are made publicly available at low cost or no cost via the Internet for use in schools. Landsat imagery and Shuttle Radar Topography Mission digital elevation models, as well as weather data and much data from the Earth Observing Satellite system, and in fact much of NASA’s and NOAA’s remote sensing data, are provided free of charge to U.S. researchers.12 Within the framework of the Global Earth Observation System of Systems (GEOSS), Earth remote sensing data will become readily and rapidly distributed on a worldwide basis to support a wide range of activities by scores of countries within a number of societal benefit areas. The enhanced degree of awareness of Earth as a system stemming from such data use will provide a myriad of educational benefits to all students around the globe.
University radio observatories provide hands-on training for the next generation of engineers and instrument builders as well as astronomers. The Angel Ramos Foundation Visitor and Educational Facility at the National Astronomy and Ionosphere Center (NAIC) in Arecibo, Puerto Rico, receives 120,000 visitors per year and conducts a number of training programs for students and teachers alike. Likewise, the National Radio Astronomy Observatory has visitor centers at the Very Large Array headquarters in Socorro, New Mexico, and at the Robert C. Byrd Green Bank Telescope in Green Bank, West Virginia. The Green Bank NRAO facility hosts many educational programs. Research at NRAO and NAIC has provided data for many Ph.D.’s granted in the past 20 years, and both NRAO and NAIC run summer Research Experience for Undergraduates (REU) programs. The National Science Foundation also sponsors REU programs at Haystack Observatory and Cornell University.


