
CHAPTER ONE
Introduction
The nation is presently engaged in a large program of Flood Map Modernization, an ambitious plan launched by the Federal Emergency Management Agency (FEMA), to modernize and convert to digital form the floodplain maps of the nation. The original goal was to cover the whole nation coast to coast, county by county, community by community, with digital floodplain maps over a five-year period from 2003 to 2008. This goal was subsequently modified to increase map quality and map the 65 percent of the nation that includes 92 percent of the population. Flood Map Modernization costs $200 million per year in federal funds and has a five-year budget total of approximately $1.2 billion when local funds are added. Accurate terrain elevation data are required nationwide, not just for Flood Map Modernization but also for numerous other nationwide programs documented in the “National Height Modernization Study, Report to Congress,” published by the National Oceanic and Atmospheric Administration (NOAA) in June of 1998, in which the benefits of acquiring a high-accuracy terrain elevation dataset of the nation were estimated at more than $2.5 billion for such diverse applications as precision farming, stormwater management, and transportation planning. Since 1998, the demands for accurate elevation data have continued to grow nationwide and worldwide.
Stimulated in part by this demand for accurate elevation data, new elevation mapping technologies are flowering. In particular, light detection and ranging (lidar) has progressed in a few years from being a research tool developed by ther National Aeronautics and Space Administration (NASA) and other science and technology organizations to a preferred method widely employed by commercial companies for precisely defining the elevation of the land surface. Another emerging technology, IFSAR (interferometric synthetic aperture radar), was used during the Shuttle Radar Topography Mission in February 2000 to create a topographic map for much of the world far more detailed than any that existed publicly before. These and other remarkable new technologies have opened the way for viewing the topography and land features of the nation with degrees of precision and detail that are unprecedented.
First established by the National Flood Insurance Act in 1968, the National Flood Insurance Program (NFIP) includes a national coverage of Flood Insurance Rate Maps (FIRMs), which are compiled by county and delineate the areas along streams within the county that are subject to flood risk (Figure 1.1). These maps have become such an important part of land development in the United States that the phrase “100-year floodplain” has entered the general lexicon of the nation. Approximately $650 billion in insured assets are now covered under the NFIP. The question that this report addresses is: To what degree can or should emerging elevation mapping technologies be used in Flood Map Modernization?
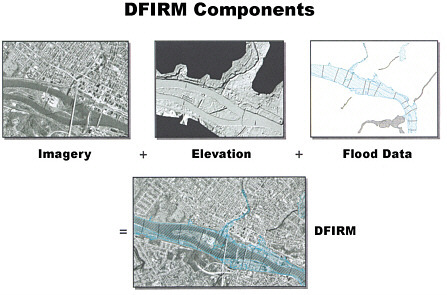
FIGURE 1.1 The major map components of a Digital Flood Insurance Rate Map (DFIRM). Top left: the base map imagery, an orthophoto, for a floodplain map upon which familiar map planimetric elements (roads, rivers, buildings, vegetation) can be identified; top center: the digital elevation data overlaid on the orthophoto give each element in the orthoimage an accurate vertical position; top right: flood hazard data, collected and modeled by surveyors and engineers in the field, are then digitally overlaid onto the ortho- and elevation map to produce the DFIRM. This report addresses the technologies used to generate the orthoimage (base) and digital elevation data of the DFIRM. Together, we describe the imagery base map and the elevation data as the “framework data” of the DFIRM in this report. SOURCE: Adapted from Maune, 2007. Reprinted with permission from the American Society for Photogrammetry and Remote Sensing.
Answering this question must take into account the purposes of the NFIP, which is intended to enable
property owners in participating communities to purchase insurance as a protection against flood losses in exchange for State and community floodplain management regulations that reduce future flood damages. Participation in the National Flood Insurance Program is based on an agreement between communities and the Federal Government. If a community adopts and enforces a floodplain management ordinance to reduce future flood risk to new construction in floodplains, the Federal Government will make flood insurance available within the community as a financial protection against flood losses. This insurance is designed to provide an insurance alternative to disaster assistance to reduce the escalating costs of repairing damage to buildings and their contents caused by floods. (FEMA, 2002a, p. 1)
Therefore, the task of creating floodplain maps is one part of engaging a community in upgrading its activities in floodplain management, and Flood Map Modernization is done community by community, rather than being conducted solely from the federal level.
1.1
CREATING FLOODPLAIN MAPS
Compiling floodplain maps is a costly and expensive undertaking, especially for rural counties, where the total cost can be comparable to the entire annual operating budget for activities in the county. The accuracy of floodplain maps depends critically on the accuracy of the underlying land surface elevation data (topography) and also on the location of other planimetric features, particularly roads, streets, rivers, and streams. When a building is judged to be “within the 100-year floodplain,” this means that some part of the footprint of this building intersects with some part of the 100-year floodplain. In other words, both the “planimetric,” or horizontal, accuracy of the location of map features and their “topographic,” or vertical, accuracy are important.
The quality of the framework data that local communities have available to support flood map development varies widely with the financial capability of the community and its history of geographic information system (GIS) data development. Since U.S. Geological Survey (USGS) topographic mapping was first carried out, the land surface has been actively subsiding due to human activities and natural consolidation of local rock or sediment in about 17,000 square miles of the nation, particularly portions of California, Texas, Louisiana, and Florida. It is axiomatic that better framework data produce more accurate floodplain maps, but balancing the cost of better data collection and mapping with the benefits to be obtained from more accurate floodplain delineation is a complex matter, especially when all the variations that arise in dealing with each cooperating community have to be taken into account.
1.2
ORIGIN OF THIS STUDY
This study was undertaken at the initiative and with the financial support of the National Academies to make a first assessment of the issues involved in using new elevation technologies for the Flood Map Modernization program. This report is intended to inform Congress during its deliberations in 2007 and was prompted by an enquiry directed to the National Academies from Congress, specifically from the Senate Appropriations Committee, in 2006. That enquiry was itself prompted by presentations made to Congress by representatives of aerial mapping companies who asserted that new collection of elevation data is needed to produce good floodplain maps. If such data collection is not done first, questions are being raised as to how useful or accurate the new floodplain maps can be.
Separate from this congressional interest in flood mapping technologies, the Mapping
Sciences Committee of the National Academies conducted its own review of the use of elevation data in flood map development in March 2005 and initiated with FEMA a process for defining a formal study of flood map accuracy, which is expected to take two years to complete. FEMA approved funding for the flood map accuracy study, and it is now under way. Incorporating information on flood map technologies from this report, the longer-term flood map accuracy study will also deal with such factors as the hydrology of flood flow extremes, the hydraulics of converting flood flows to water surface elevations, the translation of flood elevations defined on isolated cross-section lines into a floodplain map defined over the whole river and floodplain zone, and the cost of flood map creation alternatives versus the benefit in terms of greater accuracy of flood risk assessment.
However, the longer-term flood map accuracy study will come to completion at the end of the current five-year Flood Map Modernization process and thus will be more influential on what follows afterward than on the current Flood Map Modernization program. This present report is intended to provide a first focus on the framework information that goes into creating a floodplain map.
1.3
STATEMENT OF TASK AND REPORT STRUCTURE
The National Academies requested that an ad hoc committee respond to the following statement of task:
-
Identify the current mapping technologies being used by the Federal Emergency Management Agency to develop flood hazard maps;
-
Identify mapping technologies that are currently available; and
-
Determine if newer technologies are appropriate and would be of additional benefit to floodplain mapping.
Chapters 2 through 6 of this report address the three elements of the statement of task. Chapter 2 describes flood mapping and analysis in general using Bexar County, Texas, as an example. This chapter describes flood hydrology and hydraulic modeling for a stream reach and shows how floodplain mapping is one of the issues needed for flood management, but there are other issues also, such as flood damage mitigation project planning. Chapter 3 describes how FEMA’s Map Modernization program uses its elevation data to meet data accuracy requirements for incorporation into a flood hazard map. Chapter 4 reviews available remote sensing technologies for producing the base and digital elevation map information (framework data) underlying the flood hazard data in a Digital Flood Insurance Rate Map (DFIRM) (see Figure 1.1). The chapter discusses the underlying concepts of the main technologies, their instrumentation, data products resulting from their use, and the accuracies of these data as they relate to the accuracy requirements for FEMA DFIRMs. Chapter 5 assesses the strengths and weakness of each mapping technology in
the framework of requirements for the FEMA Map Modernization process. Chapter 6 summarizes the committee’s conclusions and recommendations. Because of the technical nature of some of this report, the reader is referred to an extensive glossary and list of acronyms in Appendixes C and D, respectively.
FEMA creates floodplain maps for riverine and coastal flooding using similar framework data but different methods for modeling flood inundation. Since the nation possesses more than 4.2 million miles of streams and rivers, but only about 60,000 miles of coastlines, the main focus in this report is on riverine flooding. Coastal flooding will be considered in more detail in the forthcoming National Resource Council study on flood map accuracy. Particular issues of concern with coastlines are the effects of land subsidence, discussed in Chapter 3, and the very flat slope of many coastal zones, discussed in Chapter 5.
The committee notes that the report uses a mixture of U.S. and metric units because that is the practice in this field of study. For example, topographic maps typically have contour intervals measured in feet, but the aerial mapping companies preparing the elevation data underlying these maps usually specify the accuracy of these data in centimeters or meters. Where important, measurements in both systems of units are given.
1.4
LIMITATIONS OF THIS STUDY
This study was conducted in a short period of time and the committee held one public meeting, described in Appendix B. Limitations of time, and the narrow focus of the statement of task, meant that this study did not focus in detail on the following issues:
-
Coastal flooding—this involves a different methodology than riverine flooding and since the nation has 60,000 miles of coastlines and about 4.2 million miles of rivers and streams, the committee focused on riverine flooding because that makes up the bulk of Flood Map Modernization. This study has highlighted, however, the very flat slope of the coastal areas of the Gulf of Mexico and the eastern seaboard, which require particularly precise elevation information.
-
Geodetic control—the actual elevation of a point on the land surface is defined using its height above the geoid, which is a surface of constant gravitational potential approximating mean sea level and defined over the nation. The National Geodetic Survey is conducting a Height Modernization program (http://www.ngs.noaa.gov/heightmod/) to facilitate direct use of Global Positioning System-derived elevations and to revise vertical datums used for elevation mapping. The committee did not consider variations in the precision of definition of the survey control points or vertical datums across the nation, but this report does highlight land subsidence as an issue important to Flood Map Modernization.
-
Mapping technologies other than airborne remote sensing—the committee
-
considered in detail photogrammetry, lidar, and IFSAR, which are all aerial mapping technologies using remote sensing in some form. The committee did not consider land-based surveying or land-based lidar, or measurement of bathymetric depth below water surfaces.
-
Uncertainties in flood hydrology and hydraulics—uncertainty in floodplain maps arises in part from uncertainties in the framework map information, and in part from uncertainties in the computation of the discharge and elevation of floodwaters flowing through the landscape. The committee focused on issues related to map elevation data and not on other sources of uncertainty in flood risk assessment. A previous study examined uncertainty in flood hydrologic and hydraulic computations (NRC, 2000).
Besides the mapping technologies study presented in this report, FEMA has engaged the National Academies to undertake a longer-term flood map accuracy study within which the above issues will be addressed more fully.


