
CHAPTER FOUR
Remote Sensing Technologies for Floodplain Mapping
A floodplain map has three key components: base map imagery and/or cartographic line work, an elevation model representing the earth’s surface or “terrain,” and flood study results generated from engineering analyses. This chapter describes remote sensing technologies that can be used to create the base map imagery and the elevation model and focuses on elevation because of its special significance in the accuracy of the final floodplain map. Elevation data are the basis for the engineering computation of base flood elevations (BFEs); they are also the surface upon which the BFE is mapped to delineate flood boundaries. Elevation (terrain) is by far the easiest target and the most frequent subject for individual property owner appeals to the Federal Emergency Management Agency (FEMA) flood maps; “terrain is only one contributor to overall accuracy [of a floodplain map]”; however, “terrain is the factor that can most clearly be shown to be wrong” (Rooney and Godesky, 2006).
Regardless of whether “best-available” elevation data are used or new elevation data are being acquired for a flood study, informed judgments must be made about the appropriateness of these datasets and their influence on the flood data computations. All elevation data (old and new) derive from a remote sensing technology of one form or another; each technology has unique characteristics and particular strengths and weaknesses. To discuss the fundamental questions, What makes a “good” flood map? and Is the best-available technology being effectively employed? one must be familiar with the categories of available mapping technology. This chapter is intended to provide an introduction to remote sensing technologies sufficient to understand the availability of adequate elevation data to address the floodplain management challenges faced by our nation.
4.1
CONCEPTS AND TERMS
The most essential terms and concepts in remote sensing and mapping are addressed in the following text. The reader is referred to Appendix C for definitions of terms and to Appendix D for a complete list of acronyms that appear throughout this chapter.
4.1.1
Datums and Coordinate Systems
Within the fields of geodesy, surveying, and mapping, the term datum (plural datums) refers to a reference surface against which position measurements are made; simply stated,
it defines “zero” on the measurement scale. Horizontal datums are used to describe a location in latitude and longitude; vertical datums are used to describe heights above or depths below the earth’s surface.
To develop horizontal and vertical datums, the shape of the earth must first be defined. The science of geodesy is dedicated to “measurement and representation of the earth, including its gravity field, in a three-dimensional time varying space” (Vanicek and Krakiwsky, 1986), and some basic concepts of geodesy are explained before delving into the applications of remote sensing technology to floodplain mapping.
The mathematical model that is most often used to approximate the earth’s shape is an oblate ellipsoid, a spheroid that has been slightly flattened at the north and south poles. The Geodetic Reference System of 1980 (GRS80) is the widely accepted geodetic reference system adopted by the General Assembly of the International Union of Geodesy and Geophysics in 1979 (Moritz, 1980). GRS80 is a global reference ellipsoid for navigation and mapping; the center of mass of the earth is defined as its origin. The World Geodetic System of 1984 (WGS84) was developed by the U.S. Defense Mapping Agency (DMA; now the National Geospatial-Intelligence Agency, NGA) and officially published in 1987; WGS84 is the ellipsoidal reference used by the Global Positioning System (GPS). The difference between GRS80 and WGS84 is very small and can be considered negligible for most surveying and mapping purposes (NIMA, 1987).
In practice, one needs physical marks, or monuments, on the earth’s surface that have known coordinates of latitude and longitude on the reference ellipsoid. The National Geodetic Survey (NGS) maintains a system of monuments and published coordinates known as the North American Datum of 1983 (NAD83). NAD83 is a horizontal control datum that represents the best fit to GRS80 for the North American continent; it is the current standard (as defined by a Federal Register notice of June 13, 1989) used by the U.S. Geological Survey (USGS), FEMA, and others for national, state, and local mapping programs. A significant number of USGS topographic maps were created using an earlier horizontal control datum, the North American Datum of 1927 (NAD27), which is based on the Clarke spheroid of 1866. NGS has discontinued use of this datum in favor of NAD83.
The earth’s shape and gravity field are complex and vary over time; however, the gravity field is based on the variability of mass not on shape. Water flows downhill toward the sea following the forces of gravity, not following the shape of an imaginary ellipsoid. Therefore, we need a vertical reference system defined by gravity; the gravity surface that coincides on average with global sea level is called the geoid, as shown in Figure 4.1. In some places on the earth, zero elevation with respect to the geoid is many meters above zero with respect to the ellipsoid; in other locations the geoid may be many meters below the ellipsoid. The difference is known as the geoid separation.
Like NAD83 for horizontal, there is also a vertical control datum for elevation called the North American Vertical Datum of 1988 (NAVD88), which was established by a minimally
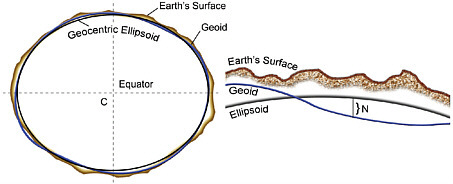
FIGURE 4.1 Relationship of the earth’s surface, the geoid, and a geocentric ellipsoid. The height difference between the geoid and the geocentric ellipsoid (N) is the geoid separation. SOURCE: URS Corporation.
constrained adjustment of survey leveling observations, holding fixed a primary tidal bench mark in Quebec, Canada. NAVD88 replaces the National Geodetic Vertical Datum of 1929 (NGVD29), which was the basis for many old FEMA floodplain maps. Most new FEMA maps are referenced to NAVD88. Conversion from NGVD29 to NAVD88 can be accomplished using the NGS program, VERTCON, except in regions of significant subsidence as discussed in Chapter 3. Digital elevation models (DEMs) derived from contour maps on NAD27 are routinely and easily converted to NAD83 for Flood Map Modernization and fit to digital orthophotos that are also compiled to the NAD83 horizontal datum. The larger issue pertains to the vertical datum, where DEMs need to be converted from NGVD29 to NAVD88. Here, FEMA has goals to convert old topographic data to NAVD88, but issues are complex when prior engineering studies were all performed to the older NGVD29.
Heights determined from the GPS are not relative to mean sea level; rather, GPS heights are relative to the ellipsoid. The geoid separation must be applied in order to calculate an elevation with respect to mean sea level. Geoid models are updated every few years based on new measurements of the earth’s gravity field.
The difference between the terms “elevation” and “height” must also be clarified. Height refers generally to the measured distance above or below a reference surface, a datum. Elevation refers to one specific type of height, an orthometric height, which is what most people think of as height above mean sea level. The term elevation model is used here to mean a representation of the earth’s surface, the terrain, with heights referenced to a specified orthometric height datum.
4.1.2
Accuracy, Precision, and Resolution
The ability of remote sensing technologies to produce accurate elevation models and the resulting accuracy of floodplain maps are among the central questions of this study. Key terms and their uses in the context of this report are defined here.
Accuracy is the closeness of an estimated, measured, or computed value to a standard, accepted, or true value of a particular quantity. The true values of locations and elevations, relative to established datums, are rarely, if ever, known. All spatial coordinates are computed measurements; therefore accuracy itself can only be estimated, never known absolutely. The quantification of error and the language of accuracy assessment rely heavily on principles of statistics and probability.
Relative accuracy is an evaluation of the amount of error in determining the location of one point or feature with respect to another. For example, the difference in elevation between two points on the earth’s surface may be measured very accurately, but the stated elevations of both points with respect to the reference datum could contain a large error. In this case, the relative accuracy of the point elevations is high, but the absolute accuracy is low.
Precision is a statistical measure of the tendency for independent, repeated measurements of a value to produce the same result. A measurement can be highly repeatable, therefore very precise, but inaccurate if the measuring instrument is not calibrated correctly. The same error would be repeated precisely in every measurement, but none of the measurements would be accurate.
Spectral resolution describes the way an optical sensor responds to various wavelengths of light. High spectral resolution means that the sensor distinguishes between very narrow bands of wavelength; low spectral resolution means the sensor records the energy in a wide band of wavelengths as a single measurement.
Radiometric resolution refers to the ability of a sensor to detect differences in energy magnitude. Sensors with low radiometric resolution are able to detect only relatively large differences in the amount of energy received; sensors with high radiometric resolution are able to detect relatively small differences.
Temporal resolution is defined as the frequency at which data are captured for a specific place on the earth. The more frequently they are captured, the better or finer is the temporal resolution said to be. Temporal resolution is relevant when using imagery or elevations datasets captured successively over time to detect changes to the landscape.
Spatial resolution is one of the more frequently misused terms in mapping specifications. According to the Glossary of Mapping Sciences (ASCE, ACSM, ASPRS, 1994), it is “a measure of the finest detail distinguishable in an image.” While the distinguishable detail is dependent on the size of the image pixel, the size of an object that can be seen in an image and the size of a single pixel in an image are different.
Commonly, spatial resolution (the size of a pixel in an image) is confused with spatial accuracy (location of that pixel with reference to a mapping datum). To say that the size of a pixel in an image is 1 foot in ground units is not the same as saying that the ground coordinates of that pixel are accurate to within 1 foot of their “true value.” An image can have very high spatial resolution and very low spatial accuracy, or vice versa.
Ground sample distance (GSD) is the size of a pixel projected to the ground surface, as reported in linear units per pixel; for example, a USGS Digital Orthophoto Quarter Quadrangle (DOQQ) has a 1-meter GSD because each pixel corresponds to 1 meter on the ground. GSD is what many people (and remote sensing product vendors) actually mean when they talk about the “spatial resolution” of an image; GSD is the correct term. When using the term in reference to an elevation model, GSD describes the actual or nominal spacing between ground elevation samples or measurements.
Post spacing describes the ground distance interval of cells in a uniform elevation grid. For example, in the definition above of a USGS DEM, it can be said that one of the standard products in the National Elevation Dataset (NED) has 30-meter post spacing; the term is synonymous with grid spacing. It is not exactly the same as GSD in reference to elevation models. GSD refers to the spacing of the actual measurements, whereas post spacing refers to the interval of the interpolated product generated from those measurements. The term post spacing is often used to mean GSD. This report follows the more formal definitions, but the reader should be aware of the ways these terms are commonly used (or misused) in industry literature.
4.1.3
Principles of Accuracy Assessment and Standards
Now that all of the necessary terms have been defined, how do we quantify and make definitive statements about the accuracy of an elevation model? It has been pointed out that it is impossible to make an assessment of spatial accuracy relative to “absolute truth.” Instead, spatial accuracy is estimated based on a comparison of one measured dataset to another independent one of higher accuracy; so in a sense, all spatial accuracy statements are relative. Elevations are measured relative to a vertical datum, and the vertical datum itself is an approximation of something ideal such as “mean sea level,” which cannot be exactly and completely known because it is by definition an average. We cannot say absolutely that a particular elevation is accurate to within 1 foot, 1 inch, or 1 millimeter of its true value. However, we can express the level of confidence we have in a measurement based on a framework of statistical testing. We can say we have a level of confidence (e.g., 90 percent, 95 percent) that our measurement is within a certain tolerance of a “true” value.
The National Map Accuracy Standards (NMAS) of 1947 (U.S. Bureau of the Budget, 1947) defined the vertical accuracy for printed contour maps with a published scale and contour interval. These accuracy standards predate digital data and are not appropriate for
evaluating and reporting the vertical accuracy of DEMs. However, contours are still so intuitively attractive and historically ingrained that the habit of defining data requirements and describing elevation products with outdated NMAS language has persisted.
In response to the need for scale-independent accuracy assessment and reporting presented by digital data, the Federal Geographic Data Committee (FGDC) published the National Standard for Spatial Data Accuracy (NSSDA) (FGDC, 1998), which provides guidance on the implementation of a statistical methodology for determining positional accuracy. The NSSDA is predicated on a basic assumption that identification and removal of all sources of systematic error in spatial measurement yields a normal distribution of random errors. The sample dataset is compared to an independent source of higher accuracy (defined in the NSSDA as the highest accuracy feasible and practicable). As a general rule, the reference data ought to be at least three times more accurate than the sample data. The root mean square error (RMSE) as calculated between the sample dataset and the independent source is converted into a statement of vertical accuracy at an established confidence level, normally 95 percent, which is simply the RMSE multiplied by 1.96. Table 4.1 shows the relationship between the intuitive and familiar NMAS and Vertical Map Accuracy Standard (VMAS) language for equivalent contour interval and the statistically based NSSDA standards.
The important point is that a statement such as “technology X is capable of achieving 18.5-centimeter accuracy” is meaningless. Examples of correct statements having the same meaning are the following:
-
Technology X is capable of producing elevation data that meet 18.5-centimeter vertical RMSE (RMSEz).
-
Technology X is capable of producing elevation data that meet 36.3-centimeter vertical accuracy at the 95 percent confidence level.
TABLE 4.1 Comparison of NMAS and NSSDA Vertical Accuracy
|
NMAS Equivalent Contour Interval |
NMAS VMAS 90% Confidence Level |
NSSDA RMSEz |
NSSDA Accuracyz 95% Confidence Level |
|
1 ft |
0.5 ft |
0.30 ft or 9.25 cm |
0.60 ft or 18.2 cm |
|
2 ft |
1.0 ft |
0.61 ft or 18.5 cm |
1.19 ft or 36.3 cm |
|
4 ft |
2.0 ft |
1.22 ft or 37.0 cm |
2.38 ft or 72.6 cm |
|
5 ft |
2.5 ft |
1.52 ft or 46.3 cm |
2.98 ft or 90.8 cm |
|
10 ft |
5.0 ft |
3.04 ft or 92.7 cm |
5.96 ft or 181.6 cm |
|
20 ft |
10.0 ft |
6.08 ft or 185.3 cm |
11.92 ft or 363.2 cm |
|
SOURCE: Maune et al., 2007. Reprinted with permission from ASPRS. |
|||
-
Technology X is capable of producing elevation data that meet the NMAS standard for 2-foot contours, which means that 90 percent of tested points will fall within 1 foot of ground truth, or one-half the contour interval.
Throughout this report, the term “equivalent contour interval accuracy” is used. Table 4.1 can be used to relate the equivalent contour interval accuracy to RMSE or 95 percent confidence level. The referenced FGDC documentation covers the details of testing methodologies and accuracy requirements in depth.
4.2
PHOTOGRAMMETRY
4.2.1
Concepts
Photogrammetry is defined by the American Society for Photogrammetry and Remote Sensing (ASPRS) as the art, science, and technology of obtaining reliable information about physical objects and the environment through processes of recording, measuring, and interpreting photographic images and patterns of recorded radiant electromagnetic energy and other phenomena. This broad definition could be applied to all of the technologies discussed in this chapter; however it is used here to refer specifically to mapping performed using film or digital aerial photography. Products created from photogrammetry include the following:
-
Two-dimensional planimetric maps and three-dimensional feature datasets,
-
Elevation models, and
-
Digital orthophoto base maps.
The size, or scale, of objects in an aerial photograph varies with terrain elevation and with the tilt of the camera with respect to the ground, as shown in Figure 4.2. Accurate measurements cannot be made from an aerial photograph without rectification, the process of removing tilt and relief displacement. In order to use a rectified image as a map, it must also be georeferenced or tied to a ground coordinate system.
If aerial photographs are acquired such that there is overlap between them, then the objects can be seen from multiple perspectives, creating a stereoscopic view, or stereomodel. The apparent shift of an object against a background due to a change in the observer’s position is called parallax. Following the same principle as depth perception in human binocular vision, heights of objects and distances between them can be measured precisely from the degree of parallax in image space if the relative orientation of the overlapping photos to each other is known (Figure 4.3). If the absolute orientation of the stereomodel to the ground coordinate system is known, then these heights and distances can be measured and recorded in map units such as feet or meters.
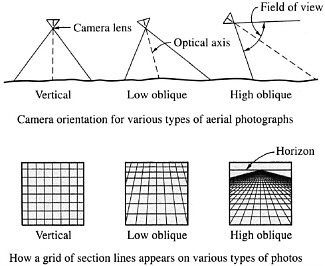
FIGURE 4.2 Camera orientation and scale effects for vertical and oblique aerial photographs. SOURCE: Wolf and Dewitt, 2000. Reprinted with permission.
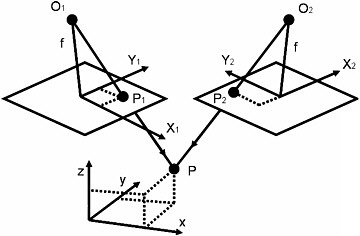
FIGURE 4.3 Photogrammetry uses multiple views of the same point on the ground from two perspectives to create a three-dimensional image. SOURCE: Image courtesy of David Maune, Dewberry and Davis.
Aerotriangulation is the method used to establish relative and absolute orientation of large blocks of stereoscopic aerial photos. A rigorous mathematical model recreates the geometry of the block; overlap along the flight strip and side lap between flight lines create redundancy and overdetermine the solution of the mathematical model (Figure 4.4). A least-squares adjustment is used to compute the aerotriangulation solution, finding the “best fit” to the redundant observations by minimizing the sum of the squares of the residuals as an RMSE. Statistically based accuracy assessments express the quality of aerotriangulation results.
Historically, surveyed ground points were used to control the block geometry and provide georeferencing. Today, some ground points may still be required for correct referencing to the mapping datum, but the primary source of aerotriangulation control is provided by GPS and inertial measurement units (IMUs) in the aircraft. This application of technology, measuring the location of the camera focal point and the angular orientation of the focal plane at the time of exposure, is known as direct georeferencing. These measurements are included in the aerotriangulation, replacing ground control while increasing redundancy and adding statistical significance to the adjustment results.
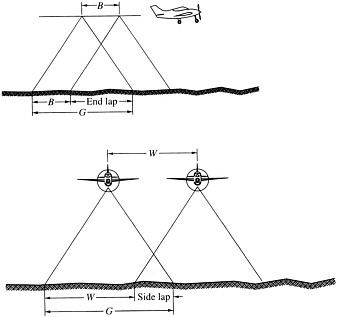
FIGURE 4.4 Overlap in the direction of flight is called end lap; overlap of adjacent flight strips is called side lap. SOURCE: Wolf and Dewitt, 2000. Reprinted with permission.
Extracting feature information from stereo aerial photos begins once aerotriangulation is complete. Several manual approaches can be used to collect elevation data:
-
Drawing contours of constant elevation;
-
Profiling on a regular grid, following elevation along the profile, and digitizing elevations automatically at preset post spacing for a DEM; and
-
Capturing mass points and breaklines and generating a digital terrain model (DTM).
These methods are well established but also labor and time intensive. Mapping a typical county by these methods requires many man-months and is not a practical, time-efficient, or cost-effective approach to mapping entire states or the nation. Furthermore, the human’s ability to interpret the elevation of ground beneath dense vegetation is limited by the ability to find the ground in the shadows between trees. Commonly, these areas are designated as “obscured” or shown with dashed contours on a map.
Much research has gone into automated extraction of elevation data from aerial photos using digital image correlation. Digital image correlation is accomplished by comparing pixel patches on conjugate images or features, such as edges of linear objects, derived from the digital images. Autocorrelation, as this technique is often called, can develop a surface over a large area very quickly, but still requires intensive human editing to produce a clean, bare-earth elevation model. Autocorrelation does not distinguish between bare ground and features above the ground; trees and buildings lean in different directions on overlapping photos, making matching of pixel patches difficult. The problem of seeing the ground in shadows and between trees in heavily vegetated areas still exists. Correlation techniques can generate very dense elevation points, but they do not automatically delineate key features such as ridges, drains, and road edges with breaklines, as would a human map compiler. Autocorrelation is most effective for creating digital surface models (DSMs) for applications that do not require distinguishing between objects, trees, and bare ground.
Using the orientation information derived from aerotriangulation and an elevation model representing the terrain, an aerial photo can be resampled into a scale-constant image map, in which the effects of tilt and relief displacement are removed. This process is called orthorectification. The resulting orthophoto has the interpretive qualities inherent in the photo, yet accurate measurements can be made just as from line maps.
Traditionally, orthophotos are created using bare-earth elevation models; tops of buildings are not corrected to their true positions and, because of camera perspective, appear to lean away from the center of the photo. Rectification with a DSM, on the other hand, which includes building heights, produces a “true orthophoto” in which the rooftops are aligned correctly with building footprints (Figure 4.5). The advantage of a true orthophoto is that features on the ground are not obscured by the leaning building, and building footprint polygons, digitized in their correct location, do not conflict with the image of the building
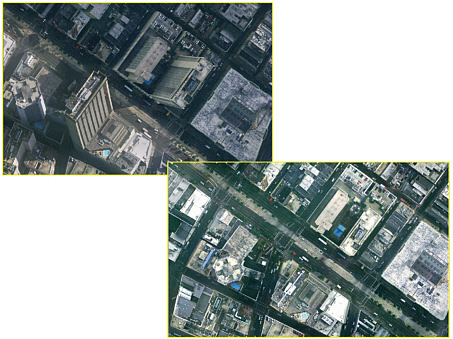
FIGURE 4.5 In a conventional orthophoto, the rooftops of buildings are displaced from their true horizontal location due to the camera perspective. In a true orthophoto, building rooftops are properly aligned with the building footprint. SOURCE: EarthData International.
when overlaid on the orthophoto. In rural areas with few tall buildings, conventional orthophotos created from bare-earth elevation models are sufficiently accurate and cost-effective. In urban areas, the additional expense of creating a DSM for orthorectification can be worthwhile to gain the benefits described above. Digital orthophotos, whether true or conventional, make very useful base maps for geographic information systems (GIS) and have become very popular with local, state, and federal government agencies for a wide variety of purposes, from tax assessment, to urban and regional planning, resource management, and emergency response.
Photogrammetric mapping methods can be performed on oblique aerial or ground-based (close-range) stereo photography to extract accurate three-dimensional measurements of structures, including doors, windows, street furniture, culverts, and bridges. Oblique and close-range photogrammetry have found a variety of applications including architectural design, accident scene reconstructions, movie sets, archaeological surveys, and civil engineering surveys.
4.2.2
Instrumentation
Three types of sensors are used for photogrammetric mapping and image products: airborne film cameras, airborne digital mapping cameras, and satellite imaging sensors. Each has particular characteristics, advantages, and disadvantages, but the principles of elevation model extraction and image rectification are the same.
Film cameras have been in use for decades. High-precision manufacturing of camera elements such as lens, body, and focal plane; rigorous camera calibration techniques; and continuous improvements in electronic controls have resulted in a mature technology capable of producing stable, geometrically well-defined, high-accuracy image products. Lens distortion can be measured precisely and modeled; image motion compensation mechanisms remove the blur caused by aircraft motion during exposure. Aerial film is developed using chemical processes and then scanned at resolutions as high as 3,000 dots per inch. In today’s photogrammetric production environment, virtually all aerotriangulation, elevation, and feature extraction are performed in an all-digital, or soft copy, work flow. There is no development being done on aerial film cameras, and commercial manufacturers have discontinued their production as digital cameras mature and become more affordable.
Airborne digital mapping cameras have evolved over the past few years from prototype designs to mass-produced operationally stable systems. In many aspects, they provide superior performance to film cameras, dramatically reducing production time with increased spectral and radiometric resolution. Detail in shadows can be seen and mapped more accurately. Panchromatic, red, green, blue, and infrared bands are captured simultaneously so that multiple image products can be made from a single acquisition (Figure 4.6).
Digital camera designs are of two types: mosaicked area arrays and linear push-broom sensors. The mosaicked area array uses multiple two-dimensional charge-coupled device (CCD) arrays to create a combined image equivalent to a single frame image from an aerial film camera. With this type of system, the same principles discussed in Section 3.2.1 of flight planning, optional direct georeferencing, aerotriangulation block adjustment, and rectification apply. The push-broom sensor comprises multiple linear arrays, facing forward, down, and aft, which simultaneously capture along-track stereo coverage not in frame images, but in long continuous strips made up of lines 1 pixel deep (Figure 4.7). Reconstruction of relative and absolute orientation is more mathematically complex, and because there are no rigid image frames, direct georeferencing information for each image line is mandatory (Figure 4.8).
High-resolution satellite imagery is now available from a number of commercial sources, both foreign and domestic. The federal government regulates the minimum allowable GSD for commercial distribution, based largely on national security concerns; 0.6-meter GSD is currently available, with higher-resolution sensors being planned for the near future (McGlone, 2007). The image sensors are based on a linear push-broom design, which mean
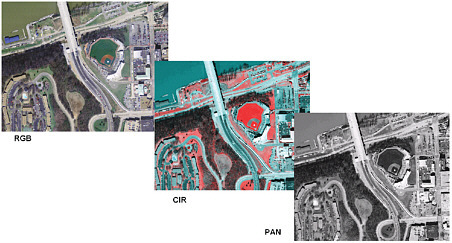
FIGURE 4.6 With an airborne digital camera, images can be captured simultaneously in true color (RGB), false-color infrared (CIR), and gray-scale (also called panchromatic) (PAN). SOURCE: EarthData International.
that each cross-track line of pixels in the image is a distinct geometric object; reconstructing seamless, along-track, image geometry requires precise direct georeferencing information for every line in the image and is more complex than aerotriangulation block adjustment. Each sensor model is unique and contains proprietary design information; therefore, the sensor models are not distributed to purchasers or users of the data. Satellite imagery can be collected with overlap to create stereo models; however, the difference in perspective from one image to the next, from high orbital altitudes, reduces depth perception and makes elevation extraction difficult.
4.2.3
Products and Accuracies
Photogrammetry is a mature technology for the production of many standard mapping products:
-
Planimetric (two-dimensional) maps of roads, buildings, drainage features, utilities, and so forth;
-
Digital orthophoto base maps; and
-
Elevation data in a variety of forms: profile, cross section, contour, DEM, DTM, DSM, or triangulated irregular network (TIN).
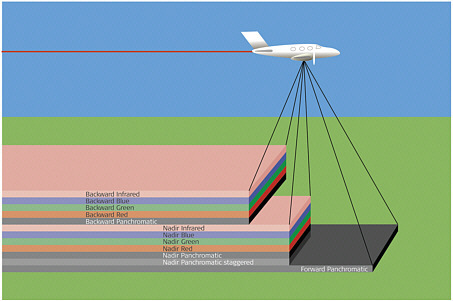
FIGURE 4.7 Configuration of multiple linear CCD arrays for the Leica ADS40 airborne digital camera. SOURCE: George Southard, Leica Geosystems, 2006, presentation to the committee at a workshop held on October 17-19; presentation available through the National Academies Public Access Records Office and at http://dels.nas.edu/besr/FpMT_workshop_presentations.shtml [accessed December 18, 2006]. See Appendix B for workshop agenda. Used with permission from Leica Geosystems, Inc.
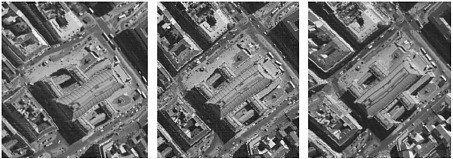
FIGURE 4.8 Raw imagery from backward, nadir, and forward linear PAN arrays of the Leica ADS40 airborne digital camera. Distortions are caused by motion of the aircraft and are removed using direct georeferencing information collected with GPS-IMU sensors integrated with the camera system on the aircraft. SOURCE: EarthData International.
Manual techniques are generally used to capture planimetric features, spot heights, breaklines, profiles, and cross sections. Automated techniques are generally used for capture of elevation grids, autocorrelation of DSMs, and rectification of digital orthophotos. Contour generation is automated, based on DTM or DEM data models, but extensive editing is required to produce smooth, cartographically pleasing contours that meet map accuracy specifications.
Based on ASPRS published photogrammetric standards, the U.S. Army Corps of Engineers (USACE) has developed detailed specifications for map accuracies as a function of map scale and flying height (USACE, 2002). The key point to take away from this discussion is the fact that relationships between flying height, aerotriangulation, map scale, contour interval, image resolution, and statistical assessments of accuracy are very well known for photogrammetry. Best practices have been developed and maintained by the professional community. Documented standards and specifications exist to help contracting agencies and end users define the photogrammetric products that best serve their application needs. Base map imagery can be either black and white or color. These and other characteristics of the base map are normally determined by local communities as part of the scoping process for their particular application. Black and white base map imagery is often preferable if a lot of vector data need to be plotted as an overlay; depending on the nature of the land itself, it may be difficult to find colors for plotting the vector data that consistently stand out when overlaid on a color image.
4.2.4
Section Summary
Photogrammetry is a mature technology that has benefited from decades of development and practical experience. Accuracies do not have to be tested for every individual mapping project; a wealth of empirical evidence shows that if best practices are followed by the photogrammetric professional, the results are consistent and predictable. However, photogrammetry is not cost or time effective enough to support the current demand for accurate, up-to-date elevation data for the nation.
The enabling technology of direct georeferencing was first implemented in the highly controlled world of photogrammetry, where it was considered an enhancement rather than a necessity. Sources of error were identified, and many technical improvements were made that increased geopositioning accuracy in airborne environments. Direct georeferencing becomes a necessity for some digital camera systems and for all light detection and ranging (lidar) and interferometric synthetic aperture radar (IFSAR) systems. The lessons learned from photogrammetric applications accelerated the rapid adoption of these new mapping technologies.
The principles of error modeling and accuracy assessment for photogrammetry are well understood and have developed into straightforward specifications for mapping projects and products. As we move toward new technologies to create the same mapping products
more quickly and cost-effectively, we must strive for the same statistical rigor. However, each new technology poses unique questions about data and product characterization, and the methods of accuracy assessment must be expanded in order to address them adequately.
4.3
LIGHT DETECTION AND RANGING
4.3.1
Concepts
Lidar is an active remote sensing technology that uses a laser to measure distances to target points. Because it generates its own energy, lidar surveys can be carried out at any time of day or night, and in some slightly cloudy or hazy conditions. The laser transmitter emits a short pulse of coherent light in a very narrow (monochromatic) wavelength band that travels to the target and is reflected back. A very accurate clock is used to measure the time difference between the transmitted pulse and the return echo. The distance to the object, or range, is calculated by multiplying the elapsed time by the speed of light and dividing by 2. Scanning the target by moving the laser records the three-dimensional surface of the target as a mass or cloud of individual points. The strength of the echo as a fraction of the transmitted energy is also recorded; images constructed using these intensity values can be useful for feature extraction.
Having measured a very precise distance to an object is useful for mapping only if the absolute position and the pointing direction of the laser are known with respect to a fixed coordinate system. Direct georeferencing is the key enabling technology that makes lidar useful for mapping. GPS and IMU track the position and attitude of the aircraft-sensor system; precise encoders track the pointing direction of the laser device with respect to the aircraft-sensor system. The three-dimensional point coordinates are in the operational coordinate system, which is the WGS84 ellipsoid. The z coordinate is not yet an elevation; it is a height with respect to the ellipsoid. A geoid model, such as GEOID03, must be used to convert the ellipsoid height to an orthometric height referenced to NAVD88.
Accurate georeferencing of lidar data requires careful mounting and calibration of the sensor in the aircraft; best practices dictate that calibration checks be conducted as part of every lidar project. The elevation model produced from each flight mission should also be checked against a distribution of ground control points with published ellipsoidal and orthometric heights in the appropriate mapping datum. A simple calibration range can be established at the airport base of operations and a pattern of overlapping flight lines flown at the beginning and end of each data acquisition mission. This type of cost-effective “best practice” is the responsibility of the mapping professional as part of project design and quality assurance.
The transmitted lidar pulse is actually a coherent waveform that could hit a solid object and be reflected back in one coherent return. The waveform could also, for example, be
partially reflected by leaves and branches near the top of a tree, again be partially reflected by understory vegetation, and finally be reflected by the ground at the base of the tree (Figure 4.9). Some lidar systems evaluate the entire waveform of the reflected signal; others record only the timing and intensity of discrete returns corresponding to significant peaks in the reflected signal. More recently, advanced systems are implementing single-photon ranging techniques, whereby the distribution of target heights can be efficiently built up from very low power, very high repetition-rate laser pulses. Commercial mapping lidar systems are most often of the discrete-return type, recording up to five reflections per transmitted
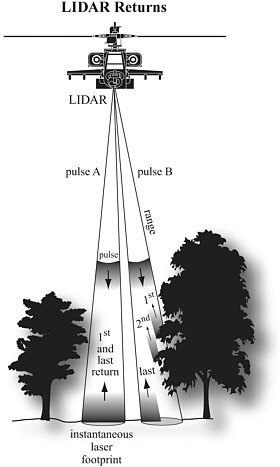
FIGURE 4.9 Multiple lidar echoes from a single transmitted pulse are returned from tops of trees and branches. SOURCE: Jensen, 2006. Reprinted with permission from Pearson Education, Inc.
pulse; the set of points made up of all the first-and-only or last-of-many returns is the starting point for the bare-earth elevation model. Waveform lidar requires much more storage and more complex data processing; this type of system is most often used in research applications such as the study of the detailed structure of vegetation canopy.
When lidar was first proposed as an effective elevation mapping technology, great concern was expressed about the performance of lidar systems and processing algorithms in heavy vegetation. What quickly became apparent, especially with multiple-return systems, was that lidar actually could “see” the ground between trees much more effectively than a photogrammetrist could when looking at a stereo pair of aerial photos. For lidar to record a ground point, only a single laser beam has to make it to the ground through the canopy. In other words, if a person walking through a forest looking up can see the sky, then a lidar pulse can probably reach the ground, depending on its angle of incidence. The same point on the ground is less likely to be seen in multiple stereo photographs taken from different perspectives. Furthermore, reading the elevation of a point on the ground in a stereo model in vegetation requires the human operator to interpret a projection of multiple, shadowy images. Lidar has proved to be far less ambiguous; however, the problem of filtering non-ground points out of the bare-earth elevation model remains with lidar data and must be addressed with further data processing, editing, and quality control.
Images can also be created from lidar returns by recording the amount of energy, or intensity, reflected back from the object. Since the laser is monochromatic, lidar intensity images are commonly presented in gray-scale (Figure 4.10). Objects with high reflectivity for the infrared wavelength of the laser will be bright, and objects with low reflectivity will be dark. Infrared reflectivity has long been used to distinguish vegetation and water bodies
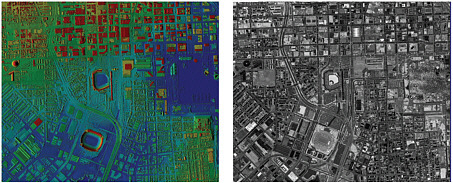
FIGURE 4.10 Lidar DSM (left) and gray-scale intensity image (right). Images show first return lidar data of Baltimore, Maryland. SOURCE: Fowler et al., 2007. Reprinted with permission from ASPRS.
and to delineate land cover in optical infrared imagery. These interpretive techniques are not straightforward to apply to lidar intensity imagery for the following reasons: the outgoing energy of the laser is purposely varied during a flight mission to optimize the accuracy of the laser ranging (distance) measurement, causing instrument-induced brightness variations that cannot be corrected by calibration; the reflectance of surface materials varies based on the angle of incidence of the laser beam as well as surface composition and roughness; and energy in the single transmitted pulse is attenuated during each one of multiple reflections. Since the lidar spots are spaced somewhat randomly on the ground, intensity values for each return pulse are resampled to a regular grid so that they can be displayed with imaging software.
A recent breakthrough in lidar mapping is the technology of lidargrammetry, a process for creating pseudostereo pairs of images from lidar intensity data. These images can be used in conventional soft copy photogrammetry systems to digitize linear features such as roads, buildings, edges of water bodies, and DTM breaklines very accurately in three dimensions.
Lidar systems can also be mounted on tripods or vehicles for close-range mapping of structures. Commercially available terrestrial lidar scanners can collect hundreds of thousands of points per second over a 360-degree field of view at millimeter accuracy. These instruments are gaining broad acceptance in the surveying profession and are used extensively to create accurately georeferenced, detailed, three-dimensional models of transportation infrastructure, urban cityscapes, building interiors, and industrial plants. Terrestrial lidar offers potential advantages, cost savings, and time efficiencies for collecting the survey data required for hydraulic modeling.
4.3.2
Commercial Instrumentation
Commercial lidar instruments are built by a number of manufacturers, and each follows a slightly different design. However, most use a common ranging determination approach (discrete returns) for which several parameters are important in defining system performance:
-
Laser wavelength; all commercial systems operate in the near-infrared, most commonly at 1,064 μm.
-
Pulse repetition rate varies by manufacturer and sensor model, with a maximum of 150 kHz (150,000 pulses per second). Several sensor manufacturers have released multiple-pulse-in-the-air (MPIA) technology, which allows a second pulse to be emitted before all the returns from the first pulse have been received—this raises the effective limit on pulse rate imposed by flying height.
-
Scan rate varies by manufacturer between 25 and 40 Hz.
-
Scan angle varies by manufacturer, but is usually limited by best practice to 40 degrees for maximum penetration of vegetation and minimal geometric distortion.
-
Number of return pulses captured varies by manufacturer from 1 (first-return-only or last-return-only) up to 5. In practice, fourth and fifth returns are rarely observed.
-
Point density is a function of flying altitude, pulse rate, scan rate, and scan angle. With earlier systems, densities of 1 point per 3-5 square meters were common; with today’s state-of-the-art systems and MPIA technology, it is possible to achieve densities of 5-10 points per square meter.
The number of lidar systems in commercial operation worldwide has increased dramatically in the past 10 years (Table 4.2) from 3 in 1995 to nearly 150 in 2005. These increasing numbers indicate the maturity of the technology and the competitive nature of the industry.
Depending on the choice of laser wavelength, airborne lidar can be used for topographic or bathymetric mapping. Lidar systems can also be mounted on tripods; vehicles or ships are used to map structures in urban or industrial environments or to monitor environmental parameters. Although these other applications are not discussed in this report, bathymetric lidar can make important contributions to coastal storm surge modeling and flood hazard mapping, and ground-based lidar systems can be used to survey bridges, culverts, and other structures of importance in hydraulic modeling.
TABLE 4.2 Number of Lidar Sensors in Commercial Operation
|
Year |
New Instruments |
Total Instruments |
|
1995 |
3 |
3 |
|
1996 |
6 |
9 |
|
1997 |
2 |
11 |
|
1998 |
9 |
20 |
|
1999 |
18 |
38 |
|
2000 |
20 |
58 |
|
2001 |
13 |
71 |
|
2002 |
7 |
78 |
|
2003 |
17 |
95 |
|
2004 |
32 |
127 |
|
2005 |
20 |
147 |
|
SOURCE: Fowler et al., 2007. Reprinted with permission from ASPRS. |
||
4.3.3
Products and Accuracies
Lidar naturally produces a detailed DSM. With post processing, all other types of elevation models can be derived from lidar data including DTM, DEM, breaklines, contours, and three-dimensional feature data. It is worthwhile to distinguish between the accuracy of a single lidar pulse (system accuracy) and the accuracy of the derived elevation model (product accuracy). System accuracies are a function of flying height above ground level (AGL); vertical accuracies quoted by manufacturers range from 6-centimeter RMSE at 500 meters AGL to 23-centimeter RMSE at 6,000 meters AGL; horizontal accuracies are 7- to 64-centimeter RMSE for the same altitudes, respectively.
Vertical accuracy of 18.5-centimeter RMSE, which was previously shown to correspond with 2-foot equivalent contour accuracy, is achievable from flying heights of 3,000-5,000 meters AGL, which is the preferred operating range for most aircraft used by commercial mapping vendors. Existing principles of mission planning, cost estimation, and acquisition schedules derived from many years of photogrammetric experience can be applied directly to statewide and nationwide lidar mapping projects aimed at this accuracy specification. Lower flights can achieve 1-foot equivalent contour accuracy the committee concludes is needed in very flat areas.
Product accuracy is a function of the lidar system accuracy and the mission planning, data processing, and product generation techniques. The 2-foot equivalent contour accuracy can be met reliably if best practices are followed in data acquisition and processing with lidar; 1-foot equivalent contour accuracy is more challenging to achieve but can be met with a more stringent (and more expensive) project approach. In mountainous or very densely vegetated areas, significant additional manual effort may be required to produce an acceptable 2-foot equivalent contour accuracy end product from the same acquisition and processing techniques routinely used in less challenging terrain. Methodologies for testing lidar-derived elevation products have been published by ASPRS (2004), the National Digital Elevation Program (NDEP, 2004), and FEMA (2003). These testing methodologies are based on the use of ground checkpoints, following NMAS and NSSDA specifications for accuracy reporting.
4.3.4
Section Summary
Lidar is a powerful and cost-effective means for high-speed acquisition of three-dimensional point data to suit a wide variety of user requirements and is the most robust remote sensing technology for the creation of seamless statewide and nationwide elevation models. Like any remote sensing technology, human interaction is still required for the production of clean, bare-earth datasets and linear feature mapping. Research into automated filtering and feature extraction contributes incrementally to increased production efficiency; these
improvements are quickly transformed by data providers into cost and time savings to end users. Improvements in the remote sensing and direct georeferencing instrumentation are also contributing to improvements in the quality of the data and the efficiency of automated processing.
The importance of lidargrammetry and its impact on the cost-benefit model for lidar mapping cannot be overstated. The prior necessity to collect aerial photography in addition to lidar data to meet the requirements for breaklines and planimetric feature mapping was a real stumbling block for data providers and end users. Lidar could clearly provide a superior elevation model of mass points, but the need to use photogrammetry to complete other required mapping tasks resulted in two distinct and separate aerial missions and much higher costs. Lidargrammetry has paved the way for a much more effective and efficient use of lidar technology for detailed and complex elevation modeling, satisfying the engineering need for breaklines to support TIN generation without sacrificing the richness of the dense lidar mass point data. While lidargrammetry offers amazing potential to digitize planimetric features directly from lidar data, the corresponding planimetric accuracy compared to photogrammetry needs to be studied and quantified.
The current guidelines and standards of accuracy testing and reporting do not address all of the questions that could be asked about the quality of lidar-derived mapping products. The attempts by NDEP, ASPRS, and FEMA to establish guidelines and specifications are a step in the right direction, but they do not go far enough. For example, the relationship between lidar point spacing and elevation model accuracy is complex and not easily quantified, particularly with rapidly changing technology that allows dense point spacings to be easily achieved and processed to bare-earth elevation models. The point spacing question may also be important in determining the necessity for the delineation of linear features, such as breaklines, as a supplemental deliverable. Better ways of measuring and reporting quality and accuracy are needed to account for the appropriate sources and the spatial variability of error. In the closing session of the 2006 ASPRS-Management Association for Private Photogrammetric Surveyors (MAPPS) Specialty Conference on November 10, 2006, in San Antonio, Texas, Paul Rooney of FEMA stated, “Our current methods of testing do not adequately characterize the data.” The community of experts in remote sensing and mapping, with representation from government, private industry, and academia, has the ability to fill this gap if provided with clear direction and the mandate to do so.
4.4
INTERFEROMETRIC SYNTHETIC APERTURE RADAR
4.4.1
Concepts
Radar (radio detection and ranging) measures the strength and the round-trip time of a microwave signal (3-40,000 MHz) emitted by a radar antenna and reflected as an echo off a
distant surface or object. Radars mounted on aircraft or satellites move along a flight path, illuminating the earth’s surface in a swath, building an image from pulse energy reflected back to the antenna, which is called backscatter. The brightness value in the image is determined by the strength of the backscatter, which is a function of surface composition and roughness.
The length of the radar antenna in the along-track direction determines the image resolution: the longer the antenna, the finer the resolution. Synthetic aperture radar (SAR) refers to a technique used to synthesize a very long antenna from the motion of the aircraft along the flight track. The radar antenna is oriented in a direction perpendicular to the flight path, called the range or cross-track direction. The antenna transmits pulses very rapidly, recording and combining the echoes as if they were sensed with a very long antenna (Figure 4.11).
Conventional SAR systems measure only two coordinates: one lies along an axis oriented parallel to the flight direction; the other is the range (or distance) from the antenna
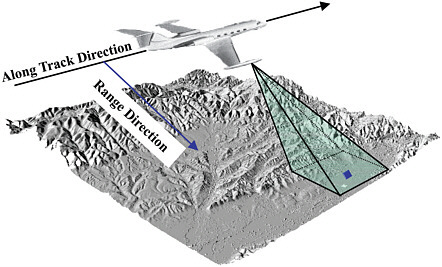
FIGURE 4.11 SAR imaging geometry. A typical SAR imaging geometry has a platform containing a radar instrument moving in the along-track direction and imaging the terrain to one side of the flight path. The SAR transmits a series of pulses at regular intervals along the track that simultaneously illuminates an area in the along-track direction much greater than the desired azimuth resolution. By recording the returned echo from each pulse and using signal processing techniques to “synthesize” a larger antenna, fine resolution in azimuth is achieved. The blue square in the center of beam shows the size of a resolution element compared with the illuminated area from a single pulse indicated in green. SOURCE: Hensley et al., 2007. Reprinted with permission from ASPRS.
to the point being imaged. With two SAR antennas separated spatially in the cross-track plane it is possible to measure the location of the image point in three dimensions with a high degree of accuracy (Figure 4.12). Measurement of the third coordinate is based on a measurement of the range between the two radar signals, which in highly simplified terms can be likened to the parallax between two stereo aerial photographs. The range difference is determined from the phase difference between two coherent radar signal echoes using a technique called interferometry. Such SAR systems are referred to as interferometric synthetic aperture radar (IFSAR or InSAR).
Another technique of interferometry involves using two sets of range measurements collected at different times, rather than two spatially separated antennas. Very small changes or shifts can cause phase differences between the two sets of measurements. Accounting for these phase differences involves processing the radar echo data in order to detect phase differences in the raw signal. The magnitude of the terrain shift that is detectable depends on the wavelength of the radar and can be as small as millimeters. This type of interferometry is used to study surface deformations due to seismic forces, subsidence due to water or oil pumping, and glacier motion.
Radar interferometry requires precise knowledge of the position and attitude of the radar antennas relative to each other and in an absolute sense with respect to the ground
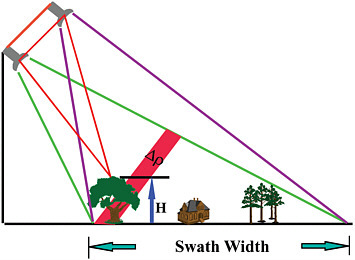
FIGURE 4.12 IFSAR imaging geometry. Interferometric SAR for topographic mapping uses two apertures separated by a “baseline” to image the surface. The phase difference between the apertures for each image point, along with the range and knowledge of the baseline, can be used to infer the precise shape of the imaging triangle (in red) to determine the topographic height of an object. SOURCE: Hensley et al., 2007. Reprinted with permission from ASPRS.
coordinate system. On airborne platforms, this information is derived using the same direct georeferencing instrumentation and methods used in photogrammetry and lidar; star trackers coupled with IMUs are used on spaceborne platforms.
As previously stated, image brightness is determined from backscatter, which is proportional to surface roughness and composition (Figure 4.13). Bright features indicate that a large fraction of the transmitted energy was reflected back to the radar, whereas dark areas indicate that little energy was reflected. Rough surfaces appear bright; flat surfaces appear dark. Surfaces inclined toward the radar reflect more energy than surfaces inclined away from the radar and appear bright; surfaces inclined away from the radar reflect less energy and appear dark. The strength of the reflection also depends on the dielectric constant of the surface material: wetter objects will appear bright and drier objects will appear dark. The exception is a smooth body of water, which will act as a flat surface and reflect incoming pulses away from the antenna, appearing dark or as an image void. How rough a surface appears to radar depends on the wavelength of the radar pulse. A surface that appears smooth at one wavelength may appear rough at another. Shorter wavelengths in the X-band interact with the leafy crowns and smaller branches of vegetation, following the top of the canopy. Longer wavelengths in the P-band interact with larger branches and trunks, penetrating deeper into the canopy and following the ground surface more closely. Table 4.3 shows the
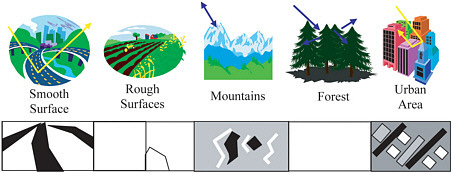
FIGURE 4.13 Five common ground cover types found in SAR imagery. Smooth surfaces such as roads or water tend to reflect energy away from the radar and appear dark in radar images. Rough surfaces, often found in fields and cropland, exhibit a type of checkerboard pattern with the texture and brightness level varying with crop and field condition. Extremely bright lines running parallel to the look direction as a result of layover coupled with shadowed regions are typically found in mountainous regions. Forested areas generally appear relatively bright since the rough nature of the canopy at most wavelengths generates high levels of backscatter. Depending on the resolution of the SAR, urban areas can show individual buildings or groups of buildings and the associated roadways. SOURCE: Hensley et al., 2007. Reprinted with permission from ASPRS.
TABLE 4.3 Frequency and Wavelength Relationships for Which Systems Exist to Collect Topographic Data
|
Frequency Band (MHz) |
Wavelength Range (cm) |
Band Identification |
|
26,500-40,000 |
1.13-0.75 |
Ka |
|
18,000-26,500 |
1.66-1.13 |
K |
|
12,500-18,000 |
2.4-1.66 |
Ku |
|
8,000-12,500 |
3.75-2.4 |
X |
|
4,000-8,000 |
7.5-3.75 |
C |
|
2,000-4,000 |
15-7.5 |
S |
|
1,000-2,000 |
30-15 |
L |
|
300-900 |
100-33 |
P or UHF |
|
30-300 |
1,000-100 |
VHF |
|
3-30 |
10,000-1,000 |
HF |
|
NOTE: Different conventions may be used to assign frequency bands and letter codes (see for example, http://www.radioing.com/eengineer/bands.html). SOURCE: Hensley et al., 2007. Reprinted with permission from ASPRS. |
||
relationship between frequencies, wavelengths, and band designation letter codes assigned by convention to describe operational radar systems.
Sophisticated image processing is required to form recognizable images from raw IFSAR data. Analysis differs significantly from aerial photo interpretation and requires specialized training. Three common features unique to SAR imagery (Figure 4.14) are the following:
-
Foreshortening is similar in concept to relief displacement in optical imagery but has the opposite effect. Slopes facing toward the radar will be imaged at nearly the same time with very similar ranges, depending on the relative angle of incidence of the radar beam. These sloping features appear closer together in planimetric view, compressed or bunched, compared to their actual position; they will also appear bright due to strong backscatter. Slopes facing away will conversely be dark and expanded or stretched compared to their actual positions.
-
Layover is an extreme case of foreshortening that occurs when the slope of the terrain is greater than the angle of incidence of the radar beam. The top of the object is imaged before the bottom, and the feature appears inverted or laid over in the image. Layover effects preclude useful determination of elevation.
-
Shadowing occurs when the radar beam is blocked from reaching parts of the terrain obscured by other objects. These areas appear in the image as dark or void areas
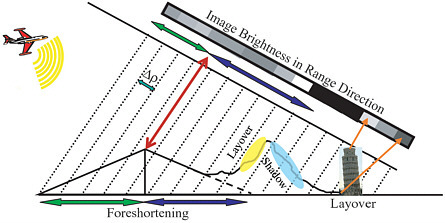
FIGURE 4.14 Foreshortening, layover, and shadow. The three-dimensional world is collapsed to two dimensions in conventional SAR imaging. After image formation, the radar return is resolved into an image in range-azimuth coordinates. This figure shows a profile of the terrain at constant azimuth, with the radar flight track into the page. SOURCE: Hensley et al., 2007. Reprinted with permission from ASPRS.
-
with no useful interferometric signal. As with layover, elevation values cannot be determined.
A high-level understanding of the steps involved in processing SAR data is useful for understanding potential error sources in IFSAR-generated DEMs.
-
Raw data stored onboard the aircraft are decoded and combined with direct geo-referencing information to create single-look images from each antenna.
-
One image for the single-look pair is resampled to overlie the other, and the two images are multiplied to form an interferogram. Registration of the two images must be achieved within a small fraction of a pixel to avoid phase decorrelation.
-
The absolute phase measurement (which represents the distance from the antenna to the target) is determined for each pixel in the interferogram in a process called phase unwrapping. Smoothing of the phase measurements is done to reduce phase noise and aid in the unwrapping process. This involves averaging the phase of a window, which is often larger than the post size of the DEM. Thus, the effective resolution of the final DEM product may be less than the post size depending on the terrain.
-
A three-dimensional target position is calculated from the unwrapped phase measurements. These measurements are interpolated to a gridded elevation map in a natural coordinate system aligned with the flight path.
-
Overlapping strips are mosaicked and combined into a seamless map product.
-
Heights (which may at this point be referenced to the ellipsoidal datum native to GPS) are corrected to the desired orthometric datum, and the grid is re-projected into the desired map projection.
-
Data gaps from layover, shadow, or low-signal regions may be filled by using data from other available sources or by surface fitting algorithms, depending on the size of the holes to be filled and the intended use of the DEM.
-
Data editing is performed to correct spikes and wells caused by phase unwrapping errors. Water bodies also require extensive editing to remove noise and to “flatten” the water surface.
-
Vegetation may be removed using techniques similar to those used in lidar data if there are sufficient elevation measurements of bare earth to employ surface fitting algorithms. Techniques using image brightness and correlation of dual-band signals have also been developed and used with some success. The importance of achieving a digital elevation model that is void of vegetation is described in Chapter 3 (see Section 3.10).
4.4.2
Instrumentation
IFSAR systems exist in a variety of configurations optimized for a diverse range of applications. Several important categories of IFSAR instruments are based on platform type (airborne or spaceborne) and method of data collection (single pass or repeat pass). Single-pass interferometry (SPI) means that observations were made at the same time with two SAR antennas on the same platform; in repeat-pass interferometry (RPI) the observations are separated in time by as little as a fraction of a second or as long as years. A number of RPI-based systems produce DEM products and images. However, the most accurate and reliable sources of IFSAR DEM data, relevant to this study, are SPI systems (Hensley et al., 2007).
One commercial IFSAR vendor currently operates four airborne IFSAR systems with one additional system to become operational in January 2007. STAR-3i operates in the X-band, which as a shorter-wavelength SAR reflects from near the top of canopy in vegetated areas. TopoSAR supports single-pass X-band and repeat-pass P-band acquisition. The STAR-4 systems are all X-band single-pass designs.
Another commercial vendor operates GeoSAR, a dual-frequency (X- and P-bands) SPI system designed to measure elevations at the top and bottom of vegetation canopy (Figure 4.15). The system has been operational since 2003. The system has also been augmented with a profiling lidar that collects elevation data at nadir with 15- to 20-centimeter RMSE accuracy. The lidar data are used to calibrate the GeoSAR data and to support processing of bare-earth terrain models with observations of the ground surface beneath canopy.

FIGURE 4.15 GeoSAR swath. GeoSAR collects 10-kilometer swaths simultaneously on the left and right sides of the aircraft at both X- and P-bands. SOURCE: Hensley et al., 2007. Reprinted with permission from ASPRS.
The National Aeronautics and Space Administration (NASA) and NGA sponsored the only spaceborne SPI system flown to date, the Shuttle Radar Topography Mission (SRTM), in February 2000. A 60-meter retractable boom was used to deploy C-band and X-band receive-only antennas; the second set of antennas was located in the shuttle’s cargo bay (Figure 4.16). In 10 days, IFSAR data were collected for nearly all land surfaces between 60 degrees north latitude and 54 degrees south latitude. The raw radar data were processed by NASA’s Jet Propulsion Laboratory (JPL). Contractors performed the final data editing and DEM product generation to NGA specifications.
4.4.3
Products and Accuracies
The STAR and TopoSAR systems produce three core products for distribution through licensing agreements: orthorectified radar images (ORIs), DSMs, and DEMs. The ORI images, created from X-band, have a 1.25-meter ground sample distance and a 2.0-meter RMSE. The elevation products range in accuracy from 1- to 3-meter RMSE. The accuracies apply to the surface mapped by IFSAR, which as has been seen may not always be the bare earth.
GeoSAR produces X-band and P-band ORI images from 50-centimeter to 5-meter GSD and 5-meter posting X-band and P-band DSMs and DEMs. GeoSAR acquisitions
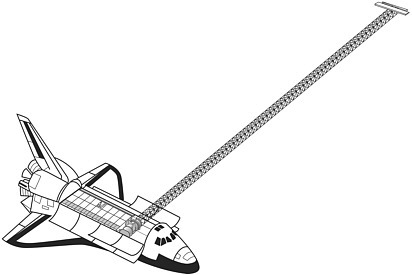
FIGURE 4.16 The SRTM flight system configuration. The SIR-C/X-SAR L-, C-, and X-band antennas were located in the shuttle’s cargo bay. The C- and X-band radar systems were augmented by receive-only antennas deployed at the end of a 60-meter-long boom. Interferometric baseline length and attitude measurement devices were mounted on a plate attached to the main L-band antenna structure. During mapping operations, the shuttle was oriented so that the boom was 45 degrees from the horizontal. SOURCE: Hensley et al., 2007. Reprinted with permission from ASPRS.
are tailored to project requirements; product accuracies are not quoted by the vendor, however it may be assumed that they are comparable to other commercially available IFSAR products. The uniqueness of GeoSAR is the ability to penetrate dense vegetation; GeoSAR data, once purchased by the buyer, can be distributed without restriction.
Data from the SRTM mission have been combined and formatted into 1-arc-second DEMs. Extensive validation and testing have been conducted by JPL, NGA, and other researchers and were reported in Rodriguez et al. (2005). The product exceeded design specifications; comparison with ground reference data indicated a vertical accuracy of 8 meters and a planimetric accuracy of 20 meters at the 90 percent confidence level (Hensley et al., 2007).
It should be stressed that in general, the IFSAR accuracies stated in the referenced tables pertain to the quality of the reflective surface model, not to a clean, bare-earth DEM. A local statistical height error map can be generated from the phase correlation measurements and provides the user with a point-by-point estimate of vertical DEM accuracy.
Ground reference data of at least three times better accuracy than the estimated IFSAR accuracy are used to validate the error model. Height error estimates are assumed valid for the entire dataset if at least 90 percent of the test points are within 20 percent of the values shown on the error map.
4.4.4
Section Summary
IFSAR has matured to the point where there are a limited number of commercially operated systems and products available from private sector vendors. Investment in an IFSAR mapping system is substantially more than that required for photogrammetry or lidar, and the data processing procedures and work flows overlap very little with these other mapping technologies in terms of hardware, software, and technical staff.
Future developments in IFSAR promise improved elevation and image products. Finer resolutions, increased height accuracy, and improved surface characterization have been achieved with experimental airborne systems. Differentiating heights of various physical surfaces, from treetops to bare earth, remains a significant research challenge. Fully polarimetric interferometers at multiple frequencies are the next technological leap to be made (Hensley et al., 2007). Development of new systems requires large research investments. Further innovation may require continued federal funding in support of scientific or defense-related programs of national interest, in addition to ongoing commercially funded research and technology projects.
Numerous spaceborne system concepts have been proposed to build on the success of STRM, but none have been approved for funding. Geosynchronous systems pointing continuously at a site of interest could measure very small changes in the surface conditions on an hour-by-hour basis, applications of which are diverse and important but of little benefit to the development of seamless bare-earth elevation models for the nation.
4.5
CHAPTER SUMMARY
The purpose of this chapter is to provide the fundamental concepts of remote sensing technologies for creation of elevation datasets and other base map products of interest to a national floodplain mapping program. The three technologies discussed in detail are photogrammetry, lidar, and IFSAR.
Photogrammetry is flexible in terms of the number of products that can be made from a single source: aerial photography. The technology is mature; sources of error are well understood and rigorously modeled. Photogrammetry has made a successful transition into the digital age with large-format digital aerial cameras and soft copy processing work flows. Many processes are automated, but detailed feature extraction tasks still require significant human involvement. Bare-earth elevation models are particularly time consuming
and labor intensive to create, making photogrammetry well suited to smaller mapping projects, with diverse information needs and conservative deadlines. The exception is fully digital orthophoto production; photogrammetry is capable of delivering large volumes of high-resolution, high-accuracy orthorectified imagery very quickly and has become the technology of choice for county, state, and nationwide image base mapping.
Lidar has recently developed into a robust operational technology for the production of large-area, high-resolution, high-accuracy, bare-earth elevation models. Because it is an active sensor that creates an elevation measurement from a single laser pulse, it can map the ground surface beneath vegetation canopy more reliably than either photogrammetry or IFSAR. It relies on the principles of airborne direct georeferencing that matured during the 1990s in the context of photogrammetric mapping applications. Many photogrammetric principles of data processing and product generation apply to lidar; software tools including stereo viewing and feature extraction systems have been adapted to work with lidar point and intensity data. Map accuracy assessment principles carried over from photogrammetric mapping standards are commonly used to define lidar project requirements; however, lidar presents new opportunities and challenges to rethink the way accuracies are measured and reported. This area could benefit from further research. Improvements in accuracy assessment and reporting are needed to fully characterize lidar-derived elevation datasets and to leverage them most effectively for a broad range of engineering and planning applications.
IFSAR is a unique and important technology for the creation of elevation models on a global scale and in localized regions of the earth perpetually covered by clouds. The elevation models are intrinsically of lower resolution and less accurate than those produced by either photogrammetry or lidar. Particular problems in both urban and vegetated areas exist. IFSAR ORI imagery is useful as a base map when no other imagery is available, but it may be difficult for the public to interpret. On the other hand, ORI imagery can be very useful if target detection or specific feature identification is the end user’s primary interest. Improvements in IFSAR technology have generated a 1.25-meter ORI which may make feature recognition more intuitive for non-experts to interpret. The IFSAR height error map addresses the concept of spatial variability of accuracy in an elevation model, giving point-by-point estimations of error. Elevation models derived from any of the three technologies presented likely vary in accuracy due to land cover and slope. Traditional map accuracy standards were developed on a more simplistic pass-fail criterion. As discussed above, more robust characterization of elevation data and improved accuracy assessment and reporting that acknowledge spatial variability of error are needed. The work done in this area for IFSAR may be useful in developing new standards and specifications that incorporate these principles.


