
2
Overall Assessment of Workforce Supply and Demand
The committee was asked to evaluate the current and projected demographics for the aerospace engineering and space science workforce and how any potential shortages might affect NASA. The committee found a substantial amount of data on the production of new engineers and space scientists. But the committee also determined that the data are insufficient to assess NASA’s requirements for employees who are not only educated but also highly skilled. What the data often fail to indicate is the degree of skill present in the potential workforce.
NASA’S CURRENT WORKFORCE DEMOGRAPHICS
As of January 2007, NASA employed more than 18,000 workers distributed among 10 field centers throughout the country and its Washington, D.C., headquarters. One of the common yardsticks for measuring NASA’s current workforce is its age distribution. NASA administrators as well as members of Congress have noted that a relatively large percentage of the agency’s workforce will soon be eligible for retirement, many in no more than 5 years, and in any case considerably less time than the time required to complete major new projects. A “retirement wave” and consequent loss of people with important experience in NASA missions and research would clearly be detrimental to NASA’s efforts. Although the potential for a mass exodus may be exaggerated, there is clear evidence that NASA’s employee age distribution has changed as a result of policies enacted during the 1990s.
NASA officials reported to the committee that the current age distribution of the agency’s civil service workforce peaks in the age range from 40 to 44 (Figure 2.1).1 By comparison, the age distributions for the aerospace workforce generally and the federal government both peak at greater ages than that for NASA, the peak for the federal workforce being nearly a decade beyond the peak for NASA. The age distribution for the aerospace workforce is currently double peaked, with both peaks at or above the peak for NASA. The age distribution for the total U.S. workforce peaks in the same age range as that for NASA but is much broader, indicating that the U.S. workforce has a far greater number of young workers than does NASA.2
The data in Figure 2.1 indicate that NASA’s workforce is significantly younger than that of the aerospace
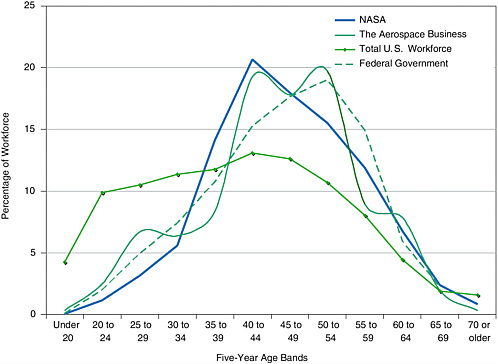
FIGURE 2.1 The age distribution of NASA’s current workforce compared to the age distributions for the aerospace sector, the federal government, and the total U.S. workforce. NOTE: The line for aerospace business is based on very imprecise data. SOURCE: Garth Henning and Richard Leshner, NASA, presentation to the Committee on Meeting the Workforce Needs for the National Vision for Space Exploration, February 22, 2005. Courtesy of NASA.
workforce generally, the more relevant comparison population. The fraction of the NASA workforce in the age range from 35 to 55, the span generally agreed to represent the more productive years of technical staff, is 68 percent, nearly identical to that for the aerospace industry generally over the same age range. However, more than one-third of NASA’s workforce is in the age range from 35 to 45, compared to only 27 percent of the aerospace workforce generally. In addition, the aerospace industry workforce’s second peak, in the age range from 50 to 55, a peak that is lacking in NASA’s workforce, represents people with vital experience who are present in higher numbers in industry than at NASA. It appears that NASA’s workforce issue is not one of age or sheer numbers; it is one of skill and experience. Most of the space hardware development over the past one to two decades has been done by industry, not NASA, and therefore agency employees have not benefited from this experience.
Almost 60 percent of NASA’s civil service employees are scientists and engineers. Within that cadre, about 85 percent are engineers and nearly 10 percent are scientists. According to NASA officials who briefed the committee, the average age of NASA scientists and engineers is 45.8; 24 percent are younger than 40, 67 percent are between 40 and 59, and 9 percent are 60 or older. NASA has determined that 12 percent of its engineers and 21 percent of its scientists are now eligible to retire, and it projects that in 2011, 28 percent of its engineers and 45 percent of its scientists will be eligible to retire.
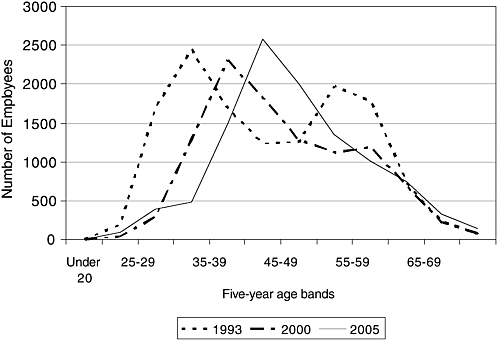
FIGURE 2.2 Average age of NASA employees at three separate periods. SOURCE: Courtesy of NASA.
The committee believes that sudden mass retirement is an unlikely future scenario. Offsetting the prospects for a retirement wave in the near future is the fact that NASA is now experiencing an overall annual attrition rate of only 3.5 percent and a slightly lower rate for scientists and engineers.3 These rates are substantially lower than retirement rates for the federal government, which are around 7 percent.
However, the committee does note a slightly alarming trend: NASA’s workforce has been steadily aging since the early 1990s (Figure 2.2).
In response to the committee’s interim report,4 NASA’s Office of Human Capital Management explained demographic trends at the agency over the past decade and a half. Starting in 1989 and continuing into the early 1990s, NASA instituted a program to attract younger workers to the agency, hiring substantial numbers of college “fresh outs.” By the mid-1990s the agency had adopted policies for downsizing, and hiring restrictions meant that for nearly a decade, very few younger employees (such as recent university graduates) were hired by NASA. By 2000 NASA downsizing had ended and the agency realized it had opened up competency gaps in parts of the workforce. Efforts to close these gaps did lead to increased hiring of younger workers, but they remained only a relatively small portion of the total NASA science and engineering workforce. In 2003 NASA instituted a corporate
recruitment effort “to again focus on bringing in young talent as the agency recognized the importance of balancing the demographic.” However, this effort was halted due to budget cuts.5
Thus, as Figure 2.2 indicates, the overall age distribution of NASA’s workforce has increased steadily over the years, and the percentage of younger employees has decreased. If this steady march toward an older workforce continues, the agency will not have enough people moving up through the ranks to accomplish important tasks in the next decade, when the VSE is implemented.
The committee believes that the key to maintaining a reasonable distribution of age versus skill is for NASA to have in place a long-term hiring strategy that provides a sufficient supply of younger workers to maintain a profile similar to that shown for NASA in Figure 2.1, but halting the steady increase in average age as seen in Figure 2.2. NASA has stated that the agency is not currently taking such an approach. The committee urges that NASA implement a long-term hiring strategy for providing a steady supply of young workers to maintain a balanced distribution of age versus skill.
The committee believes that NASA wages are competitive with those industry offers at the lower to middle grades. For example, from 2001 to 2005 engineering salaries at NASA rose from a mean of $80,195 to $97,998. According to the Bureau of Labor Statistics, for the same period the mean salary for aerospace engineers in the United States increased from $71,380 to $85,450. Not only were NASA wages higher than the national average for the period, but they also increased at a faster rate—22.2 percent for NASA engineers compared to 19.7 percent for aerospace engineers in the United States.
Currently NASA is reducing the size of its workforce slightly and eliminating engineering positions. It offers competitive wages with industry for engineering positions. The committee concluded that there is no short-term evidence of a looming workforce problem and that salaries are not an issue at the lower ends. However, NASA has trouble attracting the more highly skilled talent that it requires. Although the committee lacked statistical or survey data on this subject, anecdotal evidence it collected indicated that mid-level engineers at NASA were unwilling to wait for more senior positions to open at the agency (something that could take a long time due to the agency’s general low attrition rate) and were willing to leave for more lucrative positions in industry. In addition, anecdotal information collected by the Aerospace Industries Association indicates that salaries for senior-level engineers in industry can reach $140,000 to $185,000 a year, far in excess of what is available at NASA.6
LABOR MARKET PROJECTIONS
Viewed in the context of the larger labor market, NASA’s difficulty with finding employees who have the requisite skills and experience extends to other agencies in the federal government as well, according to available data. The Department of Defense (DOD) currently employs 43 percent of all the scientists and engineers employed in the federal government. In 2002 DOD’s workforce included 27 percent of all federal scientists (a substantial fraction of whom are computer and mathematical scientists in the DOD) and 67 percent of all federal engineers, including nearly 80 percent or more of all federal electrical, industrial, and mechanical engineers. Aerospace engineers in the DOD accounted for 43 percent of the federal total aerospace engineers in 2002.
In the early 2000s Booz Allen Hamilton conducted two studies for the Office of the Secretary of Defense and the National Reconnaissance Office—the Space Industrial Base Study (SIBS)7 and the Space R&D Industrial Base Study (SRDIBS).8 The SIBS noted a bimodal age distribution in the workforce with peak numbers clustering around 30 to 35 years and 45 to 50 years. Most industry CEOs who were interviewed for the SIBS identified workforce issues as being especially critical. Competition was found to be increasing for a limited number of
available scientists and engineers. The subsequent SRDIBS reported some easing in the competition for scientists and engineers that had been created earlier by the Internet dot-com expansion, but the need to attract, retain, and train new workers in critical skills was seen as a continuing or growing problem. A 2004 Aerospace Workforce Review conducted by the National Defense Industrial Association (NDIA) concluded that nearly 10 percent of job vacancies were not being filled.9 As in the SIBS and SRDIBS, certain specific skill areas, such as systems engineering, optical design engineering, and software engineering, were identified as being particularly critical and difficult to fill.10
The volatility of the market for national security space projects may be a particular obstacle to predicting the skills that will be in demand beyond the near term. Furthermore the DOD—like NASA—requires that most in-house scientists and engineers be U.S. citizens who are eligible to receive security clearances.
Data from the Aerospace Industries Association (AIA), which has tracked employment and business trends in the aerospace industry—including civil aviation, military systems, and space systems—for many years, show that the size of the overall aerospace workforce declined from 1990 through 1995 and remained more or less flat from 1995 through 2005. Moreover, the fraction of the total U.S. science and engineering workforce represented by aerospace fell from about 30 percent in 1965 to 2 to 3 percent in 2002. Nevertheless, AIA projections anticipate a modest level of growth in aerospace industry sales through 2011, probably in the range of 4 to 5 percent per year. The projected growth in business, combined with the potential for retirements from an aging aerospace workforce, suggest growing demand in the aerospace labor market.
The difficulty of identifying and filling gaps in workforce categories was illustrated at the committee’s January 2006 workshop by Joan Burrelli from the National Science Foundation’s (NSF’s) Division of Science Resources Statistics, who presented NSF data showing that in 2003, of the approximately 350,000 degree holders in aerospace engineering and space science, about 270,000, or 77 percent, were not employed as aerospace engineers or space scientists.11 Similarly, the NSF data indicated that of the 200,000 workers who were employed as aerospace engineers or space scientists, about 120,000 did not hold degrees in those fields (Figure 2.3). Thus in 2003, only about 80,000 workers, corresponding to 23 percent of the degree holders and 40 percent of the aerospace engineering and space science workforce, were actually working in the field of their degree. However, many may be working in related fields, such as technical management.
The committee notes that, in addition to indicating the complexities affecting labor market projections, this situation also illustrates the point that people with strong technical backgrounds can often quite readily acquire the specialized knowledge needed for work in different (but related) fields.
Burrelli also mentioned three likely influences on future natural science and engineering enrollment and graduation trends. First, the college-age population in the United States is expected to begin to decline after 2015. Second, the number of foreign students in the United States as temporary residents has been declining since September 2001, although the number of permanent residents is still growing. Third, enrollments tend to be very sensitive to employment opportunities, with first-time enrollments in a field declining in response to rising unemployment in the field, but with graduate student enrollments tending to rise for a year or two when the employment picture softens.
The Bureau of Labor Statistics (BLS) projects an 8 percent growth in total employment between 2004 and 2014 for aerospace engineers and a 7 percent growth for astronomers and physicists, compared with a projected 21 percent increase for the total of all science, technology, engineering, and mathematics occupations.12
In the committee’s view, BLS projections are, at best, estimates of what will happen. The projections have been particularly poor at dealing with recessions and rapid changes in particular industries and occupations, as
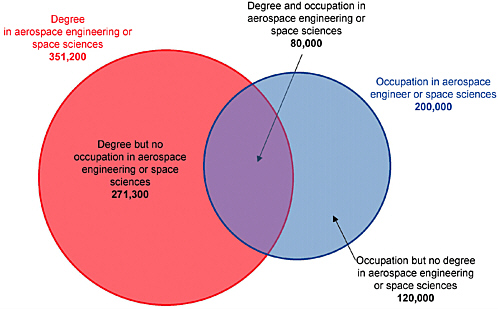
FIGURE 2.3 Degrees versus occupations in 2003, illustrating that people with specific degrees often work outside their areas. NOTE: Space sciences here include atmospheric sciences, physics, and astronomy. SOURCE: Courtesy of Joan Burrelli, NSF, “NSF Studies of Enrollment and Graduation Trends,” presentation to NRC Workshop on Meeting the Workforce Needs for the National Vision for Space Exploration on January 23, 2006; data from the Scientists and Engineers Statistical Data System.
evidenced by projections for aerospace engineering for 1988 to 2000 that were unable to anticipate or take into account the industry’s consolidation in the 1990s. Furthermore, in the BLS classification of occupations, all aerospace engineers are grouped together, and important specialties such as systems engineering are not identified at all. NASA’s job definitions do not correspond with the standard occupational classifications produced by BLS, which lack sufficient detail to be useful for NASA planning. A challenge to any attempt to understand and assess NASA’s potential workforce problems—including this committee’s attempt—is that it is difficult to compare the agency’s demand for workers with the available supply as reflected in broad BLS occupational classifications.
TRENDS IN UNIVERSITY ENROLLMENT AND DEGREES AWARDED
NASA draws its entry-level workers from the pool of recent recipients of the highest-level degrees in science and engineering disciplines. Over the past several years, increasing public attention has been paid to the question of whether the United States has the ability to produce an adequate supply of undergraduate and graduate students who can work in national security and aerospace, whose employees are predominantly U.S. citizens.
According to NSF data, the number of first-time, full-time graduate students enrolled in natural science and engineering fields grew slightly between 2000 and 2003 (the most recent period for which data are available). Despite the oft-stated concern in academia about a precipitous decline in applications from foreign students after 2001, increased graduate enrollment by U.S. citizens and permanent residents more than compensated for the
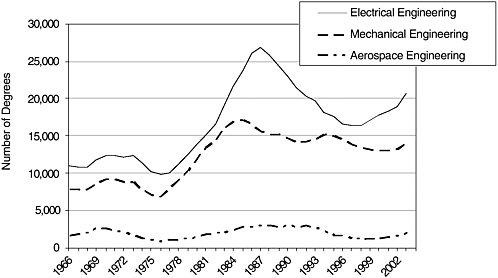
FIGURE 2.4 Aerospace engineering and space sciences degrees awarded, 1966-2003. NOTE: Space sciences here includes atmospheric sciences, physics, and astronomy. No data were available for 1999. SOURCE: Courtesy of Joan Burrelli, NSF, “NSF Studies of Enrollment and Graduation Trends,” presentation to NRC Workshop on Meeting the Workforce Needs for the National Vision for Space Exploration on January 23, 2006; data from U.S. Department of Education, National Center for Education Statistics, IPEDS Completions Survey.
reduced numbers of foreign students. As with all natural science and engineering enrollment, first-time, full-time, graduate enrollment in aerospace engineering and space science mirrors unemployment trends (Figure 2.4).
NSF briefings to the committee indicated that aerospace engineering and space science graduate enrollments appear to have been less affected by visa issues than has enrollment as a whole for natural science and engineering. They also indicated that the aerospace and space science fields have experienced a relatively smaller drop in international students than has been the case for total natural science and engineering enrollments. Between 2000 and 2003, first-time graduate enrollment by U.S. citizens and permanent residents in aerospace engineering and space science grew. American Society for Engineering Education data show that the growth pattern in aerospace engineering continued in 2004 and 2005, both in numbers and as a fraction of total enrollees in all engineering fields.13
The “decline” in numbers of U.S. science and engineering students often cited in the press is not a true decline, but rather a relative decline reflecting primarily the massive growth of the student communities in developing nations such as China and India. The committee believes that this relative decline does not pose serious consequences for NASA’s ability to attract and retain highly skilled personnel. Rather, the question is one of absolute numbers of available, highly skilled personnel.
During its various meetings, the committee heard from representatives of the DOD, major aerospace industries such as Boeing and Lockheed-Martin, the NSF, and the BLS. Although it acknowledges the difficulties in making labor market projections, the committee currently sees no evidence of a nationwide downturn in the supply of new talent in aerospace engineering and space sciences. The supply and the demand for new aerospace workers are
relatively well matched. However, the committee also notes that both NASA and the aerospace industry employ engineers from many different fields besides aerospace engineering, such as electrical engineering, making a comparison of supply and demand for NASA more complicated.
WORKFORCE DIVERSITY
During the 1990s, NASA made admirable efforts to diversify its workforce through programs such as the Minority University Research and Education Program (MUREP). The committee applauds this effort and believes that it must continue. If NASA and industry do not actively seek out employees from nontraditional demographic groups, they will miss out on the groups that are growing most rapidly in the United States, and their workforces will look less and less like the U.S. population as a whole.
Current demographic trends indicate that white males will constitute a smaller share of the labor market over time, primarily because of immigration. The Bureau of Labor Statistics projects that white males will constitute 34.9 percent of the total U.S. labor force in 2014 compared to 37.4 percent in 2004.14 The divergent trends are more impressive if the growth rates are compared across demographic groups. Between 2004 and 2014, the number of white men in the labor force is projected to increase by 4.3 million (6.6 percent); in contrast, the number of women is projected to increase by 8.2 million (10.9 percent); of Blacks, by 1.3 million (16.8 percent); of Asians, by 2.0 million (32 percent); and of Hispanics, by 6.5 million (34 percent).
The nonprofit organization Engineers Dedicated to a Better Tomorrow analyzed data compiled by the NSF and the Department of Education to prepare a breakdown by gender of students earning bachelor’s degrees in various fields of science and engineering.15 The study identified four fields—physics, computer science, engineering, and engineering technology—as being behind all other science and engineering fields in terms of the gender diversity of their graduating baccalaureate classes. For those four fields taken together in 2004, only 21 percent of students earning baccalaureates were women, compared with 50 percent for science and engineering as a whole. The study noted that while the percentage of women earning baccalaureate degrees across all science and engineering fields has been rising steadily since the 1970s, the percentage of female degree earners has not increased significantly since 2000 for any of the four fields identified above.
Engineers Dedicated to a Better Tomorrow also examined the racial and ethnic makeup of students earning bachelor’s degrees.16 The overall percentage of baccalaureates in science and engineering awarded to underrepresented minorities in 2004 was just slightly below the corresponding college-wide percentage for all academic disciplines—16.4 versus 16.9 percent. For individual minority groups, the percentage of baccalaureates awarded in science and engineering versus all disciplines was approximately the same—8.4 versus 8.7 percent for Blacks, 7.3 versus 7.5 percent for Hispanics, and 0.71 versus 0.70 percent for Native Americans. The analysis found that three fields—physics, mathematics and statistics, and engineering—lagged significantly, both in 2004 and historically, in achieving racial/ethnic diversity in their graduating baccalaureate classes compared to the level seen for science and engineering as a whole. Blacks, Hispanics, and Native Americans were substantially underrepresented in physics, mathematics, and statistics; in engineering, Blacks and Native Americans were substantially underrepresented. This underrepresentation generally extended throughout the various subdisciplines of engineering.
The statistics on diversity are particularly significant given that NASA centers are located in states seeing major shifts in workforce diversity and college graduate diversity. For instance, the California Institute of Technology’s Jet Propulsion Laboratory, NASA’s Ames Research Center, Dryden Flight Research Center, Johnson Space Center, and Kennedy Space Center are all located in states with a Hispanic workforce and population demographic ranging
|
14 |
All data in this paragraph are from Mitra Toossi, 2005, “Labor Force Projections to 2014: Retiring Boomers,” Monthly Labor Review, November, Table 6, p. 39. |
|
15 |
Engineers Dedicated to a Better Tomorrow, “Women in Engineering and Related Fields—Diversity Analysis of Students Earning Bachelor’s Degrees,” Dedicated Engineers Critical Issues Series, Menlo Park, Calif., 2006, available at http://www.dedicatedengineers.org/news_pubs/Critical_Issues_Women_6-06.pdf. |
|
16 |
Engineers Dedicated to a Better Tomorrow, “Minorities in Engineering and Related Fields—Diversity Analysis of Students Earning Bachelor’s Degrees,” Dedicated Engineers Critical Issues Series, Menlo Park, Calif., 2006, available at http://www.dedicatedengineers.org/news_pubs/Critical_Issues_Minorities_6-06.pdf. |
from 15 to 35 percent in the near term. NASA should pay attention and should nurture relationships and alliances with local and regional universities and with national student and professional organizations that are championing diversity opportunities nationwide.17 The goal of the agency should be to ensure that, at the least, its recruiting reflects the trends in degree production for minority groups in the relevant disciplines, and at best exceeds them.
CONCLUSIONS
The committee drew several general conclusions from the data and perspectives summarized above:
-
Although there are currently some problems in meeting demand, particularly demand for workers with specific skills, the situation for major employers such as the DOD and the large aerospace companies is not now a major problem, based on evidence supplied by various industry and DOD experts at the committee’s meetings.
-
Data on employment demand are difficult to obtain, particularly categorized by relevant skill areas, and those data and projections that exist are often ambiguous beyond the near term.
-
Most longer-term projections do forecast a gap between supply and demand that is larger than today’s, but the size and the scope of the predicted gap are not clear.18
-
The problems with meeting future demand in the DOD are influenced by the need to employ principally U.S. citizens and permanent residents who can obtain security clearances.
-
In areas controlled by International Traffic in Arms Regulations (ITAR), NASA’s workforce pool will be constrained.
-
NASA’s employee age distribution is different from those of DOD and industry, both of which tend to be either bimodal or relatively flatter with age and thus more nearly like the age distribution of the U.S. workforce as a whole. The most important issue is the demographic trend at NASA whereby policy choices made during the last decade and a half have resulted in a steadily increasing average age of the agency’s employees and fewer and fewer entry-level personnel capable of rising up through the agency’s ranks to assume leadership positions in the future.
-
Skills are to some extent transferable, as demonstrated by the large numbers of engineers working in areas that they were not originally educated in—for instance, electrical engineers working in aerospace.


