
2
Context for Analysis of Effects of Wind-Powered Electricity Generation in the United States and the Mid-Atlantic Highlands
ESTIMATING THE ENVIRONMENTAL BENEFITS OF GENERATING ELECTRICITY FROM WIND ENERGY
This chapter provides an assessment of the environmental benefits of generating electricity from wind energy (current and future development) in the United States and its Mid-Atlantic Highlands (MAH), with specific attention to the potential contribution to the electricity supply and air quality improvement as indicated by emission reductions. For context, a general overview is provided describing issues that should be considered when assessing potential wind-energy development and environmental benefits. This is followed by a more detailed treatment and quantitative analysis of potential development and benefits. We end with a set of conclusions derived from the analysis; that analysis is simplified by including only the most robust assumptions.
Introduction and Overview
The committee’s statement of task requires it to consider the beneficial environmental effects of electricity generation by wind-energy facilities. Wind-powered electricity-generating units (EGUs), like EGUs using other sources of energy, have no significant intrinsic environmental benefits; for example, none of their effects directly enhance ecosystem values or services. Indeed, every source of energy used to generate electricity on a large scale has at least some effects that most people would identify as adverse. The environmental and human-health risk reduction benefits of wind-powered
electricity generation accrue through its displacement of electricity generation using other energy sources (e.g., fossil fuels), thus displacing the adverse effects of those other generators. Moreover, the only way to fully evaluate the environmental effects of generating electricity from wind energy is to understand all the adverse life-cycle effects of those electricity sources, and to compare them to all the adverse effects of wind energy. Because wind energy has some adverse impacts, the conclusion that a wind-powered EGU has net environmental benefits requires the conclusion that all its adverse effects are less than the adverse effects of the generation that it displaces. This committee’s charge was to focus on the generation of electricity from wind energy, however, and so it has not fully evaluated the effects of other electricity sources. In addition, it has not fully evaluated life-cycle effects (see discussion later in this chapter). Thus, in assessing environmental benefits, this committee has focused on the degree to which wind-generated electricity displaces or renders unnecessary electricity generated by other sources that produce atmospheric emissions, and hence the degree to which it displaces or reduces atmospheric emissions, which include greenhouse gases, mainly CO2 (carbon dioxide), NOx (oxides of nitrogen), SO2 (sulfur dioxide), and particulate matter. This focus on benefits accruing through reduction of atmospheric emissions, especially of greenhouse gas emissions, was adopted because those emissions are well characterized and the information is readily available; it also was adopted because much of the public discourse about the environmental benefits of wind energy focuses on its reduction of atmospheric emissions, especially greenhouse gas emissions. Finally, the focus on benefits accruing through reduction of atmospheric emissions was adopted because the relationships between air emissions and the amount of electricity generated by specified types of electricity-generating sources are well known. However, relationships between incremental changes in electricity generation and other environmental impacts, such as those on wildlife, viewsheds, or landscapes, are generally not known and are unlikely to be proportional. In addition, wind-powered generators of electricity share many kinds of adverse environmental impacts with other kinds of electricity generators. Therefore, calculating how much wind energy displaces other sources of electricity generation does not provide clear information on how much, or even whether, those other environmental impacts will be reduced. This report does, however, provide a guide to the methods and information needed to conduct a fuller analysis.
Although most evaluations of the beneficial effects of wind-generated electricity, including the present one, have addressed the degree to which they reduce (through displacement) atmospheric emissions, other important effects are potentially displaced as well. For example, obtaining fossil fuel through mining, drilling, and chemical modification of one form to another (e.g., gasification of coal) has a variety of environmental effects including
loss of habitat for terrestrial and aquatic species. Operation of thermal EGUs, which generate heat to drive turbines, produces heated water, either from cooling or in the form of steam to drive the turbines, or both. If the energy from the heated water is not recovered, the water is usually discharged into the environment; in closed cooling systems, its heat is discharged. All forms of generation have associated life-cycle emissions and wastes along with other environmental effects that are affected by the design, materials provision (including mining), manufacture, construction, transportation, assembly, operation, maintenance, retrofits, and decommissioning of the generators and their associated infrastructure. Some of these stages of the life cycle—most notably, mining—have adverse effects on human health as well. For the reasons given above, this committee has not considered all these effects in this study, but a full analysis would include them.
The issue of how much generation of emissions and waste is displaced by production of electricity generation through wind energy also is complex, but it needs to be understood to properly evaluate the environmental effects of wind energy. The primary purpose of this chapter, then, is to analyze the complex array of interacting factors that affect the extent to which wind displaces other energy sources. The analysis will provide a framework for evaluating the environmental effects of wind-energy facilities.
Although the direct and indirect environmental impacts of fossil-fuel generation of electricity are not well understood, the atmospheric emissions of fossil-fuel generators are fairly well characterized. It would seem straightforward to simply subtract the amount of energy generated by wind-energy facilities from the amount generated by fossil-fuel-fired EGUs, multiply by the amount of emissions per unit of energy, and attribute that amount of emission reduction to the wind EGUs. In practice, however, it is extremely difficult to perform the correct calculation. The following sections briefly discuss emissions from fossil-fuel-fired EGUs; the factors involved in calculating the extent to which wind energy reduces those emissions, today and in the future; and the committee’s approach to the problem. In all cases, we are discussing generators of electricity.
Atmospheric Emissions from Fossil-Fuel Plants
Currently, most of the electricity used in the United States is generated from fossil fuels. Figure 2-1 shows U.S. electricity generation by fuel type. Wind is part of the “other renewables” category. Fossil-fuel-fired plants emit (among other atmospheric constituents) the so-called criteria pollutants, their precursor gases, and greenhouse gases (GHGs), mainly CO2. Criteria pollutants are those regulated by the U.S. Environmental Protection Agency (EPA) under the Clean Air Act through the establishment of National Ambient Air Quality Standards (NAAQS). The standards, which
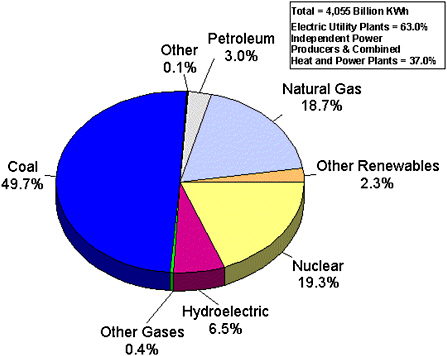
FIGURE 2-1 U.S. electric power industry net generation 2004. Note: Conventional hydroelectric power and hydroelectric pumped storage facility production minus energy used for pumping.
SOURCE: EIA 2005a.
are designed mainly to protect public health, apply to ozone (O3), particulate matter, carbon monoxide (CO), NOx, SO2, and lead. NAAQS are also intended to protect against adverse public-welfare effects, such as damage to agricultural crops from acid deposition. Hazardous air pollutants, such as mercury, also are of environmental concern (see for example NESCAUM 2003). On March 15, 2005, the EPA issued the Clean Air Mercury Rule to permanently cap and reduce mercury emissions from coal-fired power plants for the first time (EPA 2006a).
CO2 is not currently regulated by any federal authority in the United States, although it is of concern because it is increasing in concentration in the upper atmosphere largely due to emissions from the burning of fossil fuel and has been implicated in climate change (NRC 2001). Various policies and initiatives, mainly from states, seek to reduce atmospheric emissions of CO2. For example, California established statewide GHG emissions reduction targets to reduce current emissions to 2000 emissions levels by 2010, then to reduce emissions to 1990 levels by 2020, and reduce emis-
sions to 80% below 1990 levels by 2050. In general, coal-fired plants have the largest emissions per unit of energy generated, followed by gas-turbine generators, followed by combined-cycle gas-turbine generators (Denholm et al. 2005; DeCarolis and Keith 2006). Some data on emissions are provided in Appendix B, Table B-1.
The control technologies and regulatory regimes for reducing emissions of criteria pollutants, their precursors, and CO2 can differ considerably, and therefore the costs of reducing them can be different. The question this section attempts to address, without considering costs, is to what extent will emissions be reduced through replacement of fossil-fuel-fired EGUs with wind-driven EGUs. The committee addresses this question by examining the potential for wind-energy development to achieve reductions in emissions of three major pollutants associated with fossil-fuel-fired EGUs. We focus on NOx and SO2, as examples of regulated pollutants. Coal-fired power plants are important sources of SO2 and NOx emissions. Those two pollutants cause acid rain and contribute to concentrations of airborne particulate matter. NOx is an important precursor to ozone pollution in the lower atmosphere. Also, we focus on CO2, as an example of a generally unregulated pollutant.
Factors that Affect Potential Emissions Reductions by Wind Energy
Emissions can be reduced in two basic ways: current electricity generation by emitting EGUs can be replaced on an immediate basis by generation from nonemitting EGUs (operating displacement), and emitting EGUs can be replaced, or not be built, when capacity is available from nonemitting EGUs (building displacement). The complex array of factors that affect how wind energy displaces other energy sources has been discussed in numerous publications (e.g., Smith et al. 2006). The following discussion is not a comprehensive review, but instead is an attempt to distill the most important issues. Some of these factors are further discussed in the section below, which provides a quantitative evaluation of wind-energy benefits.
There are three major aspects to any EGU. The first is capacity, or the amount of electric power an EGU can produce at its maximum output. This is usually referred to as “nameplate capacity,” and it is expressed in some multiple of watts (usually megawatts, MW, one million watts). Electricity customers care about (and are charged for) power consumed during a unit of time, usually expressed as the number of kilowatt-hours (kWh), or one thousand watts for a one-hour period. The average productive output of a power plant is almost always less than its nameplate capacity, and the fraction of nameplate power that the average actual output represents is called the capacity factor. For wind EGUs, because the wind often does not blow at speeds that allow maximum power generation, the capacity factor is
much less than nameplate capacity. Cumulative or annual average capacity factors are commonly about 30% and often much lower for shorter time intervals. Also, the capacity factor can be influenced by the accumulation of insects on turbine blades (see Corten and Veldkamp 2001).
The second aspect, dispatchability, is closely related to intermittency, and refers to the degree that a system operator can rely on a power source to be dispatched when it is needed. Electricity customers and electricity system operators also care about intermittency, because customers expect appliances to work when they turn on the switch, and system operators need to balance capacity against expected and realized demand for power. No electric power generator is 100% reliable (i.e., has zero intermittency)— lacking an effective means of electricity storage—but thermal (fossil-fuel and nuclear) and hydroelectric EGUs are generally less intermittent, and hence more dispatchable, than wind-energy facilities. Dispatchability also is related to a power plant’s ability (or not) to be ramped up and down quickly. In general, coal-fired EGUs cannot be ramped up and down very easily, and their variable dispatch capacity is limited. Thus, they are more suited to baseload production (i.e., long periods of continuous power production) rather than to providing variable production to balance short-term variation in load and demand. (They also produce more emissions, such as SO2 and NOx, when they are not operating at optimum efficiency.) Natural-gas-fired EGUs and wind-driven EGUs (if the wind is blowing) are more capable than coal-fired EGUs of being ramped up and down quickly, as are many hydropower plants.
The third aspect of a power plant is the marginal cost of producing a unit of electric power, or its operating cost. Because the “fuel” for hydroelectric and wind-energy plants is free, they typically have low operating costs.
In addition to the characteristics of EGUs, electricity grids and transmission systems also have characteristics that affect the potential of wind energy to replace fossil fuel for generating electricity. Wind-powered EGUs are widely distributed in space, and to make matters more difficult, excluding offshore locations, the highest-quality largest-scale wind resources usually are far from the main centers of demand, i.e., where people live and work (DeCarolis and Keith 2006). Constructing transmission lines is expensive, and transporting electrical energy over long distances can be inefficient or costly. In addition, any new power source, including wind, needs to fit into the existing transmission and dispatching infrastructure.
This brings us to the most complex aspect of the entire estimation procedure, and that is modeling the electricity grid. Most existing electricity grids in the United States are large, covering many states in the east and several of the larger states in the west, and are built around existing supply (fossil fuels and hydropower) and demand for electricity. The usefulness of
additional generation capacity is affected by the price of that power and by the availability of transmission capacity and interfaces. System operators must deal with transmission constraints as they try to balance load and generation (Keith et al. 2004). As a result, the available generation, the load, and the units available change often, if not constantly, making it difficult to characterize the interactions in a general way.
The reliability of wind forecasts declines rapidly with time, and a variety of techniques are being investigated to improve medium- and long-range forecasts (e.g., Brundage et al. 2001; Gow 2003). As a result, if electricity derived from wind energy is to be incorporated into a dispatch system, a certain amount of backup or reserve power is required. In addition, the marginal cost of electricity generation by different kinds of power plants is more or less dependent on the plant type. Finally, some power plants can be ramped up and down faster and more efficiently than others.
Typically, a new power source is added to the grid by system operators in order of increasing operating costs, or the closely related but not identical “bid prices.” Thus any new power source, including wind, displaces generation that costs more than it does, in the dispatch order. More-expensive power sources that are on the margins (for example, at peak demand times) would be displaced by less-expensive sources, depending, of course, on when the new power sources become available. As an example, the wind in the eastern United States averages lower speeds during summer afternoons—the normal times of highest peak demand for electricity there—than it does in winter, when peak demands are typically lower. Thus, to understand the extent to which any power source, including wind, would replace other generation sources, information is needed on demand and availability of the power source throughout the year at fairly small time increments. However, sometimes transmission constraints cause dispatch to be out of economic merit order (Keith et al. 2004). In addition, multiple years of data are examined to account for year-to-year variation. The committee cannot do much more here than to summarize the complexities of the electric-power production, distribution, and dispatching system. To quote DeCarolis and Keith (2006): “Intermittency can affect system operation on three timescales [minute-to-minute, intrahour, and hour- to day-ahead scheduling], but the impact depends on the transmission and generation infrastructure, and the resulting costs are not well understood in cases where wind serves more than a small fraction of demand. While Denmark and parts of Germany have wind serving more than 20% of demand, their experience does little to resolve uncertainties about the costs imposed by intermittent wind resources for at least two reasons. First, both countries are connected to large power pools that serve as capacity reserve for wind. Second, the multiplicity of wind-energy subsidies and absence of efficient markets . . . makes it difficult to disentangle costs.” The authors emphasize
that the cost of intermittency (in terms of back-up or reserve requirements) will be less if the generation mix is dominated by power plants with fast ramp rates (gas, hydropower) than if it is dominated by coal or nuclear plants, which have high capital costs and slow ramp rates.1
Not only wind energy receives government subsidies; all energy sources in the United States do. However, the subsidies vary from time to time, from one type of generator and its fuel to another, and from place to place, which further complicates understanding of how wind will displace other power sources in the mix. The two calculations of importance here are (1) the degree to which wind can contribute to guaranteed capacity (this allows one to predict the degree to which wind can replace existing power plants or obviate the need to construct new ones), and (2) the degree to which wind can be used in the existing grid structure (allowing prediction of the degree to which wind energy can reduce electricity generation, and hence emissions, from existing power plants that use fossil fuels).
A recent report by E.ON Netz, the transmission operator of a large electric grid in Europe (E.ON Netz 2005), concluded that the average capacity factor for its wind supply was about 20%, rising to 85% for brief periods and remaining below 14% for more than half the year. The minimum capacity factor was well under 1% for a short period. E.ON Netz further reported the results of two German studies on the degree to which wind-energy installations contribute to guaranteed capacity: both studies concluded that the contribution on average was approximately 8% of its installed (nameplate) capacity. (The committee refers to guaranteed capacity in this report as capacity value.)
Life-Cycle Costs
The true, full economic and environmental costs of electricity from various sources have not been adequately calculated. Cost estimates (including capital, operating, fuel, and financing costs) for electricity from various sources (coal, nuclear, etc.) are shown in Table 2-1, but these do not reflect the total private and social costs. The numbers in Table 2-1 include subsidies, but it is unclear how much they are. Estimates of the costs attributable to managing the intermittent nature of electricity supplied by wind energy are provided by DeCarolis and Keith (2006) and Strbac (2002).
Environmental externalities associated with operation of a power plant are a substantial, yet largely unquantified component of total costs. Lifecycle cost assessment can help reveal these externalities. Much effort has previously gone into developing methods and estimating externalities for
TABLE 2-1 Summary Cost Estimates for Electricity-Generation Technologies (in 2003 U.S. dollars per kilowatt-hour)
|
|
Cost estimated by: |
||
|
Technology |
EIAa |
University of Chicagob |
MITc |
|
Municipal solid waste landfill gas |
0.0352 |
|
|
|
Scrubbed coal, new (pulverized) |
0.0382 |
0.0357 |
0.0447 |
|
Fluidized-bed coal |
|
0.0358 |
|
|
Pulverized coal, supercritical |
|
0.0376 |
|
|
Integrated coal gasification combined cycle (IGCC) |
0.0400 |
0.0346 |
|
|
Advanced nuclear |
0.0422 |
0.0433 |
0.0711 |
|
Advanced gas combined cycle |
0.0412 |
0.0354 |
0.0416 |
|
Conventional gas combined cycle |
0.0435 |
|
|
|
Wind 100 MW |
0.0566 |
|
|
|
Advanced combustion turbine |
0.0532 |
|
|
|
IGCC with carbon sequestration |
0.0595 |
|
|
|
Wind 50 MW |
0.0598 |
|
|
|
Conventional combustion turbine |
0.0582 |
|
|
|
Advanced combined cycle with carbon sequestration |
0.0641 |
|
|
|
Biomass |
0.0721 |
|
|
|
Distributed generation, base |
0.0501 |
|
|
|
Distributed generation, peak |
0.0452 |
|
|
|
Wind 10 MW |
0.0991 |
|
|
|
Photovoltaic |
0.2545 |
|
|
|
Solar thermal |
0.3028 |
|
|
|
aFor EIA data, see EIA (2005b, Table 38). The 0.6 rule to adjust for scaling effects was applied to the wind 10 MW and 100 MW units using 50 MW as the base reference. Solar thermal costs exclude the 10% investment tax credit. bFor University of Chicago data, see University of Chicago (2004). cFor MIT data, see MIT (2003). NOTE: EIA, Energy Information Administration; MIT, Massachusetts Institute of Technology. Estimates are for newly sited facilities and are based on national data. Data exclude regional multipliers for capital, variable operation and maintenance (O&M). Fixed O&M New York costs are higher. Data exclude delivery costs. Data reflect fuel prices that are New York State-specific. Costs reflect units of different sizes; while some technologies have lower costs than others the total capacity of the lower-cost generation technology may be limited—for example, a 500 MW municipal solid waste landfill gas project is unlikely. MIT calculations assumed a 10-year term; consequently, estimated costs are higher. SOURCE: Mathusa and Hogan 2006. |
|||
particular effects of particular energy sources (see EC 1995; Hagler Bailly Consulting, Inc. 1995; Lee et al. 1995).
Life-cycle cost assessment attempts to compare the full costs of various electricity-generation technologies. Such comparisons take into account fuel life cycles (including extracting, refining, and transporting the fuel)
and power-plant life cycles (including designing, constructing, operating, maintaining, renovating, decommissioning the power plant) as well as specific environmental issues (e.g., wildlife and human-health impacts of fuel extraction, nuclear waste disposal issues with nuclear power plants, reservoir issues with hydroelectric power plants).
Life-Cycle Assessment
In the past, Life Cycle Assessment (LCA) has become a widely recognized method for comprehensively identifying and quantifying the environmental effects of diverse products, processes, and services (Hendrickson et al. 2006). This is typically a large task: a variety of environmental, human-health, and ecological effects must be identified, quantified, and evaluated for all the life-cycle stages, often scattered geographically and over time. LCA has been embraced by a number of industrial goods manufacturers and service organizations. The use of LCA in public policy making has not been as well publicized, but it can be expected that LCA may be used increasingly to reveal the benefits and costs of new public investments in infrastructure.
At present, LCA methods are commonly used: process-analysis-based LCA; economic input-output analysis-based LCA (EIO-LCA); and hybrid LCA, which combines elements of the former methods.
In process-based LCA, all inputs (e.g., raw materials, energy, and water) and outputs (e.g., air emissions, water discharges, noise) of processes associated with the life-cycle phases of a product or service are assessed. This approach enables very specific analyses, but the data needs may be so large as to make the LCA costly and time-consuming, especially when several process steps are included in the supply chain. Selecting the boundary and scope of analysis is not always straightforward, making comparisons between LCAs difficult.
EIO-LCA helps address the challenges of boundary selection and data intensity by creating a consistent analytical framework for the economy of a country or region based on standard, government-compiled economic input-output tables of commodity production and use data, coupled with material and energy use, and emission and waste generation factors per monetary unit of economic output (Hendrickson et al. 1998, 2006). While EIO-LCA can be used for comprehensive analyses of many products and services, it may not provide the level of detail in a process-based LCA.
To overcome the shortcomings of the above two LCA approaches, but also provide the most comprehensive and relatively cost- and time-effective studies, hybrid LCA has been developed (Suh et al. 2004; Hendrickson et al. 2006).
A hybrid LCA for wind-energy projects might consider:
-
Inputs into the life-cycle stages, such as energy (e.g., to manufacture and install the turbines), raw materials (e.g., iron ore), and water.
-
Outputs from the life-cycle stages such as emissions to air; and a variety of potential impacts, such as:
-
Bird and bat fatalities,
-
Habitat degradation or destruction,
-
Noise,
-
Visual impacts,
-
Physical impacts (e.g., projectiles resulting from icing of turbine blades), and
-
Other impacts (e.g., shadow, flicker, glare, intrusion into commercial and military airspace).
-
Of course, the impacts of the above on the environment and on humans (e.g., global warming potential) would need to be analyzed as well.
When conducting an LCA, it is critical to assess uncertainties in the available data and methods used for analysis. Some, but not many, peer-reviewed LCAs of wind-energy technologies have been published. Lenzen and Munksgaard (2002) note that “despite the fact that the structure and technology of most modern wind turbines differ little over a wide range of power ratings, results from existing life-cycle assessments of their energy and CO2 intensity show considerable variations” due to different LCA approaches, scope, boundary assumptions, geographical distribution, and information used for embedded energy calculations of turbine and tower materials, recycling or overhaul of turbines after the service life, and national energy mixes. They review 72 studies focusing on energy and CO2emissions associated with the life cycle of wind turbines and find that the energy intensity (kWh of energy input per kWh of electricity generated) is between 0.02 and 1.016, and the CO2 intensity (in grams of CO2 per kWh of electricity generated) is between 8.1 and 123.7.
Pacca and Horvath (2002) introduce the concept of global warming effect (GWE) as a combination of global warming potential and LCA and apply it to the construction and operation phases of several comparable electric power plants: hydroelectric, wind, solar, coal, and natural gas. In detail, their analysis focuses on the GWE of construction, burning of fuels, flooded biomass decay in the reservoir, loss of net ecosystem production, and land use. They find that a wind plant and a hydroelectric power plant in an arid zone (such as the one at Glen Canyon in the Upper Colorado River Basin) have lower GWE than the other power plants that were compared. This is the only region in the United States where the five electricity-generation technologies have been compared in an LCA framework.
Factors that Drive Wind-Energy Development
Forecasts for future wind-energy development presented in this chapter are based on a range of expectations concerning technological, economic, and policy factors that will determine the rate and magnitude of wind-energy development. These factors may be subject to change, as briefly described here.
Technological Changes
Research continues on the development of wind-turbine technology. Modern turbines are more efficient than earlier ones, and that trend is likely to continue. Transmissions (devices for transmitting the rotational kinetic energy of turbine blades to electric generators) also are likely to improve. A major impediment to the incorporation of wind generation into grids is the lack of ability to store electricity for times when the wind is unfavorable. Various approaches to storage are being considered, including storage batteries, hydrogen production and storage, compressed-air energy storage, hydraulic storage (using wind to pump water to use later for generation of hydroelectric power), and perhaps other devices (see, e.g., Fingersh 2004; Denholm et al. 2005; DeCarolis and Keith 2006). No storage system currently is economically viable, although research and development on this topic continue.
In addition to technology applied to the generation and storage of electricity by wind energy, efforts continue in the development of better transmission lines and improved grid management, which would improve the incorporation into the grid of intermittent power sources like wind. Some research focuses on computer and modeling technology. Also, weather forecasting continues to improve, and more reliable wind forecasts could enhance the ability of system operators to include wind into the management of grids. Of course, other sources of electric power, both renewable and nonrenewable, are also subject to continuing technological improvements; those improvements also could change ecological as well as other environmental effects of operating them.
Economic Changes
In early July 2006, the price of crude oil was about $75 per barrel; natural gas was about $5.60 per thousand cubic feet, down from a high of $8.66 in January of 2006. As recently as 2000, crude oil was selling for around $20 per barrel and natural gas for about $3.68 per thousand cubic feet. Coal prices have fluctuated between about $5/ton and $65/ton in recent years, depending on quality, and were climbing toward $100/ton as of
August 2006. Prices of those fossil fuels affect the price of electricity and hence the competitiveness of wind energy. Prices of fossil fuels are notoriously hard to predict, but it is at least plausible that recent trends towards higher prices will continue over the next decade.
Regulatory and Policy Changes
Changing regulatory and policy approaches towards energy production and consumption can have significant impact on wind-energy development. Such approaches might include the production-tax credit (PTC), renewable-portfolio-standard (RPS) legislation, carbon taxes, emissions cap-and-trade programs, emissions regulations, incentives to reduce energy consumption, and others. The approaches used vary from place to place and from time to time, and their effectiveness in reducing emissions (as well as in achieving several other policy goals) are being researched and debated. Their use is increasing, however, and it appears likely that to the degree that air quality and global climate change are considered to warrant governmental action, their use will continue to increase and they are likely to evolve.
The federal PTC and RPS legislation enacted in various states are major drivers of wind-energy development in the United States. The PTC is a federal support that is a direct credit against a company’s federal income tax based on the generation of electricity with renewable resources, such as wind. As discussed in the following section, most of the wind resource in the United States could not be profitably developed without incentives such as the PTC (NREL 2006a). RPS legislation has been enacted by 20 states and the District of Columbia, specifying that utilities operating in those states supply a fixed percentage of their power from renewable sources (AWEA 2006b). Because RPS legislation generally allows purchase of renewable energy produced in other states, RPS legislation enacted in states with little wind-energy potential can drive development in other states that have more wind-energy potential. It has been estimated that if state RPS laws remain at current levels, they will be responsible for triggering about 80% of renewable power development in the United States in the next 10 years (Ihle 2005).
Various organizations and even government programs are presently advocating policy changes and initiatives that may dramatically increase the rate of wind-energy development in the United States. A number of organizations, for example, are actively promoting national RPS legislation in the 10-20% range (e.g., Clemmer et al. 2001; AWEA 2006c), and the American Wind Energy Association (AWEA) and the U.S. Department of Energy have jointly committed to pursue a goal of supplying 20% of U.S. electricity needs from wind energy (AWEA 2006d). As discussed later in this chapter, these goals greatly exceed the projections provided by three
different organizations within the U.S. Department of Energy (Energy Information Administration, Office of Energy Efficiency and Renewable Energy, and the National Renewable Energy Laboratory).
Analysis of Effects and Benefits in a Context of Change
All of the factors described in this section—technological advances, economic changes, and regulatory and policy changes—will continue to evolve. Some of the evolution, through increased energy efficiency, improved technology for reducing emissions from fossil-fuel plants, and possible improvements in the handling of nuclear waste products, might reduce the economic competitiveness of wind energy. Other changes could increase its competitiveness and penetration into the mix of electric-power generators. The current trend appears to be in the direction of increased penetration and cost-effectiveness of wind energy, and therefore any assessment of the environmental benefits and consequences of wind energy should take at least a decade-long perspective. As described in the following section, the committee has examined a range of 15-year forecasts for wind-energy development based on modeling conducted by several U.S. Department of Energy programs. Although the range of forecast results that we examined was broad, it is still possible that technological, economic, or policy changes as discussed above could result in substantially different outcomes, with cumulative effects that are outside the range of our analysis. Before discussing wind energy in the United States and the MAH, we briefly describe the global status of wind energy to provide context.
WIND ENERGY GLOBALLY
The use of wind energy for electricity generation, which began on a utility scale in about 1980, grew relatively slowly at first with only about 3 gigawatts (GW, one billion watts) installed by 1993. However, by 2003, the world’s wind-energy capacity was 39.4 GW, and by 2005 it was more than 59 GW (GWEC 2006). The United States had more wind-energy installed capacity than any other country until 1996, when it was surpassed by Germany; at the end of 2005, with 9.1 GW installed, it was third, behind Germany (18.4 GW) and Spain (10.0 GW). (The United States surpassed 11 GW of installed wind energy capacity in 2006.) India (4.4 GW) and Denmark (3.1 GW) rounded out the top 5; all other countries accounted for 13.9 GW (Florence 2006), and there was wind energy installed in all continents except for South America, but Brazil and Argentina have wind-energy projects in various stages of development (WWEA 2006).
Factors that affect the use of wind energy for electricity generation in other countries are similar to those in the United States in broad outline,
but there are local differences among the different countries. For example, the European Wind Energy Association (EWEA) attributes the decision to develop wind energy in Denmark and Germany—among Europe’s leaders in the amount of wind-energy capacity—to the nuclear accident at Chernobyl in 1986 and the Brundtland Commission’s report on sustainability in 1987. Today, the growing evidence of rapid climate change driven by GHG emissions is an important motivator (EWEA 2006).
As is the case for the United States (see Chapter 1 and this chapter, below), global wind-energy generating capacity is widely expected to continue to grow; for example, the Global Wind Energy Council forecasts it to reach 134.8 GW by 2010, with the strongest growth in the United States, but significant growth elsewhere as well (GWEC 2006).
QUANTIFYING WIND-ENERGY BENEFITS IN THE UNITED STATES AND THE MID-ATLANTIC HIGHLANDS
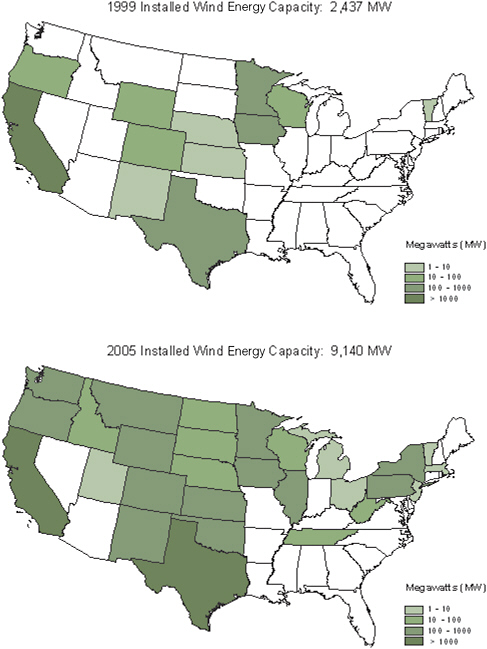
Generation of electricity on a utility scale in the United States using wind energy has undergone increasingly rapid and geographically widespread development in recent years. The Energy Information Administration (EIA) Annual Energy Outlook 2006 (EIA 2006a) indicates that 9.646 GW of wind-energy capacity was installed by the end of 2005 and forecasts that total installed capacity (onshore) will exceed 11.5 GW in 2006; AWEA reports that the 11 GW mark for the United States was reached in 2006 (AWEA 2007). Based on data provided for the EIA Annual Electric Generator Report (EIA 2004a), installed capacity in 2004 included about 17,000 wind turbines associated with more than 200 separate projects distributed in 26 states. Based on a comparison of installed capacity for wind-powered electricity generation in 1999 and 2005 (Figure 2-2), more than two-thirds of the installed wind-energy capacity in the United States was developed in the first five years of this decade.
High rates of growth in the wind-powered electricity-generating industry are projected to continue well into the future. The following sections of this chapter examine projected wind-energy development for the contiguous United States, and in particular for its MAH. The potential contributions to electricity supply and reduction of air-pollution emissions are estimated based on projections through 2020.
Wind-Energy Potential
Estimates of U.S. wind-energy potential for electricity generation have changed as models have improved, more and better data have been collected and analyzed, and land-use exclusions have been considered. In particular, there has been an increase in the geographic resolution of wind-
energy maps. The grid cell resolution of the Wind Energy Resource Atlas of the United States (Elliott et al. 1986) was about 25 km2. Current maps of U.S. wind-energy potential have grid cell resolutions ranging from 200 m2 to 1 km2 for individual states. The National Renewable Energy Laboratory (NREL) has assembled these more current maps and accounted for land use and other exclusions (technical, legal, and environmental) as a basis for estimating both total and practical wind-power capacity and for projecting future wind-capacity development for electricity generation in the United States.
Wind class represents the potential for an area to generate electricity, based on mean wind-power density (in units of W/m2) or equivalent mean wind speed at specified height(s) (Table 2-2). Class 1 is the lowest wind-power class; Class 7 is the highest wind-power class. Commercial wind-turbine applications are generally limited to areas with Class 3 or better winds (Figure 2-3). Profitable development in areas with less than Class 5 wind, which represent more than 90% of total estimated potential wind-energy capacity, depends on incentives such as the federal PTC (NREL 2006a). Although wind-energy development tends to focus on areas with higher-class winds, some areas with lower-class winds will likely be developed sooner due to proximity to demand and availability of transmission lines. Class 4 wind sites, for example, are on average 5 times closer to load centers and represent 20 times more wind resource than sites with Class 5 and higher winds (NREL 2006a). Box 2-1 illustrates the distribution of winds rated Class 3 and higher in the MAH based on wind-power density at 50 m above the ground.
TABLE 2-2 Estimates of Total Potential U.S. Wind-Energy Capacity: GWa
|
|
Class 3 |
Class 4 |
Class 5 |
Class 6 |
Class 7 |
Sum of Classes 3-7 |
|
Without Exclusionsb |
5,984 |
2,648 |
465 |
129 |
61 |
9,286 |
|
% of Classes 3-7 |
64.4% |
28.5% |
5.0% |
1.4% |
0.7% |
|
|
With Exclusionsc |
5,137 |
2,348 |
392 |
79 |
23 |
7,979 |
|
% of Classes 3-7 |
64.4% |
29.4% |
4.9% |
1.0% |
0.3% |
|
|
aBased on data provided on March 15, 2006, by NREL, Golden, CO; assumes 5 MW/km2. bNo exclusions except slope >20%. cStandard exclusions applied by NREL for defining available windy land, including environmental criteria, land-use criteria, and other criteria. See Appendix B, Tables B-2 and B-3, for description of the wind resource database. |
||||||
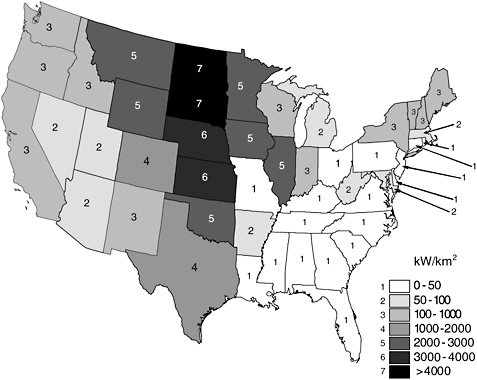
FIGURE 2-3 Distribution of potential onshore wind-energy capacity by state based on wind-resource coverages assembled by NREL. Land-use exclusions have been applied; see Appendix B, Table B-2. Wind-energy capacity is depicted as density (kW/km2) assuming that each km2 of area with Class 3 winds and better has a wind-energy capacity of 5 MW. Note: 93.2% of potential wind-energy capacity occurs west of the Mississippi River.
Development Projections
A number of approaches have been used to forecast future wind-capacity development for electricity generation in the United States (Table 2-3). The National Energy Modeling System (NEMS) was developed by the EIA for forecasts of energy supply, demand, and prices. NEMS is a modular system that takes a market-based approach to balancing supply and demand among energy production and end-use sectors. Wind-capacity forecasts are generated for 13 energy-market regions through application of a Wind Energy Submodule (Table 2-3).
The NEMS-GPRA07 model is a modified version of NEMS used to develop benefits projections for the Office of Energy Efficiency and Renewable Energy (EERE). The results are used to evaluate the performance of
|
BOX 2-1 Mid-Atlantic Highlands: Wind-Energy Potential 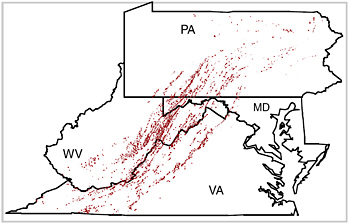 Distribution of winds rated Class 3 and higher in the MAH region based on wind-energy density at 50 m (NREL 2003). Class 3 and higher winds in the MAH are predominantly associated with mountain ridge crests. Estimates of Potential MAH Wind-Energy Capacity: GWa
|
||||||||||||||||||||||||||||||||||||||||||||||||||||||||
the Wind Technologies Program, including efforts to solve institutional problems and research to improve the cost and performance of wind generation of electricity.
The Wind Energy Deployment System (WinDS) model was developed by NREL (NREL 2006b) to provide a detailed approach to forecasting wind-energy development in the United States. WinDS uses a Geographic Information System database involving 356 different electricity supply and demand regions to address market issues related to wind-energy development, including access to and cost of transmission, and the intermittency
TABLE 2-3 Projected U.S. Electricity-Generation Capacity with Three Forecasts for Wind-Capacity Development (GW)
|
|
2005a |
2010 |
2015 |
2020 |
|
Total U.S. Capacityb |
955.6 |
988.4 |
964.7 |
1027.4 |
|
|
Model Projections of Installed Wind Capacity |
|||
|
EIA-AEO 2006b |
9.6 |
16.3 |
17.7 |
18.8 |
|
% of Total U.S. Capacity |
1.0% |
1.6% |
1.8% |
1.8% |
|
EERE-GPRA07c |
— |
8.9 |
18.9 |
59.0 |
|
% of Total U.S. Capacity |
|
0.9% |
2.0% |
5.7% |
|
NREL-WinDSd |
11.9 |
25.6 |
43.7 |
72.2 |
|
% of Total U.S. Capacity |
1.2% |
2.6% |
4.5% |
7.0% |
|
aValues for 2005 are model results based on historic data available at the time of the analysis. bBased on application of the NEMS. Reported in the Annual Energy Outlook for 2006 and in Supplemental Tables 73 and 89, EIA, Office of Integrated Analysis and Forecasting, U.S. Department of Energy (EIA 2006a). cBased on application of the NEMS-GPRA07 model, a modified version of the NEMS. Reported in Projected Benefits of Federal Energy Efficiency and Renewable Energy Programs FY 2007 Budget Request (NREL 2006a). dBased on application of the WinDS model developed by the NREL. Modeled national capacity totals provided to the committee on March 16, 2006, by NREL Energy Analysis Office, Golden, CO. For model information, see NREL 2006b. |
||||
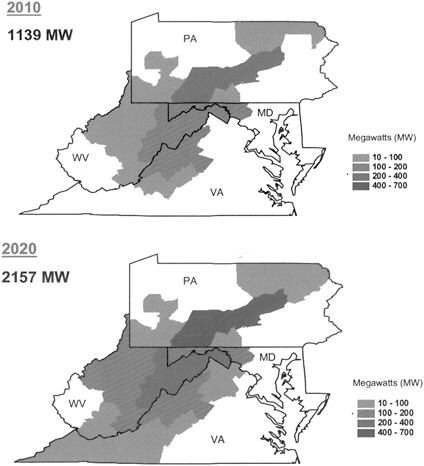
of wind. Table 2-3 provides reference case forecasts for WinDS model output provided to the committee by NREL. Figure 2-4 indicates the distribution of installed U.S. wind-capacity forecast for 2020 based on this model output. Box 2-2 illustrates the distribution of future installed wind-power capacity in the MAH based on the WinDS model. Box 2-3 shows MAH estimates related to onshore wind-capacity development. As shown in Table 2-3, estimates of onshore installed U.S. wind-energy capacity in the next 15 years range from 19 to 72 GW, or 2-7% of projected onshore U.S. installed electricity-generation capacity. If the average turbine size is 2 MW—larger than most current turbines—between 9,500 and 36,000 wind turbines would be needed to achieve that projected capacity.
The three modeling approaches represented in Table 2-3 differ in degree of geographic aggregation, in the methods for accounting for transmission and intermittency constraints, and in assumptions about future technology and development costs. Much of the difference in forecast results appears to be related to different expectations for future wind-project performance and capital costs. For example, there are large differences in expectations for decreasing capital costs with increasing market penetration. Whereas the NEMS-GPRA07 and WinDS forecasts are based on an 8% decrease in
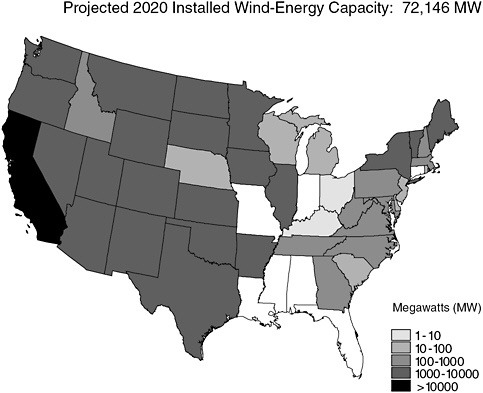
FIGURE 2-4 Projected distribution of installed wind-energy capacity in 2020 based on the WinDS model reference case. Results are shown as the state-level aggregation of 356 supply and demand regions included in the model. 10000
capital costs for every doubling of installed wind-energy capacity worldwide, the EIA-AEO forecasts are based on a 1% decrease in capital costs for every doubling of installed capacity nationwide. Fully understanding the differences in forecasts among the models, however, will be difficult without a carefully designed model comparison study. In the absence of such a study, the committee simply concludes that any forecast of future wind-energy development involves substantial uncertainty.
Although the development projections (Table 2-3 and Figure 2-4) are based on current policies and expectations for technical advancement, other scenarios could be considered that involve technical breakthroughs or major policy changes (incentives and mandates) that would result in forecasts for substantially more development (Short et al. 2006). However, major changes in technology (e.g., much larger or more efficient turbines) or major changes in policy (e.g., discounting environmental concerns and land-use constraints) may create conditions outside the range of our analy-
sis of effects (see Chapter 3). The range of forecast results (Table 2-3) is broad. There is more than a three-fold difference between the high and low projections of installed capacity in 2020. The highest projection in the table estimates about a seven-fold increase in installed capacity in 15 years. Given that only limited data are available for evaluation of both beneficial and adverse effects of existing development, especially in the MAH region, the
|
BOX 2-3 Mid-Atlantic Highlands: Development Estimates Related to Onshore Wind-Capacity Development
This comparison suggests that the WinDS forecast may be low for the MAH. The projects that are already in operation or permitted (with state and local-level approvals) represent more than half of the capacity forecast for 2020 by the WinDS model.The sum of the operating or permitted capacity and the capacity of projects in the connection queue is more than twice the capacity forecast for 2020 by the WinDS model. Although some percentage of the projects that have applied for grid connection may not go forward, it is apparent that the WinDS forecast for the MAH may be exceeded before 2020. Other analyses suggest that recently enacted renewable portfolio standard legislation by mid-Atlantic states will result in substantially more MAH wind development. Ihle (2005), for example, projects that 7,600 MW of wind capacity will be installed in the mid-Atlantic states by 2016. Most of this development would occur on MAH ridges. |
|||||||||||||||||||||
committee has not conducted analysis of effects associated with scenarios that estimate even greater increases.
Contribution of Wind-Powered Generation to Meeting Projected Electricity Demand
Between 2005 and 2020, based on the WinDS model application (Table 2-3 and Figure 2-4), installed wind-power capacity for generating electricity is projected to increase from 1 to 7% of the total installed U.S.
capacity of all electricity generator types. Projections of installed capacity alone, however, do not provide a sufficient basis for evaluating the potential contribution of wind energy to the electricity supply. As discussed earlier in this chapter, due to the intermittency of wind, installed wind-power capacity is not continuously available for electricity production. Unlike other sources of electricity, wind-generated electricity is not very dispatchable (see discussion earlier in this chapter).
Factors that Limit Wind Energy
The relatively low capacity factor of wind-powered EGUs and other intermittency-related issues affect the extent that wind energy can contribute to the electricity supply. The capacity factor, for any electric-power source, represents the amount of electricity produced in a specified period of time relative to the hypothetical maximum production for the installed capacity. For 2,624 wind turbines installed in the United States since 2000, the cumulative annual capacity factor in 2004 was 30.0% (EIA 2004a, 2004b). In contrast, the annual capacity factors for thermal power plants serving base load are typically much higher. Capacity factors for coal-fueled EGUs designed to run continuously, for example, are typically in the 70-90% range. Power plants serving peak loads, commonly fueled by natural gas, have lower capacity factors because they are dispatched on a variable basis to match variation in demand.
Because wind-powered generators have an inherently low capacity factor, the percentage of total electricity generation from wind energy is substantially less than the percentage of total installed capacity. Based on records assembled for the EIA Annual Energy Outlook 2006 (EIA 2006a), the percentage of total U.S. installed capacity provided by wind energy in 2005 was 1.0% (see Table 2-3). In contrast, the percentage of total electricity generation provided by wind energy was 0.6%. Consideration of future wind-energy contributions to electricity generation thus requires assumptions about the potential for change in capacity factor as well as projections of installed capacity.
The extent to which wind energy can contribute as a source of electricity generation also is affected by limitations related to integration with the electricity-distribution system or grid. The significance of these limitations may both increase in time as more wind-generated electricity is introduced to electricity grids and decrease as improvements to the grids are achieved. Reserve requirements, in particular, can reduce the effective load-carrying capacity of installed facilities to produce wind-generated electricity. Reserve requirements are determined by the need for dispatchable generation to respond to both variations in demand and to generation and transmission outages. To the degree that wind generation is not dispatchable, it does
not directly contribute to reserve requirements, and because fluctuations in wind-powered generation introduce additional load variance into the grid, it can increase the reserve requirement. The effective amount of electricity generation from installed wind-powered EGUs may thus be less than indicated by a simple capacity-factor adjustment.
Reserve requirements are generally met through control of conventional generators that have some amount of variable dispatch capacity and by maintenance of stand-by generators with quick-start capacity. At low wind-penetration levels, the load variance introduced by wind-generated electricity is generally small in relation to both normal operating variance and variable dispatch or quick-start capacity in the grid. This means that the need for additional reserves is generally low with initial wind-energy development, and the effective load-carrying capacity of wind-generated electricity is not necessarily reduced by the need for additional reserves. But this may change as more wind capacity is installed and a larger percentage of grid capacity is represented by wind. Estimates provided by Biewald (2005) and UWIG (2006) suggest that additional reserves are not required until the percentage of total generation provided by wind-generated electricity-generating facilities reaches 10-20%, a range that greatly exceeds the 0.6% of U.S. generation currently provided by wind energy (see Table 2-4). Experience in other areas with more wind development indicates that loss
TABLE 2-4 Projected U.S. Electricity Generation Based on Three Forecasts of Wind-Capacity Development: Billions of kWh (thousands of GWh)
|
|
2005a |
2010 |
2015 |
2020 |
|
Total U.S. Generationb |
4065.7 |
4387.7 |
4727.1 |
5107.5 |
|
|
Projections of Wind Generated Electricityb |
|||
|
EIA-AEO 2006 |
23.2 |
50.9 |
56.0 |
59.8 |
|
% of Total U.S. Generation |
0.6% |
1.2% |
1.2% |
1.2% |
|
EERE-GPRA07c |
|
27.8 |
59.8 |
187.6 |
|
% of Total U.S. Generation |
|
0.6% |
1.3% |
3.7% |
|
NREL-WinDSb |
28.7 |
80.0 |
138.1 |
229.4 |
|
% of Total U.S. Generation |
0.7% |
1.8% |
2.9% |
4.5% |
|
aValues for 2005 are model results based on historical data available at the time of the analysis. bTotal generation from all sources in the contiguous United States, based on application of the NEMS. Reported in the Annual Energy Outlook 2006, EIA, Office of Integrated Analysis and Forecasting, U.S. Department of Energy (EIA 2006a). cBased on forecasts of installed wind-generation capacity provided in Table 2-3. Capacity factors for calculation of electricity generation are based on installed capacity and generation data for wind energy provided in the Annual Energy Outlook 2006 (EIA 2006a). |
||||
of effective load-carrying capacity and the need for additional reserves may become important as wind development expands, as discussed below.
The following examples illustrate the difficulty of translating installed capacity of wind-powered electricity generation, even modified by capacity factor, into a displacement of other energy sources. Germany, for example, has more installed wind-powered generation capacity than any other country in the world (E.ON Netz 2006). Installed wind capacity was equal to about 14% of Germany’s total installed generating capacity in 2004.2 The contribution of wind energy to the “guaranteed capacity” of the German electric generation system in 2004 was only 8% of installed wind-energy capacity (less than half of the annual capacity factor) and it is projected to decrease to 4% of installed wind capacity in 2020, given an expected threefold increase in installed wind-energy capacity (E.ON Netz 2005).
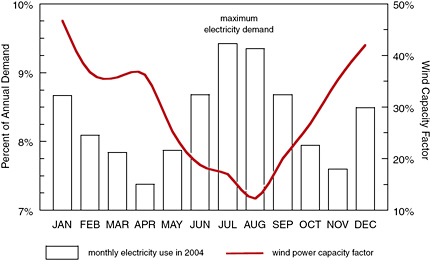
Seasonal and diurnal variation in wind energy also affect the contribution of wind-powered electricity generation relative to other power sources, and annual capacity factors do not account for this temporal variation in the contribution of wind energy. In many areas of the United States, the availability of wind energy is lowest in the afternoon hours of summer months when both the demand and the rate of growth in demand for electricity are the highest. As indicated above, for 2,624 wind turbines installed in the United States since 2000, the cumulative average annual capacity factor in 2004 was 30.0%. For the same turbines, the cumulative average August capacity factor was 22.7%, or about 25% less than the annual capacity factor (EIA 2004a, 2004b). Box 2-4 presents monthly variability in electricity demand and wind capacity factor in the MAH states.
Estimating the Effective Electricity Generation from Installed Wind-Energy Capacity
In the absence of information concerning the need for increased reserve capacity or other effects of temporal variation in wind energy, annual average capacity factors provide a reasonable basis for approximating the effective amount of electricity generated from installed wind-energy capacity. However, this approximation may prove unreliable for specific projects or regions, and we acknowledge uncertainty concerning the effect of rapidly expanding wind development. Perhaps of more importance, although current capacity factors for wind development can be calculated based on available capacity and generation data (e.g., EIA data reports), the estimation of future capacity factors involves assumptions and unspecified uncertainty.
Projections for both installed wind-energy capacity and wind-powered electricity generation included in the EIA Annual Energy Outlook (reference-case forecasts; EIA 2006a) indicate that the annual average capacity factor for all installed wind capacity (not just new projects) will increase from 27.5% in 2005 to 36.2% in 2020. In contrast, the EERE has assumed that future capacity factors will be substantially higher, given projected results of the EERE Wind Technologies Program (NREL 2006a).3 The committee has used the EIA estimates of capacity factor to assess the effective amount of electricity generated from wind-powered EGUs in both the United States and the MAH subregion. The EIA capacity-factor estimates allow for moderate improvement in technology, they account for the fact that future installed capacity will be a mix of both older and newer turbines, and they are intermediate between currently observed capacity factors and the most optimistic forecasts of future capacity factors. It also seems reasonable to expect additional constraints on wind-powered EGU performance as accessible areas with higher-class winds are exploited and development expands into areas with lower-class winds.
Table 2-4 provides forecasts for wind-generated electricity through 2020 in relation to forecasts of total electricity generation through 2020. These forecasts are based on the model projections of installed onshore wind-energy capacity in the contiguous United States provided in Table 2-3 and on projections of total U.S. generation capacity provided in the EIA Annual Energy Outlook for 2006 (EIA 2006a). The forecasts for both wind generation and total generation are for onshore wind-energy development in the contiguous United States. As discussed above, the forecasts for wind-energy generation are adjusted for capacity-factor limitations, but not for other potential effects of the temporal variation in wind.
As with the range of forecasts for installed wind-powered EGU capacity in Table 2-3, the range of forecasts for their effective electricity generation in Table 2-4 suggests a high degree of uncertainty. The forecasts, however, provide a context for evaluating both the electricity supply and air-quality benefits of future wind-energy development in the United States. The highest forecast for 2020 indicates that wind-energy development will provide 7.0% of total installed electricity-generation capacity, and 4.5% of electricity generation, which is consistent with the fact that wind turbines generally have a lower capacity factor than other electricity-generation sources. It is also significant that the forecast growth in wind-energy development will
|
3 |
For input to the NEMS-GPRA07 model, EERE estimated different capacity factors depending on program support for research and development (NREL 2006a). The estimated capacity factors for new onshore wind projects with Class 4 winds in 2020 were 46.9 and 37.2%, with and without projected program results. EERE did not report estimates for Class 3 winds, although Class 3 winds are now being developed, and areas with Class 3 winds are far more extensive than areas with higher-class winds (see Table 2-2). |
occur in a context of rapidly increasing electricity demand. Although wind-energy development has been identified as one of the fastest-growing energy sources in the United States, this growth has typically been represented in terms of a percentage change in installed wind-energy capacity (e.g., GAO 2004; EERE 2006). In order to evaluate the potential contribution of wind-energy development to the electricity supply, we have examined projected growth in wind-powered electricity generation in relation to projected growth in total electricity generation. Based on the EIA forecasts in Table 2-4, total electricity generation from all sources is projected to increase by more than 1,000,000 gigawatt-hours (GWh) between 2005 and 2020. As shown in Figure 2-5, the projected increase in wind generation is expected to account for 3.5 to 19.3% of this increase in total generation. Thus, based on projections examined by the committee, 80.7 to 96.5% of the growth in U.S. electricity generation by 2020 is expected to be obtained from generation sources other than wind.
Contribution of Wind Energy to Air-Quality Improvement
Our approach to assessing the benefits of wind-energy development for air-quality improvement focuses on displacement of several of the pollutant emissions from fossil-fueled EGUs (in this case, CO2, NOx, and SO2).
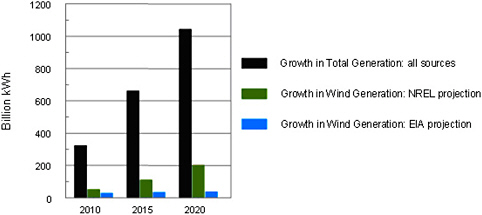
FIGURE 2-5 Cumulative growth in total annual electricity generation between 2005 and 2020, compared with projected growth in onshore wind generation. Total electricity generation in the United States in 2020 is projected to exceed total generation in 2005 by 1041.8 billion kWh. Electricity generation with wind power in 2020 is projected to exceed wind generation in 2005 by 36.6 to 200.7 billion kWh. The projections for growth in total generation and wind generation are based on the data provided in Table 2-4.
A more informative assessment would account for atmospheric residence times, transport patterns, atmospheric chemistry, and the response properties of environmental receptors, all of which are beyond the practical scope of our task.
Estimating Emissions Displacement
The generator types associated with the U.S. electricity supply differ greatly in terms of their contributions to total generation and pollutant emissions (Figure 2-6). Despite the inevitable uncertainties (discussed previously in this chapter), emissions-displacement analysis is needed for policy and regulatory decisions (Appendix B, Table B-1). The wide range of emissions-displacement rates results from different quantitative approaches, as well as differences related to the geographic distribution of generator types and the achievement of emission reductions through air-quality regulation.
A simple approach to evaluation of emissions displacement on a large regional scale is illustrated by a recent Programmatic Environmental Impact Statement (PEIS) prepared for assessment of wind-energy development on western U.S. lands administered by the Bureau of Land Management (BLM 2005a). The BLM-PEIS, which relied in part on emissions data from the early 1990s, compared two extremes, 100% coal displacement and 100%
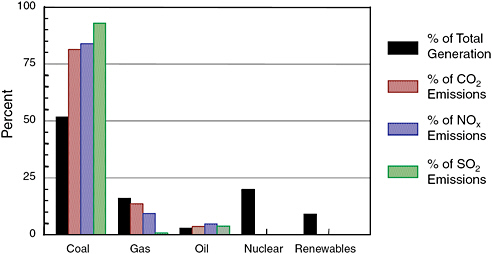
FIGURE 2-6 Percentage of electricity generation provided by generator types in relation to the percentage of CO2, NOx, and SO2 emitted from all electricity generation in the United States. The renewables include hydroelectric, biomass, wood, solar, and wind.
SOURCE: Based on data for 2000 (EPA 2006b).
natural-gas displacement. Although the emissions reductions associated with displacement of coal generation dramatically exceeded the emissions reductions associated with displacement of natural-gas generation (see Appendix B, Table B-1), the BLM-PEIS provided no analysis or other basis for favoring either extreme.
The BLM-PEIS treatment of the emissions-displacement issue may actually be appropriate given the problems and uncertainties associated with more detailed analyses. However, simply providing bounds for the potential emissions-displacement benefits of wind-energy development (or other renewable-energy and energy-efficiency initiatives) is not sufficient for many regulatory and policy purposes. A number of methods for determining specific emissions-displacement rates have thus been developed and applied. These methods can generally be assigned to two categories:
-
Methods based on emissions rates associated with affected fossil-fuel-fired EGUs.
-
Methods based on system-average emissions rates.
The methods in the first category are potentially the most reliable, although the data requirements are much greater, the analysis is far more complex, and the issue of transparency is more difficult. Identification of affected EGUs generally requires application of a system-dispatch model. This involves accounting for the temporal distribution of wind energy or actual wind generation, the identity and operational properties of EGUs operating on the margin, and transmission limits or other dispatch constraints. Analysis of long-term displacement must also consider the introduction of new EGUs to meet increasing baseload (continuous demand over a long period) and peaking demand, as well as the retirement of old EGUs.
System-dispatch models can be used either to determine emissions displacement from specific fossil-fuel-fired EGUs or to determine emission-displacement rates associated with fossil-fuel-fired EGUs on the operating margin. The focus on the operating margin is based on economic-dispatch order, which means that the most expensive EGUs are the first to be displaced when less expensive generation is available. The most expensive units are generally those that provide peaking power or respond to short-term variation in demand (e.g., such as by natural-gas-fueled generators), rather than those that provide baseload power (e.g., such as by nuclear and coal-fueled generators). Strict adherence to economic-dispatch order, however, may be compromised by transmission limitations and requirements to maintain an acceptably low risk of loss of supply.
Although system-dispatch modeling often is identified as the preferred method for estimating emissions displacement, its use and acceptance are limited by the problem of access to necessary, but proprietary, technical
and information resources. System-dispatch models are generally owned and used by utility companies, grid operators, or private consultants. The input data required by such models, including information on grid structure and performance, costs and dispatch properties of EGUs, and detailed wind-energy information, are generally not available to either the public or resource-management agencies. Box 2-5 discusses the issues of transparency in developing emission-reduction estimates for MAH. Given this lack of transparency, it can be difficult or impossible for independent parties to objectively review and verify emissions-displacement estimates based on system-dispatch modeling.
System-average emission rates are commonly used for analysis of emissions displacement when the data and resources needed for system-dispatch modeling are unavailable (NESCAUM 2002; Keith et al. 2003; UNFCCC
|
BOX 2-5 Mid-Atlantic Highlands: Transparency and Emissions Reduction Estimates Transparency has been identified as an accounting principle that must be applied for credible quantification and public acceptance of emissions reductions claims (WBCSD and WRI 2005). Although system-dispatch modeling potentially offers the most reliable approach for estimating the emissions-displacement benefits of wind-energy projects, actual model applications have varied with respect to transparency. For example, default emissions-displacement rates were determined for use in an emissions-benefit workbook developed by the Ozone Transport Commission for evaluating renewable-energy and energy-efficiency projects in three eastern U.S. grid regions, including the PJM grid region that includes the MAH (OTC 2002). In this case, the estimated emissions-displacement rates were attributed to EGUs operating on the margin. Although the associated documentation identified the data sources, as well as important assumptions, minimal information was provided about the proprietary simulation model that was applied to identify displaced units and estimate emissions-displacement rates (Keith et al. 2002). In other examples, emissions-displacement rates were developed as a basis for crediting municipal wind-energy purchases with emission reductions (Hathaway et al. 2005) or for assessing the air-quality benefits of specific wind-project proposals (High and Hathaway 2006). Model results in these cases indicated that displaced emissions would either exclusively or predominantly be associated with coal-fueled generating units. Again, however, only minimal details concerning the model applications were provided. Moreover, although the associated documentation identified some of the data sources, critical data, including proprietary or confidential information related to both wind-energy performance and identification of the displaced generating units, were not provided. |
2006). System-average emission rates are calculated by dividing total system emissions by total system generation, providing a single emission rate expressed as mass of pollutant per unit of electricity generation (e.g., lbs/ MWh). Given an estimate of potential electricity generation from wind-energy development or any other source, this rate can be applied to estimate the mass of pollutant that would be emitted to obtain the same generation from the existing mix of EGUs in the system. The advantage of the system-average emission rate is that it can be applied relatively easily, using emissions and generation data that are publicly available. A disadvantage is that it tends to be weighted toward emissions from fossil-fuel-fired EGUs that supply baseload rather than fossil-fuel-fired EGUs operating on the margin. This means that use of the system-average rate will overestimate emissions displacement in grid regions where baseload is dominated by high-emission generation (e.g., coal-fueled EGUs) and underestimate emissions where baseload is dominated by low-emission generation (e.g., nuclear and hydroelectric EGUs). A potentially useful modification is to use the marginal-average emission rates instead of the system-average emission rate. This may work well in grid regions where the fossil-fuel-fired EGUs operating on the margin are relatively uniform with respect to emissions. However, in other areas, such as the PJM grid region, which has both coal-fueled and natural-gas-fueled EGUs operating on the margin (PJM 2006a), marginal-average emission rates would be weighted toward the higher emission rates associated with the coal-fueled EGUs, regardless of which type of EGU would actually be displaced by wind-energy generation.
Emissions Displacement in Context
In this section, the committee examines the potential for obtaining reductions in emissions of NOx, SO2, and CO2 through the increased use of wind energy to generate electricity. The comparative lack of air-pollutant emissions has been identified as the most important environmental benefit of wind energy (AWEA 2006e). Evaluation of these benefits, however, is complicated by a number of contextual factors in addition to the problem of identifying emissions-displacement rates. These factors include the presence of emissions from sources other than fossil-fuel-fired EGUs, continuing growth in demand for electricity, and changing emission rates for fossil-fuel-fired EGUs. Other differences in environmental impacts of various sources of energy are potentially important (e.g., species and habitat impacts), although they are not addressed here for the reasons given earlier (see Chapter 3 for a discussion of ecological impacts of wind energy).
Wind development can only displace emissions from electricity-generation sources. It is expected that emissions associated with most industry, home heating, and transportation will not be affected by changes in sources
of electricity generation. In 2001 about 68% of anthropogenic SO2 emissions, but only about 23% of anthropogenic NOx emissions, in the United States were associated with the burning of fossil fuels for electricity generation (EPA 2005).
The largest source of SO2 emissions is coal combustion; the largest source of NOx emissions is transportation (EPA 2006c). About 39% of anthropogenic CO2 emissions in the United States in 2001 resulted from electricity generation, while the balance was derived from other sources (EIA 2006d).
The task of evaluating air-quality benefits of wind-powered electricity generation is complicated by increasing electricity use and changing emission rates for fossil-fuel-fired EGUs. Reference case projections provided in the EIA Annual Energy Outlook for 2006 (EIA 2006a) indicate that generation of electricity in the United States will increase at an average rate of 1.6% per year between 2004 and 2030. Despite this growth, emissions from fossil-fuel-fired EGUs of NOx and SO2, which are subject to regulatory controls, are projected to decrease by an average of 4.0 and 2.1% per year. Emissions from fossil-fuel-fired EGUs of CO2, which are largely uncontrolled, are projected to increase by an average of 1.4% per year. The opposing changes in emissions influence projections of future trends in system-average emission rates (in units of lbs/MWh) between 2000 and 2020 (Table 2-5). The table shows that emissions of all three pollutants are expected to decrease on a per unit of energy basis. However, whereas system-average emission rates for NOx and SO2 are projected to decline by 72 and 74%, system-average emission rates for CO2 are projected to decline by only 12%. As indicated in Figure 2-7, the projected increase in electricity generation, the concurrent decrease in emissions of NOx and SO2 from fossil-fuel-fired EGUs, and the concurrent increase in emissions of CO2 from those EGUs, all represent continuations of pre-existing trends.
TABLE 2-5 Observed and Projected System-Average Emission Rates for U.S. Electricity Generation (lbs/MWh)
|
|
2000a |
2005b |
2010b |
2015b |
2020b |
|
CO2 |
1392 |
1287 |
1272 |
1241 |
1223 |
|
NOx |
2.96 |
1.92 |
1.07 |
0.89 |
0.83 |
|
SO2 |
6.04 |
5.28 |
2.69 |
1.96 |
1.58 |
|
aBased on total electrical generation and associated emissions in 2000, reported in the eGRID database (EPA 2006b). bBased on forecasts of total electrical generation and associated emissions provided in the Annual Energy Outlook 2006, EIA, Office of Integrated Analysis and Forecasting, U.S. Department of Energy (EIA 2006a). The committee has not assessed the uncertainty associated with these estimates. |
|||||

FIGURE 2-7 Past and projected changes in emissions of CO2, NOx, and SO2 from EGUs in relation to the past and projected increase in electricity generation. Data through 2000 are observed; data for 2005-2030 are projected. Generation data were obtained from EIA (2006c, 2006a); emissions data were obtained from EPA (2005) and EIA (2004c, 2006a).
U.S. emissions data for 1970-2003 indicate that emissions of SO2 from fossil-fuel-fired EGUs declined 37%, while emissions of NOx from those EGUs declined 9% (EPA 2005). These past declines in emissions of NOx and SO2, as well as the projected future declines, can be attributed to implementation of the Clean Air Act and related regulatory programs. Future declines are also expected to result from the upcoming implementation of the Clean Air Interstate Rule (CAIR). Because both pollutants are subject to emissions caps and allowance trading, there is only limited opportunity to achieve additional emissions reductions with wind-energy development.4 In the context of a “cap-and-trade” program, a reduction in emissions requires a reduction in the emissions cap. One means for wind-energy projects to achieve this is through allowance “set-asides,” whereby a percentage of the allowed emissions under the cap are available
for retirement commensurate with emission reductions credited to renewable-energy or energy-efficiency projects (see Keith et al. 2003; EPA 2004; Bluestein et al. 2006). At present there is no set-aside program for SO2 allowances, although set-asides for NOx allowances can be established by states affected by the CAIR. Emissions-displacement rates for NOx set-asides of 1.5 lbs/MWh through 2015 and 1.25 lbs/MWh after 2015 have been proposed by the EPA (Bluestein et al. 2006). However, the potential for emissions-cap reductions due to wind development remains uncertain. In the six states that have established NOx set-asides, only 1 to 5% of total NOx allowances are reserved for set-asides, and this amount can be allocated to either renewable-energy or energy-efficiency projects. The National Research Council (NRC 2006) pointed out that cap-and-trade programs have potential pitfalls and that such programs can result in emission trades from one location to another and from one period to another with potentially detrimental consequences. However, analytical tools are not sufficient to assess the potential effect of cap-and-trade programs on local air quality or the extent to which wind-powered EGUs might alter those effects. In contrast to NOx and SO2, emissions of CO2 from fossil-fuel-fired EGUs or other sources are not subject to national regulatory controls or emissions caps, although subregional control efforts have been initiated (RGGI 2006) and various national controls have been proposed (see Johnston et al. 2006). Thus, to the extent that CO2-emitting sources of electricity generation are displaced, wind-energy development can achieve displacement of CO2 emissions. As indicated above, however, CO2 emissions from fossil-fuel-fired EGUs are projected to increase an average of 1.4% per year between 2004 and 2030 (reference-case forecast; EIA 2006a). Moreover, as also indicated above, fossil-fuel-fired EGUs accounted for about 39% of anthropogenic CO2 emissions in the United States in 2005 (EIA 2006d). Compared with just the projections for CO2 emissions from fossil-fuel-fired EGUs, the potential for offsetting emissions with wind-energy development is illustrated by Figure 2-8, which compares projected annual emissions of CO2 from fossil-fuel-fired EGUs in the United States with offsets that might be achieved through wind-energy development. The estimated offsets are based on the maximum forecasts for wind-powered generation of electricity provided in Table 2-4 and on the system-average emission rates for CO2 listed in Table 2.5. Based on this comparison, the effect of wind development by 2020 is expected to offset CO2 emissions from fossil-fuel-fired EGUs in the United States by 4.5%. If fossil-fuel-fired EGUs continue to account for less than half of anthropogenic CO2 emissions in the United States, then the effect of projected wind-energy development in 2020 would be to offset total anthropogenic CO2 emissions by less than 2.25%. However, potential technological improvements in emission controls, and other factors that will affect total CO2 emissions, are as hard to predict for the
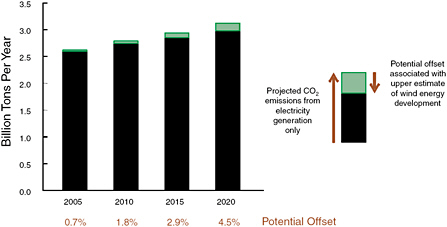
FIGURE 2-8 Projected increase in U.S. CO2 emissions from EGUs and potential offsets associated with wind-energy development. CO2 emissions are based on forecasts reported in the Annual Energy Outlook 2006 (EIA 2006a). CO2 offset estimates are based on the maximum forecasts for U.S. wind-powered generation of electricity provided in Table 2-4 and on the system-average emission rates provided in Table 2-5.
transportation and industrial sectors as for the electricity-generation sector, and so the total reduction of U.S. anthropogenic CO2 emissions by wind-energy development in 2020 could be more or less than 2.25%.
A range of potential offsets can be estimated based on emissions rates for coal-fueled and natural-gas-fueled EGUs. In 2000, the average CO2 emissions rate for coal-fueled EGUs in the United States was about 157% of the system-average emissions rate; the average CO2 emissions rate for natural-gas-fueled EGUs was about 85% of the system-average emissions rate (see Appendix B, Table B-1). Based on these values, the range of potential CO2 emissions offsets given the maximum forecast for U.S. wind-powered generation of electricity in 2020 is 3.8 to 7.1% of projected emissions from EGUs.
CONCLUSIONS
Electricity generated from different sources is fungible. Depending on factors such as price, availability, predictability, regulatory and incentive regimes, and local considerations, one source might be preferentially used over others. The importance of the factors changes over varying time and space scales. As a result, a more complete understanding of the environmental and economic effects of any one energy source depends on a more complete understanding of how that energy source displaces or is displaced
by other energy sources, and on a more complete understanding of the environmental and economic effects of all other available energy sources. LCA can be used to help fulfill that need.
-
Projections for future development of wind-powered electricity generation, and hence projections for future wind-energy contributions to reduction of air-pollutant emissions in the United States, are highly uncertain. However, some insight can be gained from recent model projections by the U.S. Department of Energy. Estimates for onshore installed U.S. windenergy capacity in the next 15-year range from 19 to 72 GW, or 2 to 7% of projected U.S. installed electricity-generation capacity.5 In part because the wind blows intermittently, wind turbines often produce less electricity than their rated maximum output. On average in the MAH, the capacity factor of wind turbines is about 30% for current technology, forecast to improve to near 37% by the year 2020. The projections the committee has used in this chapter suggest that onshore wind-energy development will contribute about 60 to 230 billion kWh, or 1.2 to 4.5% of projected U.S. electricity generation in 2020. In the same period, wind-energy development is projected to account for 3.5 to 19% of the increase in total electricity-generation capacity. If the average turbine size is 2 MW—larger than most current turbines—between 9,500 and 36,000 wind turbines would be needed to achieve that projected capacity.
-
Projections for future wind-energy contributions to air-pollution emissions reductions in the United States also are uncertain. However, given that current and future regulatory controls on emissions of NOx and SO2 from electricity generation in the eastern United States involve total caps on emissions, the committee concludes that development of wind-powered electricity generation using current technology probably will not result in a significant reduction in total emission of these pollutants from EGUs in the mid-Atlantic region. Using the future projections of installed U.S. energy capacity by the U.S. Department of Energy, we further conclude that development of wind-powered electricity generation probably will contribute to offsets of about 4.5% in emissions of CO2 from electricity generation sources in the United States by the year 2020. In 2005, emissions of CO2 from electricity generation were estimated to be 39% of all CO2 emissions in the United States.
-
Although the wind resource in the MAH is closer to electricity markets and transmission lines than much of the wind resource in the United
-
States, a smaller portion of the mid-Atlantic region has high-quality wind resources than does the United States as a whole. As a result, wind energy will likely contribute proportionally less to electricity generation in the midAtlantic region than in the United States as a whole.
-
Electricity generated in the MAH—including wind energy—is used in a regional grid in the larger mid-Atlantic region. Electricity generated from wind energy in the MAH has the potential to displace pollutant emissions, discharges, wastes, and other adverse environmental effects over the life cycle of other sources of electricity generation in the grid, but that potential is less than 4.5%, and the degree to which its beneficial effects would be felt in the MAH is uncertain.
-
In the presence of more aggressive renewable-energy-development policies, potential increased energy conservation, and improving technology of wind-energy electricity generation and transmission, the above findings may underestimate wind energy’s contribution to total electricity production. This would affect the committee’s analysis, including projections for development and associated effects (e.g., energy supply, air pollution, development footprint). On the other hand, if technological advances serve to reduce the emissions and other negative effects of other sources of electricity generation, or if fossil-fuel prices fall,6 our findings may overestimate wind energy’s contribution to electricity production and air-pollution offsets.


