
6
Renewable Energy
This chapter reviews the status of renewable resources as a source of usable energy. It describes the resource base, current renewables technologies, the prospects for technological advances, and related economic, environmental, and deployment issues. While the chapter’s focus is on renewables for the generation of electricity, it also includes short discussions of nonelectrical applications. The use of biomass to produce alternative liquid transportation fuels is not covered in this chapter but rather in Chapter 5.
CURRENT STATUS OF RENEWABLE ELECTRICITY
Generation of Renewable Electricity in the United States
Renewables currently account for a small fraction of total electricity generation. According to the U.S. Energy Information Agency (EIA, 2007), conventional hydropower is the largest source of renewable electricity in the United States. Representing about 71 percent of the electric power derived from renewable sources, hydropower generated 6 percent of the electricity—almost 250,000 GWh out of a total of 4.2 million GWh—produced by the electric power sector in 2007.1
The nonhydropower sources of renewable electricity together contributed 2.5 percent of the 2007 total. Within this group, biomass electricity generation (called
“biopower”)2 is the largest source, having produced 55,000 GWh in 2007. Wind power and geothermal supplied 32,000 GWh and 14,800 GWh, respectively, during that year. Except for wind power, none of these sources has grown much since 1990 in terms of either total electric power production or generation capacity.
The largest growth in the use of renewable resources for electricity generation is currently in wind power and, to a lesser extent, in solar power. Wind power technology, having matured over the last two decades, now accounts for an increasing fraction of total electricity generation in the United States. Though wind power in 2007 represented less than 1 percent, it grew at a 15.5 percent compounded annual rate over the 1990–2007 period and at a 25.6 percent compounded annual growth rate between 1997 and 2007. Wind power supplied almost 6,000 GWh more in 2007 than it had the year before. According to the American Wind Energy Association, an additional 8,300 MW of capacity was added in 2008 (AWEA, 2009a), representing an additional yearly generation of 25,000 GWh assuming a 35 percent capacity factor.3 By the end of 2008, the overall economic downturn had caused financing for new wind power projects and orders for turbine components to slow, and layoffs began in the wind turbine manufacturing industry (AWEA, 2009a). Thus new capacity in 2009 recently looked to be considerably smaller than in 2008. However, AWEA (2009b) recently reported that 2.8 GW of new wind power generation capacity was installed in the first quarter of 2009. Further, analysis of the American Recovery and Reinvestment Act (ARRA) of 2009 shows that by 2012 wind power generation will more than double what it would have been without the ARRA (Chu, 2009).
Central-utility electricity generation from concentrating solar power (CSP) and photovoltaics (PV) combined was 600 GWh in 2007, just 0.01 percent of the U.S. total—a fraction that has been approximately constant since 1990. However, this estimate does not include contributions from residential and other small PV installations, which now account for the strongest growth in solar-derived electricity. Installations of solar PV in the United States have grown at a compounded annual growth rate of more than 40 percent from 2000 to 2005, with a genera-
tion capacity of almost 480 MW that, assuming a 15 percent capacity factor, produces approximately 630 GWh.
Current Policy Setting
At present, electricity generation from non-hydropower renewable sources is generally more expensive than from coal, natural gas, or nuclear power—the three leading U.S. options. Thus policies at the state and federal levels have provided the key incentives behind renewable sources’ recent penetration gains.
One such policy is the renewables portfolio standard (RPS), which typically requires that a minimum percentage of the electricity produced or sold in a state be derived from some collection of eligible renewable technologies. Given that these RPSs have been developed at the state level, there are many different versions of them. The policies differ by the sources of renewables included (some states specify conventional hydropower or biopower); by the form, timeline, and stringency of the numerical goals; and by whether the goals include separate targets for particular renewable technologies. As of 2008, 27 states and the District of Columba had RPSs and another 6 states had related voluntary programs. Wiser and Barbose (2008) estimate that full compliance with these RPSs would result in an additional 60 GW of new renewables capacity by 2025. Assuming a 35 percent capacity factor, which means that the capacity produces electricity for approximately 3070 hours per year, an additional 180,000 GWh from renewable sources would be generated. This is compared to the estimated total of 4.2 million GWh generated in 2007.
Federal policies are also contributing to this era of strong growth in renewable-energy development. The major incentive, particularly for wind power, is the Federal Renewable Electricity Production Tax Credit (referred to simply as the PTC), which provides a $19 tax credit (adjusted for inflation) for every megawatt-hour (equivalent to 1.9¢/kWh) of electricity generated in the first 10 years of life of a private or investor-owned renewable electricity project brought on line through the end of 2008.4 Congress most recently extended the PTC and expanded incentives for 1 year in the Emergency Economic Stabilization Act of 2008 and the ARRA of 2009. These two bills together extend the PTC for wind through 2012 and the PTC for municipal solid waste, qualified hydropower, biomass, geothermal, and marine and hydrokinetic renewable-energy facilities
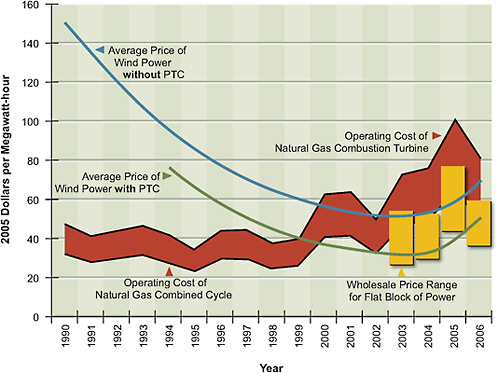
FIGURE 6.1 Impacts of the PTC on the price of wind power compared to costs for natural-gas-fired electricity.
Source: Wiser, 2008.
through 2013. Because of concerns that the current slowdown in business activity will reduce the capabilities of projects to raise investment capital, the ARRA allows owners of nonsolar renewable-energy facilities to elect a 30 percent investment tax credit rather than the PTC. Figure 6.1 shows the impact of the PTC on the price of wind power versus that of natural-gas-fired electricity, though it should be noted that other current electricity sources, such as coal, hydropower, and nuclear, have lower operating costs than do natural gas combined-cycle plants.
RESOURCE BASE
Size of Resource Base
The United States has significant renewable-energy resources. Indeed, taken collectively they are much larger than current or projected total domestic energy and electricity demands. But renewable resources are not evenly distributed spatially and temporally, and they tend to be diffuse compared to fossil and nuclear energy. Further, although the sheer size of the resource base is impressive, there are many technological, economic, and deployment-related constraints on using these sources on a large scale.
The United States has significant wind energy resources in particular; Figure 6.2 shows their distribution across the country. The total estimated electri-
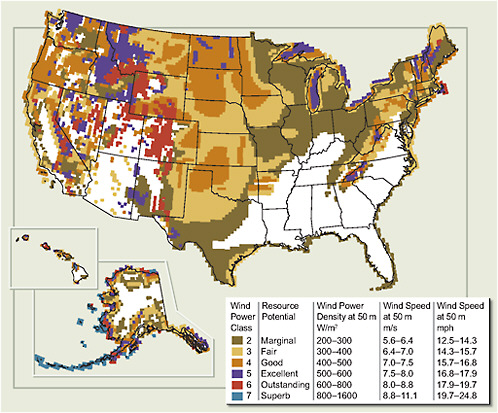
FIGURE 6.2 U.S wind resource map showing various wind power classes. Areas shown in white have class 1 wind resources.
Source: NREL, 2007a.
cal energy potential for the continental U.S. wind resource in class 3 and higher wind-speed areas is 11 million GWh/yr (Elliott et al., 1991), greater than the 2007 electricity generation of about 4 million GWh. The 11 million GWh estimate was obtained from point-source measurements of the wind speed at a height of 50 meters (m); the actual value could differ substantially (Elliott et al., 1986). On the one hand, modern wind turbines can have hub heights of 80 m or greater, where larger wind energy resources are likely available. On the other hand, computer-model simulations of very-large-scale wind farm deployments have shown that an agglomeration of point-source wind speed data over large areas can significantly overestimate the actual wind energy resource (Baidya et al., 2004). Estimating the upper-bound limit for extraction of the resource at 20–25 percent of the energy in the wind field, and using the total domestic onshore wind electricity potential value of 11 million GWh, an upper bound for the annual extractable wind electric potential is perhaps 2–3 million GWh. This potential resource base is about half of the current electrical power use in the United States, and significant offshore wind energy resources also exist and increase the wind resource base considerably.
The solar energy resource also is very large indeed. Taking solar insolation to be a representative midlatitude, day/night average value of 230 W/m2, in conjunction with the area of the continental United States of 8 × 10¹² m2, yields a yearly averaged and area averaged power-generation potential of 18.4 million GW. At 10 percent average conversion efficiency, this resource would therefore provide 1.6 billion GWh of electricity annually. For 10 percent conversion efficiency, coverage of 0.25 percent of the land of the continental United States would be required to generate the total 2007 domestic electrical generation value of 4 million GWh. However, the solar resource is very diffuse and, as shown in Figure 6.3, distributed unevenly across the country.
Additionally, the various technologies for tapping solar energy utilize different aspects of sunlight. Because CSP, for example, can exploit only the focusable direct-beam portion of sunlight, highly favored sites are located almost exclusively in the Southwest. Further, because CSP can use only the direct-beam portion of sunlight, energy input to the CSP plants falls to zero in the presence of clouds. However, most designs today decouple energy collection from the power cycle through the use of thermal storage, and thus the power output of the CSP plant will not immediately fall to zero in the presence of clouds. A recent analysis, which identified lands having high average insolation (>6.75 kW/m2 per day) and excluded regions of such lands having a slope >1 percent or a small (<10 km2) continuous area, estimated that CSP could deliver an average of
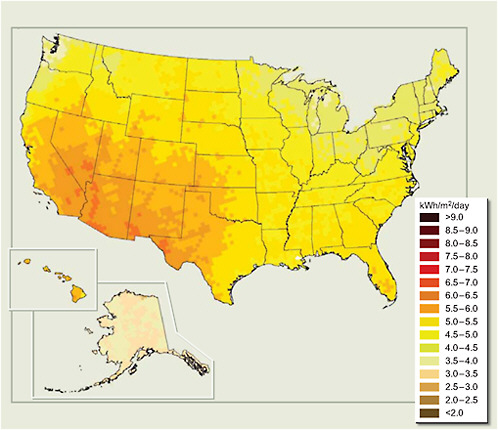
FIGURE 6.3 Solar energy resources in the United States.
Source: NREL, 2007b.
15–30 million GWh/yr of electrical energy, which is 4–7 times larger than the total U.S. supply (ASES, 2007).
Flat-plate PV arrays can be distributed more widely than concentrated solar power systems because flat-plate systems effectively utilize both the diffuse and the direct-beam components of sunlight. Analyses of the total rooftop area that would be suitable for installation of PV systems have produced resource estimates ranging from 0.9–1.5 million GWh/yr (ASES, 2007) to 13–17.5 million GWh/yr (Chaudhari et al., 2004). Only a fraction of rooftops and other lands can be developed economically at present for solar-based electricity generation, however; it is the economics of solar technologies, not the size of the potential resource, that
significantly limit the ability of solar electricity alone to contribute substantially to electricity production.
There are two components to the geothermal resource base: hydrothermal (water heated by Earth) that exists down to a depth of about 3 km, and enhanced geothermal systems (EGS) associated with low-permeability or low-porosity heated rocks at depths down to 10 km. There is some potential for expanding electricity production from the hydrothermal resources and thus affecting regional electricity generation—for example, a regional study of known hydrothermal resources in the western states found that 13 GW of electric power capacity exists in identified resources within this region (WGA, 2006)—but in general, the resources are too small to have a major overall impact on total electricity generation in the United States.
It is the heat stored in the low-permeability and/or low-porosity rocks at great depths that represents the much larger resource base. As noted in a recent Massachusetts Institute of Technology study, a much larger potential for energy exists with EGS resources (MIT, 2006). The estimated geothermal resource below the continental United States, defined as the total amount of heat trapped to 10 km depth, has been estimated to be in excess of 1.3 × 1025 J (MIT, 2006). This is more than 130,000 times the total 2005 U.S. energy consumption of 1.00 × 10²⁰ J. However, beyond the total amount of potentially available energy, the rate of extraction of this energy is especially critical in assessing the actual practical potential of this energy source. The mean geothermal heat flux at Earth’s surface is on the order of 50 mW/m2, and in many areas, the geothermal heat flux is significantly less than this value. Given that the electrical generation efficiency from use of this relatively low-temperature heat in a steam turbine is about 15 percent, the extractable and sustainable electrical power density from the geothermal resource is on the order of 10 mW/m2. To provide substantial power, heat must be extracted at rates in excess of the natural geothermal heat flux (heat mining) in order to usefully tap sufficient geothermal resources. Indeed, the MIT report (2006) notes that some temperature drawdown should occur if EGS resources are to be used in their most efficient manner. The substantial technical challenges associated with tapping this resource are discussed later in this chapter.
Other renewable resources, including conventional hydropower, hydrokinetics (wave/tidal/current), and biomass, have significant resource bases, too. Because the conventional hydroelectric resource is generally accepted to be near its maximum utilization in the United States, further growth opportunities are relatively small. Regarding hydrokinetics, one study puts the size of the wave
energy resource for the East and West Coasts at more than 0.5 million GWh/yr (EPRI, 2005). This study also estimates the wave energy base in Alaska to be 1.3 million GWh/yr, though it is unclear whether such a resource could be fully exploited. EPRI (2005) put the capacity of the tidal energy resource at a 152 MW annual average, which corresponds to an annualized electrical energy production of 1300 GWh/yr. The biomass resource base is discussed in Chapter 5.
Findings: Resource Base
Solar and wind renewable resources offer significantly larger total energy and power potential than do other domestic renewable resources. Solar energy is capable, in principle, of providing many times the total U.S. electricity consumption, even assuming low conversion efficiency. The land-based wind resource also is capable of making a substantial contribution to meeting current U.S. electricity demand without stressing the resource base. For these reasons, solar and wind resources are emphasized, but other non-hydroelectric renewables can make significant contributions to the electrical energy mix as well, at least in certain regions of the country. However, renewable resources are not distributed uniformly. Resources such as solar, wind, geothermal, tidal, wave, and biomass vary widely in space and time. Thus, the potential to derive a given percentage of electricity from renewable resources will vary from location to location. Awareness of such factors is important in developing effective policies at the state and federal level to promote the use of renewable resources for generation of electricity.
RENEWABLE TECHNOLOGIES
A renewable electricity-generation technology harnesses a naturally existing energy flux, such as wind, sun, or tides, and converts that flux into electricity. Such technologies range from well-established wind turbines to pilot-plant hydrokinetic systems to methods, such as those that exploit salinity and thermal ocean gradients, that are in the conceptualization or demonstration stages. Some of these technologies produce power intermittently (technologies that rely on wind and solar resources), whereas others are capable of producing baseload power (technologies that rely on hydropower, biomass, and geothermal resources). Though renewable-electricity technologies show much variability, they do have several shared characteristics: (1) the largest proportions of costs, external energy needs, and material
inputs occur during the manufacturing and installation stages; (2) there are no associated fuel costs (except for biomass-fueled electricity generation); (3) opportunities for achieving economies of scale are greater at the manufacturing stage than at the generating site—larger-generation units do not necessarily reduce the average cost of electricity generation as much as they do for coal-fired or nuclear plants; and (4) renewable electricity technologies can be deployed in smaller increments and come on line more rapidly.
Technology Descriptions
Wind
Wind power uses a turbine and related components to convert the kinetic energy of moving air into electricity. A typical wind turbine assembly includes the rotor, controls, drive train (gearbox, generator, and power converter), other electronics (wiring, inverters, and controllers), and a tower. Each of these components has undergone significant development in the last 10 years, and the resulting modifications have been integrated into the latest turbine designs. Critical objectives for these and future improvements are to make it easier to integrate the wind power plants into the electrical system and to increase their capacity factors. Especially important has been the development of electronic controls that allow modern turbines to remain connected to the electricity grid during voltage disturbances and reduce the draw on the grid’s reactive power resources. Advances in computerized controls will allow more aspects of the turbine to be monitored, resulting in more efficient use and the potential to better target and deploy technical upgrades.
Along with advances in electronics have come improvements in wind turbine structures, allowing turbine size and generating capacity to grow. Based on the fact that wind speed increases with height and that energy-capture ability depends on the turbine’s rotor diameter, the most common turbines at present are three-bladed rotors with diameters of 70–80 m, mounted atop 60–80 m towers, that have a capacity of 1.5 MW. The rotor blade has gone through many generations of designs, using various types of materials and structures, to maximize its aerodynamic performance without compromising stability.
Wind power technologies are actively being deployed today, and no major technological breakthroughs are expected in the near future. However, evolutionary modifications in various turbine components are expected to bring 30–40 percent improvement in cost-effectiveness (cost per kilowatt-hour) over the next
decade (Thresher et al., 2007). And while the turbine tower is not expected to get much taller, advances will likely occur in installing and maintaining these machines in difficult-to-reach locations. One possibility, for example, is self-erecting towers. In the future, turbine rotors will be made of advanced materials such as fiberglass, and they will have improved structural-aerodynamic designs, sophisticated controls, and higher speeds. By reducing the blade-soiling losses (e.g., through dust or insect buildup) and installing damage-tolerant sensors and robust control systems, reductions in energy loss and improvements in turbine availability can occur. In addition, drive trains will be modified to include fewer gear stages, medium- and low-speed generators, distributed gearbox topologies, permanent-magnet generators, and new circuit configurations. As shown in Table 6.1, these improvements will have significant impacts on annual wind energy production and capital costs over the next decade. It should be noted that future capital costs also will be greatly influenced by global supply and demand for wind turbines. Some of these issues are discussed in the section titled “Deployment Potential” later in this chapter, as well as in the report by the Panel on Electricity from Renewable Resources (NAS-NAE-NRC, 2009).
Along with improvements in onshore wind-turbine designs, offshore wind-turbine technologies will soon be actively enhanced to take advantage of the abundant U.S. offshore wind-energy resources. The technologies associated with offshore wind turbines will face fundamentally different challenges, however, attributable to the difficulties of building and operating turbines in the ocean and installing and maintaining transmission lines underwater.
Solar Photovoltaic Power
When sunlight strikes the surface of a PV cell, some of the light’s photons are absorbed. This causes electrons to be released from the cell, which results in a current flow, namely, electricity. The two main PV technologies entail flat plates, which consist of crystalline silicon deposited on substrates, and concentrators, which typically involve lenses or reflectors that, together with tracking systems, focus the sunlight onto smaller and more efficient cells.
Silicon is used to form semiconductors in PV cells by taking advantage of the conductivity imparted when impurities (“doping” elements) are introduced. Because the efficiency of these crystalline PV modules is only 12–18 percent, further development is required—not only to increase efficiency but also to lower production costs (DOE, 2007a).
TABLE 6.1 Areas of Potential Technology Improvements for Wind Turbines
|
Technical Area |
Potential Advances |
Performance and Cost Increments (best/expected/least [percent]) |
|
|
Annual Energy Production |
Turbine Capital Cost |
||
|
Advanced tower concepts |
|
+11/+11/+11 |
+8/+12/+20 |
|
Advanced (enlarged) rotors |
|
+35/+25/+10 |
−6/−3/+3 |
|
Reduced energy losses and improved availability |
|
+7/+5/0 |
0/0/0 |
|
Drive train (gear boxes, generators, and power electronics) |
|
+8/+4/0 |
−11/−6/+1 |
|
Manufacturing and learning curve |
|
0/0/0 |
−27/−13/−3 |
|
Totals |
|
+61/+45/+21 |
−36/−10/+21 |
|
Source: Thresher et al., 2007. |
|||
Recent increases in the cost of silicon have encouraged the development of alternative processes. Thin-film technologies have the potential for substantial cost advantages because of such factors as lower material use, fewer processing steps, and simpler manufacturing procedures for large-area modules. The most common materials used for thin films are amorphous silicon, cadmium telluride, and copper indium gallium diselenide and related alloys. Future directions for thin-film technologies include multi-junction assemblies aimed at significantly higher efficiencies, transparent and better-conducting oxide electrodes, and thin polycrystalline silicon films.
Another new technology, which takes advantage of photochemistry, is the dye-sensitized solar cell, in which organic dye molecules are adsorbed onto nanocrystalline titanium dioxide films (O’Regan and Grätzel, 1991). The dye molecules then absorb solar photons to create an excited molecular state that injects electrons into the film, the electrons are collected on a transparent electrode, and the dye is then reduced back to its initial state by accepting the electrons, which completes the circuit and generates electrical power in the external load. This type of solar cell is attractive because of its low cost and simplicity in manufacturing, but the device’s efficiency and stability will need to be closely monitored before large-scale deployment is possible.
In organic solar cells, which also are in the early developmental stage, the sunlight creates an exciton, which separates into an electron on one side and a hole on the other side of a material interface within the device. This allows the cell to be thinner, which significantly reduces cost in at least four ways: inexpensive constituent elements (which do not require pure silicon), decreased material use, modest conversion efficiency, and high-volume production techniques. Some examples of organic solar cells include quantum dots embedded in an organic polymer, liquid crystal cells, and small-molecule chromophore cells.
Nanotechnology too could become a useful tool for making PV cells because it can tune the optical and electronic properties of the PV materials by precisely controlling their particle sizes and shapes. Nanoparticles produced by chemical solution methods may streamline the manufacturing process, but their long-term stability must be tested.
Solar PV technologies are at various stages of development. Silicon flatplate PV cells are mature and are actively being deployed today. Reductions in the production costs of the cells and increases in efficiency and reliability will be needed, however, to make them more attractive to potential customers. Thin-film technologies, which have great potential to reduce module cost, are in a relatively
immature stage compared to crystalline silicon PV; further research, testing, and deployment are required. Other competing technologies, such as dye-sensitized PV and nanoparticle PV, are at early stages of development; a great deal more effort will be required before commercialization is possible.
A critical uncertainty is whether the installed system cost of solar PV can be brought down to less than $1 per peak watt with at least a 10 percent module and system efficiency; this level is needed so that widespread deployment of PV may be promotable without subsidies. But reaching $1/W will require that the performance of cells and manufacturing processes be improved. It will also require that the balance-of-system costs (pertaining to installation, the inverter, cables, the support structures, grid hookups, and other components) be brought down significantly. For some systems, 50 percent or more of the total installed cost of a rooftop PV system is not in the module cost but in the balance-of-system costs. These costs must come down significantly through innovative system integration approaches or this aspect of a PV system will ultimately set a floor on the price of a full, installed PV system.
Concentrating Solar Power
CSP systems—sometimes referred to as solar thermal—employ optics to concentrate beam radiation, which is the portion of the solar spectrum that is not scattered by the atmosphere. The concentrated solar energy produces high-temperature heat, which can be used to generate electricity or to drive chemical reactions to produce fuels (syngas or hydrogen) (Fletcher, 2001). There are three types of CSP technologies—parabolic troughs, power towers, and dish-Stirling engine systems—which differ in their optical systems and receivers, where the concentrated solar radiation is absorbed and converted to heat.
The most mature technology is the parabolic trough combined with a conventional Rankine-cycle steam power plant. This technology uses concave, parabola-shaped mirrors to focus the directed beam radiation onto a linear receiver. In the trough systems, synthetic oil is circulated in tubes and then used to superheat steam, which drives a conventional turbine/generator. Parabolic trough plants can include short-term solar energy storage capabilities to extend generation for several hours. Also, many existing power plants using this technology have a backup fossil-fired capability for providing power during periods of low solar radiation and at night.
Power towers consist of numerous two-axis mirrors (heliostats) that track the
sun and direct the incoming beam radiation to a receiver (located at the top of the tower). Dish technology uses a two-axis parabolic dish to concentrate solar energy into a cavity receiver, from which it is transferred to a heat engine/generator—specifically, a Stirling engine because of its high efficiency and power density (Mancini et al., 2003). In the future, some CSP plants will use molten-salt receivers, which have the advantage of short-term storage capability, thereby allowing the plant to generate electricity for a few hours after sunset. The molten-salt receiver was pioneered in the United States in the 1990s and is currently undergoing its initial commercial deployment in a small (≈20 MW) plant in Spain.
Another evolving technology that relies on solar concentration is high-temperature chemical processing, in which the receiver placed at the focus of the concentrating reactor includes a chemical reactor. The main advantage of this system is its capability to provide long-term storage of intermittent solar energy (in the form of fuel or a commodity chemical). Also, a number of multiple-step cycles that could be used in parallel with CSP—including production of hydrogen using water as the feedstock, decarbonization of fossil fuels, production of metals (including aluminum), and processing and detoxification of waste—are being pursued by researchers (Fletcher, 2001; Perkens and Weimer, 2004; Steinfeld, 2005).
As discussed in the section titled “Costs” below in this chapter, concentrating-trough and power-tower systems are currently the lowest-cost utility-scale solar electricity technologies for the southwestern United States, as well as for other areas of the world with sufficient direct solar radiation. In the short term, costs will be driven down and uncertainties in performance reduced as designs are incrementally improved, as more systems are installed (the “learning curve”), and as economies of scale both for power plant sites and for manufacturing are realized. Over the medium term, advances in high-temperature and optical materials will be needed. For example, the development of less expensive yet durable optical materials—including selective surfaces for receivers in towers and dishes, transparent polymeric materials that are cheaper than glass, and reflective surfaces that prevent dust deposition—will help to further reduce cost, improve performance, and decrease water use. For the long term, thermochemical production of fuels using CSP is a promising mechanism for storing solar energy.
Geothermal
Geothermal electricity is currently produced by conventional power-generating technologies utilizing hydrothermal resources (hot water or steam) accessible
within 3 km of Earth’s surface. These plants operate 90–98 percent of the time, providing baseload electricity. Most hydrothermal plants are binary cycle, converting lower-temperature geothermal water (90–175°C) to electricity by routing it through a closed-loop heat exchanger, where a low-boiling-point hydrocarbon (such as isobutane or isopentane) is evaporated to drive a Rankine power cycle. The other possibilities are steam plants, which use steam directly from the source, or flash plants, which depressurize hot water from the source (175–300°C) to produce steam. These technologies are well developed but limited to particular geological areas—in the United States, the Southwest (WGA, 2006).
A more challenging possibility for tapping Earth’s internal heat are enhanced geothermal systems. As discussed in the “Resource Base” section above in the chapter, this approach mines the heat stored deep below Earth’s surface (typically beyond 3 km and down to about 10 km) in hot and low-permeability rock by artificially creating porous or fractured reservoirs. To access the stored thermal energy, the hot rock must first be “stimulated” by drilling a well to reach the rock, and high-pressure water is then used to form a fractured rock region. Injection and production (extraction) wells can then be drilled into the fractured region; water is circulated in the injection well to extract the stored heat.
A fractured EGS reservoir would cool significantly during heat-mining operations. MIT (2006) estimated that a normal project life would be some 20–30 years before reservoir temperatures fell by 10–15°C and abandonment occurred. The MIT study also found that production wells would need to be redrilled every 4–8 years during that project life.
EGS technology is not currently in large-scale operation. Significant challenges include a general lack of experience in drilling to depths approaching 10 km, even in oil and natural gas exploration, and the need to enhance heat-transfer performance for lower-temperature fluids in power production. Another challenge is to improve reservoir-stimulation techniques so that sufficient connectivity within the fractured rock can be achieved; in that way, the injection and production well system may realize commercially feasible and sustainable production rates (MIT, 2006). Genter et al. (2009) reviews the progress on the EGS plant at Soultz, France, a project that has been under way for more than two decades. Progress is ongoing at this site, with a recently added 1.5 MW power plant currently beginning a 3-year scientific and technical monitoring phase. EGS activity is also ongoing in the United States, Germany, and Australia.
Hydropower
Hydropower, whether through conventional hydroelectric technologies or emerging hydrokinetic technologies, captures the energy of moving water in order to generate electricity. Conventional hydroelectricity, which taps the energy in freshwater rivers, is the largest source of renewable electricity at present. Most hydroelectricity projects use a dam to back up and control the flow of water, a penstock to siphon water from the reservoir and direct it through a turbine, and a generator to convert the mechanical energy to electricity. The resources for conventional hydropower have been extensively exploited and the technologies required are fully developed. Currently, the major technological challenges relate to increasing the efficiency of existing facilities and mitigating any negative consequences, especially on anadromous fish (EPRI, 2007a). Additionally, there are pressures to return river systems back to free-running conditions; although this will not likely lead to the removal of any major hydropower dams, it could limit expansion of the resource.
Hydrokinetic technologies generate electricity from currents, tides, and ocean waves. Many pilot-scale projects for exploiting these sources currently exist, but only a few operate at a commercial scale worldwide. Tapping tidal, river, and ocean currents is done using a submerged turbine. Approaches for converting the energy in waves into electricity include floating and submerged designs that access the energy in the impacting wave directly or that utilize the hydraulic gradient between the top and bottom of a wave. Other approaches for generating electricity from the oceans include drawing on their thermal or salinity gradients. Ocean thermal energy conversion transforms solar radiation into electric power using the ocean’s natural thermal differences to drive a power-producing cycle (SERI, 1989). Salinity-gradient power relies on the osmotic-pressure difference between freshwater and salt water (Jones and Finley, 2003). Further basic and applied research is needed before deployment of any of these approaches might be contemplated. As a result, the costs of their commercial-scale operation are unknown.
Biopower
Biopower is the generation of electricity by extracting the solar energy stored in biomass—that is, by burning it. Types of biomass for energy production fall into three categories: wood/plant waste; municipal solid waste/landfill gas; and “other” biomass, including agricultural by-products, biofuels, and selected waste products
such as tires (Haq, 2001; EIA, 2007). There also is a recent increase in dedicated energy crops, but they are used mostly for liquid transportation fuels.
Given the wide variety of biomass resource types with diverse characteristics (e.g., with respect to moisture, energy, and ash content), numerous electricity-generation technologies are employed in biomass utilization. Despite the differences, several commonalities exist; indeed, production of electricity from biomass occurs in much the same manner as from fossil fuels. As with coal-fired power plants, the vast majority of biomass-fired power plants operate on a steam-Rankine cycle in which the fuel is directly combusted and the resulting heat is used to create high-pressure steam. The steam then serves as the working fluid to drive a generator for electricity production. With a gaseous fuel, a more efficient turbine engine (based on the gas-Brayton cycle) can be employed, in a manner similar to natural-gas-fired power plants. A gas reciprocating engine is also frequently used for installations of less than 5 MW, where a turbine would be too expensive.
A key difference between biomass power plants and those operating on coal is the size of the facilities. Wood-based biomass plants (accounting for about 80 percent of biomass electricity) rarely reach 50 MW in size, whereas conventional coal-fired plants typically range from 100 MW to 1500 MW. Similarly, power plants based on landfill gas—a methane-containing product of the anaerobic decomposition of solid waste—have capacities in the 0.5 MW to 5 MW range, whereas those operating on natural gas may be some 100 times larger, in the 50 MW to 500 MW range. The small sizes are partially due to the high cost of transporting low-energy-content biomass. A maximum 40-mile radius for the resource base is typical. And as a consequence of these sizes, biopower plants are typically less efficient than fossil fuel plants are; the cost of implementing high-efficiency technologies is not economically justified at small scales.
Beyond dedicated biomass power plants, biomass is also used to co-fire power plants that utilize coal as the primary fuel source. These plants exhibit high efficiencies, given their large sizes, with the added benefits of reduced CO2, SOx, and particulate emissions and of lower volumes of ash residue. However, co-firing may negatively affect the technologies for reducing nitric oxide emissions (Vredenbregt et al., 2003).
In the medium term, it is likely that new biopower capacity, if pursued, will incorporate a pretreatment step in which the biomass is converted to a gaseous or liquid fuel. This would be more suitable for power generation than the direct firing that is the norm today. In the fossil fuels chapter of this report (Chapter 7) is
a discussion of a potential future technology for biopower—an oxygen-blown gasification-based combined-cycle power plant that would use switchgrass as a feedstock. As noted in that discussion, dedicating to this technology some 100 million dry tons per year of the potential 550 dry tons per year of biomass (the total that could be made available for the overall energy system) could provide an estimated 30 GW of biopower capacity. With a capacity factor of 85 percent, this could produce an additional 220,000 GWh/yr. However, in the absence of a program to grow dedicated energy crops, biomass from waste streams (forestry, agricultural, urban) is likely to grow but will probably remain a relatively small contributor to the nation’s electricity supply.
Fundamental to biomass’s future as an energy source is the competition between using it to generate electricity or to produce liquid transportation fuels. In particular, conversion from raw biomass into syngas or other fuels might render biomass more attractive for transportation applications. Indeed, the U.S. Department of Energy (DOE) has essentially stopped its biopower programs in favor of biofuels for transportation (Beaudry-Losique, 2007), given the legislative requirements to greatly expand the use of biofuels. In addition, the long-term potential of biomass is currently limited by the low conversion efficiency of the photosynthesis process.
For more details on the timing, costs, and impediments to the development and deployment of all of these technologies, the reader is referred to the report by the Panel on Electricity from Renewable Resources (NAS-NAE-NRC, 2009).
Technology Timeframes
To better assess the prospects of the various renewable electricity-generation technologies, the AEF Committee has distinguished between three timeframes: the present to the year 2020; the 2020–2035 period; and 2035–2050 and beyond.
For the first timeframe, there appear to be no technological constraints for the accelerated deployment of wind, solar PV, CSP, conventional geothermal, and biomass. The main barriers are cost competitiveness relative to fossil-based electricity (assuming no costs are assigned to carbon emissions or other currently unpriced externalities); markets that discourage renewable technologies from reaching scale and thus attaining economies of scale (especially with respect to manufacturing); and the lack of clear and sustained policies for achieving such goals.
Substantially expanded research and development will be needed to realize
continued improvements and further cost reductions for these technologies. Such improvements, stimulated by appropriate policies, will greatly increase the competitiveness of electricity generation from renewable resources and thus enhance the technologies’ levels of deployment. This achievement could, in turn, set the stage for an even greater and more cost-effective penetration in later time periods. With such accelerated deployment, it is reasonable to envision that nonhydroelectric renewables could collectively start to provide a material contribution to the nation’s electricity generation within this first timeframe—reaching perhaps the 10 percent level or greater, with trends toward continued growth. Combined with hydropower, this would mean that renewable electricity could approach a total contribution of 20 percent of electricity by the year 2020.
It is clear that such an increase would require not only sufficient resources and technologies but also manufacturing, materials, and labor capabilities together with considerations of environmental impacts, siting issues, and systems integration. A critical aspect of an expansion of renewable electricity will be a corresponding expansion in transmission capacity and other improvements in the electricity transmission and distribution systems. Quantitative estimates of the deployment and installation requirements for wind power to meet this level of renewables penetration are provided later in this chapter and in the report by the Panel on Electricity from Renewable Resources (NAS-NAE-NRC, 2009). Sizing of transmission capacity solely for wind is an important issue because low capacity factors for wind mean that transmission build for wind power alone would not be utilized up to its capacity much of the time. This is the motivation for considering the colocation of other renewable and nonrenewable technologies with wind discussed later in this chapter.
In the second timeframe (2020–2035), assuming public- and private-sector research and development (R&D) efforts and sustained public policy incentives, it is reasonable to envision an even further acceleration in deployment of nonhydroelectric renewables, which could collectively provide 20 percent or more of domestic electricity generation. With conventional hydropower’s contribution remaining at current levels, total electricity generation from renewables could account for more than 25 percent by 2035. The significant issues raised in reaching this level of renewables penetration are discussed later in this chapter and in NAS-NAE-NRC (2009).
In the third timeframe (2035–2050 and beyond), continued development of renewable electricity-generation technologies can be expected to provide lower costs and potentially to result in further increases in penetration. However, achiev-
ing a predominant (i.e., greater than 50 percent) level of renewable-electricity penetration, especially if the sources are predominately intermittent, will require scientific advances and dramatic changes in the ways we receive and use electricity. Beyond the continuing needs for improvements in cost, scalability, and performance of renewable electricity-generation technologies, some combination of intelligent two-way electric grids, cost-effective methods for large-scale and distributed storage (either direct electricity energy storage or generation of chemical fuels), widespread implementation of rapidly dispatchable fossil electricity technologies (for backup), and greatly improved technologies for cost-effective long-distance electricity transmission will also be required.
More Speculative Technologies
Given the long time periods covered in this report, it is conceivable that other technological approaches, in addition to those just discussed, will evolve. They include the possibility of high-altitude kites tethered to generators for producing wind-derived electricity, or satellites in space that would collect sunlight, convert the energy into a laser or microwave beam, and aim the beam at a terrestrial plant for generating electricity or producing hydrogen. Other approaches may be based on new processes developed from basic advances in fields such as bioengineering and nanotechnology. Additionally, new approaches may ensue from the application of systems engineering in a world that is highly constrained not only by energy supplies but also by water availability and waste-disposal options. For example, it is conceivable that neighborhood combined-energy-waste-and-water plants may be attractive for reducing pressures on the infrastructure and limiting the amounts of consumables entering the system. Such approaches could be of great benefit as the world’s population becomes increasingly urbanized.
Findings: Technology
Wind, solar photovoltaics, concentrating solar power, conventional hydropower, hydrothermal, and biopower technologies are technically ready for accelerated deployment; both individually and collectively, these technologies could make significantly greater contributions to the U.S. electricity supply than they do today. Advances in the currently developed renewable electricity-generating technologies will be driven by incremental improvements in individual components, “learning curve” technology maturation, and achievement of economies of scale in commercial production.
Other technologies, including enhanced geothermal systems that mine the heat stored in deep low-permeability rock, as well as hydrokinetic systems that tap the energy in ocean tidal currents and waves, require further R&D before they can be considered viable entries into the marketplace. Thus these options could potentially be available in the second timeframe (2020–2035) or third timeframe (2035–2050 and beyond) if technological and economic conditions were favorable. Meanwhile, it is possible that plastic organic solar cells, dye-sensitized solar cells, and other new photovoltaic technologies could become commercially available during the second timeframe. In any case, basic and applied research efforts are expected to drive continued technological advances and cost reductions for all renewable electricity-generation technologies.
Because some of the technologies that tap renewable resources to produce electricity must operate under temporal and spatial constraints, special consideration of systems-integration and transmission issues will be needed in order for the penetration of renewable electricity to grow. Such considerations become especially important at sizable penetrations (greater than ~20 percent) of renewables in the domestic electricity generation mix. In the second timeframe in particular, a concurrent and unified overlaying of intelligent control and communications technologies (e.g., advanced sensors, smart meters, and improved software for forecasting and operations) would be required for assuring the viability and continued expansion of renewable electricity. Such improvements in the electricity transmission and distribution grid could enhance system integration and reliability, provide significant capacity and cost advantages, and reduce the need for backup power and energy storage.
COSTS
Given the experience with renewables over the past 20–30 years, it is clear that their economics have not been favorable. The economics of renewables is about profitability, and profitability depends on three drivers: (1) the market price of electricity; (2) the costs of renewables relative to those of other resources; and (3) policies designed to promote renewables or achieve environmental goals (particularly regarding climate) that raise the costs of using fossil fuels or subsidize the costs of renewables.
In order to enjoy greater market penetration in the future, renewables need to achieve cost reductions. And they must do so at a rate that is greater than
the rate of cost improvement by technologies—including natural-gas- and coal-fired generation—that currently tend to set the market price of electricity. In some cases, these reductions might be the result of technological breakthroughs; in other cases, they could come from improvements in the manufacturing or in the operating performance of equipment (e.g., higher capacity factors for wind turbines).
Levelized Cost Estimates
In order to compare the costs of electricity-generation using different renewable technologies, both to each other and to the costs of electricity from fossil fuels and nuclear, a cost estimate is typically converted into a levelized cost of electricity (LCOE), which is expressed in dollars per megawatt-hour (or kilowatt-hour) of generation. A large portion of the cost of generating electricity, particularly for renewables, is the initial cost of the capital equipment and installation. Converting this large upfront cost to dollars per megawatt-hour requires making assumptions about the lifetime and capacity factor of the equipment as well as the discount rate and the timing of returns on capital. For intermittent technologies such as concentrating solar thermal, solar PV, and wind power, the capacity factor can vary considerably, depending on the quality of the resource (e.g., hours and intensity of sunlight or speed and constancy of wind), which varies by location. Table 6.2 compares LCOEs derived from various studies for four renewable electricity-generation technologies.5 It also contains the cost breakdown used in the estimates where available. It compares cost estimates developed from information provided in the EIA AEO 2009 reference case forecast (EIA, 2008a) to estimates of the DOE’s Office of Energy Efficiency and Renewable Energy Office (EERE) (NREL, 2007c), estimates of the Electric Power Research Institute (EPRI, 2007b), and inputs to the DOE’s 20% Wind Energy study from Black & Veatch (DOE, 2008a; Black & Veatch, 2007). The committee has incorporated the more recent
TABLE 6.2 Electricity-Generating Costs for Renewable Technologies in 2020
|
Capacity Factor (percent) |
Total Capital Cost ($/MWh) |
Variable O&M/Fuel Costs ($/MWh) |
Fixed O&M ($/MWh) |
Levelized Cost of Energy ($/kWh) |
|
83 |
61.62 |
22.81 |
8.86 |
0.093 |
|
85 |
|
|
|
0.096 |
|
85 |
|
|
|
0.101 |
|
90 |
|
|
|
~0.080a |
|
90 |
75.44 |
0.00 |
22.22 |
0.098 |
|
31 |
180.02 |
0.00 |
21.30 |
0.201 |
|
34 |
|
|
|
0.170 |
|
34 |
|
|
|
0.083a |
|
21 |
135.81 |
0.00 |
5.59 |
0.141 |
|
|
|
|
|
0.220 |
|
|
|
|
|
0.260 |
|
22 |
292.84 |
0.00 |
6.21 |
0.299 |
|
35 |
81.38 |
0.00 |
9.95 |
0.091 |
|
42 |
|
|
|
0.078 |
|
33 |
|
|
|
0.097 |
|
38 to 52 (depending on wind class) |
48.04–35.10 |
4.85 |
3.64–2.66 |
0.057–0.043 |
|
33 |
154.36 |
0.00 |
26.72 |
0.181 |
|
38 to 52 (depending on wind class) |
64.1–46.29 |
4.87–3.52 |
4.62–3.34 |
0.074–0.053 |
estimates from AEO 2009 since they better reflect the recent increase in capital costs for electricity-generating technologies.
The snapshot of current costs presented in Table 6.2 is affected by a number of factors. One key factor is the assumed cost of capital equipment today and whether it reflects recent increases in material and labor costs for wind turbines, solar panel components, and construction in general. Another factor is technology learning and how it is likely to evolve over time (independent of scale of deployment). Details on how the individual renewable technologies might improve are included in the full report from the Panel on Electricity from Renewable Resources (NAS-NAE-NRC, 2009). Finally, projections that are more in the form of goals for renewable technology performance tend to be more optimistic than are projections based on some form of learning.
For example, though not shown in Table 6.2, estimates from the Solar Energy Industry Association (SEIA, 2004) for costs of solar technologies, and estimates from EERE for costs of wind technologies (NREL, 2007c), tend to be more optimistic than those from other sources; the SEIA and EERE estimates reflect how full funding of renewable-energy research at the DOE and elsewhere is expected to affect the future costs of renewable electricity generation. Thus these estimates tend to represent aspirations. (Detailed discussions of these factors, and on how differences in assumptions affect the various costs estimates, are provided in the full report of the Panel on Electricity from Renewable Resources [NAS-NAE-NRC, 2009].)
Taking all of these factors into consideration, the AEF Committee supported the idea that the upper-bound costs shown in these estimates were in line with the committee’s estimate of a reasonable upper bound and that some of the lower-cost estimates, including ones not shown in Table 6.2, tended to represent aspirations.
Costs Beyond Electricity Generation Costs
The costs of purchasing, installing, and operating a specific power plant normally would not be the total costs to the system and to electricity consumers of deploying a new renewable generation facility. Costs that are normally missing from the traditional levelized cost measure are the costs of new infrastructure necessary to connect the renewable generator to the grid and to ensure continued quality of power supply. The report from the Panel on Electricity from Renewable Resources (NAS-NAE-NRC, 2009) reviews costs estimates for these components. The estimates focus almost exclusively on the costs of transmission and intermittency associated with wind power. For example, a recent report looked at cost esti-
mates for 40 transmission projects for wind power (Mills and Wiser, 2009). The report found that the transmission costs associated with wind ranged from $0 to $1500/kW, and the majority were less than or equal to $500/kW, with a median of $300/kW. These numbers correspond to $0–79/MWh, with the majority below $25/MWh, and a median of $15/MWh. There have also been a large number of studies that look at intermittency costs, including DeCarolis and Keith (2004), EWEA (2005), Smith (2007), and DOE (2008b). Generation from intermittent resources such as wind requires other generation sources to provide backup when wind power is not available and to help track electricity loads, provide voltage support, and meet the needs for capacity reserves. Generally, these studies have found that, when the average cost of wind generation is about $80/MWh, the impact of grid integration costs is estimated to be less than 15 percent where wind produced 20 percent or less of total electricity generation.
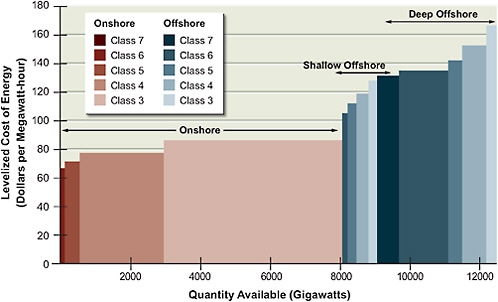
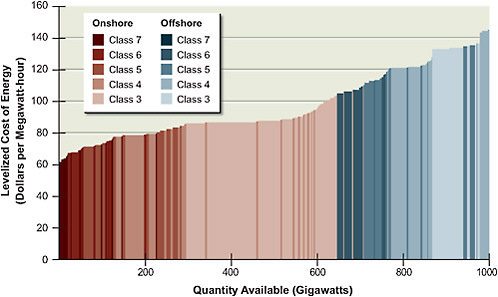
Renewable Supply Curve: Example for Wind Power
Single national-average estimates of LCOEs fail to communicate how such costs vary with the quality of the resource. As shown in Figures 6.2 and 6.3, wind and solar intensities vary regionally, and other renewable resources show similar patterns. This phenomenon in turn affects capacity factor and LCOE. Figure 6.4, which plots LCOE as a function of the amount of wind capacity available, shows how the cost of energy increases from higher wind classes to lower wind classes and from onshore sites to offshore sites. It should be noted that Figure 6.4 does not reflect transmission costs or other factors that affect the cost of delivered wind energy. Figure 6.5 plots LCOE as a function of the amount of wind capacity available including transmission costs for both onshore and offshore sites. However, Figure 6.5 does not incorporate an estimate of integration costs, which would be dependent on a number of factors, including the current generation mix within each control area and regional power pool (Black & Veatch, 2007).
Findings: Costs
The evolution of the costs of renewables will depend both on technological advances and on stable and clear public policies that encourage greater penetration and accelerate production and deployment at scale. At present, onshore wind is an economically favored option relative to other nonhydroelectric renewables, and wind power could in principle scale to a significant penetration
of domestic electricity supply by 2020. Accordingly, wind power will continue to grow rapidly if recent policy initiatives, including the PTC, continue into the future.
Though AEO 2009 suggests that biopower will play an expanding role in meeting future RPS targets (EIA, 2008a), the degree of competition with and recent mandates for use of liquid biofuels for providing transportation fuel—and, of course, the use of biomass for food, feed, and fiber—all limit the prospects for greater use of biomass in the electricity market.
Supply-side utility-based renewable-electricity technologies, such as concentrated solar power, wind, and biomass, must compete on a cost basis with other technologies for utility electricity generation. But the future of distributed renewables generation, such as from residential PV, will depend more on policy, on how costs compare to the retail price of power delivered to residential or other customers, on whether prices fully reflect variations in cost over the course of the day, and on whether the full costs of using fossil-fuel generation—particularly their externalities, such as CO2 emissions—are incorporated into prices.
Formulation of robust predictions about whether the price of electricity will meet or exceed the price required for renewable sources to be profitable and what their resulting level of penetration will be remain a difficult proposition. Furthermore, the profitability of renewables generation may be sensitive to investments in energy efficiency, especially if such efficiency improvements are sufficient to meet growth in demand for electricity or to lower the market-clearing price of electricity. If there are no changes in the financial operating environment for fossil fuels and other incumbent sources of electricity, then renewable electricity may be negatively impacted more than other electricity sources. However, renewable electricity is being driven at present by tax policies—in particular, the production tax credits—and by renewable portfolio standards.
ENVIRONMENTAL IMPACTS
The fact that renewable-energy sources have smaller environmental “footprints” than do fossil-fuel sources arguably provides the greatest impetus for making a transition. However, the use of renewables does not eliminate all environmental impacts, though the types and magnitudes differ substantially from those of fossil fuels and from one renewable technology to another.
Atmospheric Emissions and Land-Use Impacts
While most renewable technologies do not emit air pollutants during the generation of electricity,6 they do emit them during manufacture or installation. Thus, an accurate accounting of emissions and other impacts must embrace the whole life cycle of a given technology.
The process of life-cycle analysis (LCA) aims to estimate the overall energy usage and environmental impacts of a given technology by considering all of its stages—from the extraction and refinement of raw materials to construction, use, and disposal. However, a major complication in comparing LCAs is that there is no set standard by which such analyses are carried out. While all LCAs attempt to cover technologies from “cradle to grave” in a systematic way, there is significant variability in the assumptions, boundaries, and methodologies used in these assessments. Further, the data are for normal operations and do not consider emissions or other impacts that result from start-ups, shutdowns, or accidents. Comparisons of LCA should therefore be made with caution; each LCA is only an approximation of a technology’s actual set of impacts.
Not surprisingly, based on the range of estimates of carbon dioxide (CO2)-equivalent (CO2-eq)7 emissions that appear in the literature, renewables have significantly lower CO2-equivalent emissions than do coal, oil, and gas. Estimates for solar, wind, hydropower, and geothermal range from about 10 to 50 grams of CO2-equivalent emissions per kilowatt-hour, similar to the numbers for nuclear power (Berry et al., 1998; Chataignere and Le Boulch, 2003; Denholm, 2004; Denholm and Kulcinski, 2003; European Commission, 1997a,b,c,d; Frankl et al., 2004; Fthenakis and Kim, 2007; Hondo, 2005; Mann and Spath, 1997; Meier, 2002; Odeh and Cockerill, 2008; Spath et al., 1999; Spath and Mann, 2000, 2004; Spitzley and Keoleian, 2005; Storm van Leeuwen and Smith, 2008; Vattenfall, 2004; White, 1998, 2006). Much higher values are found for fossil-fuel sources of electricity, upward of 500 g CO2 eq per kilowatt-hour for natural gas and 1000 g CO2 eq per kilowatt-hour for coal, though the relative advantage of renewables would be significantly reduced by adding carbon capture and storage (CCS) to coal and gas systems (if the commercial viability of CCS were demonstrated). As described in the report of the Panel on Electricity from Renewable
Resources (NAS-NAE-NRC, 2009), renewable-electricity sources also have much lower emissions of other atmospheric pollutants, including sulfur oxides, nitrogen oxides, and lead.
On the other hand, because renewable-energy resources are more diffuse than fossil and nuclear energy resources, the land areas needed to collect renewable energy and convert it to electricity are, on an energy-equivalent basis, much larger than those of fossil and nuclear. Spitzley and Keoleian (2005) report land-use values of 9–114.3 2/MWh per year for solar, 69–994 2/MWh per year for wind, and 360–4488 2/MWh per year for biopower. Spitzley and Keoleian (2005) included one LCA example of hydroelectric power with a land-use value of 122 m2/MWh per year for a high-capacity, large-reservoir facility in the United States. This compares with estimates for natural gas, coal, and nuclear technologies of 0.45 m2/MWh per year, 4.4–55.8 2/MWh per year, and 6.5 m2/MWh per year, respectively. An exception to the statement that most renewable-electricity sources require large land areas is geothermal electricity, including both hydrothermal and EGS. Land requirements for geothermal energy are smaller than those for other renewables and are comparable, in fact, to those for nonrenewable sources of electricity (MIT, 2006). It should be noted, however, that in order to operate fossil-fuel and nuclear plants the fuel must first be extracted or mined. Most LCAs, including that of Spitzley and Keoleian (2005), do not account for that process in their assessment of land-use requirements.
Further, there is a wide spectrum of other environmental impacts of renewables that have not been addressed by LCA or analyzed in the studies cited previously. One impact often ascribed to wind power is bird and bat mortality. However, a recent NRC study concluded that although the impacts on bat populations were unclear, there was no evidence that bird fatalities caused by wind turbines had measurable effects on U.S. bird populations (NRC, 2007). Another consideration is that wind-farm deployments at levels needed to produce large amounts of power may extract a significant portion of the energy from the wind field. Continental-scale simulations indicate that high levels of wind power extraction could, to various degrees, affect regional weather as well as climate. In addition to limiting the efficiency of large-scale wind farms, model calculations suggest that the extraction of wind energy from very-large-scale wind farms could have some measurable effect on weather and climate at the local or even continental and global scales (Roy et al., 2004; Keith et al., 2004).
Other potential impacts from renewables include water diversion, water pollution, and land subsidence from geothermal drilling; ecosystem changes due to
hydropower; and noise pollution and aesthetic degradation from wind power. In addition, CSP technologies, except for air-cooled dish-engine technologies, also require significant cooling water. While such impacts may not be widespread or overwhelming, they are often what raise the biggest concerns from local populations and regulators. This means that local and state authorities exercise significant authority over the siting and deployment of renewable-energy generating facilities. While this situation is not unique to renewable sources of electricity generation, there is a long, evolved permitting process that has been applied across the country in the case of traditional generating facilities such as coal and gas. For renewable technologies, on the other hand, the regulatory process is still in the developmental stage.
Findings: Impacts
Renewable electricity-generation technologies have inherently low life-cycle emissions of carbon dioxide and other atmospheric pollutants compared to those of fossil-fuel-based technologies. Most of the CO2 emissions from renewable-electricity generation are incurred during the manufacturing and deployment stages. However, renewables emit much less CO2 over their lifetimes than do fossil-fuel sources. Renewable electricity also has inherently low emissions of other regulated atmospheric pollutants, such as sulfur oxides and nitrogen oxides, and (except for biopower, and some geothermal and CSP technologies) it uses significantly less water than do nuclear, gas-fired, and coal-fired electricity technologies.
Because of the diffuse nature of the resources, the systems needed to collect renewable energy (e.g., wind turbines, solar panels, and concentrating systems) must be spread over large areas. These land-use impacts are mitigated to some extent by the low levels of atmospheric emissions and water use (except for biopower and some geothermal and CSP technologies), whose effects, if any, tend to remain localized. There also is the opportunity for some lands taken up by renewable technologies to be simultaneously used for other purposes. The land between turbines on large wind power installations may be used for agriculture, for example, and solar PV panels can be placed on roofs of residences and commercial and industrial establishments. At a high level of renewable technologies deployment, land-use and other local impacts would become quite important. The land-use impacts have caused, and will in the future cause, instances of local opposition to the siting of renewable electricity-generating facilities and associated transmissions lines. State and local government entities typically have primary jurisdiction over
the local deployment of electricity generation, transmission, and distribution facilities. Significant increases in the deployment of renewable-electricity facilities will thus entail concomitant increases in the highly specific, administratively complex, environmental impact and siting review processes. Even though this situation is not unique to renewable electricity, a significant acceleration of its deployment will nevertheless require some level of coordination and standardization of siting and impact assessment processes.
DEPLOYMENT POTENTIAL
Renewable-energy technologies have the potential to grow into a significant segment of the electricity-supply mix—the necessary resources and technological capabilities are more than sufficient. The deployment of increased renewables capacity will also result in improved environmental quality. However, a number of challenges suggest that these outcomes are by no means assured. Adequate deployment capacities, successful renewable-electricity integration strategies, predictable policy conditions, acceptable financial risks, and access to capital all are needed to accelerate deployment.
Given the robust business and regulatory activities associated with the wind and solar energy industries, the examples discussed in this section—which illustrate the deployment issues that are associated, in varying degrees, with all renewable sources of electricity—are from those industries.
Deployment Capacity Considerations
Table 6.3 indicates the levels of 2006 employment associated with the renewables industry. These figures would increase, of course, if renewable electricity were to continue to grow at its present rate. There are constraints on such growth, however, which are related to restricted supplies of raw materials, limitations on manufacturing capacity, competition from other construction projects, and workforce shortages. These constraints have the potential to impede or even derail the large-scale deployment and integration of renewable electricity-generation technologies.
Consider, for example, scarcities of key raw materials. An illustration of the potential impacts of materials shortages for PV is given in Figure 6.6, which shows that recent shortages of polycrystalline silicon brought about by increased demand for PV have reversed the long-term decline in PV price. Originally, the
TABLE 6.3 Employment in the Renewable-Energy Sector in 2006
|
Industry Segment |
Revenues/Budget ($ billions) |
Employment |
|
Wind |
3.0 |
16,000 |
|
Photovoltaics |
1.0 |
6,800 |
|
Solar thermal |
0.1 |
800 |
|
Hydroelectric |
4.0 |
8,000 |
|
Geothermal |
2.0 |
9,000 |
|
Biopower |
17.0 |
66,000 |
|
Federal government (including direct support contractors) |
0.5 |
800 |
|
DOE laboratories (including direct support contractors) |
1.8 |
3,600 |
|
State and local governments |
0.9 |
2,500 |
|
Source: ASES, 2007. |
||
primary use of polycrystalline silicon was for semiconductors, with PV manufacturers commanding a small fraction of silicon production and even using silicon recycled from the electronics industry. But now the PV industry has become the largest consumer of polycrystalline silicon. This has brought new entrants into polycrystalline manufacturing, including producers specifically oriented to PV as well as PV makers themselves that are trying to become more integrated into the supply chain (Flynn and Bradford, 2006). Despite these new entrants, there was still a shortage of polycrystalline silicon that continued to drive up the price for solar silicon PV modules through 2008, though this shortage was expected to subside by 2009. A recent report has confirmed this decrease in costs for solar PV, though the decline in price has been attributed to both increasing supplies and decreasing demands due to the global economic slowdown (Patel, 2009).
Consider also the limitations on production capacity for wind turbines. Because turbine manufacturers are still in the process of making the capital investments necessary to increase such capacity, developers face shortages of turbines as demand for wind power both in the United States and throughout the world continues to be strong (AWEA, 2008). Thus manufacturers are playing catch-up, with typical delays of 6 months or more from turbine order to delivery. Figure 6.7 shows that these shortages have spurred increases in installed wind power costs, largely due to increases in turbine prices. Other reasons for the turbine price
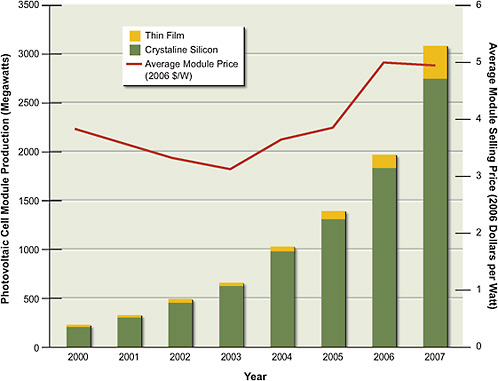
FIGURE 6.6 Global PV module production and average module price during 2000–2007. Source: Courtesy of Paula Mints, Principal Analyst, Navigant Consulting PV Services Program.
increases include higher costs for materials and energy inputs; component shortages; upscaling of turbine size and improvements in turbine design; the declining value of the U.S. dollar; and attempts to increase profitability in the wind turbine manufacturing industry (DOE, 2008b). Increases in wind power project costs continued through 2008; it is unclear how the economic downturn in 2009 will affect these costs.
Renewable Electricity Integration
Because renewable resources such as solar and wind have temporal (including short- and long-term) and spatial variability, they introduce intermittencies that
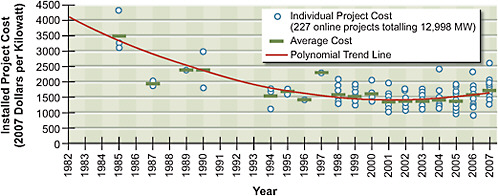
FIGURE 6.7 Installed wind project costs over the past 25 years.
Source: DOE, 2008b.
must be accommodated in the electricity transmission and distribution systems. With the recent growth in renewables, particularly wind, the need to consider accommodating 20 percent or more of intermittent renewables brings into focus questions of how to maintain sufficient flexibility in the grid while accommodating these increases. Several reviews (e.g., Parsons et al., 2006; Holttinen et al., 2007; DOE, 2008a) analyze, summarize, and compare the various state and national studies on the integration of wind power in particular. These studies show that the integration of intermittent renewable electricity can be eased through modifications to the grid, including an increase in transmission capacity and installation of technologies to improve the grid’s intelligence (thereby improving wind power forecasting capabilities). These studies also show that electricity storage is not needed for integrating intermittent renewable energy sources as long as they do not account for more than 20 percent of total electricity generation.
In the case of wind power, there is not always a clear match between the wind resource, available land, and where and when the power is needed. Capturing the full benefits of wind power will require the construction of transmission lines and improving wind power forecasting capabilities. Solar PV offers a way to bring on-site generation to the customer and modify a building’s electric-load profile, as the implementation of sophisticated meters that allow time-of-day pricing and excess generation to be sold back to the grid enhances the value of the PV electricity generated. Further, co-siting of renewable-electricity generators (with other renewables electricity generation or conventional electricity generation technologies) or developing a geographically dispersed but interconnected resource
base has the potential to smooth temporal variations of electricity generation associated with intermittent renewable resources and improve their integration into the electric system. A combination of intermittent sources backed by natural gas could make the combination of these sources dispatchable to the grid.
Market and Policy Factors
Continued deployment of renewable electricity-generation technologies requires concerted efforts to overcome market barriers and meet investment requirements. This includes navigating the “cash-flow valley of death,” where a new business has insufficient ability to raise the capital required for a new technology (Murphy and Edwards, 2003). For renewable-energy technologies, this stage typically occurs during the transition from public-sector to private-sector funding.
Further, renewable electricity must participate in highly competitive electricity markets. But renewable electricity has some economic attributes that differ from those of basic electricity. One such characteristic is that the electricity created at the renewable facility and certain attributes associated with its production can be sold separately. That is, one customer can buy the kilowatt-hours of electricity, while another can buy the “renewableness” associated with the generation through tradable instruments known as renewable-energy certificates or credits. The ability to separately track and sell the electricity and its attributes has increased the number of ways that renewable electricity sales can ultimately occur, thereby expanding the opportunities for renewable-energy development.
Further, renewable-electricity markets operate within a web of interlocking, overlapping, and sometimes conflicting policy prescriptions and legal and regulatory structures. The key risks engendered by this pervasive regime relate to whether future policies will conform to reasonable expectations. For example, Figure 6.8 shows the impact that an off-and-on policy can have on wind power investment: the intermittency of the PTC for wind power generation has led to large fluctuations in demand for wind turbines and in annual installations of new wind power capacity. These fluctuations affect the whole wind power enterprise, from employment to manufacturing to investment.
Findings: Deployment
Increasing the deployment of renewable electricity-generation technologies will require consistent and long-term commitments from policy makers and the public to stimulate investment in business growth, enable market transformation, and
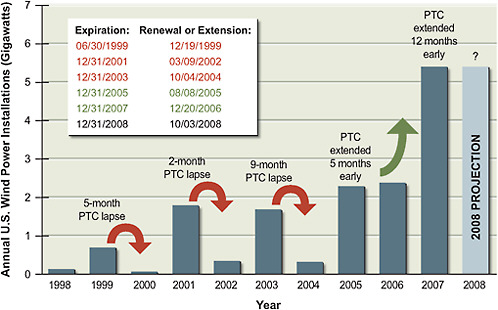
FIGURE 6.8 Effects of PTC expiration and extension on wind power investment.
Source: Wiser, 2008.
support activities in market-enabling R&D. Public policies to encourage renew-policies to encourage renewables will be more effective if they are predictable—as opposed to cycling on and off or having a highly uncertain future, which has been the case with the PTC. Comparisons of past forecasts of renewable-electricity penetration with actual data show that renewables technologies generally have met forecasts of cost reductions but have nevertheless fallen short of deployment projections.
Significant increases in renewable electricity-generation deployments are also dependent on concomitant improvements in several areas, including labor and workforce development, transmission and distribution grids, and the frameworks and regulations under which the electric systems are operated. One important element is that accommodation of the intermittent characteristics of wind and solar electricity into the overall system is critical for large-scale deployment. Advanced storage technologies will play an important role in supporting such integration beyond some initial level of renewables penetration (above about 20 percent). But in the case of wind power, the development of the resource is occurring long before storage technologies can help to make widespread deployment possible.
Storage is not a requirement for continued expansion of wind power devel-
opment at present. In fact, it is the underutilization of transmission corridors—built to move wind-derived electricity to load centers—that represents an inefficient use of resources. But there is a stopgap approach that several interested parties are exploring to potentially address this underutilization issue. It is “co-siting,” in either of two forms: (1) conventional dispatchable generating resources (natural-gas-fired combustion turbines or combined-cycle plants) paired with renewables; or (2) two or more renewable resources that interact synergistically in terms of transmission needs (e.g., solar power production during the day, wind power at night). Such a development strategy can rationalize the use of transmission resources and serve as an interim mechanism for increasing the value of renewables-generated electricity until advanced storage technologies are technically feasible and economical viable.
DEPLOYMENT SCENARIOS
Scenarios of how renewables might significantly increase their contribution to the electricity system provide a quantitative and conceptual framework to help describe and assess issues related to greatly increasing the scale of renewables deployment. Such scenarios are a primary way of quantifying the materials and manufacturing requirements, human and financial resources, and environmental impacts associated with greatly expanding renewables’ electricity generation. In its report, the Panel on Electricity from Renewable Resources (NAS-NAE-NRC, 2009) considered scenarios recently developed by multiple sources. The scenarios typically incorporate computational models and other quantitative elements in an attempt to integrate environmental, technologic, economic, and deployment-related elements into an internally consistent assessment framework. These scenarios were chosen to represent aggressive but achievable rates of renewables deployment if considerable policy and financial resources were devoted to the effort. Other selection criteria used by the panel in choosing scenarios were whether they were developed with input from multiple stakeholder groups and underwent a peer review process. Thus the scenarios do not represent a simple extrapolation of historical growth rates but rather a more integrated perspective on the conditions needed to greatly scale up renewables deployment.
The panel considered two types of scenarios. The first involved increased penetration of a single resource, such as solar or wind. One prominent example is the 20% wind energy study (DOE, 2008a), which is described in more detail
in the following subsection. Examples for solar include the DOE’s Solar America Initiative (DOE, 2007b), the photovoltaics industry roadmap (SEIA, 2001, 2004), and the 10 percent solar study (Pernick and Wilder, 2008). These scenarios consider issues similar to those of the 20 percent wind power scenario, namely, the potential impacts of high renewables penetration on manufacturing, implementation, economics, and the environment. In addition, because of the higher costs associated with solar energy, all solar scenarios take into account the significant cost reductions that need to occur to make solar electricity widely competitive with other electricity sources.
The second type of scenario involved the interaction of renewables with other sources of electricity, other forms of energy, and end-use demands (U.S. Climate Change Science Program, 2007; EIA, 2008b). With the aid of long-term energy/economic models, these scenarios allow the potential influences of demographic, economic, and regulatory factors on renewable electricity to be assessed within a framework that considers how such factors interrelate with other sources of electricity and end-use energy demands.
Twenty Percent Wind Penetration Scenario
The most in-depth scenario describing increased renewables penetration into the electricity sector is the DOE’s 20 percent wind penetration scenario (DOE, 2008a), which, as its name implies, examines the implications of increasing wind power’s contribution to 20 percent of total U.S. electricity generation by 2030. The DOE developed this scenario in collaboration with the National Renewable Energy Laboratory (NREL), Lawrence Berkeley National Laboratory, and the American Wind Energy Association. The effort relied on contributions from more than 90 individuals, including stakeholders in the electric utility industry, wind power developers, engineering consultants, and staff members of environmental organizations. These individuals participated in every stage of the study, including its planning process, workshops, steering-group meetings, chapter writing, and review and oversight. The U.S. Office of Management and Budget (OMB) defined the report resulting from the effort as potentially “influential scientific information” disseminated by the agency, thereby requiring that the report be reviewed subject to the Information Quality Bulletin for Peer Review (OMB, 2004).
The DOE’s 20 percent wind scenario includes an assessment of wind resources and available technologies; manufacturing, materials, and labor requirements; environmental effects and siting issues; transmission system integration;
and market requirements. All impacts of the scenario (such as costs and CO2 emissions) are estimated through comparisons with a base case that assumed no new wind capacity additions after 2006—which is more pessimistic in terms of wind power than are the AEO 2008 base case (EIA, 2008c) or the early release AEO 2009 base case (EIA, 2008a). The scenario estimates that more than 300 GW of new wind power capacity would be needed to meet this goal, of which about 250 GW would be installed onshore and 50 GW offshore (DOE, 2008a). It also assumes that wind power capacity factors improve by 15 percent between 2005 and 2030.
Under the scenario, wind power would produce about 1.2 million GWh/yr out of a total electricity generation of 5.8 million GWh. Figure 6.9 shows the amounts of annual installed capacity needed to meet 300 GW by 2030, starting with the approximately 12 GW of total wind power capacity that was available in 2006; the scenario limited the annual capacity increase to 20 percent.
The scenario assumes that by 2018 the amount of annual installed capacity in the United States is in excess of 16 GW. This compares to a global wind-turbine
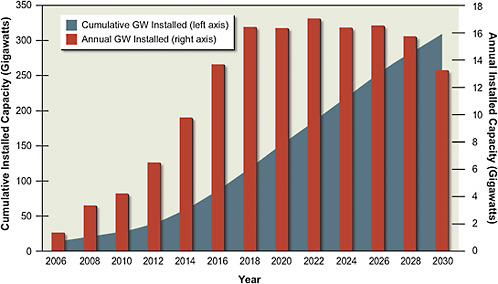
FIGURE 6.9 Annual and cumulative generation needs to achieve 20 percent wind-generated electricity by 2030.
Source: DOE, 2008a.
manufacturing output of about 20 GW in 2007, of which approximately 5 GW went to the U.S. market (DOE, 2008b). An additional 8.4 GW of capacity was added in the United States in 2008 and 2.8 GW of capacity in the first quarter of 2009, both of which exceeded the trajectory for the 20 percent wind scenario. Even assuming that growth outside the United States is more modest, this scenario would still require a continued large expansion of the manufacturing base. Additionally, the scenario assumes that wind turbines have an average life of 25 years; sustaining annual installations at approximately 16 GW/yr beyond 2030 would be needed to accommodate repowering of aging turbines and meeting increasing electricity demand to continue the 20 percent wind generation level (Laxson et al., 2006; DOE, 2008a).
Given these challenges, the DOE’s 20 percent wind scenario considers the materials, capital, and employment requirements. Table 6.4 shows the level of raw materials that would be needed to meet the scenario. While some quantities are small relative to global production, Smith and Parsons (2007) conclude that supplying fiberglass, core materials (balsa and foam), and resins could be difficult, as could supplying a sufficient number of wind-turbine gearboxes. Assuming that the average-sized wind turbine would be in the 1–3 MW range, with some introduction of large 4–6 MW turbines, there would be a total of almost 100,000 wind turbines installed (Wiley, 2007; DOE, 2008a). This would mean that the average number of turbines installed would have to rise from its current level of 2000 per year to 7000 per year by 2017 (DOE, 2008a) and the average turbine size would be about 3 MW.
In 2030, the DOE’s 20 percent wind scenario would require well over 140,000 direct manufacturing, construction, and operations jobs, according to
TABLE 6.4 Raw-Materials Requirements for the 20 Percent Wind Penetration Scenario, in Thousands of Tons per Year
|
Year |
Concrete |
Steel |
Aluminum |
Copper |
Glass-Reinforced Plastic |
Carbon Fiber Composite |
Adhesive |
Core |
|
2010 |
6,800 |
460 |
4.6 |
7.4 |
30 |
2.2 |
5.6 |
1.8 |
|
2015 |
16,200 |
1,200 |
15 |
10 |
74 |
9 |
15 |
5 |
|
2020 |
37,000 |
2,600 |
30 |
20 |
162 |
20 |
34 |
11 |
|
2025 |
35,000 |
2,500 |
28 |
19 |
156 |
19 |
31 |
10 |
|
2030 |
34,000 |
2,300 |
26 |
18 |
152 |
18 |
30 |
10 |
|
Source: Wiley, 2007. |
||||||||
the DOE’s Job and Economic Development model (Goldberg et al., 2004; Wiley, 2007; DOE, 2008a). This figure includes 20,000-plus jobs in manufacturing, almost 50,000 jobs in construction, and 75,000-plus jobs in operations (DOE, 2008a). (It should be noted that these job requirements are not the same as aggregate net new job creations, whose predictions would necessitate a thorough understanding of how expenditures in the wind power sector affect investments and employment in other sectors of the economy.)
The DOE’s 20 percent wind scenario would have significant land-use and atmospheric-emissions impacts. The estimate land area needed would be 50,000 km2, with only about 2–5 percent being for the turbines themselves. The rest of the land area would be devoted to spacing between turbines, and much of it might be available for agricultural uses. Atmospheric emissions of carbon dioxide and other pollutants would be significantly reduced if these initiatives displace electricity-generating plants that use fossil fuels. The scenario estimates that in replacing coal- and gas-fired electricity generation, wind power would reduce CO2 emissions by 800 million tonnes per year in 2030 (about 25 percent of the estimated total CO2 emissions from the electric sector in 2030). Increasing the amount of wind-generated electricity would also result in reductions of other atmospheric pollutants associated with fossil-fuel electricity generation. However, the impacts on NOx and SOx emissions are expected to be less than what would be estimated from simply assuming that electricity generation from fossil fuels is replaced with a non-carbon-emitting technology such as wind power. Emissions of both NOx and SOx are subject to caps on emissions; thus emissions reductions from wind-generated electricity may be reallocated to other plants. Other airborne toxics are also emitted from fossil-fuel electricity-generation technologies, especially coal-fired plants, that are not capped; thus they would be reduced in replacing fossil fuels with wind. Additionally, the 20 percent scenario would potentially reduce water consumption in the electric sector. The DOE report estimates that annual water consumption in the electric sector would be reduced by 17 percent (DOE, 2008a).
Participants in the DOE study, as well as other stakeholders, developed estimates of the costs required to reach 20 percent wind penetration by 2030. The study considered both the direct costs of installing the generating capacity and the costs of integrating this power into the electric system. Estimates of transmission and increased capital and operating and maintenance costs for offshore resources are included. Thus the NREL Wind Development System (WinDS) model, which simulated generation-capacity expansion in the U.S. electricity sector for wind and
other technologies through 2030, has estimated that the 20 percent wind scenario would result in an increase in net present value (NPV) total electricity-sector costs of $43 billion (in 2006 dollars) over the no-new-wind case.
Overall, increases in wind power generation costs (capital and operation and maintenance expenses) are partially offset by lower capital, operation and maintenance, and fuel costs for other electricity sources (DOE, 2008a). The impact on the energy mix is largest for natural gas, with the 20 percent wind scenario displacing about 50 percent of electricity-utility natural gas consumption (DOE, 2008a). The need for imported liquefied natural gas would also be greatly reduced. However, maintaining electricity system reliability would require additional capacity from natural gas combustion turbines, which can respond quickly to low-wind conditions.
The total wind power capital cost under this scenario is $236 billion NPV, and the total operation and maintenance cost is $51 billion NPV. Though many studies have shown the feasibility of incorporating significant amounts of wind power into the electricity grid (Zavadil et al., 2004; GE Energy Consulting, 2005; DeMeo et al., 2005; UWIG, 2006; Parsons et al., 2006), integrating 20 percent wind power into the electricity system would require significant investments in the electric grid and other parts of the system. The DOE study estimates the cost of such an expansion of transmission capabilities at $23 billion, though it recognizes the significant barriers to installing new transmission in general. Separately, American Electric Power (AEP) developed a conceptual interstate transmission plan for integrating in excess of 300 GW from wind power and reducing existing transmission bottlenecks. AEP estimates that such a system would include 19,000 miles of new high-voltage (765-kV) transmission corridors and would require investments on the order of $60 billion (AEP, 2007).
The 20 percent wind scenario study has spurred related studies focused specifically on regional integration of a large fraction of intermittent renewable electricity. Ongoing large-scale studies on the regional integration of 20 percent and more of renewables into the electricity system include the Eastern Wind Integration and Transmission Study/Joint Coordinated System Planning Study (described at www.jcspstudy.org/) and the Western Wind and Solar Integration Study (JCSP, 2009; described at wind.nrel.gov/public/WWIS/). The JCSP study, as with the DOE’s 20% wind energy study, included multiple stakeholders in a collaborative that held numerous public workshop meetings. JCSP (2009) looked at two scenarios: one a reference case with 5 percent market penetration by wind and the second with 20 percent wind. For the 5 percent wind scenario, the study estimated
a need for 10,000 miles of new extra-high-voltage (EHV) transmission lines at an estimated cost of $50 billion. The 20 percent scenario assumes that almost 230 GW of new wind capacity and 36 GW of new baseload steam generation will be built by the year 2024. The projected transmission requirement for the 20 percent wind scenario was 15,000 miles of new EHV lines at an estimated cost of $80 billion.
In both cases, the additional transmission allowed renewable and baseload steam energy from the Midwest to be transmitted to a wider area. The study assumed that increased wind generation would primarily offset baseload steam production while requiring more production from fast-response, gas-fired combustion turbines. As with the DOE’s 20 percent wind scenario, the JCSP study did not envision the need for electricity storage to be necessary for integrating 20 percent wind power into the study region.
Using Multiple Renewables to Reach 20 Percent Electricity Generation
The 20 percent wind scenario discussed in the previous section shows the potential for renewables to increase electricity generation and the scale and integration associated with rapid expansion of wind power only. In this section the committee describes a projection combining multiple renewable technologies that could meet the goal of providing 20 percent of total U.S. electricity generation by 2035 from new renewable-electricity generation.
Assuming the use of multiple renewable resources and technologies to reach the 20 percent goal might address some of the scale and integration issues associated with meeting this level of electricity generation with growth in a single renewable. Using an array of renewables could reduce the growth that would be required from individual sources and the scale-up challenges for manufacturers, materials, and human resources. Considering an array of renewables also might ease their integration into the electricity system, particularly for wind generation. Obtaining 20 percent of electricity generation from wind power as a single source would be a challenge, in that the 20 percent refers to an annual average, and wind power is intermittent. Because wind is not available all the time, it might have to represent much more than half the generation at times in order to reach the 20 percent annual average. Wind energy tends to be most abundant at night and in the spring and fall, when demand is low. Balancing wind with multiple renewable resources—including solar, which does not normally peak when wind does, and baseload power from geothermal and biomass—could mitigate the temporal variability in generation. Using multiple renewable resources would
TABLE 6.5 Capacity and Generation from Multiple Renewable Resources Sufficient to Meet 20 Percent of Estimated U.S. Electricity Demand in 2035
take advantage of the geographical variability in the resource base. Relying on multiple renewable resources would not eliminate the need to expand transmission capacity or to make other improvements in the electricity infrastructure to enable the integration of renewables, nor would it reduce the magnitude of costs. However, it can offer other attributes, such as providing baseload generation and combining different intermittent renewables to reduce the temporal variability in generation.
Table 6.5 lists a set of renewables that, under the projection described here, would reach 20 percent of electricity generation by 2035. Achieving that goal would depend on wind power capacity additions of 9.5 GW/yr, a slight increase over the 8.4 GW installed in 2008. Table 6.5 also shows solar growing to 70 GW by 2035, a smaller gain than those projected in the high market penetration solar scenarios described in the PV roadmap (SEIA, 2001, 2004), Solar America Initiative (DOE, 2007b), and Pernick and Wilder (2008). It assumes that an additional 13 GW would come from geothermal heat by 2035, which is consistent with the Western Governors’ Association’s estimated potential resource base in the western United States (WGA, 2006). It also assumes that an additional 13 GW would come from biomass, which would not greatly impact the biomass resource base needed to meet the alternative liquid fuels mandates. The mix of renewable resources shown in Table 6.5 is not presented as the optimal set to meet the target of obtaining 20 percent of total electricity generation from additions of renewable resources. This set is merely one mix that could be considered, given the available resource base, readiness of renewable-electricity technologies, and what might be practicable for an aggressive but achievable expansion of market penetration.
Findings: Scenarios
Understanding the scale of deployment necessary for renewables to make a material contribution to the U.S. electricity generation is critical. There are clearly sufficient resources and technologies, and some of the technologies currently are, or are close to being, economically competitive. There are also expanding manufacturing and deployment capabilities. Over the first timeframe (the present to 2020), wind, solar photovoltaics, concentrating solar power, conventional hydropower, hydrothermal, and biopower technologies—which are technically ready (and, in some cases, close to being economically competitive) for accelerated deployment—could constitute a significantly greater contribution (up to about an additional 10 percent of electricity generation) to the U.S. electricity supply than they do today. In the second timeframe (2020–2035), it is reasonable to envision that further and accelerated deployment, along with public- and private-sector R&D efforts and supportive public policies (such as the Production Tax Credit), could result in nonhydroelectric renewables collectively providing 20 percent or more of domestic electricity generation. This level of growth for renewables electricity is based on the objective of developing a scenario involving an accelerated deployment option as discussed in Chapter 2. However, simply continuing the level of deployment for wind that occurred in 2008 and assuming a capacity factor of 35 percent would have wind power contributing almost 14 percent of total projected electricity demand in 2035.8
But, as emphasized in the 20 percent wind scenario, greatly enhancing the penetration of renewable electricity will require large increases over current levels of manufacturing, employment, investment, and installation. The numbers from the 20 percent wind study demonstrate the potential challenges and opportunities: 100,000 wind turbines, up to $100 billion in additional capital costs and transmission upgrades, thousands of miles of new transmission lines, 100,000-plus jobs, and an 800-million-tonne annual reduction in CO2 emissions. Increasing manufacturing and installation capacity, employment, and investment to the level required to meet this goal can be done, but the magnitude of the challenge emphasizes the need for a consistent long-term approach in the public policy arena. And although the technologies and resources are clearly sufficient to move beyond a 20 percent contribution to electricity generation from renewables, greater penetrations obviously carry with them larger deployment and integration issues.
NON-ELECTRICITY RENEWABLE ENERGY
In addition to electricity generation, certain renewable resources—non-concentrating solar thermal technologies, low- and moderate-temperature geothermal, and biomass—can displace fossil fuels at the point of use, particularly in residential and commercial buildings and in light industry and agriculture. These resources are referred to as distributed renewables.
Solar Thermal
Applications for distributed solar thermal include water heating, space heating and cooling, and heat for industry and agriculture. Because the solar collector does not rely on concentrating the sun’s energy and can use both direct and diffuse radiation, distributed solar thermal systems are applicable to the entire United States. However, solar insolation and costs vary across the United States.
The most prevalent and well-developed applications are for heating swimming pools and potable water (in homes and laundries), with performance standards overseen by the U.S. Solar Rating and Certification Corporation.9 Systems include one or more collectors (which capture the sun’s energy and convert it into usable heat), a distribution structure, and a thermal storage unit. Associated piping, heat exchangers, and storage tanks use technology found in conventional HVAC and water-heating systems.
The unique component is the solar collector. The flat-plate collector is most common in the United States, but the use of evacuated-tube collectors is growing rapidly. For heating swimming pools, which is the country’s single largest application of solar thermal, the collector is an unglazed polymer absorber through which the pool water is circulated. Energy is delivered at moderate temperatures, usually less than 10°C above ambient. For domestic hot water, flat-plate collectors employ a copper plate absorber, usually coated with a wavelength-selective layer to reduce radiative losses. The absorber and tubes that contain the working fluid are mounted in an insulated box with a tempered glass cover. In evacuated-tube collectors, the absorber is mounted in an evacuated glass tube, and energy is delivered at temperatures up to 100°C.
Advances in manufacturing, materials, and industry standards have resulted in significant improvements since the 1980s in both the performance and the reli-
ability of solar thermal. Typically, systems reduce electricity or gas used for water heating by 40–70 percent. The number of buildings appropriate for solar thermal systems depends in general on population density and climate, but the actual market penetration depends on factors such as first and life-cycle cost, availability, customer preference, and local building codes and standards. The consensus is that the major obstacle to deployment is the relatively high initial purchase price, including installation, relative to electric and gas water heaters.
Projections of the potential for solar hot water to displace electricity and natural gas in residential and commercial buildings vary from 138 to 300 billion kWh (Davidson, 2005; Denholm, 2007). This would represent some 20–40 percent of all energy used for hot water heating in such buildings. An additional benefit would be reduced peak demand for electricity and gas, though this benefit would vary across the United States.10 But despite the predicted benefits of solar water heating and the fact that life-cycle savings are reasonable, the technology accounts for a very small fraction (~3 percent or less) of the approximately 10 million gas and electric water heaters shipped each year.11 The largest markets are China and European countries, many of which have aggressive financial incentives and public policies supporting distributed renewable technologies. In the United States, some (but not most) states include solar thermal in their RPS, and many have rebate programs for residential and commercial solar hot water. The Interstate Renewable Energy Council and the North Carolina Solar Energy Center maintain a database of state incentives for distributed renewable energy.12
The use of solar thermal systems to yield space heating and cooling in residential and commercial buildings could provide a greater reduction of fossil fuels than do water heaters, but at present these systems are largely an untapped opportunity. Recently there has been limited deployment of liquid-based solar collectors for radiant floor-heating systems and solar air heaters, but the challenge with these applications is the relatively large collector area required in the absence of storage. Solar cooling can be accomplished via absorption and desiccant cycles, but commercial systems are not widely available for residential use.
Future technological improvements potentially include cost-effective com-
|
10 |
The U.S. Solar Rating and Certification Corporation estimates that, on average, for every solar water heater installed 0.5 kW of peak demand is deferred. |
|
11 |
U.S. Department of Energy, Office of Energy Efficiency and Renewable Energy. 2004 Buildings Energy Data Book, downloadable at buildingsdatabook.eren.doe.gov/. |
|
12 |
Database of State Incentives for Renewables and Efficiency, available at www.dsireusa.org/. |
pact storage technologies, based on phase-change and thermochemical mechanisms (with higher storage density than water), and materials that replace the copper and low-iron glass used in today’s collectors. Reductions in the cost of manufacture, materials, assembly, and shipping weight may be possible through a shift from metal/glass components to integrated systems, such as those associated with polymeric materials, that are manufactured using mass-production techniques.
Geothermal
Geothermal energy can be applied to a variety of end-uses, including agriculture (mainly greenhouse heating), aquaculture, industrial processes, and space heating and cooling of buildings.
Direct-use geothermal taps heated groundwater, without a heat pump or power plant, for the heating of facilities, with the technology generally involving resource temperatures between 38° and 150°C (Lindal, 1973). Current U.S. installed capacity of direct-use systems is 620 MWthermal(MWt).13 Municipalities and smaller communities provide district heating by circulating hot water from aquifers through a distribution pipeline to the points of use, though this application of geothermal energy remains modest, with systems in only seven states.14 The barriers to increased penetration of direct geothermal heating and cooling systems are the high initial investment costs and the challenges associated with locating and developing appropriate sites. The resource for direct heating is richest in the western states.
Geothermal heat pumps have extended the use of geothermal energy into traditionally nongeothermal areas of the United States, mainly the midwestern and eastern states. A geothermal heat pump draws heat from the ground, groundwater, or surface water and discharges heat back to those media instead of into the air. The available land area and the soil and rock types at the installation site determine the best solution. Ground-coupled heat pumps are the most common type used. The efficiency of the heat pump is inversely proportional to the temperature difference between the conditioned space and the heat source or heat sink. As a consequence, heating and cooling efficiencies are improved because ground temperatures remain relatively constant throughout the year. The coefficient of perfor-
|
13 |
Geo-Heat Center, Oregon Institute of Technology; see geoheat.oit.edu. |
|
14 |
mance is 3.4–4.4,15 and the annual operating costs are 25–33 percent of comparable fossil-fuel heating costs.
The electric heat pump is standard off-the-shelf equipment, with minor modifications to handle the heat transfer from geothermal fluids or soil. The heat-pump equipment is located indoors, which reduces maintenance costs, and the more stable operating temperature and pressure of the compressor give it a longer life than in air heat pumps. The unique component is the heat-exchange interface with the soil or with the groundwater. Ground-coupled heat pumps use high-density polyethylene pipe buried either vertically or in horizontal trenches to exchange heat between a working fluid and the soil. Vertical loops cost more, but they provide access to more stable deep-soil temperatures and are the only option if land area is limited. Regulatory requirements for the bore holes vary across the country, with the primary regulatory issue being the potential for groundwater contamination. This problem is addressed by grouting the bore hole; the most commonly used material (bentonite-based grout) reduces heat transfer to the soil, but more conductive grouts such as cement mixtures and bentonite/sand mixtures provide superior performance.
Today, the United States has 700,000 installed units—with 8,400 MWt of capacity delivering about 7,200 GWh/yr16—and there are 1.5 million units worldwide. The rate of installation is estimated to be 10,000–50,000 units per year. One barrier to growth is the lack of sufficient infrastructure (i.e., trained designers and installers) and another is the high initial investment cost compared to conventional space-conditioning equipment. There are no major technical barriers to greater deployment.
Biomass
Burning wood to heat U.S. homes currently represents about 1 percent of fuel used for direct heating of buildings.17 One-half to two-thirds of residential wood combustion in the United States occurs in wood stoves, as opposed to fireplaces (Fine et al., 2004). Solid fuels include conventional wood logs, which may or may not
|
15 |
See www.eia.doe.gov/cneaf/solar.renewables/page/heatpumps/heatpumps.html, Tables 3.3 and 3.4. The coefficient of performance is the ratio of heat output per unit of energy input. |
|
16 |
Geo-Heat Center, Oregon Institute of Technology; see geoheat.oit.edu. |
|
17 |
U.S. Department of Energy, Office of Energy Efficiency and Renewable Energy. 2008 Buildings Energy Data Book, downloadable at buildingsdatabook.eere.energy.gov/. This figure does not include biomass that is used in electricity generation. |
have been harvested sustainably, and pellets. Advanced biomass-fuel appliances use pellets, which are produced by compressing woody material that may include waste wood and sawdust, agricultural wastes, wastepaper, and other organic materials. Some pellet-fuel appliances can also burn corn kernels, nutshells, and wood chips. Pellet stoves use electricity to run fans, controls, and pellet feeders.
One of the concerns about solid-fuel combustion for home heating is air pollution. In areas where wood stoves are prevalent, wood smoke is a major source of fine particulates and gaseous pollutants, including nitrogen oxides, carbon monoxide, and organics. The mandatory smoke-emission limit set by the U.S. Environmental Protection Agency (EPA) for wood stoves is 7.5 grams of smoke per hour for noncatalytic stoves and 4.1 g/h for catalytic stoves.18 Modern noncatalytic stoves have improved fireboxes to achieve high combustion efficiency. The most efficient wood-burning appliances also use catalytic converters to achieve nearly complete combustion of the feedstock and to reduce harmful emissions. Stoves are available with EPA-certified emissions as low as 1 g/h. Stoves require homeowner maintenance and catalyst replacement, however, to retain their high efficiencies and low emissions.
In summary, modern solid-fuel stoves are efficient and clean compared to the fireplaces of the past. The economics of using a stove to combust biomass products depends on the fuel being displaced and the distance from home to supplier.
CONCLUSION
A future characterized by a large penetration of renewable electricity represents a paradigm shift from the current electricity generation, transmission, and distribution system. There are many reasons why renewable electricity represents such a shift, including the spatial distribution and intermittency of some renewable resources, as well as issues related to greatly increasing the scale of deployment. Wind and solar—two renewable-energy resources with the potential for large near-term growth in deployment—are intermittent resources that have some of their resource bases located far from demand centers. The transformations required to incorporate a significant penetration of additional renewables include transformation in ancillary capabilities, especially the expansion of transmission
and backup power resources, and deployment of technologies that improve grid intelligence and provide greater system flexibility. Further, supplying renewable resources on a scale that would make a major contribution to U.S. electricity generation would require vast investment in and deployment of manufacturing and human resources, as well as additional capital costs relative to those associated with current generating technologies that have no controls on greenhouse gas emissions. The realization of such a future would require a predictable policy environment and sufficient financial resources. Nevertheless, the promise of renewable resources is that they offer significant potential for low-carbon generation of electricity from domestic sources of energy that are much less vulnerable to fuel cost increases than are other electricity sources. Overall success thus depends on having technology, capital, and policy working together to enable renewable-electricity technologies to become a major contributor to America’s energy future.
REFERENCES
AEP (American Electric Power). 2007. Interstate transmission vision for wind integration. AEP white paper. Columbus, Ohio.
ASES (American Solar Energy Society). 2007. Tracking Climate Change in the U.S.: Potential Carbon Emissions Reductions from Energy Efficiency and Renewable Energy by 2030. Washington, D.C.
AWEA (American Wind Energy Association). 2008. 20 Percent Wind Energy Penetration in the United States: A Technical Analysis of the Energy Resource. Washington, D.C.
AWEA. 2009a. Wind energy grows by record 8,300 MW in 2008 (January 27, 2009, press release). Washington, D.C.
AWEA. 2009b. AWEA First Quarter 2009 Market Report. Washington, D.C.
Baidya, Roy S., S.W. Pacala, and R.L. Walko. 2004. Can large wind farms affect local meteorology? Journal of Geophysical Research 109:D19101.1-D19101.6.
Beaudry-Losique, J. 2007. Biomass R&D program and biomass-to-electricity. Presentation at the first meeting of the Panel on Electricity from Renewable Resources, Washington, D.C., September 18, 2007.
Berry, J.E., M.R. Holland, P.R. Watkiss, R. Boyd, and W. Stephenson. 1998. Power Generation and the Environment: A UK Perspective. European Commission. June.
Black & Veatch. 2007. 20 Percent Wind Energy Penetration in the United States: A Technical Analysis of the Energy Resource. Black & Veatch Project 144864. Prepared for the America Wind Energy Association, Walnut Creek, Calif.
Chataignere, A., and D. Le Boulch. 2003. Wind Turbine (WT) Systems. Final Report. ECLIPSE (Environmental and Ecological Life Cycle Inventories for Present and Future Power Systems in Europe). European Commission.
Chaudhari, M., L. Frantzis, and T.E. Holff. 2004. PV Grid Connected Market Potential Under a Cost Breakthrough Scenario. San Francisco, Calif.: The Energy Foundation and Navigant Consulting.
Chu, S. 2009. Department of Energy FY 2010 Budget—Transforming the Energy Economy through Science and Innovation. DOE Budget Rollout Presentation, Washington, D.C., May 7, 2009.
Davidson, J.H. 2005. Low-temperature solar thermal systems: An untapped energy resource in the United States. Journal of Solar Energy Engineering 127:305-306.
DeCarolis, J.F., and D.W. Keith. 2004. The economics of large-scale wind power in a carbon constrained world. Energy Policy 34:395-410.
DeMeo, E., W. Grant, M.R. Milligan, and M.J. Schuerger. 2005. Wind plant integration. IEEE Power Energy. Nov.-Dec.
Denholm, P.L. 2004. Environmental and Policy Analysis of Renewable Energy Enabling Technologies. Ph.D. dissertation. University of Wisconsin-Madison.
Denholm, P., and G. Kulcinski. 2003. Net Energy Balance and Greenhouse Gas Emissions from Renewable Energy Storage System. ECW Report Number 223-1. Energy Center of Wisconsin, June.
Denholm, P. 2007. The Technical Potential of Solar Water Heating to Reduce Fossil Fuel Use and Greenhouse Gas Emissions in the United States. Technical Report NREL. Golden, Colo.
DOE (U.S. Department of Energy). 2007a. National Solar Technology Roadmap: Wafer-Silicon PV. Energy Efficiency and Renewable Energy Office. Washington, D.C.
DOE. 2007b. Solar America Initiative: A Plan for the Integrated Research, Development, and Market Transformation of Solar Energy Technologies. Washington, D.C.
DOE. 2008a. 20% Wind Energy by 2030: Increasing Wind Energy’s Contribution to U.S. Electricity Supply. Washington, D.C. Available at www1.eere.energy.gov/windand hydro/pdfs/41869.pdf. Accessed April 21, 2009.
DOE. 2008b. Annual Report on U.S. Wind Power Installation, Cost, and Performance Trends: 2007. Energy Efficiency and Renewable Energy Office. Washington, D.C.
EIA (Energy Information Administration). 2007. Annual Energy Review 2006. DOE/EIA-0384(2006). Washington, D.C.: U.S. Department of Energy, Energy Information Administration.
EIA. 2008a. Annual Energy Outlook 2009 Early Release. DOE/EIA-0383(2009). Washington, D.C.: U.S. Department of Energy, Energy Information Administration.
EIA. 2008b. Energy Market and Economic Impacts of S. 2191, the Lieberman-Warner Climate Security Act of 2007. Washington, D.C.: U.S. Department of Energy, Energy Information Administration.
EIA. 2008c. Annual Energy Outlook 2008. DOE/EIA-0383(2008). Washington, D.C.: U.S. Department of Energy, Energy Information Administration.
Elliott, D.L., C.G. Holladay, W.R. Brachet, H.P. Foote, and W.R. Sandusky. 1986. Wind Energy Resource Atlas of the United States. Washington, D.C.: National Renewable Energy Laboratory.
Elliott, D.L., L.L. Wendell, and G.L. Gower. 1991. An Assessment of the Available Windy Land Area and Wind Energy Potential in the Contiguous United States. Pacific Northwest Laboratory. Richland, Wash.
EPRI (Electric Power Research Institute). 2005. Final Summary Report: Offshore Wave Power Project. Palo Alto, Calif.
EPRI. 2007a. Assessment of Waterpower Potential and Development Needs. Palo Alto, Calif.
EPRI. 2007b. The Power to Reduce CO2 Emissions: The Full Portfolio. Palo Alto, Calif.
European Commission. 1997a. External Costs of Electricity Generation in Greece. ExternE Project. Available at externe.jrc.es/reports.html.
European Commission. 1997b. ExternE National Implementation Denmark. Available at externe.jrc.es/reports.html.
European Commission. 1997c. ExternE National Implementation France. Available at externe.jrc.es/reports.html.
European Commission. 1997d. ExternE National Implementation Germany. Available at externe.jrc.es/reports.html.
EWEA (European Wind Energy Association). 2005. Large Scale Integration of Wind Energy in the European Power Supply: Analysis, Issues and Recommendations. Brussels, Belgium.
Fine, P.M., G.R. Cass, and B.R.T. Simoneit. 2004. Chemical characterization of fine particle emissions from the wood stove combustion of prevalant United States tree species. Environmental Engineering Science 21:705-721.
Fletcher, E.A. 2001. Solar thermal processing: A review. Journal of Solar Energy Engineering 123:63-74.
Flynn, H., and T. Bradford. 2006. Polysilicon: Supply, Demand, and Implications for the PV Industry. Cambridge, Mass.: Prometheus Institute.
Frankl, P., A. Corrado, and S. Lombardelli. 2004. Photovoltaic (PV) Systems. Final Report. ECLIPSE (Environmental and Ecological Life Cycle Inventories for Present and Future Power Systems in Europe). European Commission.
Fthenakis, V.M., and H.C. Kim. 2007. Greenhouse-gas emissions from solar electric and nuclear power: A life-cycle study. Energy Policy 35:2549-2557.
GE Energy Consulting. 2005. The Effects of Integrating Wind Power on Transmission System Planning, Reliability, and Operations. Prepared for New York State Energy Research and Development Authority, Albany, N.Y.
Genter, A., D. Fritsch, N. Cuenot, J. Baumgartner, and J. Graff. 2009. Overview of the current activities of the European EGS Soultz project: From exploration to electricity production. Proceedings of the Thirty-Fourth Workshop on Geothermal Reservoir Engineering, Stanford University, Stanford, Calif., February 9–11, 2009.
Goldberg, M., K. Sinclair, and M. Milligan. 2004. Job and economic development impact (JEDI) model: A user-friendly tool to calculate economic impacts from wind projects. Global Windpower Conference, Chicago, Ill.
Haq, Z. 2001. Biomass for Electricity Generation. Energy Information Agency, U.S. Department of Energy, Washington, D.C. Available at www.eia.doe.gov/oaif/analysispaper/biomass.
Holttinen, H., B. Lemstršm, P. Meibom, H. Bindner, A. Orths, F. van Hulle, C. Ensslin, A. Tiedemann, L. Hofmann, W. Winter, A. Tuohy, M. O’Malley, P. Smith, J. Pierik, J.O. Tande, A. Estanqueiro, J. Ricardo, E. Gomez, L. Sšder, G. Strbac, A. Shakoor, J.C. Smith, B. Parsons, M. Milligan, and Y. Wan. 2007. Design and operation of power systems with large amounts of wind power: State-of-the-art report. VTT Working Papers 82. VTT Technical Research Centre of Finland, October. Available at http://www.vtt.fi/inf/pdf/workingpapers/2007/W82.pdf.
Hondo, H. 2005. Life cycle GHG emission analysis of power generation systems: Japanese case. Energy 30:2042-2056.
JCSP (Joint Coordinated System Plan). 2009. Joint Coordinated System Plan 2008.
Jones, A.T., and W. Finley. 2003. Recent developments in salinity gradient power. Pp. 2284-2287 in OCEANS 2003: Celebrating the Past, Teaming Toward the Future. Columbia, Md.: Marine Technology Society.
Keith, D.W., J.F. DeCarolis, D.C. Denkenberger, D.H. Lenschow, S.L. Malyshev, S. Pacala, and P.J. Rasch. 2004. The influence of large-scale wind power on global climate. Proceedings of the National Academy of Sciences USA 101:16115-16120.
Laxson, A., M.M. Hand, and N. Blair. 2006. High Wind Penetration Impact on U.S. Wind Manufacturing Capacity and Critical Resources. National Renewable Energy Laboratory Technical Report NREL/TP-500-40482.
Lindal, B. 1973. Industrial and Other Uses of Geothermal Energy. Paris: UNESCO.
Mancini, T., P. Heller, B. Bulter, B. Osborn, S. Wolfgang, G. Vernon, R. Buck, R. Diver, C. Andraka, and J. Moreno. 2003. Dishing Stirling systems: An overview of development and status. Journal of Solar Energy Engineering 125:135-151.
Mann, M., and P. Spath. 1997. Life Cycle Assessment of a Biomass Gasification Combined-Cycle System. Golden, Colo.: National Renewable Energy Laboratory.
Meier, P. 2002. Life-Cycle Assessment of Electricity Generation Systems and Applications for Climate Change Policy Analysis. Ph.D. dissertation. University of Wisconsin-Madison.
Mills, A., and R. Wiser. 2009. The Cost of Transmission for Wind Energy: A Review of Transmission Planning Studies. Berkeley, Calif.: Lawrence Berkeley National Laboratory.
MIT (Massachusetts Institute of Technology). 2006. The Future of Geothermal Energy. Cambridge, Mass.
Murphy, L.M., and P.L. Edwards. 2003. Bridging the Valley of Death: Transitioning from Public to Private Sector Financing. Prepared for National Renewables Energy Laboratory, Task Order #7200.2050. Golden, Colo.
NAS-NAE-NRC (National Academy of Sciences-National Academy of Engineering-National Research Council). 2009. Electricity from Renewable Resources: Status, Impediments, and Prospects. Washington, D.C.: The National Academies Press.
NRC (National Research Council). 2007. Environmental Impacts of Wind-Energy Projects. Washington, D.C.: The National Academies Press.
NREL (National Renewable Energy Laboratory). 2007a. Wind Energy Resource Atlas of the United States. Golden, Colo.
NREL. 2007b. Very Large Scale Deployment of Grid Connected Solar PV in the United States. Golden, Colo.
NREL. 2007c. Projected Benefits of Federal Energy Efficiency and Renewable Energy Programs. NREL/TP-640-41347. Golden, Colo. March. See www1.eere.energy.gov/ba/pba/pdfs/41347.pdf. Accessed May 1, 2008.
Odeh, N.A., and T.T. Cockerill. 2008. Life cycle GHG assessment of fossil fuel power plants with carbon capture and storage. Energy Policy 38:367-380.
OMB (U.S. Office of Management and Budget). 2004. Final Information Quality Bulletin for Peer Review. December 15. Available at www.whitehouse.gov/omb/inforeg/peer2004/peer_bulletin.pdf. Accessed April 21, 2009.
O’Regan, B., and M. Grätzel. 1991. Low-cost, high-efficiency solar cell based on dye-sensitized colloidal TiO2 films. Nature 353:737-740.
Parsons, B., M. Milligan, J.C. Smith, E. DeMeo, B. Oakleaf, K. Wolf, M. Schuerger, R. Zavadil, M. Ahlstrom, and D.Y. Nakafuji. 2006. Grid impacts of wind power variability: Recent assessments from a variety of utilities in the United States. Conference Paper NREL/CP 500-39955. Washington, D.C.: U.S. Department of Energy. July.
Patel, S. 2009. PV Sales in the U.S. soar as solar panel prices plummet. Power Magazine, March 1.
Perkens, C., and A.W. Weimer. 2004. Likely near-term solar-thermal water splitting technologies. International Journal of Hydrogen Energy 29:1587-1599.
Pernick, R., and C. Wilder. 2008. Utility Solar Assessment Study: Reaching Ten Percent by 2025. Clean Edge, Inc.
Roy, B.S., S.W. Pacala, and R.L. Walko. 2004. Can large wind farms affect local meteorology? Journal of Geophysical Research 109:D19101.
SEIA (Solar Energy Industries Association). 2001. Solar Electric Power: The U.S. Photovoltaic Industry Roadmap. Washington, D.C.
SEIA. 2004. Our Solar Power Future: The U.S. Photovoltaic Industry Roadmap Through 2030 and Beyond. Washington, D.C.
SERI (Solar Energy Research Institute). 1989. Ocean Thermal Energy Conversion: An Overview. SERI/SP-220-3024. Golden, Colo.
Smith, J.C. 2007. Integrating wind into the grid. Presentation to the Panel on Electricity from Renewable Resources, Washington, D.C., December 7.
Smith, J.C., and B. Parsons. 2007. What does 20 percent look like? IEEE Power and Energy 5:22-33.
Spath, P., and M. Mann. 2000. Life Cycle Assessment of a Natural Gas Combined-Cycle Power Generation System. Golden, Colo.: National Renewable Energy Laboratory.
Spath, P., and M. Mann. 2004. Biomass Power and Conventional Fossil Systems with and without CO2 Sequestration: Comparing the Energy Balance, Greenhouse Gas Emissions, and Economics. Golden, Colo.: National Renewable Energy Laboratory.
Spath, P., M. Mann, and D. Kerr. 1999. Life Cycle Assessment of Coal-Fired Power Production. Golden, Colo.: National Renewable Energy Laboratory.
Spitzley, D., and G.A. Keoleian. 2005. Life Cycle Environmental and Economic Assessment of Willow Biomass Electricity: A Comparison with Other Renewable and Non-Renewable Sources. Report CSS04-05R. Center for Sustainable Systems, University of Michigan. March 2004 (revised February 10, 2005).
Steinfeld, A. 2005. Solar thermochemical production of hydrogen: A review. Solar Energy 78(5):603-615.
Storm van Leeuwen, J.W., and P. Smith. 2008. Nuclear Power: The Energy Balance. Available at www.stormsmith.nl/. Accessed April 21, 2009.
Thresher, R., M. Robinson, and P. Veers. 2007. To capture the wind. Power and Energy Magazine 5:34-46.
U.S. Climate Change Science Program. 2007. Scenarios of Greenhouse Gas Emissions and Atmospheric Concentrations; and Review of Integrated Scenario Development and Application. Washington, D.C.
UWIG (Utility Wind Integration Group). 2006. Grid Impacts of Wind Power Variability: Recent Assessments from a Variety of Utilities in the United States. Reston, Va. Available at http://www.uwig.org/opimpactsdocs.html.
Vattenfall, A.B. 2004. Nordic Countries Certified Environmental Product Declaration: EDP of Electricity. From Vattenfall’s Nordic Hydropower. S-P-00088. February 2005.
Vredenbregt, L., R. Meijer, and J. Visser. 2003. The effect of co-firing 10 percent of secondary fuels on SCR catalyst deactivation. Proceedings of the Conference on Selective Catalytic Reduction and Non-Catalytic Reduction for NOx Control, October 29-30, 2003.
WGA (Western Governors’ Association). 2006. Clean and Diversified Energy Initiative. Geothermal Task Force Report. Washington, D.C.
White, S. 1998. Net Energy Payback and CO2 Emissions from Helium-3 Fusion and Wind Electrical Power Plants. UWFDM-1093. Ph.D. dissertation. Fusion Technology Institute, University of Wisconsin-Madison.
White, S. 2006. Net energy payback and CO2 emissions from three midwestern wind farms: An update. Natural Resources Research 15:271-281.
Wiley, L. 2007. Utility scale wind turbine manufacturing requirements. Presentation at the National Wind Coordinating Collaborative’s Wind Energy and Economic Development Forum, Lansing, Mich., April 24, 2007.
Wiser, R. 2008. The development, deployment, and policy context of renewable electricity: A focus on wind. Presentation at the fourth meeting of the Panel on Electricity from Renewable Resources, Washington, D.C., March 11, 2008.
Wiser, R., and G. Barbose. 2008. Renewables Portfolio Standards in the United States: A Status Report with Data through 2007. Berkeley, Calif.: Lawrence Berkeley National Laboratory.
Zavadil, R., J. King, L. Xiadong, M. Ahlstrom, B. Lee, D. Moon, C. Finley, L. Alnes, L. Jones, F. Hudry, M. Monstream, S. Lai, and J. Smith. 2004. Wind Integration Study Final Report. Xcel Energy and the Minnesota Department of Commerce, EnerNex Corporation and Wind Logics, Inc. Available at http://www.uwig.org/XcelMNDOCStudyReport.pdf.


