
7
Fossil-Fuel Energy
Total U.S. primary energy consumption in 2007 was about 100 quads, with fossil fuels—natural gas, petroleum, and coal—supplying about 85 percent, as shown in Table 7.1 (EIA, 2008a).1 Liquid fuels (derived primarily from petroleum) were the main contributors, accounting for 40 percent of total consumption (see Figure 1.2 in Chapter 1). This fossil-fuel dominance has held steady for decades.
Even more striking, each of the fossil fuels accounts for a major segment of an important end-use market. Petroleum supplies 98 percent of the energy used in the transportation market, natural gas provides 74 percent of the nonelectric energy used in the residential and commercial market, and coal furnishes 52 percent of the energy used to generate electricity. Only in the electricity market, where nuclear and renewable energy sources account for 29 percent of the total energy supply, do serious competitors to fossil fuels exist.2 Despite considerable efforts to expand biofuel production, for example, ethanol from corn provided only about 3 percent of the U.S. gasoline supply in 2005.
These distinctive structures exist because the attributes of liquid, gaseous, and solid fossil fuels closely match the needs of their respective end-use markets:
TABLE 7.1 U.S. Energy Consumption by Energy Source in 2007
-
Petroleum is easily stored and transported and has a relatively high energy density. These characteristics are well suited to the transportation market.
-
Natural gas burns cleanly, is easily transported by pipeline, and can be stored in salt domes and old gas fields for peak use. As a result, it is a desirable fuel for the geographically distributed residential and commercial markets.
-
Coal is abundant in the United States, is easily stored, and is less expensive, with lower price volatility than other fuels—attractive attributes for electricity generation.
Although the market-based reasons for using fossil fuels are thus very strong, U.S. reliance on this energy source carries some potentially adverse consequences. For one, reserves of petroleum—and, increasingly, of natural gas—are concentrated in only a few countries. In some cases, supplier nations have restricted supplies for nonmarket reasons. Moreover, such concentrations of production capacity, and the limited number of transportation routes from these facilities to their markets, create targets by which hostile states or nonstate actors may disrupt supplies. In either case, the security of petroleum and natural gas supplies is at risk, probably increasingly so.
A second concern is that the longer-term global demand for petroleum and
natural gas is projected to grow faster than increases in production, resulting in tight market conditions and rising prices. The U.S. Energy Information Administration (EIA) and the International Energy Agency (IEA), along with other forecasters, do not anticipate that the factors underlying these market conditions will change anytime soon.3 Under such conditions, maintaining significant spare production capacity is difficult.
From the point of view of net consuming nations, the resulting price increases could accelerate an economically disruptive wealth transfer from consumers to producers. While the dependence of the U.S. economy on oil has changed little in recent decades—in 1990, 39.7 percent of U.S. energy consumption was petroleum; in 2007, it was 39.2 percent—U.S. dependence on imports has doubled over this period.
Finally, fossil fuels pollute the atmosphere when burned, and they have other adverse environmental effects as well. While emissions of SOx, NOx, particulates, and other atmospheric contaminants have been reduced (albeit with an increase in solid, liquid, or recyclable wastes, including ash residuals), little has been done so far to address carbon dioxide (CO2) emissions. U.S. energy use in 2007 was responsible for emissions of 6 billion tonnes of CO2 (6 Gt CO2). Of that amount, 43 percent came from petroleum, 36 percent from coal, and 21 percent from natural gas (EIA, 2008c). By market, the largest source was electric power generation (using coal and natural gas); it emitted some 2.4 Gt CO2. Transportation, dominated by petroleum but also including some natural gas, accounted for 2 Gt CO2. The remainder of the emissions resulted from industrial (1 Gt CO2), residential (0.35 Gt CO2), and commercial uses (0.25 Gt CO2).4 (See Figure 1.11 in Chapter 1.)
Thus the future of fossil fuels presents a serious dilemma for energy policy. On the one hand, because fossil fuels are well adapted to the needs of the market, a huge energy infrastructure has been put in place to take advantage of their value. The existing stocks of vehicles, home and business heating systems, and electric power stations were created with the expectation that petroleum, natural gas, and coal would be readily and reliably available. On the other hand, the
extraction and use of fossil fuels entail growing security, economic, and environmental risks. A crucial question, therefore, is whether this existing energy infrastructure can be supplied with liquid, gaseous, and solid fuels in the future at acceptable levels of such risks. If so, much of it can remain in place. If not, the embedded capital stock of technologies for energy production and use will need to change through a combination of market forces and policy choices.
Other chapters of this report discuss alternative pathways for providing the energy services that modern society demands. For example, the chapter on alternative transportation fuels (Chapter 5) provides an assessment of the technologies and environmental impacts of liquid fuels derived from biomass feedstocks, coal, or natural gas. This present chapter focuses on alternative ways of using fossil fuels to serve the existing energy-use infrastructure. Specifically, it explores:
-
The extent to which the U.S. endowment of fossil fuels is limited in its ability to meet future needs for liquid, gaseous, and solid fuels by means of conventional pathways.
-
New technologies that may become available for producing the desired form of fossil fuels. The focus in particular is on the generation of electricity from coal and natural gas with sharply reduced emissions of greenhouse gases, especially CO2.
-
Technologies and geologic settings suitable for the storage of CO2 produced from electricity generation and other industrial processes.
-
Environmental concerns that affect the future of fossil-fuel supply and use.
Given constraints on time and resources, the AEF Committee chose not to address issues relating to the current energy infrastructure, for example, the status of natural gas pipelines, oil refineries, rail and barge transportation for coal, and liquefied natural gas terminals.
OIL, GAS, AND COAL RESOURCES
Worldwide, the amount of oil, gas, and coal that can ultimately be produced is very large. Estimates of ultimately recoverable resources are uncertain, however, because they include not only those that are discovered though not yet economically or technically recoverable but also those that are yet to be discovered. Nev-
ertheless, the potential is impressive. Roughly 3.3 trillion barrels of oil and 15,000 trillion cubic feet (Tcf) of natural gas are thought to be ultimately recoverable. By comparison, in 2006, world consumption of these resources was about 30 billion barrels of crude oil and 100 Tcf of gas. (See Tables 7.2, 7.3, and 7.4 for summaries of oil, gas, and coal statistics.)
Resources that are discovered, recoverable with current technology, commercially feasible, and remaining in the ground are classified as reserves. The size of
TABLE 7.2 Conventional Oil Resources, Reserves, and Production (billion barrels, variable years as noted)
|
|
United States |
World |
U.S. Percent of World Total |
|
Resources |
430a |
3345b |
13.0 |
|
Reservesc |
29 |
1390 |
2.1 |
|
Annual production |
2.5/yr |
29.8/yr |
8.4 |
|
Annual consumption |
7.5/yr |
31.1/yrd |
24.1 |
|
aDOE, 2006a, available at fossil.energy.gov/programs/oilgas/eor/Undeveloped_Domestic_Oil_Resources_Provi.html. bNPC, 2007, p. 97. c2007 data from British Petroleum, 2008. dAccording to British Petroleum, 2008, discrepancies between world production and consumption “are accounted for by stock changes; consumption of nonpetroleum additives and substitute fuels; and unavoidable disparities in the definition, measurement, or conversion of oil supply and demand data.” |
|||
TABLE 7.3 Natural Gas Resources, Reserves, and Production (trillion cubic feet, variable years as noted)
|
|
United States |
World |
U.S. Percent of World Total |
|
Resources |
1,525a |
15,401b |
9.4 |
|
Reservesc |
211 |
6,263 |
3.4 |
|
Annual production |
19.3/yr |
104.1/yr |
18.5 |
|
Annual consumptionc |
23.1/yr |
103.5/yrd |
22.3 |
|
aPGC, 2006, available at www.mines.edu/research/pga/. bNPC, 2007, p. 97. c2007 data from British Petroleum, 2008. dAccording to British Petroleum, 2008, discrepancies between world production and consumption are “due to variations in stocks at storage facilities and liquefaction plants, together with unavoidable disparities in the definition, measurement or conversion of gas supply and demand data.” |
|||
TABLE 7.4 Coal Reserves and Production (million tonnes, variable years as noted)
|
|
United States |
World |
U.S. Percent of World Total |
|
Resources |
3,968,000a |
9,218,000b |
43.0 |
|
Reservesc |
242,721 |
847,488 |
28.6 |
|
Annual productionc |
1,039.2/yr |
6,395.6/yr |
16.2 |
|
Annual consumptionc |
1,015.3/yr |
6,481.1/yr |
15.7 |
|
aEIA, 1999. bHermann, 2006. c2007 data from British Petroleum, 2008. |
|||
known reserves, while considerably smaller than the more speculative estimates of ultimately recoverable resources, is also large. British Petroleum has reported that proved reserves of oil in 2006 amounted to 1390 billion barrels and that proved natural gas reserves were 6263 Tcf (British Petroleum, 2007). World coal reserves were 900 billion tonnes, which is about 300 times the 2006 world coal consumption (British Petroleum, 2007).
Technology plays an important role in turning speculative resources into proved reserves. Sophisticated exploration and production methods for recovery of oil and natural gas are already commercially available, and the private sector is developing advanced versions of these techniques. The cumulative effect of continuing advances in exploration and production technology for oil and gas is that over the next 20 years much of the current resource base will become technically recoverable. (See Table 7.5 for a discussion of this technology.)
As noted previously, world reserves are annually producing about 30 billion barrels of oil and 104.1 Tcf of natural gas. The United States is the third-largest oil-producing country and the second-largest natural gas producer. Nevertheless, this country imports about 56 percent of its oil and about 14 percent of its natural gas.5 Import dependence, especially for oil, creates serious economic and security risks, as global oil and gas supplies may be influenced by restrictions imposed by governments, by the actions of the Organization of the Petroleum Exporting Countries (OPEC), or by disruptions due to political instability or regional conflict. For this reason, the capacity to maintain or increase domestic production is
TABLE 7.5 Summary of Highly Significant Oil Exploration and Production Technologies
|
Technology |
Timeframe |
Discussion |
|
Big increase in controlled reservoir contact |
2015 |
Technologies allowing a continuing increase in the number of strategically placed horizontal wells will allow a much greater commercial access to reserves. |
|
Horizontal, multilateral, and fishbone wells |
2020 |
Multiply placed drainholes from a main wellbore will further extend commercial access to reserves. |
|
Arthroscopic well construction |
2025 |
The ability to place drain holes to within feet of every hydrocarbon molecule in the formation allows the ultimate recovery. |
|
SWEEP (see, access, move) |
2020 |
The combined technologies (including the four immediately below) allowing us to see, access, and move the hydrocarbons in the optimum way will bring a big increase to recoverable reserves. |
|
Smart well (injection and production) |
2015 |
The ability to control what fluids go where (at the wellbore). |
|
Reservoir characterization and simulation |
2015 |
Extending current technology to include simultaneous inversion of all measurements with a forward model. |
|
Reservoir vision and management in real time |
2020 |
Combining reserve scale measurements (pressure, seismic, electromagnetic, and gravity) in a joint inversion, with uncertainty and without bias. |
|
Mission control for everything |
2020 |
A full representation and control of the full system (subsurface and surface) allowing true optimization. |
|
CO2 flood mobility control |
2020 |
Measurement and control of the CO2 flood front is critical to successful implementation. |
|
Artificial lift |
2030 |
Produce only wanted fluids to surface. |
|
Drilling efficiency |
2015 |
A further extension of gains already made. |
|
Steam-assisted gravity drainage (SAGD) or steam and alkaline-surfactant-polymers (ASPs) |
2030 |
Technologies to perfect and optimize SAGD operations (including the use of ASPs) will be key to widespread economic exploitation of heavy oil. |
|
Arctic subsea-to-beach technology |
2020 |
Ice scouring of the seafloor surface presents a huge challenge to conventional approaches to subsea and subsea-to-beach operations. |
|
Faster and more affordable, higher-definition 3D seismic |
2015 |
Quicker, better, cheaper, could extend the already impressive “specialized” technology in universal use. |
|
Source: NPC , 2007, Topic Paper 19, “Conventional Oil and Gas,” Table V.1. |
||
a major concern for energy policy. Technical, environmental, and economic uncertainties, however, constrain the pace at which domestic oil and gas production can or will be increased. Accordingly, the following sections focus on the ability of domestic oil, natural gas, and coal sources to maintain or increase production. Tables 7.2 and 7.3 summarize the current levels of resources, reserves, and production for domestic oil and natural gas, and Table 7.4 reports reserves and production for coal.
Oil
While Table 7.2 summarizes estimates of the quantities of various types of oil resources in the United States, Table 7.6 disaggregates them. “Proved reserves” in Table 7.6 are those that can reasonably be recovered at costs low enough to allow economic production of the resource. The remaining estimated resources listed are called “technically recoverable”—that is, they are generally expected to be recoverable using currently available technology, but without regard to economic viability. In some cases, the estimates are for oil that is yet to be discovered. These estimates are obviously less certain than for those resources already discovered.
Table 7.6 lists estimates of the range of costs that might be incurred to produce each of the resources. The wide ranges of estimated costs reflect considerable uncertainty; costs vary widely, depending on the location, size, and depth of the resource and on many other factors. Finally, Table 7.6 also estimates the time period in which a reasonable quantity of the resource might be available for use. Here again, there is considerable uncertainty because of costs and other limitations, such as access to drilling or mining and environmental impacts.
The resources listed in Table 7.6 for light oil enhanced oil recovery (EOR) are those that could be recovered primarily by CO2 injection. Whereas conventional oil recovery processes (primary production under the natural pressure in the reservoir and water injection) typically recover about a third of the oil in place, this resource estimate is based on an assumption that total recovery in fields suited to CO2 injection would reach 50 percent. The total amount recovered in some reasonable time period is likely to be lower than the total listed, however. Not all fields will be large enough to warrant the investment required, and sufficient CO2 may not be available. Even so, the experience gained in operating CO2 EOR projects in west Texas over the last three decades has advanced the technology significantly. EOR projects can now be undertaken with confidence that high-pressure injected CO2 can displace oil efficiently in the zones that it invades.
TABLE 7.6 U.S. Oil Resources and Reserves
|
|
Barrels (billion) |
Estimated Cost Range ($/bbl) |
Time Period for Significant Recovery |
|
Oil Reserves (2007 annual U.S. production: 2.5 billion bbla) |
|
|
|
|
Conventional light oil proved reservesb |
22 |
10–20 |
<2020 |
|
Natural gas liquid proved reservesc |
8 |
|
<2020 |
|
Technically Recoverable Resources |
|
|
|
|
Light oil EORd |
90 |
20–45 |
<2020 |
|
Heavy oil EORb |
20 |
25–60 |
<2020 |
|
Residual zone EORc |
20 |
60–130 |
2020–2035 |
|
Undiscovered conventional (onshore)b |
43 |
40–60 |
2010–2035 |
|
Undiscovered conventional (offshore)b |
76 |
75–95 |
2020–2035 |
|
Undiscovered EOR (onshore)b |
22 |
50–75 |
>2035 |
|
Undiscovered EOR (offshore)b |
38 |
105–145 |
>2035 |
|
Reserve growth (conventional recovery)b |
71 |
10–20 |
<2020 |
|
Reserve growth (EOR)b |
40 |
20–45 |
2020–2035 |
|
Tar sandsb |
10 |
40–95 |
>2035 |
|
Oil shalese |
500 |
40–95 |
>2035 |
|
aBritish Petroleum, 2008. bDOE, 2006a. cBritish Petroleum, 2008. dDOE, 2006b. eBartis et al., 2005. |
|||
An extensive infrastructure of pipelines in west Texas delivers CO2 to numerous oil fields. Much of that CO2 is transported by pipeline from natural CO2 sources in Colorado and New Mexico, though there are also significant EOR projects in west Texas, Wyoming, and Colorado that make use of CO2 separated from natural gas (instead of venting it to the atmosphere). The pipeline infrastructure demonstrates CO2 transport technology that would be needed to support large-scale geologic storage of CO2. These projects also allow assessment of whether injected CO2 has been retained in the subsurface (Klusman, 2003). For example, measurements of CO2 seepage at the surface above the Rangely Field in Colorado indicate that the rate of CO2 escape from the storage formation is very low (less than 170 tonnes per year over an area of 72 km2). Currently, CO2 injection for EOR is limited mainly by the availability of CO2 at a reasonable cost. If CO2 were more widely available in the future at a reasonable distance from existing oil fields as a result of limits on CO2 emissions, more widespread use of CO2 EOR could be
anticipated. (See the section titled “Geologic Storage of CO2” later in this chapter and the section titled “Oil and Gas Reservoirs” in Annex 7.A for additional discussion of the potential for CO2 EOR to contribute to geologic storage of CO2.)
Heavy oils are difficult to displace; hence, typical primary recovery of oil from such reservoirs is much lower than that of lighter oils. Heavy oil is typically recovered by injecting steam, which warms the oil and reduces its viscosity so that it can flow more easily into production wells. Steam for injection is typically generated by burning a portion of the oil produced or by burning natural gas in areas where air-quality restrictions limit use of the crude oil as a fuel. This technology is now relatively mature and has been applied widely in heavy-oil fields in California, for example. Dissolving CO2 in heavy oil also reduces its viscosity, but the use of CO2 to recover heavy oil has not been tested in field projects.
Residual zone EOR refers to the possibility that some of the oil that is found in the transition zone between water and oil at the base of a reservoir can also be recovered by CO2 injection. This process is less well proven and likely more expensive than CO2 injection in zones that have less water and more oil present.
The estimates of undiscovered conventional and EOR resources in Table 7.6 are based on assessments by the U.S. Geological Survey (USGS) and the U.S. Minerals Management Service (MMS). The estimates shown for technically recoverable resources are 33 percent of those amounts for conventional recovery and an additional 17 percent for EOR. Reserve growth refers to the observation that the amount of oil listed as proved reserves often increases over time; information obtained through development drilling in the field is used to refine initial estimates of oil in place.
There is currently no significant production of oil from tar sands in the United States, as the U.S. tar sand resource is modest. There is a much larger resource of tar sands in Canada, however, and it has shown significant growth in production. The technically recoverable Canadian resource is estimated at 173 billion barrels (RAND, 2008), and the EIA projects production rates of 2.1–3.6 million barrels per day in 2020 and 4 million barrels per day in 2030, depending on oil price.
The largest oil resource listed in Table 7.6 is from oil shales, but it is among the most uncertain. The estimated overall resource is very large (1.5–1.8 trillion barrels); one source has estimated that as much as a third of it could eventually be recovered by some combination of mining followed by surface retorting or in situ retorting (Bartis et al., 2005). There is currently no production of oil from shale in the United States, though a new process for in situ retorting based on electric
heating of the shale in the subsurface is being tested (Shell, 2006). Environmental impacts associated with mining, limitations on availability of water for processing, and potential demand for electricity to be used for in situ retorting must be assessed before better-constrained estimates of recoverable quantities of oil from shales can be assembled. Also, current cost estimates for shale oil recovery are not well defined.
In the absence of CO2 capture and storage, production of oil either by enhanced oil recovery methods or by conversion from tar sands or oil shales emits more CO2 than does conventional oil production. This is shown in Figure 7.1, which provides estimates of the potential emissions that result from production and use of fuels from various primary fossil-fuel resources (Farrell and Brandt, 2006).6 The fuels all have about the same CO2 emissions when they are burned, but the energy requirements to recover and upgrade the hydrocarbons vary significantly. As an example, fuels from tar sands may ultimately emit about 40 percent more CO2 than do fuels from conventional oil,7 though the ranges of estimated emissions indicate that there are significant uncertainties in the values reported. These emissions can in principle be mitigated by large-scale carbon capture and storage (CCS), as noted above, or by the use of low-carbon technologies for process heat and hydrogen production. In addition, both surface mining and in situ production of tar sands disrupt large land areas, as would surface mining of oil shales, and the amounts of water required to process the fuels will also be a constraint in some areas. Thus, there are significant environmental issues associated with the recovery and processing of some of the unconventional hydrocarbon resources.
Although the U.S. oil resource base is large, future domestic production will depend on two factors. One is the decline in production from existing fields. The decline rate varies from field to field, but it is everywhere significant. For example, the EIA assumes that currently producing fields decline at the rate of 20 percent per year. New fields are assumed to peak after 2 to 4 years, stabilize for a period, and then decline at the 20 percent rate (EIA, 2008b). While the National Petro-
|
6 |
For a discussion of emissions associated with various fuel conversions, see Chapter 5. |
|
7 |
Emissions of CO2 result from the use of significant quantities of natural gas to provide process heat for separating the hydrocarbons from the sand and for making the hydrogen needed to upgrade the oils. These emissions could be reduced significantly in the future if nonfossil sources of electricity and process heat, such as nuclear, were used in the recovery and conversion processes. |
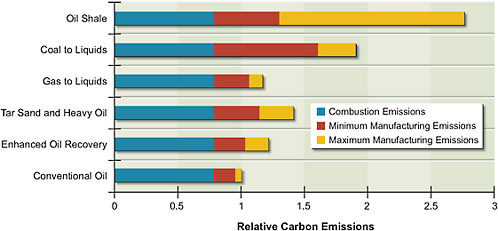
FIGURE 7.1 Estimated relative CO2emissions of alternative sources of hydrocarbon fuels.
Source: Farrell and Brandt, 2006.
leum Council (NPC) does not specify a decline rate, its report also notes the significance of declining production as fields mature (NPC, 2007).
The other factor that determines production is the ability to develop the resources listed in Table 7.6. This, in turn, depends on three key variables:
-
The pace at which technology can access increasingly challenging types of resources. After 2020, the application of new methods will be required to offset the inevitable decline in production from existing large fields in the United States. NPC (2007) cites 11 significant technologies under development that should be available between 2015 and 2020 to meet this need (see Box 7.1). The expansion of CO2 EOR is technically feasible, but it will depend on the availability of significant additional quantities of CO2 (see the discussion on carbon capture from power plants, for example, elsewhere in this chapter) and on whether the infrastructure to deliver that CO2 to the oil fields can be built.
|
BOX 7.1 Continuing Advances in Oil and Gas Exploration and Production Technology Developing U.S. oil and natural gas resources depends critically on technology. The domestic resource base is lodged in geologic formations that make extraction more difficult, and they are often smaller (and therefore harder to find) than the more easily developed fields of the past. Substantial advances in technology have been made in the past few years, however. For example, deepwater offshore oil production has compensated for declines in shallow water offshore and in Alaska production. Natural gas production from unconventional resources now accounts for more than half of total domestic production. And the shift from two-dimensional to three-dimensional seismic technology has increased exploration-drilling success rates by 50 percent over a 10-year period (Bohi, 1998). This trend toward more sophisticated technology must continue if domestic production rates of oil and gas are to be maintained, much less increased. Because essentially all of the technology that will be relevant before 2020 is being developed by the private sector, the AEF Committee has not conducted an independent assessment of the oil exploration and production technology. However, relying on the topic papers prepared for the National Petroleum Council report Facing the Hard Truths About Energy (NPC, 2007), it appears that appropriate development is under way.1 The critical technology need in oil production is the ability to manage fluids in complex underground reservoirs. These fluids involved are both the crude oil itself and materials such as CO2 that are used in enhanced oil recovery. Table 7.5 summarizes the “highly significant” technologies that are currently being developed for conventional oil exploration and production (NPC, 2007, Topic Paper 19). In the view of committee members familiar with oil exploration and production, this summary table (and the more detailed discussion in the topic paper) is a reasonable reflection of the status of development. In general, it appears that these technologies, if developed successfully, will support the pace of resource development shown in Table 7.7. In the case of natural gas, the chief technical challenge is to develop the resources contained in gas shale and other low-porosity formations. The necessary technologies involve the ability to drill horizontal wells and to fracture the shale formation to allow the natural gas to flow to the bore hole. These technologies advanced very significantly in the early years of this decade, which led to substantial increases in natural gas production from shale. |
-
Economic feasibility. The cost of exploiting alternative resources increases as they become more challenging (essentially from the top to the bottom of Table 7.6). Oil prices are set in a world market, even though the world price may be influenced by the actions of major producers, and historically, oil prices have been quite volatile. Such volatility can be a disincentive to the large and long-term investments needed to find and produce oil from technically challenging and increasingly costly resources.
-
Access to resources. The resources listed in Table 7.6 include quantities of oil estimated to occur in the coastal plain of the Arctic National Wildlife Refuge (ANWR-1002 area), which is currently off limits to exploration and production, and parts of the outer continental shelf (OCS), for which policies on access for exploration and production are currently in flux (see “The Access Issue” subsection that follows for additional discussion).
Although predicting the level of domestic production that results from the confluence of these factors could be considered speculative, the EIA has estimated how oil production might be affected by changes in them. Table 7.7 summarizes the agency’s most recent figures for several alternatives.8
Notwithstanding the considerable uncertainties involved in these estimates, it seems clear that the level of net domestic oil production is relatively insensitive to favorable developments in technology, higher world prices, and access to new resources. This is not to say that these factors are unimportant. Rather, it seems appropriate to conclude that because of the decline in currently (and future) producing oil fields, maintaining domestic production at something like current levels is a very challenging assignment. As a result, reducing consumption is likely to be the most important factor in decreasing domestic dependence on oil as an energy source.
|
8 |
Considerable caution should be used in interpreting Table 7.7. For one thing, the cases are not additive. In some instances, they involve arbitrary changes to parameters in the reference case, and assumptions about physical properties are not explicit. The high-oil-price case is not built up from a cumulative supply curve in the EIA estimating procedure and thus should not be thought of as representing actual economics. Other sources offer different projections, but because the EIA reference case appears to lie near the middle of the range it is useful for comparison purposes. See the National Petroleum Council Data Warehouse (available on CD with the NPC report Hard Truths [NPC, 2007]) for a collection of forecasts from a variety of sources. |
TABLE 7.7 Projected U.S. Crude Oil Production in Various Years
|
EIA Alternative Casesa |
Projected Production (million bbl/d) (2007 annual U.S. production: 5.1 million bbl/d, not including natural gas liquids) |
||
|
2010 |
2020 |
2030 |
|
|
Reference case |
5.9 |
6.3 |
5.6 |
|
High oil price |
5.9 |
6.4 |
6.4 |
|
Rapid technology |
6.0 |
6.5 |
6 |
|
ANWR 1002 access |
5.9 |
6.5 |
6.3 |
|
Access to all OCS |
5.9 |
6.4 |
5.8 |
|
aThe “Access to all OCS” case comes from EIA, 2007, while the other cases are from EIA, 2008a. See Appendix E of each document for a description of assumptions. |
|||
For the foreseeable future, U.S. reserves and production are likely to remain a modest fraction of world reserves and production.9 Indeed, none of the changes in Table 7.7 would lift U.S. production above about 8 percent of current world totals.
Although this committee has not attempted to evaluate non-U.S. oil reserves and production, it should be noted that the tension between declining production from existing reserves and investment in new production exists worldwide. The 2008 World Energy Outlook published by the IEA (2008b) reviews the status of the world’s largest existing oil fields and concludes that “field-by-field declines in oil production are accelerating … and barriers to upstream investment could constrain global oil supply.” Referring to its scenario analysis, the report observes that “the projected increase in global oil output hinges on adequate and timely investment. Some 64 million barrels per day of additional gross capacity—the equivalent of almost six times that of Saudi Arabia today—needs to be brought on stream between 2007 and 2030” (IEA, 2008b). These uncertainties are reflected in the range of production estimates from various publicly available sources. According to an NPC review of estimates for 2030, world oil production could range from 90 to 120 million barrels per day, as compared with about 85 million barrels
per day today. The 2008 World Energy Outlook reference scenario projects 2030 oil production at 106 million barrels per day (IEA, 2008b).
In any case, countries that have much larger production potential than the United States does can more easily increase (or decrease) oil production by the amount potentially obtainable from U.S. areas, both restricted and unrestricted. It is for this reason that this country is more likely to be a price taker than a price setter.
Natural Gas
Unlike the situation with oil, the United States currently produces most of the natural gas it consumes (see Table 7.3). Moreover, its imports are almost entirely from Canada, with the result that North American production is able to meet North American demand. If increased U.S. production of natural gas were able to maintain this balance, the United Staes could limit imports of natural gas (in the form of liquefied natural gas, or LNG). If not, natural gas imports would increase and at some point could result in significant economic and security risks, much like those that presently exist in the oil market. As noted in the following discussion, whether the United States can or cannot increase its domestic production of natural gas is not yet clear.
Table 7.8 shows the various types of U.S. natural gas resources. Significant conventional gas resources are located both offshore and onshore, although much of the offshore resource is in deep water. Nonassociated conventional resources are not physically mingled with oil deposits. Unconventional gas resources are of three types. Tight gas sands and gas shales are formations with low porosity and thus require technology to fracture the structures for the gas to flow to producing wells. Coal-bed methane is natural gas trapped in coal deposits.
Natural gas hydrates (not included in Table 7.8) are a potentially large but poorly defined resource. Estimates of the total global resource range from 1 to 100 times the world resource of conventional natural gas (NPC, 2007, Topic Paper 24; Ruppel, 2007). Hydrates are materials in which water molecules form cages that can contain a guest molecule, in this case methane. Forming at temperatures above the freezing point of water and at high pressures, they are found in many ocean sediments around the world and in locations in the Arctic where land temperatures are low. Methods for recovery of hydrates are under investigation. Whether any recovery method can produce at rates large enough to allow commercial production over an extended period and with acceptable environmental
TABLE 7.8 U.S. Natural Gas Resources
|
|
Trillion Cubic Feet (Tcf) (2007 annual U.S. production: 19.3 Tcf) |
|
Proved reserves |
204 |
|
Conventional gas resources |
|
|
Onshore (nonassociated) |
286 |
|
Offshore (nonassociated) |
214 |
|
Associated dissolved gas |
130 |
|
Unconventional gas resources |
|
|
Tight gas sands |
304 |
|
Coalbed methane |
71 |
|
Gas shales |
125 |
|
Source: EIA, 2008b, Table 50. Based on USGS and MMS data with adjustments for recent information. Does not include Alaska or off-limits OCS areas. While the Potential Gas Committee (PGC, 2006) uses somewhat different categories, the PGC aggregate estimate is consistent with the EIA estimate. |
|
consequences has yet to be established (see Annex 7.A for additional discussion). Thus, while the resource is potentially large, it is unlikely to contribute significant production of natural gas by 2035 unless significant progress is made on developing economically feasible and environmentally acceptable recovery processes.
As is the case with oil, natural gas production levels are constrained by the tension between declining production from existing fields and the difficulty of bringing on new production. The EIA estimates that declines in natural gas fields are typically 30 percent per year, somewhat greater than the estimate for oil. And as with oil, the issues of technology, economics, and access determine the ability to bring on new production.
-
Included in the proved reserves and estimates of technically recoverable resources are significant amounts of natural gas from unconventional geological formations (tight gas sands, gas shales, and coal-bed methane). Better than half of current natural gas onshore production comes from these resources, and they will remain the principal source of new production for the foreseeable future (see Figure 7.2).
-
Producing from these formations does require advanced technology, though many of the methods being developed for oil production also are useful for natural gas production. Especially important for natural
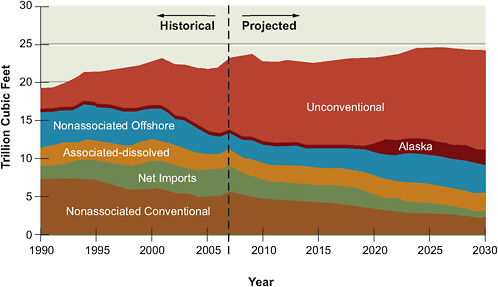
FIGURE 7.2 U.S. Energy Information Administration reference case for U.S. natural gas production, showing the projected increase in the proportion of gas from unconventional sources along with the decline in gas from conventional sources. “Associated” refers to gas produced as a result of oil production.
Source: EIA, 2009b.
-
gas are technologies for well drilling and completion in deep water and technologies for producing natural gas from low-porosity formations such as tight sands and shales.
-
The price of natural gas has been volatile and will likely remain that way. This committee has not been able to develop a supply curve for natural gas production from publicly available data. However, it appears that at the lower end of the recent natural gas price range the production of gas shales and perhaps of some deepwater offshore resources is not economic. At the high end of the range, the private sector seems willing to invest in all of these types of gas resources.
-
Potential natural gas reserves have until recently been off-limits along the Atlantic and Pacific coasts and in the eastern Gulf of Mexico. Their current status is in flux. Because limited data are available for evaluation of these areas, estimates of future production are necessarily uncertain, as with any estimate of undiscovered resources. The subsection titled “The Access Issue” addresses this issue and reports potential future-production estimates that do exist.
TABLE 7.9 Projected U.S. Natural Gas Production (trillion cuibic feet) in Various Years
|
EIA Alternative Casesa |
2010 |
2020 |
2030 |
|
Reference case |
19.8 |
20.2 |
20.0 |
|
High gas price |
19.8 |
20.3 |
20.4 |
|
Rapid technology |
19.8 |
21.0 |
21.3 |
|
Access to all OCS |
19.8 |
21.5 |
21.6 |
|
Note: These estimates are subject to the same cautions as those regarding the earlier estimates for oil. Note also that private-sector estimates reported in the NPC database seem somewhat less optimistic. For example, the maximum estimate for 2020 among international oil companies is 18.9 trillion cubic feet. aThe “Access to all OCS” case comes from EIA (2007), while the other cases are from EIA (2008a). See Appendix E of each document for a description of the case assumptions. |
|||
Although the level of domestic production resulting from the confluence of these factors remains speculative, the EIA has estimated how natural gas production might be affected by changes in them. Table 7.9 summarizes EIA estimates regarding four alternatives.
According to these EIA estimates, maintaining domestic natural gas production, much less raising it above current levels, is challenging. However, resources in the OCS and new gas shale formations may have a significant upside production potential. Technology has recently made feasible the production of natural gas from shale formations in the Rockies, Mid-Continent, and Appalachian regions. Wood Mackenzie data (Snyder, 2008), for example, suggest a possible increase on the order of 3 Tcf per year by 2012, a level that can be maintained for several years. In the early release of the 2009 Annual Energy Outlook, the EIA reference case shows Lower 48 production of 21.6 Tcf in 2030. Thus, the upside potential for the deployment of new technology to exploit shale gas may be higher than the EIA’s 2007 projections in Table 7.9.10
In any case, it is very important that domestic natural gas production keep
|
10 |
Note that Figure 7.2 reflects EIA’s 2009 early release projections (EIA, 2009b). Table 14 of EIA’s updated reference-case forecast for the 2009 Annual Energy Outlook (AEO 2009) (April 2009) projects 23.03 Tcf of U.S. natural gas production in 2030. Shale gas is projected to contribute 3.66 Tcf of the total. This represents a doubling of shale gas production from 2007. Table A1 of the update shows declining natural gas imports between 2007 and 2030, suggesting that domestic supplies are robust over the period. |
pace with domestic demand. Unlike oil, U.S. natural gas prices are not presently determined in a world market. But there is a growing world market in LNG, and if growth in domestic demand for natural gas exceeds growth in supply (even with expanded natural gas production from gas shales, for example), the United States may find itself beholden to that global market. In that case, increases in domestic demand would have to be satisfied, increasingly, by imports. Most of these imports would likely be in the form of LNG, which would require large capital investments in port facilities and regasification infrastructure. Moreover, global movements of LNG would increasingly result in a globally determined price for natural gas. At this writing, the delivered price of LNG in Japan (more than $17.10/GJ, or $18/million Btu),11 roughly at parity with the price of oil based on energy content, and this is more than twice the U.S. price (~$7.60/GJ, or $8/million Btu).12
The Access Issue
Oil and gas exploration and production have been off-limits in some parts of the United States for a variety of policy reasons. Some 12 percent of U.S. petroleum resources and 20 percent of natural gas resources are believed to lie in these restricted areas. In late 2008, the president and Congress removed restrictions on access to previously restricted sections of the U.S. offshore resources, though a 2006 law banning drilling in the eastern Gulf of Mexico remains in effect (www.mms.gov/ooc/press/2008/FactSheet-MMSGOMSecurityActMARCH202008.htm). But how quickly offshore development will proceed, if it proceeds at all, is difficult to determine. For one thing, Congressional or Executive Branch action to reimpose the access ban remains a possibility. For another, individual states can intervene in development programs even without overriding a federal approval of a project—by preventing the oil or gas from coming on shore, for example. And the cost and technical difficulty of developing many of these resources can be significant (Durham, 2006). Thus the offshore access issue may remain an open policy question, at least for a while. Accordingly, this section provides background to help address that question.
TABLE 7.10 Estimated Undiscovered but Technically Recoverable Onshore Oil and Gas Resources on Federal Lands
|
|
Oil (billion bbl) |
Gas (Tcf) |
|
Inaccessiblea |
19 |
94 |
|
Accessible with restrictionsa |
9.3 |
113 |
|
Accessible standard leasea |
2.3 |
24 |
|
Total resourcesa |
30.5 |
231 |
|
Northern Alaska total |
17 |
67 |
|
National Petroleum Reserve-Alaska |
9.3b |
60c |
|
Alaska National Wildlife Refuge (1002 Area) |
7.7c |
7d |
|
aBLM, 2008. bUSGS, 2002. cUSGS, 1998. dEIA, 2004. Source: See www.blm.gov/wo/st/en/prog/energy/oil_and_gas/EPCA_III/EPCA_III_faq.html. |
||
Table 7.10 reports estimates, compiled by the Bureau of Land Management from USGS and MMS sources, of the volumes of technically recoverable oil and gas for federal lands. The amounts shown are for 11 sedimentary basins, including the National Petroleum Reserve-Alaska (NPRA) and the Alaska National Wildlife Refuge 1002 (ANWR-1002) areas. The NPRA and ANWR-1002 estimates shown separately (but included in the 30.5 billion barrel estimate) in Table 7.10 are the largest components of the onshore, undiscovered, and technically recoverable resources. The NPRA estimate (9.3 billion barrels) is part of the estimate of undiscovered oil that is accessible with restrictions, and the ANWR-1002 estimate (7.7 billion barrels) is in the inaccessible category.
Comparison of these numbers with the scale of oil use is instructive: 2007 world oil consumption was about 85 million barrels per day (31 billion barrels per year); U.S. oil consumption was about 20.7 million barrels per day (7.6 billion barrels per year); and U.S. oil production was 6.9 million barrels per day (including natural gas liquids), which amounts to 2.5 billion barrels per year (British Petroleum, 2008). For natural gas, the corresponding 2007 numbers are world natural gas consumption at 104 Tcf, U.S. consumption at 23 Tcf, and U.S. production at 19.3 Tcf (British Petroleum, 2008).
The estimated undiscovered oil resources, which total 30.5 billion barrels, are included in the 76 billion barrels of undiscovered offshore resources listed in Table 7.6. The total gas resources listed, however, are not included in the natural
gas resource estimates of Table 7.8. The resources listed as inaccessible are those that are estimated to lie within areas where exploration and production have been prohibited. These include lands that cannot be leased as a result of congressional or presidential action (including national parks, national monuments, and wilderness areas); lands that are not available for leasing based on decisions by the federal Bureau of Land Management (historical sites and endangered species habitats, for example); lands that are undergoing land-use planning or National Environmental Policy Act review; and areas that can be leased but with no surface occupancy (directional drilling might be able to access some resources, in which case they are included in the category of accessible with restrictions). Restrictions may include limits on drilling during a portion of the year or stipulations that require mitigation plans or exclude some areas within the lease from drilling. Operations in areas for which standard lease terms apply must observe pertinent environmental laws and regulations.
Table 7.11 gives related estimates for offshore resources that are located in areas that have not been open for leasing for exploration and production (NPC, 2007, Topic Paper 7, www.npchardtruthsreport.org/topic_papers.php). The largest undiscovered resources are estimated to be located in the restricted portions of the federal OCS. These estimated gas resources are in addition to those listed in Table 7.8. The estimated oil resources in Table 7.11 are included, however, in the estimates of Table 7.6.
The combined estimates of conventional onshore and offshore oil in areas that are now inaccessible or have been so until very recently comprise 32 percent (19 billion barrels onshore oil [Table 7.10], plus 19.3 billion barrels offshore oil [Table 7.11]) of the total estimated undiscovered conventional technically recov-
TABLE 7.11 Estimated Undiscovered but Technically Recoverable Offshore Oil and Gas in Areas Covered by Moratoriums
|
|
Oil (billion bbl) |
Gas (trillion cubic feet) |
|
Eastern Gulf of Mexico OCS |
3.7 |
22 |
|
Atlantic OCS |
3.8 |
37 |
|
Pacific OCS |
10.4 |
18 |
|
Great Lakes |
0.4 |
5 |
|
State waters |
1.0 |
2 |
|
Total resources |
19.3 |
84 |
|
Source: NPC, 2007, Topic Paper 7, available at www.npchardtruthsreport.org/topic_papers.php. |
||
erable oil shown in Table 7.6 (43 billion barrels onshore, plus 76 billion barrels offshore). As Table 7.6 indicates, however, the relatively high costs of developing some of the resources may limit the rate of development, though these costs are comparable to or lower than some of the costs of making liquid fuels from alternate sources (see Chapter 5). The estimates of undiscovered gas resources in the inaccessible areas (94 Tcf onshore [Table 7.10], plus 84 Tcf offshore [Table 7.11]) are about 28 percent in addition to the total conventional gas resources listed in Table 7.8 (630 Tcf) or about 16 percent in addition to the total of conventional and unconventional gas resources listed in Table 7.8 (1130 Tcf).
There is considerable uncertainty in these estimated volumes, as with any figures that purport to measure undiscovered resources. Geophysical data used to refine such estimates were last collected 25 or more years ago for the Pacific coast, the Atlantic coast, and portions of the eastern Gulf of Mexico. Since then, significant advances have been made in seismic technology, which could allow more accurate estimates of the size and location of potential accumulations. There is similar uncertainty in the rate of production that might be obtained from these areas if exploration and production were permitted. Offshore developments in deep water typically require extended time periods during which to begin production (5–7 years or more) if exploration is successful and more time to ramp up to full-scale production.
But even without considering new producing provinces, the substantial technology development for production in deep waters of the OCS—where leasing and drilling have been under way for some time—is projected to have a significant impact on U.S. oil production in the next decade. For example, in its 2008 reference case, the EIA projects that deepwater Gulf of Mexico conventional oil production will increase from about 1 million barrels per day in 2006 to a peak of 2 million barrels per day sometime between 2013 and 2019, declining thereafter to 1.6 million barrels per day in 2030 (EIA, 2008a, p. 79). (These quantities are similar to those being contemplated for production of liquid fuels from coal or biomass—see Chapter 5.) That increase in production, in turn, leads to a projected increase in total U.S. production from 5.1 million barrels per day in 2007 to a peak of 6.3 million barrels per day in 2018. Thus the increase in deepwater production more than offsets continuing declines in Alaska production and shallow offshore production, but only for a time. If leasing and development proceed in OCS areas that were previously off-limits, the technology improvements that have proved successful in deepwater Gulf of Mexico areas could be applied in those OCS areas as well.
EIA estimates (EIA, 2008a) of production rates from access to ANWR-1002 and the OCS showed increased U.S. production—more than the reference-case production of 6.3 and 5.6 million barrels per day—of about 200,000 and 100,000 barrels per day, respectively, in 2020 and about 700,000 and 200,000 barrels per day in 2030 (see Table 7.7). It is important to recognize that these estimated increments reflect both the increased production in the specified areas and the declines in production elsewhere. Mean production estimates cited in the NPC study (NPC, 2007, Topic Paper 7) for the ANWR-1002 area are 539,000 barrels per day in 2020 and 576,000 barrels per day in 2030. EIA estimates made in 2004 (EIA, 2004) showed somewhat larger estimated production for ANWR-1002, with assumed production starting in 2013 and peaking at 874,000 barrels per day in 2024.
While any additional oil production has some impact on oil price, as well as an obvious impact on the amount of oil imported into the United States, most observers have argued that the impact on oil price of net incremental U.S. production due to the opening of restricted areas will be small. Projected total production increases are modest compared to world demand (about 85 million barrels per day at present); they are projected by the EIA to grow to 96 million barrels per day in 2015 and 113 million barrels per day in 2030 (EIA, 2008d).
Oil prices are set in a global market, and both supply and demand depend on price, though supply responds slowly to high prices and demand usually responds faster. Short-term oil price volatility observed in recent months is a reflection of this dynamic, at least in part. But it is not known whether remote or offshore production will compete on costs with other sources of supply around the world, nor whether such resources will be developed in the first place, given the uncertainty as to future oil prices supporting development. As the EIA noted in its analysis of the impact of ANWR-1002 production, “Assuming that world oil markets continue to work as they do today, the Organization of Petroleum Exporting Countries could countermand any potential price impact of ANWR coastal plain production by reducing its exports by an equal amount” (EIA, 2004). Similar reasoning suggests that the impact of increased OCS production on world oil price in the long term would also be small.
It is possible that natural gas markets, which are becoming more global but still maintain regional differences, will respond differently to the potentially higher production quantities, although the magnitude of any response is uncertain (Baker Institute, 2008). The EIA estimates summarized in Table 7.9 suggest that access to restricted OCS, for example, might provide increased gas produc-
tion of about 1.3 Tcf per year in 2020 and 1.6 Tcf in 2030 (U.S. consumption is about 23 Tcf per year at present), which could offset the need for some LNG imports.
A related discussion is under way concerning the potential environmental risks of developing oil or gas resources in locations such as the ANWR-1002 area, the National Petroleum Reserve, or the formerly restricted OCS. Technology improvements such as long-reach directional drilling have reduced the area required by surface facilities for drilling and production, but some surface impact is inevitable. Similarly, the use of subsea completions for deepwater oil and gas production, pipeline delivery of fluids to shore in place of tankers, and attention to modern MMS environmental regulations governing platforms have reduced the potential for adverse impacts in offshore production. However, there will always remain some risk, whether at the platform or at the land end of the undersea pipeline. In addition, close-in platforms have visual impacts.
In addition to the OCS and federal land resources discussed in this section, the increased interest in natural gas production from shale formations may create a need to balance energy and environmental values regarding this resource. Large shale formations in the mid-Continent and the Gulf Coast (e.g., Barnett and Haynesville) are located in areas where oil and gas are currently produced. Infrastructure exists in these areas, and public opinion is probably open to additional gas production. However, the Marcellus shale in Appalachia is spread over a wide area, where lack of infrastructure and fragmented land ownership make production from this area more challenging (Snyder, 2008).
Coal
Table 7.12 provides estimates of coal resources by coal rank. Anthracite and bituminous coals have the highest energy and carbon content, whereas subbituminous coals and lignites have lower energy content and larger moisture and ash content (NRC, 2007, Box 4.1). The table indicates that the United States has about 20 years of reserves in active mines, but a much larger resource would be available for production if new mines could be opened and if the rail infrastructure required to deliver coal—or, alternatively, if sufficient long-distance transmission lines for delivery of electricity generated at the mine mouth—could be put in place. Costs of coal production vary widely with geographic setting and the type of mining, but it is clear that costs are low enough that substantial quantities of coal can be produced at current coal prices.
TABLE 7.12 U.S. Coal Resources and Reserves
|
Coal (2005 Annual U.S. Production: 1 billion tons)a |
Billion Tons |
|
Recoverable reserves in active minesa |
17.3 |
|
Recoverable reservesa |
227 |
|
Demonstrated reserve basea |
200 |
|
Identified resourcesa |
1200 |
|
Proved Reservesb |
|
|
Anthracite and bituminous |
123 |
|
Subbituminous and lignite |
144 |
|
aNRC, 2007. bBritish Petroleum, 2008. |
|
The National Research Council has recently assessed the status of domestic coal resources (NRC, 2007). It concluded that:
Federal policy makers require accurate and complete estimates of national coal reserves to formulate coherent national energy policies. Despite significant uncertainties in existing reserve estimates, it is clear that there is sufficient coal at current rates of production to meet anticipated needs through 2030. Further into the future, there is probably sufficient coal to meet the nation’s needs for more than 100 years at current rates of consumption. … A combination of increased rates of production with more detailed reserve analyses that take into account location, quality, recoverability, and transportation issues may substantially reduce the number of years of supply. Future policy will continue to be developed in the absence of accurate estimates until more detailed reserve analyses—which take into account the full suite of geographical, geological, economic, legal, and environmental characteristics—are completed.
Even given the uncertainties in resource estimates, the United States likely has sufficient coal to meet projected needs. However, of all the fossil fuels, coal produces the largest amount of CO2 per unit of energy released by combustion—about twice the emissions of natural gas, but can vary depending on coal rank—and mining has significant environmental impacts, which will limit its suitability for some locations. In any case, the estimates in Table 7.12 suggest that resource availability is not likely to be the constraint that sets the level of coal use.
Findings: Oil, Gas, and Coal Resources
Fossil-Fuel Resources and Production
The United States is not running out of oil anytime soon, but domestic oil production rates are unlikely to rise significantly. U.S. technically recoverable con-
ventional oil resources are large relative to the country’s liquid fuel demand. However, U.S. production capacity is limited by declining production in existing fields. Even with new technology, higher prices, and access to currently off-limits resources—none of which is certain—maintaining current production levels will be challenging.
The United States is not running out of natural gas anytime soon, and with favorable circumstances, domestic production could meet most of the domestic natural gas demand for many years. U.S. natural gas resources are large relative to demand, and current domestic production meets most of the domestic demand. Unconventional sources of natural gas are technically recoverable and appear to be large enough to meet domestic demand for several years. Doing so, however, would require both relatively high prices and moderate demand growth.
Unconventional oil from U.S. resources is not likely to result in significant new production volume before 2020. A large oil shale resource exists in some of the western states, but production from these reserves awaits technology demonstration and is highly unlikely before 2020. The U.S. tar sands resource is not large.
Crude oil production from Canadian tar sands is feasible now and likely to grow before 2020, but this resource has a larger carbon footprint than conventional resources have. Canadian tar sands production was 1.3 million barrels per day of crude oil in 2006, and it could grow to 4 million barrels per day by 2030. But with current technology, fuels derived from tar sands ultimately emit 15–40 percent more CO2 than do fuels derived from conventional crude oil (see Farrell and Brandt, 2006).
Coal is abundant in the United States. Despite significant uncertainties in existing reserve sizes, there is sufficient coal at current rates of production to meet anticipated needs through 2030 and well beyond. More detailed analyses will be required, however, to derive accurate estimates of the impact of enhanced production on reserve life. There are also geographical, geological, economic, legal, and environmental constraints on the future use of coal.
Fossil-Fuel Supply and Demand
Changes in U.S. oil production—including from areas currently off-limits to drilling—are not likely to have a leading influence on world oil production.
Because U.S. crude oil reserves and production will remain a modest fraction of world reserves and production, the actions of other countries could have a greater impact. However, because U.S. oil demand is a large fraction of world oil demand, changes in U.S. demand are a significant factor in the market.
Greater domestic natural gas demand could boost U.S. reliance on LNG imports and cause a significant rise in domestic prices, though sustained significant increases in production of natural gas from shales could limit that reliance. If gains in production of natural gas from shales are not sufficient to meet heightened U.S. demand (such as for natural gas for electric power production), LNG could become the marginal supply to meet that demand. Eventually, LNG imports could grow to a point that linked the U.S. natural gas market to world LNG prices, which would be much higher than current U.S. prices.
Although domestic coal reserves are ample to 2030 and beyond, upward price pressures may exist. Growth in demand for electricity from coal-fired power plants, potential use of coal for producing liquid and gaseous fuels, the cost of opening new mines, and growth in export markets are examples of such pressures.
ELECTRIC POWER GENERATION WITH FOSSIL FUELS
Background on Electricity Generation and Carbon Dioxide Emissions
According to the EIA, U.S. electricity production in 2006 was 3727 terawatt-hours, with coal supplying 52 percent and natural gas 16 percent for a combined total of 68 percent, as shown in Table 7.13. The EIA has also made a projection of electricity generation in 2020 using its computer models, assuming a continuation of trends that were evident as of 2008.13 Its reference scenario projects that total electricity generation in 2020 will be up about 16 percent from 2006, with a similar fuel breakdown.14
TABLE 7.13 U.S. Electricity Generation by Fuel Type in 2006
|
Fuel Type 2006 |
Terawatt-Hours (percent) |
|
Coal |
1930 (52) |
|
Petroleum |
55 (01) |
|
Natural gas |
608 (16) |
|
Nuclear power |
787 (21) |
|
Renewable sources |
347 (09) |
|
Conventional hydro |
265 (07) |
|
Other renewable |
82 (02) |
|
Total |
3727 |
|
Source: EIA, 2008a, p. 131. |
|
Table 7.14 shows data gathered by the U.S. Environmental Protection Agency (EPA) on 2006 U.S. greenhouse gas emissions, broken down by fuel type. Total emissions of all such gases were just over 7 gigatonnes of CO2 equivalents, of which CO2 itself accounted for about 85 percent; methane and nitrous oxide accounted for most of the rest. CO2 emissions associated with energy consumption (as distinct from agricultural and other sources) accounted for 80 percent of all U.S. greenhouse gas emissions, of which 59 percent resulted from direct combustion as fuel (dominated by petroleum use in transportation) and 41 percent from fossil-fuel use in electricity generation. CO2 emissions from electricity generation were dominated by coal (83 percent), but overall, the burning of coal for electricity accounted for only 27 percent of all U.S. greenhouse gas emissions in 2006.
Dividing the figures in Table 7.14 by those in Table 7.13, the committee finds that approximately 1.0 tonne of CO2 was emitted per megawatt-hour of electricity produced from coal, and about 0.56 tonne of CO2 was emitted per megawatt-hour of electricity produced from natural gas.
Looking Forward
Investor-owned utilities and independent power producers face difficult choices at present. They must invest in new power-generation assets to meet future demands for electricity and to replace some portion of the existing fleet of power plants as they are retired, but they must also consider what will happen if constraints
TABLE 7.14 U.S. CO2 Emissions by Fuel Type in 2006
|
Source |
Million Tonnes CO2 Equivalent |
|
Total U.S. greenhouse gas emissions |
7054 |
|
Total CO2 emissions |
5983 (~85% of all greenhouse gas emissions) |
|
CO2 emissions from energy |
5638 |
|
combustion |
3310 (59%) |
|
Electricity generation |
2328 (41%) |
|
Combustion CO2 emissions by fuel |
3310 |
|
Coal |
133 (04%) |
|
Natural gas |
816 (25%) |
|
Petroleum |
2361 (71%) |
|
CO2 emissions from electricity generation, by fuel |
2328 |
|
Coal |
1932 (83%) |
|
Natural gas |
340 (15%) |
|
Petroleum |
56 (02%) |
|
Source: EPA, 2008. |
|
are placed on carbon emissions. Financial institutions are wary of lending for coal-fired power plants that do not include provisions for capturing CO2, and some states have recently indicated that they will not approve the construction of coal-fired power plants without CCS. But some public utility commissions, which see their role as protecting consumers from unwarranted price increases, are reluctant to include the cost of such facilities in the rate base, absent a regulatory requirement.
Construction costs have risen rapidly in recent years, thereby increasing the capital cost of any power plant. The U.S. Department of Energy (DOE)-sponsored project FutureGen, which was to have demonstrated a coal gasification plant with carbon capture, was canceled at this writing because of high projected costs in favor of an alternative vision of supporting incremental carbon capture projects at several plants. At present there are no obvious choices as to the best designs for CO2 capture. Meanwhile, although capital costs for natural gas plants are a fraction of those for coal or nuclear plants, the price of natural gas has increased substantially above historic levels and has shown some of the volatility of recent oil prices. Thus, the best choices among options for generating electricity are not at all clear at present.
The answers to the following three questions will determine the future of fossil-fuel power in the United States over the coming decades:
-
Will the United States undertake a large effort to reduce CO2 emissions?
-
Will the technologies of CCS become commercially viable?
-
Will the domestic natural gas price be close to its highest recent value or its lowest recent value?
By 2020, decision makers will probably have sorted out the first question. It is inconceivable that CCS will prosper if there is not a large effort to reduce CO2 emissions, because unless a significant cost is imposed on CO2 emissions at a power plant it will nearly always be less expensive to vent the CO2. The committee assumes here that government will formulate policies to reduce CO2 emissions, thereby spurring already-existing technologies for generating electric power with reduced CO2 emissions. The committee focuses here on pathways that deploy such technologies.
With a significant suite of demonstration plants, the country can also sort out the second question. Not enough is known yet to demand that all new plants be equipped with CCS, but much can be learned in the next decade.
The answer to the third question depends in part on the extent to which the U.S. market for natural gas links to the international market. That, in turn, depends, again in part, on the future role of natural gas in electric power generation. Thus the future mix of uses of natural gas and coal for electric power generation will depend sensitively on a combination of the constraints on carbon emissions, the costs of fuels, and the costs of conversion technologies. In particular, whether coal plays a larger or a smaller role in future electric power generation will depend strongly on whether CCS can be applied at the scale of many large power plants.
To examine these questions, the committee considers below three types of power plants: supercritical pulverized coal (PC), integrated gasification and combined cycle (IGCC) coal, and natural gas combined cycle (NGCC).
The PC/IGCC Competition
For large U.S. power generation projects, utilities and independent power producers are evaluating two ways of producing power from coal: PC and IGCC.15
PC plants use boilers to produce steam, which drives turbines to produce electricity. In its current form, this technology has been in use for over 50 years and continues to be improved. PC technology has progressed from subcritical to supercritical to the latest ultrasupercritical boilers; this is a designation that refers to the temperature and pressure of the steam, with higher values bringing higher efficiencies. As power plant conversion efficiencies increase, the amount of CO2 emitted per unit of electricity generated declines.
Typical subcritical PC plants have thermal efficiencies of 33–37 percent (based on higher heating value of the fuel, 33–37 percent of the energy stored in the fuel is converted to electricity) and operate at temperatures up to 1025°F and typical steam pressures of 2400–2800 psi. Supercritical PC plants can achieve efficiencies of 37–42 percent at temperatures and pressures of 1050°F and 3530 psi, while ultrasupercritical PC plants are capable of 42–45 percent energy conversion at 1110–1140°F and 4650 psi (Katzer, 2008; MIT, 2007).
In the future, with advances in high-temperature materials and operating temperatures of 1400°F and above (Viswanathan et al., 2008), efficiencies could reach as high as 48 percent, though this would require major R&D breakthroughs.16 In addition, operating plants often do not realize their full design efficiency, so a more realistic actual efficiency of a pulverized coal plant is likely closer to 40–44 percent without CCS, and perhaps 30 percent with CCS. Figure 7.3 shows that an ultrasupercritical boiler with an efficiency of 42 percent would reduce CO2 emissions by about 12 percent compared with a standard subcritical boiler. Efficiency improvements of 1–3 percent are also possible through modernization at existing coal plants, but the required capital investment may not be attractive given other priorities. A succinct discussion of these and other variations
|
for gasification without coal. In either case, any CO2 captured and stored leads to a reduction in atmospheric CO2 concentration because the carbon present in the biomass was removed from the atmosphere by photosynthesis. A power plant that uses a mix of coal and biomass can therefore have zero net carbon emissions, or even negative net emissions. See the section “Future Biomass Power” below in this chapter, which addresses biomass-fueled power generation. |
|
16 |
This is a potential efficiency that might be achieved with steam pressures and temperatures of 5000 psi and 1400°F main steam, 1400°F reheat; however, the most robust current “ultrasupercritical” plants operate at pressures of around 4640 psi and temperatures of 1112–1130°F. The U.S. Department of Energy’s National Energy Technology Laboratory, in collaboration with industrial consortia, is conducting research on advanced high-temperature materials (e.g., coatings and nickel-based alloys) for use in ultrasupercritical boilers and turbines (www.netl.doe.gov/technologies/coalpower/advresearch/ultrasupercritical.html). |
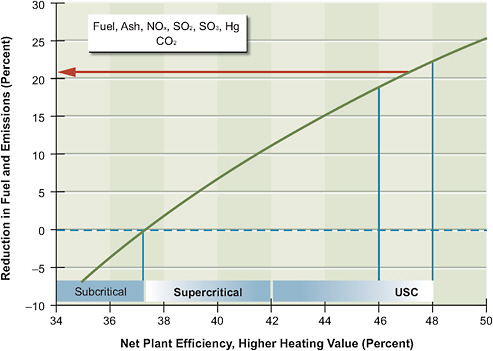
FIGURE 7.3 An ultrasupercritical (USC) boiler with an efficiency of 46–48 percent would reduce CO2emissions by 20 percent compared with a standard subcritical boiler.
Source: John Novak, Electric Power Research Institute, 2008.
on technologies currently in use for electric power generation from coal can be found in MIT (2007).
In principle, CO2 can be captured from any of these PC power plants. Doing so requires use of some of the energy that would otherwise have been used to generate electricity; this fact is reflected in a reduction of the conversion efficiency of the plant. The diverted energy is used to separate CO2 from the solvents used to capture it, to compress the CO2, and for the power needed to move CO2 and solvents through the plant. (See Annex 7.A for a description of some of the processes used to capture CO2 from power plant combustion-product gases.)
The second approach, IGCC, is a technology for electricity generation that produces gas from coal to drive a high-efficiency gas turbine, whose hot exhaust then drives a smaller steam cycle similar to that of PC. The high-efficiency gas turbine process, which evolved from jet engine technology, can use either air or oxygen; the separation of oxygen from air at the front end creates a gas stream
without nitrogen and leads to smaller and lower-cost plant components. Thus, for capture plants, there is no nitrogen to separate from the CO2. Coal is converted in a reducing atmosphere to a gas known as synthesis gas, or syngas, which contains carbon monoxide (CO), CO2, hydrogen (H2), water vapor (H2O), and traces of other components such as H2S arising from the sulfur in coal.
In an IGCC power plant that does not capture CO2, cleaned syngas goes directly to a gas turbine. To add a capture capability at a power plant, the syngas undergoes further chemical processing in a “shift” reactor, which converts most of the carbon into CO2 rather than CO—thereby creating, in effect, a mixture of H2 and CO2. The two gases are then separated, power is obtained from a gas turbine burning the H2 (with a diluent added to reduce the combustion temperature), while the CO2 is pressurized and sent off-site for storage.17
Oxygen gas from an air separation unit can also be used to burn pulverized coal directly, a process that is known as oxyfuel combustion. In that case, the combustion products from electric power generation are CO2 and water, plus small amounts of contaminants. In effect, the cost of air separation at the front end to produce O2 for combustion is traded off against the cost of separation of CO2 from N2 at the back end. Both separations require additional capital and reduce net electricity generation. Removing the N2 from the flow reduces the amount of flue gas, but some recycling of CO2 is required to control combustion temperature. Another option, known as chemical looping, is also being investigated as a way to separate O2 from N2 and thus to avoid a subsequent separation of CO2 from N2 (see Annex 7.A for a description of this approach).
Chemical separations—CO2 from N2, CO2 from H2, or O2 from N2—lie at the heart of all these carbon capture schemes. At present, the separations are thermodynamically rather inefficient, and they represent the largest component of the incremental costs for CCS (Dooley et al., 2006; IPCC, 2005) (see Figure 7.A.6 in Annex 7.A for examples that compare capture costs with those of compression, CO2 transportation, and injection). Because there is significant potential for improving the efficiency of capture and reducing both the costs and the energy penalties associated with capture, this area is an important component of research on CCS. For example, the current DOE program for research to improve separation technologies includes work on improved solvents, materials for mem-
|
17 |
Gasification can also be the first step toward the production of synthetic transportation fuels (synfuels) or synthetic natural gas (SNG). In these cases, the shift reactor is used to tune the H2:CO ratio for optimal synthesis. See Chapter 5. |
brane separations, chemical looping, and use of ionic liquids and ion transport membranes (see Figure 7.A.3 in Annex 7.A). In the committee’s opinion, the cost of CO2 capture and the potential for reductions in cost are large enough that an aggressive R&D program on CO2 capture could significantly affect the economics of deployment of CCS in the 2020–2035 timeframe.18
A variant on all capture schemes is “co-capture,” in which the CO2 sent to storage also contains other polluting gases that would otherwise have to be managed aboveground. Sulfur, for example, can be co-captured as SO2 from PC plants or as H2S from IGCC plants.
In an NGCC, natural gas is combusted in a high-efficiency gas turbine and the hot exhaust gases raise stream that is used to run a steam turbine. The options for CO2 capture at an NGCC plant parallel those for coal plants.
The remainder of this section focuses on PC, IGCC, and NGCC plants to illustrate the range of costs of electricity with and without CCS. The committee chose those comparisons as a way to simplify a multifaceted discussion and because more cost data are available to support the analysis for PC and IGCC plants compared with, say, oxyfuel plants. It notes, however, that some reported estimates of costs of electricity for oxyfuel plants are similar to or even somewhat lower than those for PC plants (MIT, 2007), and hence the oxyfuel option should be considered as well. Demonstrations under way in Europe will provide useful additional information that will allow comparisons among the PC, IGCC, and oxyfuel plants with CCS.
R&D is supporting the continued development both of IGCC and PC technology, with the goal of lowering capital costs and improving efficiency, though how the two technologies will compete in a CO2-constrained world is still uncertain. PC plants may be better suited to capture CO2 from low-rank coals; the technology is supported by a large worldwide infrastructure for the design and construction of new units and the support of operating units. IGCC, on the other hand, promises lower CCS costs and higher efficiencies.
Complications of High-Price Oil and Natural Gas
High prices for oil and natural gas cause upward pressure on U.S. coal prices and production. For example, as gas prices rise, there is more room for higher coal
prices even while maintaining the incremental advantage of coal-fired electricity over gas-fired electricity. The result may be an unchanged fraction of coal-fired power that is dispatched but at increased profits for coal producers. Increasing gas and oil prices also create new markets for coal, such as synthetic liquid fuels and synthetic natural gas, thereby potentially increasing demand for coal (see, for example, the discussion of alternative liquid transportation fuels in Chapter 5). In a carbon-constrained world, continued or expanded use of coal, whether for electric power generation or for manufacturing of liquid fuels, will require that large-scale CCS be a commercially viable approach to limiting CO2 emissions.
In addition, total electric power generation could increase if electricity displaces oil in transportation. Plug-in hybrid or battery-electric vehicles are likely to be charged at night, when power is available at lower prices. At present, coal and nuclear power plants typically provide a larger fraction of the power generated at night, when peaking natural gas turbines are less likely to be in use. Nuclear plants are generally run at steady power output, while coal plants allow some downward adjustment of power levels at night. In areas of the country where coal is used to supply a large fraction of nighttime power and additional coal-fired capacity is available at lower cost than for other fuels, a shift to electric power for transportation could increase the fraction of electric power supplied by coal.
Fuel price volatility is also a major concern; it complicates investment decisions. Consider the fact that over the course of this study, U.S. natural gas prices rose above $13/million Btu and fell to below $4/million Btu. Such price swings have a dramatic effect on the competitiveness of natural-gas-fired power. For example, the committee calculated that at a price of $6/million Btu, NGCC plants had the lowest levelized cost of electricity (LCOE) of any baseload generating option; at $16/million Btu, however, they would have the highest.
Carbon Capture at Coal Plants in Operation Today
The current capacity of U.S. coal-fired electric power generation exceeds 300 GW, and there is a strong financial case for operating most of these PC units for the next 25 years or longer. The CO2 emission rate for these plants is about 2 Gt CO2 per year, which is about one-third of current U.S. CO2 emissions and 7 percent of world emissions. If significant reductions in CO2 emissions from the U.S. power sector are to be achieved on this timescale, consideration must be given to options for reducing emissions from existing subcritical PC plants. These options include: (1) making improvements to generating efficiency, thus reducing CO2 emissions
per unit electricity supplied; (2) retrofitting existing units with CCS capability; and (3) retiring subcritical units and replacing them with more efficient supercritical, oxyfuel, or IGCC units equipped with CCS. For the second and third options, of course, there must be suitable CO2 storage sites within reasonable distances from the plants (on the order of 100 kilometers).
An analysis of these and other options can be found in MIT (2007, Appendix 3.E). Option 1 above is the least expensive, but the efficiency improvements are likely limited to just a few percentage points. Option 2 is a complex undertaking that involves much more than a simple in-line insertion of carbon-capture capability into the flue-gas stream. For example, the retrofit of an existing subcritical unit with amine capture can result in a derating (operation at below the rated maximum) of more than 40 percent (MIT, 2007). The steam required to regenerate the amine absorber severely unbalances the rest of the plant, causing the original steam turbine to operate far from its highest efficiency.
Option 3 involves either rebuilding the subcritical unit’s core—replacing it with a more efficient supercritical, ultrasupercritical, or oxyfuel unit with CCS—or building an IGCC plant with CCS at the site. Although the total capital cost is higher for this latter option, the cost per kilowatt of generated electricity is expected to be about the same as a retrofit. Moreover, the power output can be maintained because the derating associated with CCS can be compensated for by the increased efficiency of the newer-generation technology. Rebuilds with new high-efficiency technology thus appear to be more attractive than retrofits are (MIT, 2007).
The introduction of CO2 capture at existing PC units raises the same technology issues faced by new PC units, but the former has unique problems related to site constraints and steam management. A PC retrofit to scrub CO2 from the flue gas by solvent absorption and desorption requires considerable space. Also, a significant quantity of energy must be used to remove the CO2 from the solvent, which reduces the energy flow to the steam turbine. Hence, high levels of CO2 capture affect turbine performance, requiring a rebalancing of the steam flow and possibly a new turbine. As for retrofit of any of the few currently operating IGCC units for CO2 capture, this would require not only additional space for shift reactors but also the modification of the existing syngas-fueled turbine so it could burn hydrogen. A discussion of the complexities of how CCS might be implemented in the context of the existing fleet of coal power plants is beyond the scope of this report, but it is nevertheless a subject that merits further study.
Partial Capture of CO2
The new fossil-fuel power plants just discussed would be designed to capture approximately 90 percent of the CO2—in other words, to assure that 90 percent of the carbon atoms in the coal or natural gas fuel do not end up in the atmosphere. In the case of coal gasification, a small percentage of the captured carbon may end up in solid form, as char, but most of the captured carbon leaves the plant in pipes en route to disposal belowground. In carbon accounting, one may or may not include CO2 emissions associated with “upstream” activity, such as the burning of fossil fuel associated with the energy to mine and transport coal. And one may or may not include emissions of “other greenhouse gases,” notably unburned methane releases associated with coal mining.
Future fossil-fuel power plants may operate in policy environments either where a specific CO2 capture percentage is specified or where a particular price is placed on each ton of CO2 emitted. In the latter case, one can expect that the fraction of CO2 captured will become a design variable. In determining this fraction, anticipated prices over the lifetime of the plant will be considered, as will the incremental investments and power-efficiency penalties associated with each extra percent of capture.
One can expect the shape of the marginal cost curve for CO2 capture versus percent captured to rise sharply for capture percentages very close to 100 percent, as with any other pollution-control technology. At intermediate capture fractions, given the fixed costs in the capture and storage system (those incurred in permitting or CO2 pipeline construction, for example), and given the economies of scale in capture components, the marginal cost curve may be relatively flat and descending. For some capture technologies, there are steps in such a curve that represent additional capital investments—e.g., the addition of a second shift reactor for precombustion capture. These are only general observations, however. Engineering analyses that accurately establish the shape of this marginal cost curve for specific capture technologies are now entering the public domain.19
CO2 emissions reductions at existing power plants via improved energy efficiency may be realized through a wide variety of upgrades of equipment, especially if the plant is relatively old and inefficient to begin with. The cost curve for small emission reductions will show steps corresponding to opportunities
to replace core components. As for CO2 emissions reductions by means of CCS installed at existing coal plants, the degree of reduction achieved will depend highly on plant characteristics. Important variables are location of the plant relative to CO2 storage sites, room at the plant site for additional equipment, and the age of the plant. In some instances, capture fractions far below 90 percent may well allow commercially viable CCS—if they allow boilers and steam turbines in existing PC units, and gas turbines in existing IGCC units, to continue to be used—whereas high capture fractions may require a total overhaul of the plant.
Major investments have been made in many of these existing plants to reduce pollution emissions (such as SOx, NOx, and Hg). Thus far, these investments have not been linked to strategies for dealing with CO2 emissions.
Capture-Ready
The uncertainty about the scope and stringency of future U.S. policies aimed at reducing carbon emissions, as well as the high cost of retrofits, has led to a discussion of whether it makes sense for new coal plants in the interim to be built “capture-ready,” in other words, capable of being economically retrofitted with CCS in the future. One recent analysis (MIT, 2007) suggests that this concept has a great deal of ambiguity and that design decisions—on equipment sizing, for example—made in anticipation of such policies are unlikely to be economically justified. However, the analysts suggest three guidelines for minimizing the costs associated with potential future constraints on CO2 emissions:
-
Building new plants with the most efficient technology that is economically viable
-
Leaving space for future capture equipment, if possible
-
Choosing plant sites while taking into account their proximity to carbon-storage repositories.
Cost Comparison of PC, IGCC, and NGCC Plants
Figures 7.4, 7.5, and 7.6 show estimated costs for new plants using several of the power generation options. These figures are based on an adaptation by researchers at the Princeton Environmental Institute (PEI)20 of the analyses of power plants
|
20 |
The PEI figures cited here correspond to a workbook that is available for download at cmi.princeton.edu/NRC_AEF_workbook. |
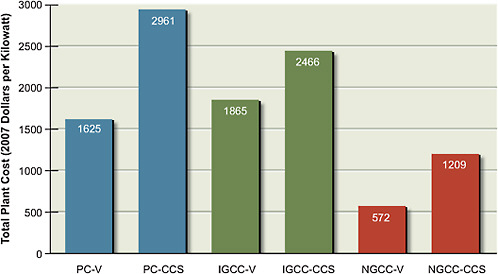
FIGURE 7.4 Total estimated plant cost in 2007 dollars for three types of power plants—PC, IGCC, and NGCC—with and without CCS. These estimates, like those for other technologies, do not necessarily include all of the site-specific costs of building a plant nor all of the real-world contingencies that may be needed depending on economic conditions (see Box 7.2 for more discussion).
Note: V refers to CO2vented.
Source: Princeton Environmental Institute.
done in the U.S. Department of Energy’s National Energy Technology Laboratory (NETL) (NETL, 2007a).21 The analysis describes the cost of building an “Nth plant,” constructed after the large uncertainties in performance of plant components and systems have been resolved through experience. The cost of the Nth
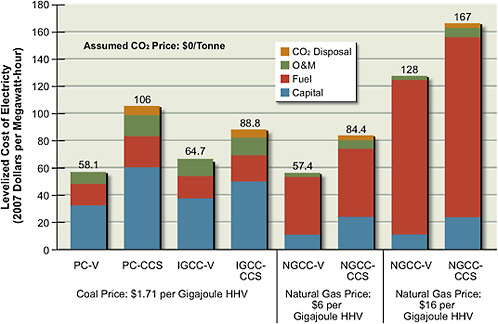
FIGURE 7.5 Levelized cost of electricity (LCOE) estimated for various types of coal-fired and natural-gas-fired power plants at zero carbon price. These estimates, like those for other technologies, do not necessarily include all of the site-specific costs of building a plant nor all of the real-world contingencies that may be needed depending on economic conditions (see Box 7.2 for more discussion). The price of coal is fixed at $1.71/GJ, or $1.80/million Btu HHV (approximately equivalent to $50/tonne, depending on the energy content of the coal), but results for two natural gas prices are also shown ($6/GJ or $6.33/million Btu HHV, and $16/GJ, or $16.88/million Btu HHV) to illustrate how strongly the competitiveness of natural gas plants depends on fuel price. The cost shown for CO2disposal is estimated to be $6.30 per tonne CO2for PC-CCS and $6.80 per tonne CO2for IGCC-CCS and about $9 per tonne CO2for natural gas. See Annex 7.A for a discussion of variability and uncertainties in the cost of CO2disposal.
Source: Princeton Environmental Institute.
plant is considerably less than the cost of any first-of-a-kind plant that could be built today. Typical values of N are between 5 and 10.22
|
22 |
The estimation assumptions used here (exclusion of some contingencies that may be needed for first rather than Nth plants, contingencies that may be needed under some cost environments; various owner’s costs; no additional escalation beyond 2007 dollars; and so on) may result in plant cost estimates in Figure 7.4 that are lower than other quoted cost estimates by 20 to 50 percent or more (see Box 7.2 for a more detailed discussion of possible reasons for differences |
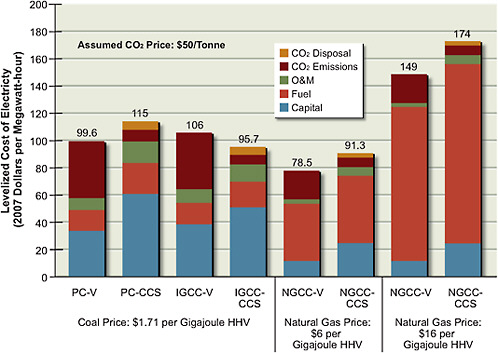
FIGURE 7.6 The effect of a $50/tonne price of CO2on the LCOE of power plants. IGCC-CCS becomes the cheapest coal option, while the competitiveness of NGCC remains sensitive to fuel price. These estimates, like those for other technologies, do not necessarily include all of the site-specific costs of building a plant nor all of the real-world contingencies that may be needed depending on economic conditions (see Box 7.2 for more discussion).
Source: Princeton Environmental Institute.
Although non-CO2-capture PC and NGCC cases represent well-developed commercial technologies that have already reached the Nth plant level, the
|
among reported cost estimates). Midpoint LCOE estimates in Figure 7.5 may be low by comparison to costs based on the higher overall plant costs by 10 to 30 percent. (The percentages are different for the LCOE numbers, because (1) capital costs contribute only 80 percent or less to LCOE, and (2) a net 10 percent increase has already been added to LCOE as a result of the asymmetric range assigned to the uncertainty in the Nth plant and other assumptions.) It should be borne in mind when comparing the plant costs in Figure 7.4 to publicly quoted cost estimates for specific plants that the AEF figures do not assume any escalation above inflation during planning and construction. Other estimates often do so. |
non-CO2-capture IGCC plant costs are less mature. The post-combustion CO2 removal technology of the PC and NGCC capture cases is immature as well. Capital and other cost estimates for these removal technologies have significant uncertainties associated with them and must be considered illustrative calculations rather than forecasts of commercial Nth-plant costs. The precombustion CO2-removal technology for the IGCC capture case has a stronger commercial base.
Figure 7.4 shows capital costs ($/kW) for three pairs of plants: supercritical PC, IGCC, and NGCC, each with and without CCS.23 It is important to note that the capital cost figures presented here correspond to a specific set of assumptions used to obtain consistent comparisons across various technologies discussed in this report; the figures do not reflect all of the actual costs incurred in building a power plant today. Box 7.2, following, discusses many of the cost categories involved in estimating capital costs, including some that are not considered here.
Plant capacity in the reported estimates is taken to be 500–600 MW, all plants are assumed to have an 85 percent capacity factor, and the assumed percentage of capture is about 90 (see Annex 7.A for more discussion of the assumptions that underlie these estimates and those presented in Figures 7.4 and 7.5). Considering first only those plants without CCS, the capital cost of the NGCC plant ($572/kW) is estimated to be about a third of the capital costs of the coal plants. The IGCC plant is estimated to be about 15 percent, or $240/kW, more expensive than the supercritical PC plant. In this comparison, a single coal type is assumed—Illinois #6 bituminous coal. A relative increase in capital costs for the IGCC plant using lower-rank coals can be anticipated, thereby increasing the competitiveness of the PC. Overall, the uncertainty in cost estimates makes a 15 percent difference relatively insignificant.
The estimated incremental capital cost for CO2 capture is about the same for natural gas and IGCC plants ($600/kW) and less than half of the corresponding incremental cost for the PC plant.
Figure 7.5 shows the estimated levelized cost of electricity (LCOE, 2007$/MWh) for the same three pairs as Figure 7.4, but for two assumed prices of natural gas. The LCOE takes into account the costs of capital, operation and
|
BOX 7.2 Comparison of Power Plant Capital Costs The final cost of a plant or other facility consists of several components. Costs that depend strongly on the specific site are typically not included in the estimates. Most of the others are related to the process or facility to be constructed on the site and thus are included. A primary objective of the cost estimates developed by Princeton Environmental Institute (PEI) researchers and presented in this chapter, and in the chapter on alternative transportation fuels (Chapter 5), is to develop, with consistent assumptions, a set of cost estimates that can be compared for a range of different technologies for the conversion of coal and biomass to electric power and to liquid transportation fuels. The first step is to estimate the total plant cost (TPC) for the Nth plant for each of the processes (technologies) under consideration. TPC, also referred to as the overnight cost, is the cost to construct the plant if it were put up “overnight.” The TPC estimates are based on 2006 equipment quotes for all of the major pieces of equipment in the plant, as reported in NETL (2007a). These costs are first escalated to mid-2007 using the Chemical Engineering Plant Construction Cost Index. These basecost estimates include cost of installation, materials, labor, some process and project contingencies, and balance of plant (BOP) costs. Where not included in the component equipment quotes, these costs are estimated from historical experience in the power industry. If not already included in the component quote numbers, a typical engineering contingency—ranging from 5 percent to 20 percent, depending on the component—was added. Summing these cost numbers provides a consistent set of TPC estimates. PEI researchers calculated a levelized capital charge rate (LCCR) on installed capital using EPRI-TAG methodology (EPRI-TAG, 1993) assuming an owner’s cost of 10 percent of TPC, a 55 percent:45 percent debt:equity split, real costs of debt and equity capital of 4.4 and 10.2 percent per year, and a 3-year (i.e., Nth plant) construction period. LCCR was 14.38 percent per year of the total plant investment (TPI), where TPI is the sum of TPC and the allowance for funds used during construction (AFDC), 7.16 percent of TPC. As a result, the cost of installed capital is 15.41 percent of TPC per year. A number of cost components that could be significant under various economic environments and for early or first-of-a-kind (as opposed to “Nth”) power plants are not included in the capital costs estimates, although some may be accounted for in computing levelized costs per kWh. These components may include the following:
|
In addition to these project costs that may be appropriate in various cost environments, there are different accounting protocols for stating capital costs that may lead to apparent differences in plant cost estimates.
A quote to a utility may have any of these estimated costs included in capital cost estimates, and they may not be separable in a simple form. Two examples illustrate the various estimated costs. Example 1. Suppose a commercial quote for a PC-vent plant reports a TPC of $1630/kW.
|
As a result, the total project bid to the utility could be $1956 + $489 + $196 + $293 = $2930/kW, almost 80 percent higher than the TPC for the same plant. This estimate of the bid to the utility is roughly consistent with recent quotes for PC plants with vented CO2:
Example 2.1 As discussed herein, it is important to note that TPC is invariably significantly lower than TCE, the total cash expended (in mixed-year dollars) at commissioning, which is the quantity commonly reported in the press. This is particularly true in periods of rapidly escalating costs. For example, NETL researchers have demonstrated that NETL’s TPC of $1812/kW for a 640 MW GE radiant-quench coal IGCC with CO2 venting (case IGCC-V here) is entirely consistent with the TCE of $3150/kW for the almost identical IGCC approved by the Indiana Utility Regulatory Commission on November 20, 2007, for Duke Energy’s proposed Edwardsport facility. Starting with the base plant TPC of $1812/kW and simply adding equipment specific to Edwardsport (a selective catalytic reduction unit, an extra rail spur, and a transmission line, which raise the owner’s cost from 10 to 15 percent of TPC); changing from merit shop to Midwest union labor rates (increasing labor costs by 40 percent); assuming a 4 percent annual escalation rate (specified in the project’s front-end engineering and design study) but no additional capital cost escalation; and using a weighted nominal interest rate for calculating AFDC (before-tax weighted cost of capital, adding 3 percent per year on equity return as an owner’s risk premium—essentially the same interest rate assumed by PEI) of 11.5 percent per year, with unequal annual spending over the 4-year construction period (10 percent, 40 percent, 30 percent, 20 percent)—the calculated project TCE is $3200/kW. |
maintenance, fuel, and CO2 disposal.24 Estimated CO2 disposal costs are $6–7 per tonne CO2 for the PC-CCS and the IGCC-CCS but about $9 per tonne CO2 for NGCC-CCS, reflecting the smaller CO2 output. In Figure 7.5, CO2 emissions are cost free, but for the CCS plants, the carbon-capture technology is installed anyway. Given the uncertainties in the various estimates, small differences in LCOE should not be considered significant.
Concentrating first on the coal plants, the PC without CCS is about $7/MWh cheaper than the IGCC without CCS. By contrast, the PC with CCS is about $17/MWh more expensive than the IGCC with CCS. The order of LCOE for the four kinds of coal plants (from least to most expensive) in Figure 7.5 is also found in many other studies: PC without CCS, IGCC without CCS, IGCC with CCS, and PC with CCS. Under the committee’s assumptions, when there is a high CO2 price, IGCC with CCS has the lowest cost, but when there is a zero CO2 price, as in Figure 7.5, PC without CCS has the lowest cost. Because all of these technologies use coal, albeit with different efficiencies, differences in their power costs are relatively insensitive to the cost of coal—here $1.71/GJ, or 1.80/million Btu—but they may be affected by the type of coal.
Where NGCC fits into these comparisons is a sensitive function of the price of natural gas. In Figure 7.4, the lower of the committee’s two assumed prices is $6.00/GJ, or $6.33/million Btu. At this price—the one used in the NETL (2007a) study—the values of LCOE for the NGCC and PC plants are about the same as for non-CCS plants, whereas for CCS plants, the LCOE of the NGCC and IGCC plants are about the same. However, for natural gas at $16.00/GJ, or $16.88/million Btu,25 the LCOE for every NGCC plant is much higher than that of any coal plant.
In Figure 7.5, the estimated increase in LCOE for CO2 capture and storage
(at the lower natural gas price) is $24/MWh for IGCC and $27/MWh for NGCC, but the increase is $48/MWh for the PC. However, because half as much CO2 is produced per kilowatt-hour from a natural gas plant as from a coal plant, the incremental cost per tonne of CO2captured and stored is similar for the NGCC (at the lower gas price) and for the PC plant. A rising CO2 price would therefore stimulate the introduction of CCS first at IGCC plants.
Figure 7.6 shows how a CO2 price of $50 per tonne affects the estimated LCOE of the various power plants. A new segment (CO2 emissions) is added to the bars in Figure 7.5 for this contribution to the cost, and relative costs are affected. IGCC with CCS is now the lowest-cost coal option. In other words, in this example a $50 per tonne CO2 price is high enough to make a new IGCC plant with CCS more attractive than a new plant (either PC or IGCC) that vents its CO2. The higher CO2 price improves the competitiveness of NGCC relative to coal-fired plants, but the position of NGCC remains sensitive to fuel price. At $6.00/GJ, or $6.33/million Btu, for natural gas, a new NGCC plant with or without CCS is cheaper than any coal option is, but at $16/GJ, or $16.88/million Btu, for natural gas, NGCC becomes the most expensive option.
The costs presented in Figure 7.6 are in 2007 dollars and do not include further escalation.26 The LCOEs for coal-based plants (PC and IGCC) are more sensitive to changes in construction costs than are NGCC plants; for example, a 10 percent change would alter PC/IGCC LCOE by 7–8 percent, but NGCC LCOE by only 2–3 percent. (The reverse is true for fuel prices, which are discussed elsewhere.) Although opinions differ about future trends of construction costs, these sharp differences in sensitivity seriously affect investment decisions.
A full model of competition among coal, natural gas, and other alternatives would need to allow for changes in the capital, operating, and fuel costs relative to those assumed in Figures 7.5 and 7.6. In particular, the capital and operating costs for the Nth plant with CCS shown in these figures would likely be higher than for the 10 × Nth plant (the 100th plant, if N is 10), to the extent that these costs fall as a result of experience and R&D.
Given the fact that there is no obvious choice of the best technology at this point, a portfolio of demonstrations will be required to investigate cost and performance variations as functions of coal types, separation technologies,
|
26 |
Beyond 2007 (e.g., during construction), it is assumed that capital costs increase at a rate equal to that of economy-wide inflation. Thus, neither TPC nor TPI (see Box 7.2)—expressed in 2007 dollars—depend on the plant commissioning date. |
approaches to combustion, and geologic storage settings (see the section titled “Geologic Storage of CO2” below in this chapter). The cost range of these demonstrations will be significant, but it should be considered an investment in defining more accurately the alternative pathways for reducing CO2 emissions from electric power generation with coal and natural gas.
Sensitivity of LCOE to Capital Cost and Coal Price
The sensitivity of LCOE to estimated capital cost is illustrated in Table 7.15 for carbon costs of $0, $50, and $100 per tonne of CO2. The table compares the impacts on LCOE from three different scenarios: capital costs equal to, 20 percent below, and 30 percent above the estimates used to construct Figures 7.4–7.6. Because the fraction of LCOE attributable to capital cost varies with the fuel and plant types, the percentage change in LCOE also varies. Table 7.15 shows that the cost of electricity is more sensitive to capital cost variations in coal plants than in natural gas plants, for which fuel cost accounts for a greater fraction of LCOE. It should also be noted that the critical threshold on cost of CO2 emissions, above which it is less expensive to install CCS than to emit the CO2 and pay the associated cost, shifts as the capital cost changes (see Annex 7.A for additional discussion). Until more experience is gained in construction and operation of the various plant types with CCS, however, significant uncertainties in costs are likely to remain.
Table 7.16 shows the sensitivity of LCOE to doubling the price of coal, analogous to Table 7.15. LCOE is considerably less sensitive to coal price than to capital costs; the effect of doubling the price of coal on LCOE is comparable to that of increasing the capital cost by 30 percent.
The Competitiveness of Natural Gas
When capital costs rise and are uncertain, utilities historically choose to build natural gas plants (NGCC), which can be erected quickly (3–4 years versus the more typical 4–8 years for coal-fired power plants)27 and require a much smaller commitment of capital. However, the competitiveness of natural gas power is vulnerable to a rising gas price, which can make this power too expensive to dispatch. Significant expansion of the use of natural gas for electric power generation in the
TABLE 7.15 Effect of Changes in Plant Capital Cost on LCOE
United States may imply larger international trade in natural gas and the need for additional facilities for handling LNG in the quantities required.
Natural gas plants will be affected by a price on CO2 emissions, even though only about half as much CO2 is produced per kilowatt-hour when the power is produced from natural gas instead of coal. The options for CO2 capture at an NGCC plant parallel those for coal plants. CO2 is available for capture in the stack after burning the natural gas in air, although at a much more dilute concentration (at today’s power plants, typically 3–5 percent instead of 12–15 percent). Alternatively, CO2 can be captured prior to combustion after processing the natural gas with steam to produce CO2 and H2.
TABLE 7.16 Effect on LCOE of Doubling the Price of Coal at Various Types of Coal Plants
|
|
$1.80 per Million Btu Coal Price (~$45/tonne) |
$3.60 per Million Btu Coal Price (~$90/tonne) |
||||
|
LCOE in $/MWh |
LCOE in $/MWh (% change) |
|||||
|
CO2 Cost (2007 $/tonne) |
0 |
50 |
100 |
0 |
50 |
100 |
|
Plant Type |
|
|
|
|
|
|
|
PC-V |
58 |
100 |
141 |
74 (+27) |
115 (+16) |
157 (+11) |
|
PC-CCS |
106 |
115 |
123 |
129 (+21) |
137 (+20) |
146 (+18) |
|
IGCC-V |
65 |
106 |
148 |
81 (+25) |
122 (+15) |
164 (+11) |
|
IGCC-CCS |
89 |
96 |
103 |
108 (+21) |
115 (+20) |
122 (+18) |
Future Coal Power
The levelized costs of electricity (2007$/MWh) for coal power plants, as shown in Figures 7.5 and 7.6, provide a starting point for estimating the contribution of fossil-fuel power plants to future U.S. electric power generation. Also needed are assumptions about retirement rates of existing plants and maximum possible build rates of new plants. The discussion that follows is based on the assumptions that advanced coal technologies with CCS technologies are developed successfully and deployed at a rate that the committee judges to be “aggressive but achievable”—that is, in line with maximum historical deployment rates. Note, however, that these assumptions are made in order to identify some key issues; they should not be taken as predictions of future technology deployment.
The rate of retirement of the 300 GW of existing U.S. coal plants, today emitting 2 billion tonnes of CO2 per year, is a key variable. Only 4 GW of these 300 are expected to be retired by 2030, according to a reference scenario of the EIA. This scenario assumes both that the United States has not adopted any carbon policy and, effectively, that the price of CO2 emissions is zero (EIA, 2008a). Little work has been done on how the retirement of coal plants will depend on the price of future CO2 emissions. But at some price level for any given plant, it becomes economical to modify the plant to capture CO2, to close the plant, or in some cases, to operate it only during periods of very high demand. As discussed above, the first alternative comes in two versions: retrofit (modest modification,
retaining much of the original steam-cycle equipment) and repowering (replacing the existing power plant with either a new PC or an IGCC, retaining only site amenities such as coal yards, rail lines, and power lines).
A separate matter is the rate at which new coal-fired power plants that capture CO2 can come on line, along with the associated rates at which CO2 pipelines and storage facilities can be brought into operation. The retirement rate, after all, could exceed or be less than the rate of commissioning of new coal power with CCS. An economic model of U.S. power developed by the Electric Power Research Institute (EPRI, 2007) shows a response to U.S. CO2 policy in which the existing coal fleet is retired between 2010 and 2040, while new coal power generation with CCS is brought on line at a nearly comparable rate. Between 2020 and 2040, about 15 GW per year of baseload coal power with CCS is introduced. This is about one-third faster than the rate at which baseload coal power was introduced in the United States in the 1970s, a peak period of construction of U.S. coal power.28
The committee’s view of the maximum pace of introduction of new power plants with CCS, assuming a strong policy driver, is presented here. No distinction is made between PC and IGCC, as their projected cost differences are small compared to the uncertainties. The assumption is that the cost of natural gas is comparable to its higher value in Figures 7.4 and 7.5 ($16/GJ, or $16.88/million Btu), so that natural gas is not a competitor. The committee found that:
-
A demonstration period lasting until 2020 will be required to instill confidence in various capture and storage technologies and to develop state and federal policy governing CO2 storage belowground. Such a learning process could be postponed to a future decade, but postponement would not significantly reduce its cost—the required learning requires full-scale demonstration plants. By 2020, about 10 GW of coal power with CCS would be operating, much of it still in the form of demonstration plants. In that year, operating at 75 percent capacity factor these plants would be producing about 60 TWh of electricity and,
-
at a 90 percent capture rate, about 50 million tonnes CO2 would be stored belowground.29
-
During the period between 2020 and 2025, about 5 GW of new capacity could be commissioned per year. At 85 percent capacity factor, the additional 25 GW operating in 2025 would be producing 190 TWh per year and sending 150 million tonnes CO2 per year belowground.
-
During the years from 2025 to 2035, bracketing the maximum installation rate between 10 and 20 GW of new capacity brought on line per year seems aggressive but achievable. (A typical coal plant with CCS will have a capacity of about 500 MW, so the bracket corresponds to 20–40 new plants per year.) In 2035, the amount of coal power with CCS would reach either 135 GW or nearly twice that value—235 GW. Assuming an 85 percent capacity factor for all of these plants, output power in 2035 would be between 1000 and 1750 TWh; the higher value is nearly as large as the total electric power from coal in the United States today. Also for the higher value, about 1.5 billion tonnes of CO2 per year would be captured and stored in 2035. This rate of construction of new coal-CCS plants might continue from 2035 to 2050.
-
In parallel with the construction of new coal-CCS plants, there will be coal plant retirements and there may also be retrofit and repowering of older coal plants. New coal plants with CCS and retrofit or repowering for CCS will compete for the same specialized labor, equipment, and belowground storage space. The committee’s view of the upper limit of the retrofit plus repowering rate for coal plants is 10 GW per year from 2020 to 2035, so that by 2035, approximately half of today’s coal plants (150 GW out of 300 GW) could be retrofitted or repowered with CCS. However, the committee believes that the maximum combined rate of construction of new and retrofitted/repowered plants would still be 20 GW per year.
At what CO2 price will it be economical to replace an existing coal plant by repowering, for instance, replacing an old coal plant with an IGCC plant with CCS? Some perspective on this question can be gained from Figure 7.6. At $50 per tonne CO2, the cost of power from a new IGCC with CCS is slightly
less than the cost of power from a new PC plant without CCS: $96/MWh versus $100/MWh. The cost of power from an old PC plant is likely to be less than from a new PC plant, primarily because capital costs have risen and because most of the capital costs of an old plant will have been written off. (Some cost of capital for the old plant will remain, however, if there have been recent retrofits—for example, to address conventional air emissions). In addition, depending on the degree to which CCS and IGCC technology have proven reliable and on what fraction of the design and development costs have been written off or amortized by the vendors, early users will pay an additional premium.
Acting in the opposite direction, making old-plant power more expensive, is the plant-efficiency comparison: the old coal plant will almost surely be less efficient. But assuming that capital issues dominate fuel issues, the break-even CO2 price for the replacement of an old PC plant with a new IGCC-CCS plant is likely to be greater than $50 per tonne CO2. But in some cases, CCS retrofit strategies well short of complete plant replacement may be more competitive than either keeping the old PC plant running without CCS investment or repowering it entirely. Complicating the economics of some of these decisions may be the triggering of provisions of the Clean Air Act (New Source Performance Standards), which require the addition of pollutant controls on non-CO2 pollutants once a significant upgrade of a grandfathered facility takes place.
The main message here is that if CCS is commercialized by 2020, its role in the U.S. power mix could be expanded over the succeeding two or three decades, with the installed capacity of coal plants with CCS becoming comparable to that of current U.S. coal power, if not considerably larger. CO2 storage capacity is probably adequate (see below the section titled “Geologic Storage of CO2”) for such a large deployment. As a result, the U.S. coal mining and electric power industries could remain at their current sizes or even grow throughout the next half century.
It must be noted that the prior estimates are upper limits. Coal demand associated with dedicated power plants with CCS would not reach these values if end-use efficiency were incorporated aggressively into the U.S. electric system (as explored in Chapter 4) and if the competitors for low-CO2 power—including renewable and nuclear power—prosper as well. On the other hand, additional coal production would result from demands for synthetic fuels and synthetic natural gas (which might be produced with associated electric power production). Also, demand for both electricity and coal + CCS could increase as the result of a shift to electric-power-based transportation.
Finally, if domestic natural gas (e.g., from shale gas deposits) proves plentiful, and confidence grows that prices will remain in the range of $7–9/million Btu or lower for decades, as some commentators think may happen (CERA, 2009), then NGCC plants with CCS could compete economically with PC and IGCC plants with CCS. In such a world, the cheapest way to gain large CO2 reductions would be to use NGCC + CCS to replace over time existing and future coal units.
Although a large shift in this direction would increase natural gas demand significantly and put upward pressure on prices, the committee still considers it wise to plan for a broad range of future natural gas prices and domestic availabilities. Consequently, the committee envisions some CCS projects involving NGCC technology being part of the recommended 10 GW of CCS demonstrations. The committee has not made a judgment about the mix of PC, IGCC, and NGCC plants with CCS that would be appropriate.
Future Biomass Power
Biomass (plant matter) carries stored energy content, retrievable for use by means of oxidation (burning), just as with fossil fuels. Photosynthesis is the source of the stored energy and carbon in both cases, but for fossil fuels the storage occurred millions of years ago. The committee considers here the prospect of large biomass power plants and, as for fossil-fuel power plants discussed earlier, we consider plants with and without CCS. Note that biomass plants with CCS scrub the atmosphere of CO2, as the CO2 sent underground was removed from the atmosphere during photosynthesis only a short while before (years in the case of trees, days to months in the cases of grasses, crops, or crop wastes).
Here the PEI group’s analysis is used to extend the committe’s investigations to biomass power plants, applying the same energy accounting principles that were used for the discussions above of coal and natural gas plants together with the same biomass assumptions made in Chapter 5. The committee considers stand-alone biopower plants as well as power plants in which biomass and coal jointly contribute to producing electric power. The notation is as follows: a BTP-V plant is a biomass-to-power plant with venting of CO2; a CBTP-CCS plant is a coal-plus-biomass-to-power plant with CO2 capture and storage, and so on. The committee considers BTP plants first and then, briefly, CBTP plants.
The feedstock in these examples is switchgrass, which when consumed at the power plant is assumed to have 15 percent moisture content. Biomass-fueled
power plants are assumed to burn at most 1 million dry tons of biomass per year (the same assumption used in Chapter 5 for biomass-to-liquid plants), on the grounds that the collection logistics for a larger plant would be too complex and therefore too costly. The power plants have a capacity factor of 85 percent, as with the fossil-fuel plants discussed above. When the plants are working at full capacity, 3800 tons of “as received” biomass arrive each day. These plants are large—the switchgrass input power (higher heating value) is 700 thermal megawatts—but not as large as the fossil-fuel plants considered above, whose thermal input power ranges from 1000 to 1900 thermal megawatts.
The cost estimates are based on a model of an oxygen-blown-gasification-based combined-cycle power plant, both in its BTP-V and BTP-CCS configurations, with switchgrass as its fuel. The BTP-V plant has a thermal efficiency (higher heating value) of 42.6 percent and a peak power output of 298 MW. The corresponding BTP-CCS plant pays for its CO2-capture feature with a reduced efficiency of 36.2 percent and a peak output of 253 MW. These plants have roughly half the power output of the coal and natural gas plants considered in the earlier discussions. Their efficiencies are about 4 percentage points higher than the efficiencies for the corresponding coal IGCC plants.
The results are displayed in Figures 7.7, 7.8, and 7.9, which are modifications of the Figures 7.4, 7.5, and 7.6 presented earlier, with the sole change being the addition of BTP data. Figure 7.7 shows the capital costs of the BTP-V and the BTP-CCS power plants. On a dollars-per-kilowatt basis (total plant costs divided by peak output), the BTP-CCS plant is 43 percent more expensive than the BTP-V plant is, $2529/kW versus $1768/kW. The power plants with biomass feedstock have approximately the same capital costs as the corresponding coal plants. A BTP plant would be less costly than a coal gasification plant of the same size would be because less oxygen is needed for biomass gasification (biomass, already containing oxygen, is much more reactive than is coal), because the biomass gasifier operates at a lower pressure and therefore requires less power for O2 compression, and because sulfur removal is assumed not to be required for biomass gasification. However, the biopower plant here is smaller, thus losing out on economies of scale.
Carbon Issues
The carbon balance for these biomass power plants is interesting. Because switchgrass “as received” (i.e., with 15 percent by weight moisture content) is 40 percent
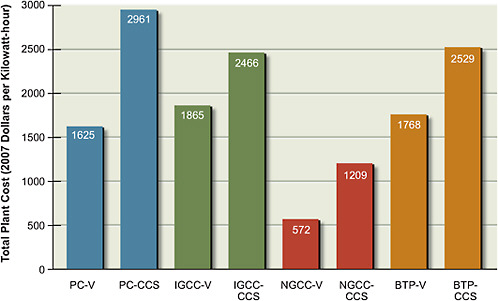
FIGURE 7.7 Augmented version of Figure 7.4, with the addition of biomass power plants. These estimates, like those for other technologies, do not necessarily include all of the site-specific costs of building a plant nor all of the real-world contingencies that may be needed depending on economic conditions (see Box 7.2 for more discussion).
Source: Princeton Environmental Institute.
carbon by weight, 470,000 tonnes of carbon are in the annual input of switchgrass, as photosynthesis and respiration in the switchgrass has removed a net of 1.72 million tonnes CO2 per year from the atmosphere.30 As part of the gasification process, roughly 10 percent of the carbon in the switchgrass is assumed to be trapped in char—a solid waste product—assumed to remain unoxidized forever in a landfill. The carbon not in the char is oxidized to CO2 and vented to the atmosphere whence it came, an annual CO2 emission of 1.55 million tonnes CO2 per year.
A full carbon accounting considers two “upstream” issues: fossil-carbon inputs and induced carbon storage in soil and roots. As discussed in Chapter 5, upstream fossil-carbon inputs resulting in additions of CO2 to the atmosphere
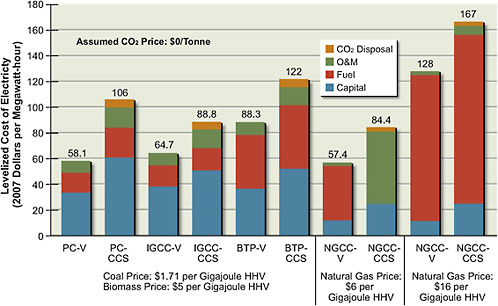
FIGURE 7.8 Augmented version of Figure 7.5, with the addition of biomass power plants. These estimates, like those for other technologies, do not necessarily include all of the site-specific costs of building a plant nor all of the real-world contingencies that may be needed depending on economic conditions (see Box 7.2 for more discussion).
Source: Princeton Environmental Institute.
include direct inputs associated with tractor fuel and fertilizer, for example, as well as indirect inputs linked, say, to compensatory land clearing. To obtain net carbon inputs, these direct and indirect inputs are balanced against any buildup of carbon in soil and roots, which remove CO2 from the atmosphere.
Values for switchgrass were taken from Argonne National Laboratory’s GREET model, Version 1.8 (Argonne National Laboratory, 2008), where fossil-carbon inputs equal 10 percent of the carbon in the switchgrass and are thereby exactly balanced by char storage. GREET also assumes that carbon buildup in soil and roots is one-thirtieth of carbon acquisition from the atmosphere by plants. Thus, the net carbon flow for the BTP-V is, by a small amount, out of the atmosphere, corresponding to the buildup of carbon in soil and roots. CO2 emissions associated with land clearing at the site and associated land clearing elsewhere are not considered.
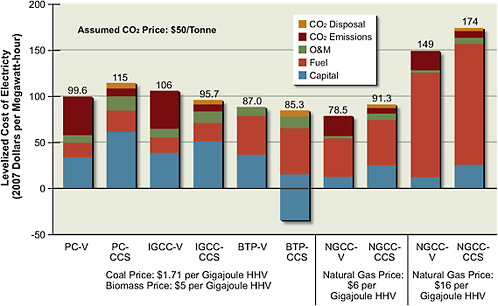
FIGURE 7.9 Augmented version of Figure 7.6, with the addition of biomass power plants. In the case of BTP-CCS, in which CO2emissions costs are negative (−$37/MWh), the entire bar of positive costs has been accordingly lowered below zero. In that way, the top of the bar represents its net LCOE of $85/MWh and is thus directly comparable to the other cases. These estimates, like those for other technologies, do not necessarily include all of the site-specific costs of building a plant nor all of the real-world contingencies that may be needed depending on economic conditions (see Box 7.2 for more discussion).
Source: Princeton Environmental Institute.
The BTP-CCS plant is designed to capture 86 percent of the 1.55 million tonnes CO2 per year that the BTP-V plant vents and to then send it to storage. In other words, 1.33 million tonnes of CO2 is permanently removed from the atmosphere by switchgrass photosynthesis. Taking into account the storage of captured CO2, char storage, storage in soil and roots, and fossil-carbon inputs, the BTP-CCS plant actually removes 1.39 million tonnes CO2 per year from the atmosphere. A 253 MW plant operating with an 85 percent power capacity produces 1.88 TWh per year, which can be restated as an intensity of CO2removal from the atmosphere: 740 g CO2 per kWh. By contrast, the coal IGCC-V plant discussed in
the earlier section emits about 830 g CO2 per kWh. The BTP-CCS plant, installed kilowatt for installed kilowatt, nearly offsets the CO2 emissions of an unvented new coal plant.
Levelized Costs
Figures 7.8 and 7.9 display the levelized cost of energy for these BTP plants as new vertical bars added to Figures 7.5 and 7.6, respectively, presented earlier. The assumed switchgrass cost is $5/GJ, or $5.27/million Btu (higher heating value), which is the same as $80 per ton of switchgrass “as received.” Because the switchgrass energy cost is only slightly less than the lower of the two energy costs of natural gas ($6/GJ, or $6.33/million Btu), while the thermal efficiencies of the BTP plants are somewhat lower than the corresponding thermal efficiencies of the natural gas plants, the fuel contributions to the BTP plants, as shown both in Figures 7.8 and 7.9, are almost exactly the same as the fuel contributions to the $6/GJ NGCC plants. The higher capital costs for BTP relative to NGCC make biopower more expensive than $6/GJ natural gas power. Indeed, biopower is the most expensive of the alternatives—except for power with the higher price of natural gas in the vent cases and in the CCS cases of Figure 7.8, where the CO2 emissions price is zero.
By contrast, in Figure 7.9, where the CO2 emissions price is $50 per tonne CO2, the two BTP plants have become competitive with the NGCC-V plant with low-priced natural gas, and they are less costly than the coal plants. The absence of a visible CO2 emissions component to the BTP-V bar reflects its nearly carbon-neutral character, discussed previously. Comparing the BTP-CCS and the BTP-V plants, one sees that the extra capital cost of the BTP-CCS plant and its lower efficiency are approximately canceled by the $36.9/MWh credit for its removal of CO2 from the atmosphere (shown as a bar segment extending below zero).
Total Contribution with 100 Megatons per Year of Biomass
Chapter 5 suggests that the total U.S. production rate for biomass could grow to 550 million dry tons (500 million dry tonnes) per year. Suppose that 100 million dry tons per year is used for power. Then 100 of our BTP power plants could be deployed (or a larger number of smaller plants, though on the principle of economies of scale, they would have higher costs). With 100 1-million-ton-per-year BTP-V plants, the total contribution to U.S. baseload power capacity would then be 30 GW, which is 10 percent of current coal baseload power capacity. Alterna-
tively, assuming that these BTP power plants are BTP-CCS plants, the contribution would be 25 GW, but they would remove 140 million tonnes CO2 per year from the atmosphere, which is about 7 percent of the CO2 emission rate from today’s coal power plants. These relatively small additions to U.S. electricity and reductions in U.S. CO2 emissions could be multiplied by a factor of 5.5 if all of the 550 million dry tons of biomass per year were devoted to electric power, but then no biomass would be available for liquid fuel production.
Co-firing Biomass and Coal
In Chapter 5, synthetic fuels plants using a feedstock that is a combination of coal and biomass are considered at length (CBTL plants, where “L” stands for “liquids”). Here the committee considers the corresponding power plants powered by coal and biomass, which are denoted as either CBTP-V or CBTP-CCS. A CBTP-V plant will have lower net CO2 emissions as its biomass fraction increases, and a CBTP-CCS plant with sufficient biomass fraction can have net negative emissions.
Some of the facilities considered in Chapter 5 produce substantial amounts both of synthetic liquids and electricity, with electricity regarded as a by-product. One result reported there is that coal-plus-biomass plants that capture CO2 can provide competitive power and competitive fuel in a world where the oil price and the CO2 emissions price are both high. In such a world, these CBT(P+L)-CCS plants may turn out to be strong competitors as providers of new U.S. power capacity.
From the societal perspective, the committee has identified four basic options for biomass utilization: BTP, CBTP, BTL, and CBTL, each with and without CCS. Sorting out their respective roles in a socioeconomic environment of high oil prices and strong constraints on CO2 emissions is complicated. For example, transport may be powered by biomass fuels or by batteries charged from biomass-based electricity. A host of technological innovations still to come will determine relative roles in such competitions.
Supply Curves and Power Plant Mixes in 2020 and 203531
“Supply curves,” such as the ones shown in Figures 7.10 and 7.11, are ways of ordering different technologies by estimated cost while simultaneously showing
estimates of the contribution to supply that each technology might make at various levels of demand. Because both costs and supply contributions are uncertain, these types of supply curves should not be viewed as forecasts but rather as illustrations of possible futures. It is then possible to examine the sensitivity of results of interest (such as carbon emissions) to parameters of interest (such as carbon and fuel price).
Note that the consumption of fossil electricity is determined by the intersection of the supply curve with an upper-left to lower-right demand curve (not shown). The demand curve is influenced by many factors, including the rate of improvement of energy efficiency.
Figure 7.10 shows baseload power supply curves for 2020 for two CO2 emissions prices—$0 per tonne CO2 and $50 per tonne CO2—to illustrate the effect of the CO2 price on the coal/natural gas competition among existing plants. The effect of the CO2 price is to raise the cost of power from coal twice as much as the cost of power from natural gas. LCOEs in the absence of a CO2 price are illustrative: 4¢/kWh for an existing coal plant and 8¢/kWh for an existing natural gas plant (a cost of natural gas power consistent only with a high natural gas price).32 With these assumptions, a $50 per tonne CO2 price is not sufficient to make natural gas power the less costly alternative. In fact, the two alternatives equalize at about $100 per tonne CO2.
Figure 7.11 shows baseload power supply curves for 2035 for three CO2 emissions prices: $0 per tonne CO2, $50 per tonne CO2, and $100 per tonne CO2. This figure shows an expanded competition relative to Figure 7.9. In addition to existing coal and natural gas plants, there are new coal plants and new natural gas plants, with and without CCS—in all, a six-way competition. (Retrofits of existing coal plants, which would raise the cost of their power, are not included.) Maximum penetration rates for new plants are assumed, as discussed in the section below titled “Future Coal Power”; the cost of power from new plants is approximately that shown in Figures 7.5 and 7.6; and the same high natural gas price as in Figure 7.10 is assumed. The important result shown in Figure 7.11 is that the ordering of alternatives is affected by the CO2 price. At $0 per tonne CO2 and $50 per tonne CO2, existing coal plants produce the least costly power, and the competition for second place is between new coal plants without CCS and existing natural gas plants. At $100 per tonne CO2, however, new coal plants with CCS are
|
32 |
Further discussion of supply-curve assumptions is found in Annex 7.A. |
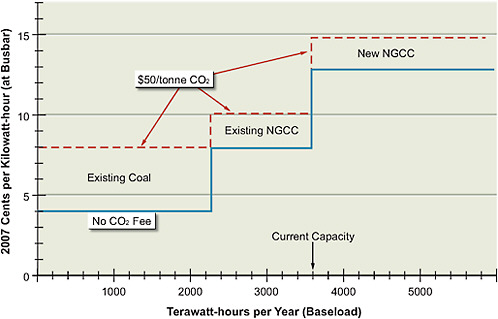
FIGURE 7.10 Hypothetical supply curves for fossil baseload electricity in 2020, illustrating the coal/natural gas competition as a function of CO2price. The busbar cost for natural gas power in the absence of a CO2price is consistent only with a high natural gas price. Not shown are the perhaps 60 TWh of coal-CCS power produced from plants installed during the CCS evaluation period by 2020.
the least-cost alternative, cheaper even than existing coal plants. New coal plants without CCS do not appear in Figure 7.11 at all for the $100 per tonne CO2 case.
Figures 7.10 and 7.11 present national supply curves and national emissions, without taking into account state laws, regulations, and initiatives. The committee recognizes that many states, in the absence of a federal policy on CO2 emissions, have already begun to take action. Three regional “cap and trade” initiatives, involving 23 states, have been formed to begin addressing CO2 emissions (Cowart, 2008). In addition, some states have essentially put an infinite price on CO2 emissions from coal plants. Florida, for instance, has ruled out a new uncontrolled coal plant, and California has issued a rule to ban the import of electricity generated with CO2 emissions that are greater per kilowatt-hour than those of natural gas plants. (Little coal is consumed directly in California.) Although there may be constitutional challenges to such a rule based on the Commerce Clause of the
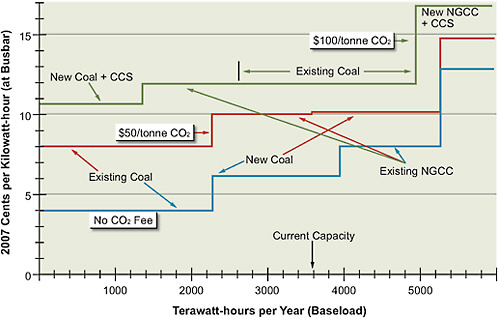
FIGURE 7.11 Three hypothetical but illustrative supply curves for fossil baseload (85 percent capacity factor) electricity in 2035, based on CO2emissions prices of $0, $50, and $100 per tonne CO2. The same high natural gas prices as in Figure 7.10 are assumed, successful CCS is assumed, and penetration rates of new coal plants are those discussed in the section titled “Future Coal Power.” The committee assigns a ±10–25 percent uncertainty range to the vertical axis and a ±25 percent uncertainty to the horizontal axis.
Constitution, it is probable that state actions will influence national supply curves to some extent. More generally, state policy will most likely have a major influence on federal policy, as it has in the past with non-CO2 air-pollution control.
Findings: Electric Power Generation
The rate at which new fossil fuel power plants will be constructed strongly depends on the rate of penetration of energy efficiency and the rate of retirement of existing plants. Flat loads and near-zero retirements mean virtually no new construction. The benefits of new power plants—lower pollutant emissions and (if all goes well) CO2 capture and storage—will accrue much more rapidly if retirements can be accelerated. Existing coal power plants emit 2 billion tonnes of CO2 per year—one-third of total U.S. emissions—and natural gas power plants emit an additional one-third of a billion tonnes of CO2 per year. It is difficult to see how
U.S. leadership in carbon mitigation can be established without aggressive retirements or retrofits. Investments in old plants to address CO2 emissions and criteria air pollutants will be more cost-effective if they are coordinated.
Looking toward 2020 and perhaps beyond, the mix of coal and natural gas in new power generation is highly uncertain. Significant increases in capital costs, the form of potential regulation of CO2 emissions, other licensing and regulatory issues, and the low availability of financing have made the construction of new coal-fired power plants less attractive. By contrast, the situation for new natural gas power plants appears favorable; they have lower construction cost, shorter construction time, and reduced environmental impact. However, the resulting growth in natural gas demand could increase LNG imports or bring on high-cost domestic gas, resulting in higher electricity costs.
Too little is known at present for determining which coal-based technology can best generate electricity after 2020 if CO2emissions are constrained. For equivalent levels of CO2 capture, current estimates suggest that in many situations the IGCC plant is somewhat less costly than the PC plant is. However, falling costs for post-combustion capture at PC plants, the successful commercialization of burning coal in an oxygen environment (oxyfuel), and the reduced efficiency of IGCC for lower-rank coals all complicate the analysis. PC plants could thus be more competitive in some cases.
Carbon constraints can reorder the supply curve. Power-production technologies run the gamut on CO2 emissions, venting from all to essentially none of the carbon contained in coal and natural gas fuels. Biomass incorporated into the fuel mix can, in principle, have negative carbon emissions. The cost of electricity across the range of these technologies therefore varies with the price of carbon. The variation is large enough to significantly move the cost break-even points among technologies.
Development of reliable cost and performance data needed for commercial deployment of new power-generation technologies requires the construction and operation of first commercial plants and the funding of innovative R&D. Commercial demonstration is needed in order to give vendors, investors, and other private-industry players the confidence that power plants incorporating advanced technologies can achieve the performance levels required under commercial terms.
Because of the variety of coal types and technology options, a diverse portfolio of demonstrations will be necessary.
An aggressive research, development, and demonstration (RD&D) program on carbon capture technology could have a major impact on the economics of coal-based electricity. Because existing technologies both for precombustion and postcombustion carbon capture impose large parasitic loads, reducing this inefficiency is a crucial research goal. Technical road maps for addressing this challenge exist, and they indicate that substantial progress could be made by 2020.
While these RD&D projects will be expensive, failure to initiate them in the near future will jeopardize the ability to widely deploy CCS technology in the 2020–2035 period. If the investments are not made now, they will have to be made later. Determination of which technologies offer the lowest-cost alternatives for reductions in CO2emissions from electric power generation will thus be delayed.
GEOLOGIC STORAGE OF CO2
Potential Storage Sites
If significant quantities of captured CO2 are to be stored, many subsurface locations will have to be found. Three principal storage settings are being considered: oil and gas reservoirs, deep formations that contain salt water, and coal beds too deep to be mined. Oil and gas reservoirs always have seal rocks that prevent the oil or gas from escaping; where available, they will be obvious first choices for storage locations.
Considerable practical experience for guiding future geologic storage projects has accumulated over the past three decades, as CO2 has been used in enhanced oil recovery (EOR) operations to produce oil that would be left in the ground by conventional oil recovery methods (primary production and water injection). EOR projects in many oil fields (see Box 7.3) have demonstrated that CO2 can be safely transported by pipeline and that it can be an effective agent for oil recovery. Technology required for CO2 injection in gas fields is likely to be similar to that of oil recovery, and testing of injection of CO2 into depleted gas fields is under way.
In many parts of the United States, however, oil and gas fields are not present, and use of other subsurface formations will be required if geologic storage
|
BOX 7.3 CO2Capture and Storage Projects Figure 7.12 shows some of the CO2 injection projects that are active around the world (IPCC, 2005). Commercial-scale projects that inject ~1 million tonnes per year are currently under way at Sleipner in the North Sea, Weyburn in Saskatchewan, In Salah in Algeria, Salt Creek in Wyoming, and Snøhvit in the Barent Sea. All but one of these projects (Weyburn) inject CO2 that is separated from natural gas and would otherwise be vented to the atmosphere. The separation of CO2 from natural gas is typically done with solvents such as amines—this step is required if the natural gas is to be purified sufficiently for sales (see Annex 7.A for details). At Sleipner, the gas is processed at an offshore platform, and the separated CO2 is injected into a porous sandstone that contains salt water at a depth of 800–1000 m. At In Salah, the separated CO2 is injected into the same formation that contains the natural gas, but below the gas zone so that salt water will be present. The Snøhvit project takes the gas ashore, makes liquified natural gas (LNG), and, as at In Salah, reinjects the separated CO2 into a formation below the zone from which gas is produced. These projects indicate that additional early testing of geologic storage is possible where the CO2 must be separated anyway. The Weyburn project differs in that the CO2 being injected comes from a coal gasification plant in North Dakota, and the CO2 is used for a combination of enhanced oil recovery and CO2 storage. That CO2, along with about 1 percent H2S separated with the CO2, is transported by a 205-mile pipeline to the oil field; thus, the Weyburn project is an example of co-storage of CO2 and H2S. Salt Creek is also an enhanced oil recovery (EOR) project. It uses CO2 separated from natural gas, as does a similar project at Rangely, Colorado. Numerous other EOR projects are currently under way in west Texas; they inject about 28 million tonnes per year, though mainly they use naturally occurring CO2 that is brought by pipelines from Colorado and New Mexico. Considerable experience has been gained there in CO2 transportation by pipeline and subsurface injection in the three decades of operation. Many other pilot and demonstration projects, some of them quite large, are being planned. Descriptions for many of them can be found in IPCC (2005), at the IEA Greenhouse Gas Program Website (www.co2captureandstorage.info/co2db.php), and at Websites at MIT (sequestration.mit.edu/) and Stanford (pesd.stanford.edu/publications/pesd_carbon_storage_project_database). |
is to be undertaken in any of them. Storage in deep formations that contain salt water is likely to be used in such locations. CO2 injected into saline formations will eventually (in decades to centuries, although low-permeability settings could require thousands of years) dissolve in the brine, but rocks above the formation are required to contain the CO2 during that time. Brine containing dissolved CO2
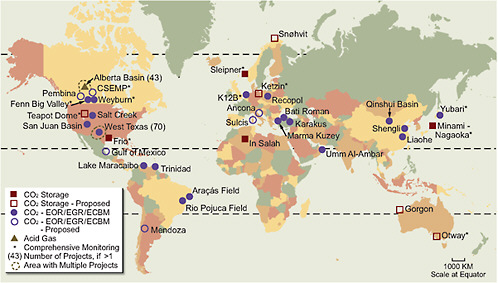
FIGURE 7.12 CO2injection projects worldwide.
Note: ECBM = enhanced coal bed methane; EGR = enhanced gas recovery; EOR = enhanced oil recovery.
Source: IPCC, 2005.
is slightly denser than salt water alone, so once the CO2 is dissolved the driving force for upward migration of CO2 disappears. Several large-scale projects to test CO2 injection into such formations are under way (IPCC, 2005; Figure 7.12), including a project at Sleipner in the North Sea and at In Salah in Algeria, where, as noted in Box 7.3, CO2 separated from natural gas is injected into a sandstone formation above the natural gas reservoir and into the aquifer below the gas-bearing zone, respectively (IPCC, 2005). These tests both involve injection of about 1 million tonnes of CO2 per year.
Storage in deep unminable coal beds has also been proposed, but it has been tested only in a very limited way (see Annex 7.A for a more detailed description of the attributes of the various potential storage settings).
Potential storage locations are widely distributed in the United States. For example, Figure 7.13 shows the locations of oil and gas provinces, areas with deep formations that contain salt water, and areas where coal is found; the locations
of coal-fired power plants are shown as well. Dooley et al. (2006) concluded that about 95 percent of this country’s 500 largest sources of CO2 are located within 50 miles of a potential storage formation.
Estimates of the capacity for CO2 storage in each of the settings have been made by regional DOE-supported research teams (NETL, 2007b): specifically, oil and gas reservoirs for 80 Gt CO2; saline formations for 920–3430 Gt CO2; and coal beds for 160–180 Gt CO2. While the sedimentary rocks that might be suitable for CO2 injection are widespread, not all locations will be appropriate. Sites will have to be carefully selected and evaluated. Suitable sites will have seal rocks that prevent vertical flow; sufficient pore space available that can be accessed without exceeding the maximum pressure (which could cause fracturing
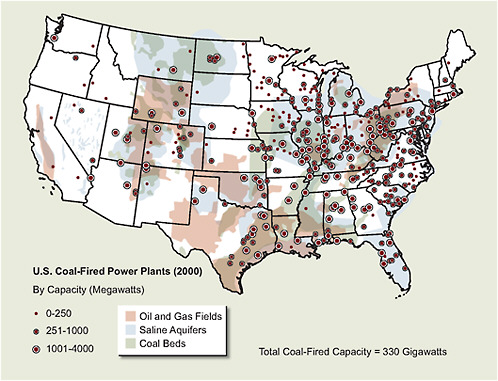
FIGURE 7.13 Locations of coal-fired power plants and potential subsurface formations that could be used for geologic storage of CO2.
Source: MIT, 2007.
or leakage through the seal); rock properties that allow the CO2 to be injected at a reasonable rate (more wells will be required for formations in which flow resistance is higher, which could increase costs over those used for the cost estimates reported in the section titled “Carbon Capture at Coal Plants in Operation Today”); and no potential leak paths. Appropriate sites will have rock layers above the storage zone that retain the injected CO2 in the deep subsurface for times sufficient for physical mechanisms such as dissolution of CO2 in brine and trapping of CO2 as isolated bubbles to immobilize a large fraction of the CO2, a period that is likely to be decades to centuries as noted preivously. Even given the constraints on specific storage sites, the estimated capacities just listed are large compared to U.S. emissions of 6 Gt CO2 from energy use in 2007 (EIA, 2008c), an indication that sufficient capacity is likely to be available for geologic storage of CO2.
Large-scale storage of CO2 requires the integration of technologies, most of which have already been proven at commercial scale. Still, critical experience with CO2 storage can be learned only by conducting many capture and storage projects in parallel. They must span the numerous types of coal, capture strategies, and storage sites, apply both to power and to synfuel plants, and entail storage both in deep saline aquifers and in hydrocarbon-bearing formations. Challenges to the management of a storage site for very large storage rates and quantities include (1) selecting enough well sites for high-volume injection and (2) monitoring movement of the CO2 in the subsurface. Therefore, important information will be gained by conducting a number of projects in which CO2 is injected over several years at a rate of at least 1 million tonnes CO2 per year.
An indication of the very large scale of operation that might be required is provided by the emissions of a large coal-fired power plant. A 1000 MW coal plant will emit about 6 million tonnes of CO2 per year. At typical densities of CO2 in the subsurface, the volume of the CO2 injected belowground is then about 300 million standard cubic feet per day, or 160,000 barrels per day in oil units. This volume is similar to the oil flow from a large oil field. A suite of projects can be designed to clarify the costs, risks, and environmental impacts of CO2 capture and storage associated with coal and natural gas plants. This will enable informed judgment on whether such plants can become a significant contributor to the U.S. power system in a carbon-constrained world.
Work along these lines is being done with support from the DOE through a series of regional CO2 storage partnerships (NETL, 2007b). Additional analysis will also be needed that links specific storage locations with potential sources,
evaluates opportunities for capture, and considers how the CO2 might be transported at the scale required.
CO2Storage Supply Curve
Figure 7.14 shows estimated cost as a function of the total quantity of CO2 that could be captured and stored with current technologies at existing U.S. CO2 sources. It indicates that if all the CO2 emitted from stationary sources that could be stored at costs below about $50 per tonne were captured, the total emissions reduction would be about 1.5 billion tonnes CO2, or about 20 percent of current emissions (Dooley et al., 2006). The storage cost shown as negative in Figure 7.14 stems from the use of CO2 for EOR, which may make use of sources of CO2 other than power plants (ammonia plants or natural gas purification, for example) in which CO2 is already separated. About 28 million tonnes CO2 per year is presently injected for EOR in oil fields in west Texas, though most of that CO2 comes from natural underground sources.
Significant growth in the amount of CO2 captured from anthropogenic sources would likely be put to use for EOR in regions where oil fields are within reasonable distance from a source. The existence of a CO2 price would favor expansion of EOR in such locations as the magnitude of present EOR operations is constrained by the availability of CO2 for injection. Thus combined EOR and CO2 storage has the potential to lead to a significant expansion of EOR production from the 200,000 barrels per day produced now.
Findings: Geologic Storage
Long-term geologic storage of carbon dioxide appears to be technologically feasible, but it has yet to be demonstrated at the scale of a large power plant in a variety of geologic repositories.
A suite of projects can be designed to clarify the costs, risks, and environmental impacts of carbon storage. This would enable a determination of whether such plants can become significant contributors to the U.S. power system in a carbon-constrained world. Successful demonstration will require projects spanning the many types of coal, using several capture strategies, at a variety of storage sites, at both power and synfuel plants, and with storage both in deep saline aquifers and in hydrocarbon-bearing seams.
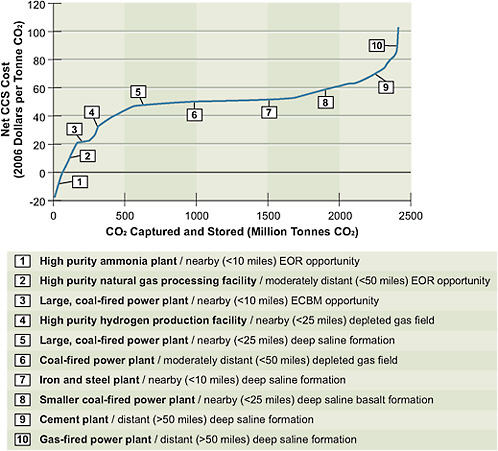
FIGURE 7.14 Supply curve for geologic storage of CO2. Net CCS costs shown include the costs of capture, transportation, and subsurface injection. See Figure 7.A.6 in Annex 7.A for a breakdown of these costs into four components: capture, compression, transport, and injection.
Note: ECBM = enhanced coal bed methane; EOR = enhanced oil recovery.
Source: Dooley et al., 2006.
Significant expansion of domestic oil production via enhanced oil recovery could result from a price on CO2. At least for light oils, CO2 is the fluid of choice for EOR, but until now the level of EOR activity has been constrained by the availability of low-cost CO2. If CO2 emissions are constrained, EOR will be an attractive market for CO2, as most of the CO2 it uses will remain underground. Widespread realization of CO2 capture opportunities will be required, along with an infrastructure of CO2 pipelines.
ENVIRONMENTAL QUALITY AND SAFETY ISSUES
The use of coal, oil, and natural gas—involving exploration, extraction, transportation, processing (e.g., cleaning and refining), combustion, and recycling or disposal of petrochemical materials—has always produced environmental impacts.33 They include air and water pollution that escape pollution controls in place today on vehicles, refineries, factories, and power plants, as well as discharges from sources without pervasive pollution controls, such as residences. The impacts also include changes to the landscape and ecosystem that remain after surface-mine reclamation, as well as ecosystem changes resulting from oil tanker spills. Because all of these impacts have been extensively reviewed, because Chapter 6 on renewable energy includes life-cycle analyses that have been carried out on fossil-generated electricity (particularly with respect to emissions), and because the National Research Council has released a report on energy externalities,34 the AEF Committee does not repeat this work here.
From time to time, the well-studied impacts and the regulations under which they fall are summarized—e.g., in the environmental sections of the Encyclopedia of Energy (2004). But regulations, as well as results from environmental science, change every year. Up-to-date reports and statistics are more likely to be found on the websites of regulatory agencies,35 government research laboratories and
|
33 |
At each stage, the air and water pollution produced has the potential to impair human health. And in addition to effects such as stresses on wildlife, wildlife habitats, vegetation, and biota in rivers and streams, fossil-fuel-generated haze can also reduce visibility. |
|
34 |
Hidden Cost of Energy: Unpriced Consequences of Energy Production and Use. Available at http://www.nap.edu/catalog.php?record_id=12794. |
|
35 |
Examples include the Environmental Protection Agency (EPA) websites on air (www.epa.gov/oar/), water (www.epa.gov/OW/), and wastes (www.epa.gov/swerrims/); the Minerals Management Service (MMS) website on environmental assessment and regulation of offshore facilities (www.mms.gov/eppd/index.htm); the Department of the Interior’s website on surface mine reclamation (www.osmre.gov/osm.htm); the website of the Council on Environmental Quality, which coordinates policy on environmental impact statements and assessments (www.nepa.gov/nepa/nepanet.htm); the website of the Office of Ocean and Coastal Resource Management (OCRM), a division of the National Oceanic and Atmospheric Administration (NOAA) (coastalmanagement.noaa.gov/); and the Fish and Wildlife Service’s website on the endangered species program (www.fws.gov/endangered/). |
advisory committees,36 environmental and industry stakeholders,37 and private research institutes.38
Much progress has been made in mitigating or eliminating impacts of fossil-fuel development and use, but environmental damage remains, including that caused by emissions from older power plants that have yet to be fully controlled. Airborne particulates are due, in part, to emissions from coal-powered power plants of gaseous SO2, which forms into particulates downwind of an SO2-emitting stack. As a result of such emissions and those from vehicles, industry, and other sources, there are still 208 counties in the United States that by December 2008 had not attained EPA limits on PM2.5 particulate air pollution (www.epa.gov/air/data/nonat.html?us~USA~United%20States). The number may fall to 52 by 2015, according to EPA modeling, with most of the residual regions in California.39 However, even should the number of non-attainment counties shrink to zero, it would not necessarily mean that all health effects and annoyances will be eliminated because there is always debate about the proper standard. The EPA chose a PM2.5 standard in 2006 that was higher than the level recommended by its Clean Air Scientific Advisory Committee, although still within the advisory committee’s range (Stokstad, 2006). The American Lung Association cites analysts who estimate that many thousands of premature deaths can be statistically related to pollution from particulates (ALA, 2009; Stokstad, 2006).
|
36 |
Examples include the National Laboratories’ website (www.energy.gov/organization/labstechcenters.htm) and the reports of the National Petroleum Council, which advises the Secretary of Energy (www.npc.org/). |
|
37 |
Examples include the environment briefs of EPRI (mydocs.epri.com/docs/public/000000000001016774.pdf); the reports of the Union of Concerned Scientists (UCS) on coal power (www.ucsusa.org/clean_energy/); the reports and overviews of the National Resources Defense Council (NRDC) (www.nrdc.org/energy/); and the issue briefs of the National Mining Association (www.nma.org/issues/environment/default.asp), as well as other industry trade groups and environmental organizations. |
|
38 |
Examples include Resources for the Future (RFF) (www.rff.org/focus_areas/Pages/Energy_and_Climate.aspx); World Resources Institute (WRI) (www.wri.org/publications/climate); Worldwatch Institute (www.worldwatch.org/taxonomy/term/40); the Heritage Foundation (www.heritage.org/Research/EnergyandEnvironment/index.cfm); and the National Academies (www.national-academies.org). |
|
39 |
By 2015, the EPA projected the number of non-attainment counties to fall to 52 for PM2.5 (epa.gov/pm/pdfs/20061025_graphsmaps.pdf) under its Clean Air Interstate Rule (CAIR) program, which has now been overturned for application in Minnesota by the judiciary. The rule was considered too lenient (Science 321(5890; August 8):756-757, 2008). The EPA is reconsidering the application of the rule elsewhere (www.epa.gov/cair/pdfs/20090114fs.pdf). |
Alhough difficult to estimate, the monetized estimates of environmental damage are not trivial, with most commentators finding coal to have the highest damage costs and natural gas the least. Thus there are regular attempts to either strengthen or change environmental regulations, which could alter the trajectory of energy development, extraction, and use of fossil fuels in the future. For instance, defining appropriate limits on the amount of very fine particulates that should be allowed to leave vehicle exhausts and combustion stacks is an ongoing area of health research. Similarly, increased production of natural gas from shale formations raises a variety of water quality issues.40
The AEF Committee is aware that government agencies, industry, and other stakeholders are currently working on many of these issues and that many of the potential problems will be resolved in the normal course of doing business. Still, the question arises as to whether or not existing laws, regulations, and enforcement capabilities will be sufficient to handle, both from a substantive and a public-perception viewpoint, the changes that may be coming over the next few decades within the fossil-fuels system.
In principle, a complex set of regulations that cover the use of fossil fuels is in place or can be changed to guide future fossil-fuel development. Examples of landmark federal legislation include the Clean Air Act, the Clean Water Act, the National Environmental Policy Act, and the Endangered Species Act. In addition, the Toxic Substances Control Act (TSCA), the Resource Conservation and Recovery Act (RCRA), the Comprehensive Environmental Response, Compensation and Liability Act (CERCLA), the Surface Mine Control and Reclamation Act of 1977 (SMCRA), the Outer Continental Shelf Lands Act, and the Coastal Zone Management Act (CZMA) are in place. Moreover, many states have passed legislation that affects use and development of energy facilities. The regulatory systems represented by all these legislative actions provide the opportunity for society to address emerging environmental concerns; the challenge is to make sure that the legislation is kept up-to-date and that funding for state and federal regulatory and enforcement programs keeps pace.
In addition, deploying many of the technologies discussed in this chapter will present environmental issues that are unfamiliar to the public or will lack appropriate regulatory frameworks. If not addressed properly and early enough, public
|
40 |
See, for example, naturalgas.extension.psu.edu/Environmental.htm. |
resistance or regulatory delays may put off or even curtail potential fossil-fuel developments.
The key issue areas to address are
-
Capture and storage of CO2
-
Environmental and safety management necessitated by the increased use of coal, should the scale of coal-to-synthetic-natural-gas or coal-to-liquid programs grow significantly
-
Environmental management of oil shale and tar sands
-
Safety management of LNG terminals, increased tanker traffic, and extended networks of natural gas pipelines
-
Water use.
These five areas are discussed in turn below.
Capture and Storage of CO2
The major environmental issue facing fossil fuels today is the emission of greenhouse gases, particularly CO2. Technologies discussed in the section above titled “The PC/IGCC Competition,” such as pulverized coal combustion and coal gasification, offer a mechanism for capturing CO2 in new coal-fired power plants. While natural gas–based electricity generation is already attractive for reasons spelled out in the section above titled “The Competitiveness of Natural Gas,” the lack of regulations that would provide a greater incentive to mitigate CO2 emissions, as well as great uncertainties about the cost of CCS, further discourages investment in coal plants.
In the CO2 context, there may be lessons to be learned from reviewing the strengths and limitations of regulations of other air pollutants. For example, cap and trade programs are one of a number of methods for establishing a price on greenhouse gas emissions. Trading systems for atmospheric pollutants have a long history in the United States, and examples of their successes are described in Annex 7.A. Another method of establishing a price on carbon is levying a tax or a fee on CO2 emissions.
The section above titled “The PC/IGCC Competition” explains why most PC and IGCC plants with CCS will be built after 2020, but there can easily be opportunities to capture CO2 from other sources. As such, one new environmental challenge may be pipeline transport of CO2 from its source to where it can be stored
underground. Because safety issues associated with transportation of CO2 would be novel to the public (see Annex 7.A), opposition to it could exceed that of natural gas pipelines, which have had difficulty being sited in crowded areas such as, the Northeast. Pipeline transport of CO2 requires attention to route selection, overpressure protection, and leak detection (IPCC, 2005). Outside of high-population-density regions, opposition would likely be modest.
Storage of CO2 is a way to mitigate CO2 emissions for the time being, as discussed in the prior section titled “Geologic Storage of CO2.” Although there appears to be a large amount of storage capacity in the United States and elsewhere with suitably low initial leakage rates, long-term monitoring of leakage will be necessary. Further, there is a need for regulations concerning land-use compensation, underground storage rights, and long-term liability associated with CO2 injection (Wilson et al., 2007a,b).
Public acceptance cannot be taken for granted; it must be won by performance. Regarding industry and major environmental groups in the United States, thus far they are supportive of CCS playing a major role in transitioning to energy systems with lower CO2 emissions, assuming that safety questions related to possible releases are satisfactorily resolved. However, major environmental groups in Europe are concerned that CCS is not sustainable and that it may delay development of renewable-energy solutions.
The creation of a regulatory framework for geologic CO2 storage is currently beginning, and there is also considerable experience with injecting CO2 into oil formations for enhanced oil recovery, which has been regulated under rules for oil and gas production. Testing of geologic storage of CO2 can be done under existing regulatory frameworks, but large-scale implementation will require significant further development. Work on such a regulatory framework is under way at the EPA.
In July 2008, the EPA issued proposed rules for regulation of underground injection of CO2 under the Safe Drinking Water Control Act. These rules would create a new class of injection well for CO2 within the Underground Injection Control program, and they also include requirements for storage-site characterization, injection-well design and testing, monitoring of project performance, and demonstration of financial responsibility; finalization of the rules is expected by late 2010 or early 2011. Such a regulatory structure is likely to continue to evolve in the decade ahead as the science and technology used to describe the behavior of CO2 in the subsurface improves as a result of testing large-scale CO2 injection (see Annex 7.A for additional discussion of the development of a regulatory framework).
Environmental and Safety Management of Increased Use of Coal
Should a dramatic increase occur in the use of coal, including more use for electricity generation, there could be more ash to be disposed of and greater total emissions of mercury and SO2 (a precursor to airborne particulates); these effects could probably be mitigated by a tightening of limits on individual power plants, albeit with increased costs. There would also be new scrutiny of mine safety, mountaintop removal, and other forms of surface mining. Surface mining is subject to state and federal reclamation requirements, but adequacy of the requirements and enforcement is a constant source of contention.41 For instance, the EPA recently announced a review of permit requests for mountaintop coal mining, citing serious concerns about potential harm to water quality.42 Increased risk to endangered species from increased used of coal could be an issue as well. Increased use of coal also would mean greater risk of spills from coal ash impoundments, an issue now receiving active EPA attention.43 In any case, the opening of new coal mines is likely to be much more expensive than it used to be, and new environmental/safety regulations to deal with the growth in coal-extraction rates will add to the cost.
As more U.S. coal makes its way throughout the world, it may be used in facilities less strictly regulated than those in the United States. Similarly, imported coal may not have the same upstream regulations likely to be in place in the United States.
Environmental Management of Oil Shale and Tar Sands
In addition to greater CO2 emissions per unit of oil output from oil shale, there are environmental issues related to surface mining or in situ processing, including water management. Although Canada has a much larger tar sand resource than
|
41 |
Environmental groups (e.g., www.sierraclub.org/MTR/downloads/brochure.pdf)) are particularly concerned about mountaintop removal and associated valley fills, which are largely confined to the Appalachian Mountains. Proponents of the practice point to its efficiency, the environmental benefit of the low-sulfur coal found there, and the resulting increase of flat land in areas where there is often little. |
|
42 |
|
|
43 |
“The EPA plans to gather coal ash impoundment information from electric utilities nationwide, conduct on-site assessments to determine structural integrity and vulnerabilities, order cleanup and repairs where needed, and develop new regulations for future safety.” See www.ensnewswire.com/ens/mar2009/2009-03-09-093.asp. |
does the United States, it is possible that tar sands from eastern Utah will be used one day for significant oil production. Producing oil from tar sands, like producing oil from shale, also produces a large amount of CO2 before the oil is ever turned into transportation fuel and consumed, and there are impacts similar to those from extracting oil shale. Land and energy requirements are very high.
Government lands that will be made available for oil shale and tar sands leasing in the United States have not yet been selected (BLM, 2007a). Issues raised by exploration and extraction include pollution, impacts on scenic values, and impacts on fish and wildlife, including threatened and endangered species (BLM, 2007b).
This is an issue likely to be important in the 2020–2035 period, but planning for it during 2010–2020 will be essential.
Safety Management of Liquid Natural Gas Terminals, Increased Tanker Traffic, and Larger Natural Gas Pipeline Networks
Imports of liquid natural gas accounted for about 3 percent of U.S. natural gas supply in 2007 (British Petroleum, 2008). While LNG has been used safely around the world for many years, LNG storage facilities or tankers could now be vulnerable to terrorist attacks—perhaps the newest obstacle to siting LNG facilities.
Congress has passed legislation (the U.S. Maritime Transportation Security Act of 2002) requiring all ports to have federally approved security plans. Security assessments of LNG facilities and vessels are also required. Opposition to LNG is likely to be a regional, not a national, phenomenon. In fact, new LNG facilities are being constructed along the Gulf Coast, and more are being planned.
If LNG terminals were built far from load centers, natural gas from these terminals could be carried by pipeline. However, siting a pipeline along populated corridors can also be difficult; upgrading the capacity of existing lines may be easier.
Water Use
Population growth brings the need for more electricity as well as for more water, but these requirements often conflict, particularly on a regional basis. In the United States, those regions with the highest population growth are also those with the more severe water shortages. As a result, water use has become one of the most contentious issues in the siting of new electric power plants.
Power generation accounts for an estimated 40 percent of U.S. freshwater withdrawals (almost entirely at the once-through cooled plants) but only about 3 percent of total U.S. freshwater consumption. Power plants of nearly all types require water for a variety of uses within the plant. In addition, for fossil-fuel plants, including coal-fired IGCC plants, water is required in the extraction and processing of the fuels.
The withdrawal, consumption, and discharge of water from power plants all have an effect on the ecosystem. Aquatic life can be adversely affected by impingement on intake screens, by entrainment in the cooling water, or by thermal pollution from the discharge water. The primary effects of thermal pollution are direct thermal shock, changes in dissolved oxygen concentrations, and the mortality and redistribution of organisms in the local community. Additionally, chlorine and other chemicals that are added to condition the water or to prevent fouling of the cooling system can also impact ecosystems.
Most power plants in operation today use either once-through cooling or closed-cycle wet cooling.44 Once-through cooling is used on about 40 percent of existing plants; closed-cycle wet cooling is used on nearly all the remaining 60 percent. Options for significantly reducing the use of freshwater by power plant cooling systems include the use of nonfreshwater sources as makeup water for closed-cycle wet cooling and the use of dry cooling or hybrid cooling systems.
Finding: Environmental Issues
A regulatory structure for carbon sequestration is needed and must be tested in the 2010–2020 timeframe if this technology is to be successfully implemented after 2020. Of course, there may be other important environmental issues associated with transforming the energy system, so agencies, stakeholders, and funders must be vigilant and strengthen their preparation for the changes that may be coming in fossil-fuel systems. Because these are difficult issues the participants may find the use of negotiated conflict resolution techniques to be helpful.
REFERENCES
ALA (American Lung Association). 2009. State of the air. Washington, D.C. Available at www.lungusa.org.
Argonne National Laboratory. 2008. The Greenhouse Gases, Regulated Emissions, and Energy Use in Transportation (GREET) Model. Transportation Technology R&D Center. Available at www.transportation.anl.gov/modeling_simulation/GREET/index.html.
Baker Institute. 2008. Natural Gas in North America: Markets and Security. Baker Institute Policy Report 36. January. Available at www.bakerinstitute.org/publications/BI_PolicyReport_36.pdf.
Bartis, J.T., T. LaTourrette, L. Dixon, D.J. Peterson, and G. Cecchine. 2005. Oil Shale Development in the United States. U.S Department of Energy Report by RAND Corp. Available at www.rand.org/pubs/monographs/2005/RAND_MG414.pdf.
BLM (U.S. Bureau of Land Management). 2007a. Draft Oil Shale and Tar Sands Resource Management Plan (RMP) Amendments to Address Land Use Allocations in Colorado, Utah, and Wyoming and Programmatic Environmental Impact Statement (PEIS). Vol. 1. Washington, D.C.
BLM. 2007b. Draft Oil Shale and Tar Sands Resource Management Plan (RMP) Amendments to Address Land Use Allocations in Colorado, Utah, and Wyoming and Programmatic Environmental Impact Statement (PEIS). Vol. 2. Washington, D.C.
BLM. 2008. Inventory of Federal Oil and Gas Resources and Restrictions to Their Development. Available at www.blm.gov/wo/st/en/prog/energy/oil_and_gas/EPCA_III/EPCA_III_faq.html.
Bohi, D.R. 1998. Changing productivity in U.S. petroleum exploration and development. Resources for the Future Discussion Paper, Table 3.1. Available at www.rff.org/documents/RFF-DP-98-38.pdf.
Booras, G. 2008. Economic Assessment of Advanced Coal-Based Power Plants with CO2 Capture. MIT Carbon Sequestration Forum, September 16.
British Petroleum. 2007. Statistical Review of World Energy 2007. London: BP. June.
British Petroleum. 2008. Statistical Review of World Energy 2008. London: BP. June.
CERA (Cambridge Energy Research Associates). 2009. Rising to the Challenge: A Study of North American Gas Supply to 2018. March. Available at www.cera.com/aspx/cda/public1/news/pressReleases/pressReleaseDetails.aspx?CID=10179.
Cowart. 2008. Carbon caps and efficiency resources. Testimony before the Select Committee on Energy Independence and Global Warming, U.S. House of Representatives Hearing on Energy Efficiency and Climate Policy, May 8.
DOE (U.S. Department of Energy). 2006a. Undeveloped Domestic Oil. Report by Advanced Resources International. Washington, D.C. February.
DOE. 2006b. Update to Undeveloped Domestic Oil. Available at www.fossil.energy.gov/programs/oilgas/publications/eor_co2/F_-_UndevDom_Oil_Res_FACT_SHEET.
DOE. 2007. Carbon Capture from Existing Coal-Fired Power Plants. DOE/NETL-401/110907. Washington, D.C. November.
Dooley, J.J., R.T. Dahowksi, C.L. Davidson, M.A. Wise, N. Gupta, S.H. Kim, and E.L. Malone. 2006. Carbon Dioxide Capture and Geologic Storage. Technical Report. Global Energy Technology Strategy Program, Battelle, Joint Global Change Research Institute.
Durham, L.S. 2006. GOM Lower Tertiary Play. American Association of Petroleum Geologists Explorer. November 11. Available at www.aapg.org/explorer/2006/11nov/jack_play.cfm.
EIA (U.S. Energy Information Administration). 1999. U.S. Coal Reserves: 1997 Update. Available at www.eia.doe.gov/cneaf/coal/reserves/chapter1.html#chapter1b.html.
EIA. 2004. Analysis of Oil and Gas Production in the Alaska National Wildlife Refuge. Available at www.tonto.eia.doe.gov/ftproot/service/sroiaf(2004)04.pdf.
EIA. 2007. Annual Energy Outlook 2007. DOE/EIA-0383(2007). Washington, D.C.: U.S. Department of Energy, Energy Information Administration.
EIA. 2008a. Annual Energy Outlook 2008. DOE/EIA-0383(2008). Washington, D.C.: U.S. Department of Energy, Energy Information Administration.
EIA. 2008b. Assumptions to the Annual Energy Outlook 2008. DOE/EIA-0554(2008). Washington, D.C.: U.S. Department of Energy, Energy Information Administration.
EIA. 2008c. Monthly Energy Review. DOE/EIA-0035(2008/04). Washington, D.C.: U.S. Department of Energy, Energy Information Administration.
EIA. 2008d. International Energy Outlook 2008. DOE/EIA-0484(2008). Washington, D.C.: U.S. Department of Energy, Energy Information Administration.
EIA. 2008e. Annual Energy Outlook Retrospective Review: Evaluation of Projections in Past Editions (1982-2008). DOE/EIA-06403. Washington, D.C.: U.S. Department of Energy, Energy Information Administration.
EIA. 2009a. Annual Energy Review 2008. DOE/EIA-0384(2008). Washington, D.C.: U.S. Department of Energy, Energy Information Administration.
EIA. 2009b. Annual Energy Outlook 2009. DOE/EIA-0383(2009). Washington, D.C.: U.S. Department of Energy, Energy Information Administration.
Encyclopedia of Energy. 2004. St. Louis, Mo.: Elsevier.
EPA (U.S. Environmental Protection Agency). 2008. U.S. Greenhouse Gas Inventory Reports. USEPA No. 430-R-08-005. April.
EPRI (Electric Power Research Institute)–TAG. 1993. Technical Assessment Guide (TAG) Electricity Supply—1993. TR-102276-V1R7. Palo Alto, Calif.: Electric Power Research Institute.
EPRI. 2007. The Power to Reduce CO2 Emissions: The Full Portfolio. Fig. 4-3, p. 4-5, right panel. Palo Alto, Calif.: Electric Power Research Institute.
Farrell, A.E., and A.R. Brandt. 2006. Risks of the oil transition. Environmental Research Letters 1:014004.
Gibbins, J., and H. Chalmers. 2008. Carbon capture and storage. Energy Policy 36:4317-4322.
Hermann, W. 2006. Quantifying global energy resources. Energy 31(12; Sept.):1685-1702.
IEA (International Energy Agency). 2008a. Energy Technology Perspectives. Paris: IEA Publications.
IEA. 2008b. World Energy Outlook. Paris: IEA Publications.
IPCC (Intergovernmental Panel on Climate Change). 2005. Special Report on Carbon Capture and Storage. Prepared by Working Group III of the Intergovernmental Panel on Climate Change. New York and London: Cambridge University Press.
Katzer, J. 2008. Coal-based power generation with CCS. Presentation to the workshop of the Fossil Energy Subgroup of the AEF Committee, National Research Council, Washington, D.C., January 29–30.
Klusman, R.W. 2003. A geochemical perspective and assessment of leakage potential for a mature carbon dioxide–enhanced oil recovery project and as a prototype for carbon dioxide sequestration; Rangely Field, Colorado. American Association of Petroleum Geologists Bulletin 87(9):1485-1507. DOI: 10.1306/04220302032.
MIT (Massachusetts Institute of Technology). 2007. The Future of Coal: Options for a Carbon-Constrained World. Cambridge, Mass.: MIT.
NETL (National Energy Technology Laboratory). 2007a. Cost and Performance Baseline for Fossil Energy Plants. DOE/NETL-2007/1281, Revision 1. August.
NETL. 2007b. Carbon Sequestration Atlas of the United States and Canada. U.S. Department of Energy, Office of Fossil Energy. Available at www.netl.doe.gov/technologies/carbon_seq/refshelf/atlas/ATLAS.pdf.
New York Times. 2008. Natural gas prices fall as shale yields bounty. August 25.
NPC (National Petroleum Council). 2007. Facing the Hard Truths about Energy. Topic Papers Nos. 7, 19, 21, 24, and 26. Washington, D.C.: NPC.
NRC (National Research Council). 2007. Coal Research and Development to Support National Energy Policy. Washington, D.C.: The National Academies Press.
PGC (Potential Gas Committee). 2006. Potential Supply of Natural Gas in the United States. Potential Gas Agency, Colorado School of Mines. December 31. Available at www.mines.edu/research/pga/. Powerpoint slides available at www.aga.org/NR/rdonlyres/6CC4915E-D584-4B03-978A-7493E2FF2CF5/0/0709PGCSLIDES.PPT.
RAND Corp. 2008. Unconventional Fossil-Based Fuels: Economic and Environmental Trade-Offs. October. Available at www.rand.org/pubs/technical_reports/TR580/.
Ruppel, C. 2007. Tapping methane hydrates for unconventional natural gas. Elements 3: 193-199.
Shell (Shell Frontier Oil and Gas, Inc.). 2006. Oil Shale Test Project Plan of Operations. Prepared for the Bureau of Land Management. February 15. Available at www.blm.gov/pgdata/etc/medialib/blm/co/field_offices/white_river_field/oil_shale.Par.79837.File.dat/OSTPlanofOperations.pdf.
Snyder, J. 2008. Natural gas supply and demand: A widening gap: Presentation at the Electric Power Research Institute Summer Seminar. Beyond PRISM: Analysis to Action. August 4.
Stokstad, E. 2006. New particulate rules are anything but fine, say scientists. Science 311(5757):27.
USGS (U.S. Geological Survey). 1998. Arctic National Wildlife Refuge, 1002 Area. Petroleum Assessment, 1998, Including Economic Analysis. Available at www.pubs.usgs.gov/fs/fs-0028-01/fs-0028-01.htm.
USGS. 2002. Petroleum Resource Assessment of the National Petroleum Reserve in Alaska (NPRA). Available at www.pubs.usgs.gov/fs/2002/fs045-02/fs045-02.pdf.
Viswanathan, V., R. Purgert, and P. Rawls. 2008. Coal-fired power materials. Advanced Materials and Processes 166(8):47-49.
Wilson, E.J., S.J. Friedmann, and M.F. Pollak. 2007a. Research for deployment: Incorporating risk, regulation, and liability for carbon capture and sequestration. Environmental Science and Technology 41(17):5945-5952.
Wilson, E.J., M.F. Pollak, and G. Morgan. 2007b. Policy Brief: Regulation of Carbon Capture and Storage. International Risk Governance Council. Available at www.irgc.org/Expert-contributions-and-workshop.html.
ANNEX 7.A:
FOSSIL FUELS
This annex expands on selected topics presented in Chapter 7. It is not intended as a stand-alone discussion.
Fossil Fuel Supply
World Oil and Gas Reserves and Resources
The United States has some 13 percent of the world’s petroleum resource base, but only about 2 percent of global reserves. Converting resources to reserves requires new technology, with associated increases in production costs. Thus one factor that will determine whether this country can expect to exploit its resources in a significant way is whether it can convert them to reserves less expensively than can be done elsewhere in the world.
Data on the costs and technologies involved are largely unobtainable, in no small part because almost all of the world’s petroleum resources and reserves are in the hands of national oil companies. However, the limited amount of available data suggests that the U.S. resource base is relatively high cost. For example, the ratio of proved reserves to annual production in the United States is 11.9, while for the world as a whole the ratio is 40.5 (British Petroleum, 2006). In other words, the rest of the world can maintain its current production of conventional crude oil from known reserves some four times longer than the United States can. This suggests that developing the U.S. resource base is a less economically competitive proposition than is continuing to produce from large reserves elsewhere.
Table 7.A.1 breaks down the resource base and reserve-to-production ratios by region. It shows that better than 65 percent of the world’s conventional crude oil resources are concentrated in the Middle East, in non-OECD Europe (mostly in the Russian Federation), and in Central/South America (primarily Venezuela). It is in these three regions that the reserve-to-production ratio is largest. Although the estimates in Table 7.A.1 are very approximate both in magnitude and in regional distribution, it seems reasonable to draw the conclusion that the U.S. resource base is harder to develop than most of the crude oil elsewhere in the world.1
TABLE 7.A.1 Crude Oil Resources in Various Regions of the World
|
|
Percent of World Conventional Crude Oil Resources |
Reserve-to-Production Ratio in Region |
|
Africa |
5.4 |
32.1 |
|
Asia/Oceana |
6.6 |
14.0 |
|
Canada |
6.7 |
14.9 |
|
Central/South America |
10.3 |
30.2 |
|
Middle East |
39.0 |
79.5 |
|
OECD Europe |
3.5 |
8.0 |
|
Non-OECD Europe |
16.0 |
28.0 |
|
United States |
12.5 |
11.9 |
|
Source: Calculated from the data warehouse in NPC (2007). |
||
The situation with natural gas is somewhat similar, though regional data are not available. Globally, the reserve-to-production ratio for natural gas is around 60, while for the United States it is 11 (British Petroleum, 2006). Fifty-five percent of the world reserves are in Iran, Qatar, and the Russian Federation. The reserve-to-production ratio of the Russian Federation is more than 75, while the ratios both for Iran and for Qatar exceed 100.
Natural Gas Hydrates
Gas hydrates (in which a large amount of methane is trapped within the crystal structure of water ice) occur widely in marine sediments and on land in areas where temperatures are low enough to allow permafrost to exist. The presence of a methane molecule can stabilize a cage of water molecules at temperatures above the freezing temperature of water when the pressure is sufficiently high. This methane can come from biogenic sources or from thermogenic sources similar to those that generate the methane present in natural gas reservoirs. In either case, low temperatures (such as those that occur deep in the ocean or in the arctic) and high pressures (which occur at sufficient depths in either setting) are required in order for the hydrates to be stable. Because temperatures increase as the depth below the surface of sediment or land increases, hydrates are stable only for a lim-
ited range of depths. If sufficient methane is present in such settings, it will form a zone of free gas below the hydrate.
Estimates of the total hydrate resource vary widely (Ruppel, 2007). Some of the reasons for the variation include assumptions that hydrates exist throughout the stability zone when they may not, as well as assumptions that the fractions of pore space occupied by hydrate are larger than is often the case. Significant quantities of hydrate are likely to occur at relatively low concentration, which will make such resources difficult to recover at reasonable cost (Moridis et al., 2008).
Despite the uncertainties, the hydrate resource estimates are very large compared to natural gas reserves and production, though as with all estimates of a total resource, the amounts recovered at economically viable costs could be much lower. Ruppel reports that estimates of methane contained in hydrates in the Exclusive Economic Zone and the North Slope permafrost region of Alaska are about 150 times U.S. natural gas reserves and 900 times annual U.S. production of natural gas (primary sources of numerous resource estimates are also provided in Ruppel [2007]). A recently released summary of a Canadian study calls for additional research to establish whether Canadian hydrate resources are sufficient to warrant development efforts (Council of Canadian Academies, 2008).
The presence of hydrates in marine sediments can often be detected through seismic methods similar to those used to explore for oil or gas, though it can often be difficult to accurately establish how much of the hydrate is present. Seismic methods are less effective in permafrost regions on land because hydrate properties are similar to those of ice. In either case, drilling is usually required to quantify the resources.
Methane can be released from hydrates in several ways: by mining and then moving the hydrates to a zone of lower pressure or higher temperature; by recovering the methane that is released when heating the hydrates in place; by reducing the pressure; or by injecting an inhibitor (a chemical that causes the hydrates to become unstable) (see Ruppel [2007] for a more detailed description of these processes). Also, research is under way to exploit the fact that there is a thermodynamic driving force for CO2 to displace CH4 from its hydrate cage, but this process is far from field demonstration (Council of Canadian Academies, 2008).
Direct mining of hydrates is likely to be limited because of difficulties in handling the mined material and because large-scale mining would have significant environmental consequences: habitats would be disturbed both in marine sediments and on land for example. For subsurface settings, heating hydrates is energetically unfavorable because energy must be expended, not only to heat large
quantities of sediment but also to break the bonds between the hydrates’ water molecules. Inhibitor injection is likely to require significant quantities of relatively expensive chemicals, and managing subsurface flows so that the inhibitor reaches desired locations may be difficult.
As a result, pressure reduction appears to be the preferred method. One version of this process is to drill a well to release free gas that lies beneath the hydrate accumulation, thereby reducing the pressure so that additional hydrate above that zone dissociates and flows into the well. Several tests of such an approach have been performed at the Mallik site in Canada’s Mackenzie Delta (Council of Canadian Academies, 2008; Moridis et al., 2008). That well was drilled into coarse-grained sediment with relatively high hydrate concentrations. While production tests have been of limited duration, initial gas flows were favorable.
Additional environmental and safety considerations will also arise. For hydrates that occur in unconsolidated sediments, the changes in pore pressure and gas volume as the hydrate dissociates could lead to slope failure (Jayasinghe and Grozic, 2007), and a large slope failure event could result in tsunami formation. The U.S. Department of Energy (DOE) is supporting research to delineate the physical mechanisms so that safe production methods could be devised (Allison, 2000). Drilling through hydrate zones in any setting requires precautions, as recognized in current arctic drilling activities.
Whether natural gas hydrates are produced in significant quantities will depend on three issues: development of exploration methods that can establish not only the location of hydrates but also the quality of the resource; economically viable recovery methods with acceptable environmental consequences; and the availability of infrastructure for transporting recovered gas to markets. Although research is under way on these issues, it is too early to tell how successful the efforts will be. Hence any significant recovery of hydrate resources is likely to occur after (perhaps well after) 2020.
Electric Power Generation
Because extensive analyses of technologies for generating electricity from coal have been published (see, for example, MIT, 2007; IPCC, 2005; and NETL, 2007a), no attempt is made to repeat them here except to emphasize a few points related to the findings of Chapter 7. Models presented for power generation in this report
are based on those cited by the National Energy Technology Laboratory (NETL, 2007a).
Coal provides more than half of the electricity generated in the United States. The U.S. coal-based generating capacity is about 330 GW, and the average age of the coal power-plant fleet is 35-plus years (MIT, 2007). Even so, with current life-extension capabilities, the remaining service lives of many of the plants could be more than 30 years. It is currently expected that only about 4 GW of existing coal-fired generating capacity will be retired by 2030 (EIA, 2008).
Air-Blown Pulverized Coal Power Plants
Current coal plants burn air-blown pulverized coal (PC) to raise steam that drives a steam turbine. Of the more than 1000 boilers in the United States, about 100 are classed as supercritical (steam cycle up to ~3530 psi, 1050°F), with the remainder being subcritical units (steam cycle up to ~3200 psi, 1025°F). New U.S. plants built by 2015 are expected to be mostly supercritical, and advances in high-temperature materials could make ultrasupercritical PC units (perhaps exceeding temperatures of 1400°F) the norm after 2020.
Oxygen-Blown Coal Plants
One of the fundamental challenges in capturing the CO2 produced by air-blown coal plants is the large amount of nitrogen in the flue gas, which reduces the concentration and partial pressure of the CO2. If oxygen (~95 mole percent) is substituted for air in pulverized coal combustion, the nitrogen is largely eliminated, thereby raising the partial pressure of CO2 in the flue gas and allowing it to be compressed after required cleanup for pipeline transport to an injection facility. This is called the oxyfuel process.
Alternatively, oxygen can be used to partially oxidize the coal in a gasifier to produce synthesis gas (CO+H2) in an integrated gasification combined-cycle (IGCC) plant. After a further shift reaction with water to produce CO2 and additional H2, the CO2 can be economically separated without combustion in a high-pressure stream and then readily compressed for transport through a pipeline and, finally, geological injection. This process is called oxygen-blown gasification.
Without carbon capture, both oxyfuel PC and oxygen-blown IGCC are more expensive than is a supercritical PC plant of a comparable size; but with carbon capture (assumed to be 90 percent), their cost is predicted to be somewhat lower than that of the supercritical plant (MIT, 2007).
Cost Estimates and Underlying Assumptions
Figures 7.4 to 7.6 are based on plants with a nominal capacity of 550 MW and a capacity factor of 0.85. The capacity factor times the rated power (output at full power, or capacity) equals the average power. A capacity factor of 0.85 means that the plant’s annual output (kWh) is equivalent to the output of the plant running at its full capacity for 7446 instead of 8760 hours per year. Even a baseload power plant has less than 100 percent capacity factor because it is shut down occasionally for maintenance and because at some times (e.g., when power is very inexpensive) it simply does not run or runs at less than full power.
Here, the committee considers the differences between “dispatch cost” and “levelized cost” of electricity. Dispatch cost is the sum of variable operation and maintenance (O&M) cost, fuel cost, cost for CO2 disposal, and cost for CO2 emissions. Levelized cost is dispatch cost plus cost of installed capital plus cost of fixed O&M. In the Princeton Environmental Institute (PEI) work discussed earlier, total O&M (fixed plus variable) is assumed to be 4 percent per year of the total plant costs (TPC). The cost of installed capital (calculated using the Electric Power Research Institute [EPRI]-TAG methodology (EPRI-TAG, 1993), which assumes an owner’s cost of 10 percent of TPC, a 55 percent:45 percent debt:equity split, and real costs of debt and equity capital of 4.4 and 10.2 percent per year, respectively) is 14.38 percent of the total plant investment (TPI), where TPI is the sum of TPC and the allowance for funds during a 3-year construction period (allowance for funds used during construction, or AFDC). AFDC is assumed to be 7.16 percent of TPC. As a result, cost of installed capital is 15.41 percent of TPC per year, or nearly four times total O&M.
Consider the costs of a new pulverized coal, CO2 vented (PC-V) plant and a new pulverized coal with carbon capture and storage (PC-CCS) plant, as estimated in the PEI model used here and assuming that all O&M is variable O&M. At $0 per tonne CO2, the dispatch costs are $24.5/MWh and $45.0/MWh, respectively. The three components of the dispatch cost are as follows: The O&M costs are $8.7/MWh and $15.9/MWh, respectively, reflecting the estimate that adding CCS will nearly double the total overnight plant cost—from $890 million ($1625/kW) to $1.62 billion ($2960/kW). The contribution of the fuel cost to the dispatch cost is $15.7/MWh for the venting plant and $22.6/MWh for the CCS plant. The fuel cost for the CCS is about 50 percent higher, reflecting the large energy consumption with today’s post-combustion capture technology. Finally, the CCS plant is assumed to have paid for the pipelines and disposal wells required
for disposal, even when the actual price for CO2 emissions is zero; the CCS plant pays $6.3 per tonne CO2, or $6.5/MWh, for CO2 disposal.
The LCOE includes the capital costs, are noted above as being nearly in the ratio of 2:1. They are $33.6/MWh for the venting plant and $61.3/MWh for the CCS plant. As a result, the LCOE in the absence of a price on carbon is $58.1/MWh for the venting plant and $106.2/MWh for the CCS plant. These data are plotted in Figure 7.5.
With a $50/tCO2 price added, the venting plant pays an extra $41.5/MWh for its emissions. The CCS plant, because it still emits some CO2, incurs a cost of $8.5/MWh for its uncaptured emissions. Adding in these emissions costs, the dispatch cost for the venting plant becomes higher than that of the CCS plant, $66.0/MWh versus $53.5/MWh. However, the LCOE for the venting plant is less than that of the CCS plant, $99.6/MWh versus $114.8/MWh. The LCOE values are plotted in Figure 7.6. The crossover price of CO2 for the LCOE is about $70 per tonne CO2, somewhat above the $50 per tonne CO2 price whose associated cost estimates are reported in Figure 7.6. For IGCC plants, however, both the dispatch cost and the LCOE for the venting plant are higher than for the CCS plant at $35 per tonne CO2.
Carbon Capture Strategies
There are three broad classes of CO2 capture strategies.
-
Post-combustion (end-of-pipe) capture from flue gas, after combustion in air. The concentration of CO2 in the exhaust-gas stream ranges from 3–5 percent for gas turbines to 12–15 percent for coal-fired boilers. Nitrogen makes up most of the remainder of the flue gas (small amounts of other contaminants are also present).
-
Post-combustion with hardly any nitrogen present, either because combustion has occurred in oxygen or because of “chemical looping,” in which the oxygen is provided by a regenerated metal oxide.
-
Precombustion capture, built on oxygen-blown gasification. For gasification plants in which CO2 capture is the objective, air-blown gasification is typically not used because capturing CO2 from a CO2-N2 gas mixture after gasification but before combustion would add considerable cost. Even when there is no CO2-capture objective, oxygen-blown gasification is usually chosen at IGCC plants; even though there are additional costs for oxygen production, they are outweighed by the savings imparted by smaller gasifiers and downstream components.
An overview of these capture strategies is shown in Figure 7.A.1. All three are available, in principle, for all hydrocarbon sources, but relative costs differ, as do the energy-conversion routes that are favored. Gasification is probably the most competitive for high-rank coals, but this may reflect the lack of investment thus far in the development of gasifiers for low-rank coals. Petcoke is similar to a high-rank coal. Biomass may be co-fired with coal or petcoke, but to gasify a combination in which biomass represents a significant fraction of the total thermal input, there may need to be a separate biomass gasifier with its own feed-handling strategies.
CO2 capture from natural-gas-fired power plants can be accomplished using any of the three strategies. One proposed project design features autothermal reforming of natural gas to make hydrogen, with combustion of the hydrogen
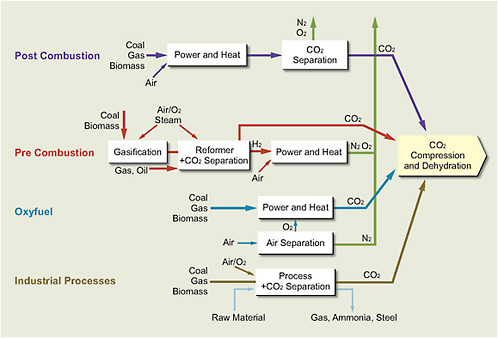
FIGURE 7.A.1 Options for capture of CO2from flue-gas and process streams.
Source: IPCC, 2005.
to produce electric power and use of the CO2 separated from the hydrogen to increase oil production.
The committee elaborates below on CO2 separation, oxygen production, co-capture of CO2 and other pollutants, and CO2 compression.
CO2 Separation
The first step in CCS is CO2 capture from a gas mixture. CO2 is currently separated at commercial scale where H2 is generated from natural gas for petroleum-refining processes or for the manufacture of ammonia. However, the capture of CO2 from large power plants has not yet been demonstrated. Commercial precombustion separation is typically based on physical adsorption in solvents (Selexol, Rectisol), while post-combustion separation involves chemical absorption (amines). Adsorption on solids such as activated carbon has also been demonstrated, but typically at small scale. Cryogenic and membrane separations are development frontiers. Selectivity and throughput rate are critical, though CO2 purity can be much lower than in relatively demanding applications such as food production.
Typical separations have significant energy requirements, which are reflected in their costs. In chemisorption in an amine, for example, the gas mixture contacts the liquid-amine solution and CO2 transfers to the liquid and reacts with the amine molecules, which releases significant amounts of heat. Nitrogen and other components remain in the gas phase, which is separated physically from the liquid. The amine solution containing CO2 is then heated to release the CO2. The combination of heat-transfer requirements and energy required to remove the CO2 from the amine is a significant component of the cost of the separation.
In some settings (ammonia manufacturing, hydrogen production, and natural gas processing, for example), the CO2 separation must be performed in order to make the product; thus the incremental cost of separation is zero. In others (electric power generation or cement, iron, or steel production), incremental separation costs are significant, and the requirements for energy to accomplish the separation lead to significant reductions in the overall thermal efficiency of the power plant.
Oxygen Production
Two of the three strategies described above (gasification and oxyfuels) involve an oxygen input, and the cost of oxygen is a significant component of the total cost. The oxygen demand with oxyfuels is about three times higher than with gasifica-
tion, as complete combustion is required for oxyfuels, but only partial combustion is needed for gasification.
Extensive R&D programs are under way to find lower-cost sources of commercial oxygen than the conventional route of cryogenic separation. In particular, membrane separation at high temperature (using an ion-transport membrane) is an area of intense development. With high-temperature separation in place of cryogenic separation, optimizing thermal management would lead to reconfiguration of the capture plant.
Co-capture of CO2 and Other Pollutants
Co-capture and co-storage of other gases with the CO2 is a strategy that could potentially lower the costs of CCS by reducing the costs of pollution control aboveground. Sulfur co-capture as H2S in precombustion systems and as SO2 in post-combustion systems is straightforward technically because solvents used to capture CO2 have similar affinities for H2S and SO2. However, depending on the location of the storage site, when H2S is present, the licensing of transportation and storage of gas mixtures will inevitably be more complicated than the licensing of CO2 alone. In Alberta, Canada, at about 30 locations, H2S and CO2 are removed together during the preparation of wellhead natural gas for insertion into the grid; they are co-stored belowground with extreme attention to safety because of the toxicity of H2S. The CO2 and H2S are separated simultaneously at the Dakota Gasification Plant, and that mixture (containing about 97 percent CO2, 1 percent H2S, and small amounts of hydrocarbons) is transported by pipeline for injection at the Weyburn Field in Saskatchewan in a project that combines enhanced oil recovery (EOR) and CO2 storage.
CO2 Compression
By convention, the capture cost includes all incremental costs required to produce CO2 at high pressure at the plant gate. The high pressure is needed for transportation (volumes of CO2 are impractically large at low pressure) and for subsequent injection into porous geological formations 1 km or more below the surface. The costs of CO2 compression include both the capital cost and the operating cost of the compressor, which is an internal load that reduces marketable output. CO2 compression is a significant component of the combined capture and compression system cost, though compression costs are often less than separation costs.
Most applications at present in which CO2 is separated commercially do not require CO2 compression. For example, CO2 for the food industry is useful at atmospheric pressure, and CO2 separated from natural gas is vented at atmospheric pressure as well. Typical gasifiers, however, operate at high pressure (on the order of 60 bar). Therefore, a system optimization for CCS may exist that is based on separation of CO2 at elevated pressure.
Effect of Carbon Capture on the Cost of Electricity
Design studies indicate that the addition of carbon capture and compression can have a significant effect both on the efficiency and on the cost of power plants. The largest source of efficiency reduction for air-blown PC is the energy required to recover the CO2 from the amine solution (binding to the amine must be strong to capture CO2 efficiently from a low-partial-pressure flue-gas stream). To compensate for this efficiency loss, corresponding increases in unit size and fuel-feed rate would be needed for the same power output. All in all, adding carbon capture to a new plant raises the total cost of electricity substantially, as seen in Figure 7.5. Further research, however, should lower many of these incremental costs. For example, it has been estimated that improvements in the technology of post-combustion carbon capture could reduce the cost of the PC-based alternative by 20–30 percent (MIT, 2007).
Other factors affecting the relative costs of electricity from PC and IGCC plants are coal type and quality. In general, coal type and quality will have greater effects on an IGCC system than on a PC system (MIT, 2007). IGCC functions best with dry high-carbon fuels such as bituminous coals and coke. Coals with high moisture content and low carbon content are most efficiently combusted in a PC unit. On the other hand, IGCC has inherent advantages for controlling emissions of criteria pollutants; cleanup can be accomplished at high pressures in the synthesis gas rather than at low pressures in the flue gas (MIT, 2007). Thus the future tightening of regulations on emissions of criteria pollutants such as mercury could favor IGCC.
Uncertainties in the Mix of New Coal Versus Natural Gas Generation
The uncertainties associated with building new coal plants (outlined in the section titled “Future Coal Power”) and those for natural gas electric power generation (outlined in the section titled “The Competiveness of Natural Gas”) have already led to significant increases in new natural-gas-fired plant capacity in the
United States, notably in the 2000–2004 period. For example, 60 GW of new natural gas capacity (peaking plus baseload) was added in 2002. However, over that same period, the real price of natural gas also grew by a factor of four; this price increase was enough to make electricity from gas-fired plants cost more than that from coal. Moreover, in many regions there was surplus electricity capacity, and electricity prices were not high enough to make natural gas generation economic. As a result, natural gas combined-cycle (NGCC) units averaged only about a 40 percent capacity factor in 2007 compared to well over 70 percent in 2002 (C. Bauer, NETL, personal communication). Natural gas prices experienced an increase in 2008 followed by a rapid decrease as the decline of economic activity reduced demand for natural gas. That variability in natural gas prices is the reason for the use of a wide range of natural gas prices in our analysis of the cost of producing electricity with natural gas.
As noted in the section “Natural Gas,” there are significant interacting uncertainties regarding the future availability of natural gas, including unconventional sources such as gas shales; potential reductions in demand for electricity due to improvements in energy efficiency or increases in demand due to use of more electricity for transportation; the availability and cost of LNG on the world market; and the details of future regulation and price of CO2 emissions. All of these factors and their inherent uncertainties will influence the future mix of new coal and natural gas electric power generation, and the uncertainties make it unlikely that precise forecasts of the energy mix made now will be accurate.
Assumptions Used in Developing Electricity Supply Curves
Here the committee provides more detail on the assumptions behind the supply curves in Figures 7.10 and 7.11 in particular and behind supply curves in general. Levelized costs of electricity ($/MWh) are needed; for new plants the data from Figures 7.5 and 7.6 and related calculations are used. Also needed are assumptions about the retirement rates of existing U.S. plants powered by coal as well as by other resources. One should expect the retirement rate to increase with the CO2 emission price. Six competing baseload fossil-fuel power technologies are considered here: PCs, IGCCs, and NGCCs, with and without CCS. The time periods are 2010–2020, 2020–2035, and 2035–2050.
To develop supply curves for fossil-fuel power, one could explore at least the following five hypothetical choices:
-
Either the United States successfully implements a CO2 mitigation strategy that results in a price for CO2 emissions from power plants by 2020, and the price remains through 2050, or the United States has no effective CO2 price. If there is a price, the committee alternately considers $50 per tonne CO2 and $100 per tonne CO2.
-
Either CO2 storage is successfully launched at coal- and natural gas-fired power plants by 2020, with the resulting cost increments for power shown in Figures 7.5 and 7.6, or CCS does not succeed, resulting in cost increments for CCS storage several times higher than those shown in these two figures.
-
Either the natural gas price remains near $6.00/GJ ($6.33/million Btu), or it rises to and remains near $16.00/GJ ($16.88/million Btu).
-
Either the retirement rate at existing coal plants is negligible, or it is 3 percent per year after 2020.
-
Either the coal price remains at the low price assumed in Figures 7.5 and 7.6, or it becomes significantly more expensive.
Among the additional modeling choices, perhaps the most critical are the rates of reduction in capital costs resulting from experience and R&D. (For example, will the DOE’s research program succeed in greatly reducing CCS incremental costs relative to those assumed in this chapter?) Build rates for CCS plants also need to be estimated, taking into account the availability of suitable storage locations. And regional analysis can underpin national analysis when it comes to retirement rates, fuel costs, and storage capacity.
Ultimately, to develop a view of actual deployment, supply curves must be joined with demand curves. In so doing, one must decide how demand for power, both at the regional and at the national level, will develop for each of the many alternative futures just described.
As an illustration of how build rates might affect supply curves for 2020 and 2035, consider Figure 7.10 and Figure 7.11, respectively. The committee assumes that 10 GW of coal+CCS facilities are built between now and 2020 as part of a CCS evaluation period; it also assumes that during this period no traditional coal units without carbon capture are built, given that the industry is awaiting certainty in climate policy. NGCC plants without CCS are assumed to be unaffected by such uncertainty. After 2020, coal plants either with or without CCS are assumed to be capable of being built at rates of 15 GW/yr if they are economically
competitive and there is sufficient demand. The corresponding assumption for NGCC plants, with and without CCS, is 36 GW/yr. These figures are 33 percent higher than are historic rates during the peak building periods of 1969–1984 for coal plants and 2001–2004 for NGCC plants. Potential build rates for use in supply curves should be higher than actual build rates, which are affected by competition from other energy sources.
The committee takes capital costs of coal and CCS facilities to remain unchanged over time, using the costs in Figures 7.5 and 7.6 as a base, which means that the illustrative curves can certainly not be considered forecasts. Given the closeness of the cost estimates for PC+CCS and IGCC+CCS in Figures 7.5 and 7.6, the committee considers one generic coal+CCS facility rather than treating PC and IGCC separately. Only the case when coal is inexpensive and natural gas is costly (new plants face $1.71/GJ coal and $16/GJ natural gas) is considered, and there are no retirements.
The results for 2020, presented in Figure 7.10, show a typical staircase supply curve that highlights the large disparity between the costs of existing coal plants and those of other fossil-fueled electricity technologies, should coal prices remain low. Note that the consumption of electricity is determined by the intersection of the supply curve with a downward-sloping demand curve (not shown), which can be influenced by many factors, including policies related to energy efficiency. Actual consumption of fossil-fuel electricity in 2020 could be greater than or less than current consumption of electricity generated from fossil fuels. The X-axis of Figure 7.10 is arbitrarily cut off at a value higher than any plausible 2020 demand for baseload fossil-fuel power.
The results shown in Figure 7.11 continue the hypothetical analysis out to 2035. Three supply curves are shown, corresponding to three prices on CO2 emissions: $0 per tonne CO2, $50 per tonne CO2, and $100 per tonne CO2. At $100 per tonne CO2, but not at $50 per tonne CO2, new coal+CCS plants and—at very high electrical demand—even considerable numbers of NGCC+CCS are built. The cost of electricity across the range of power-production technologies therefore varies with the price of carbon. The variation is large enough to significantly move the cost break-even points among technologies.
Hypothetical supply curves such as those illustrated in Figures 7.10 and 7.11 can be used to explore the effect of different modeling assumptions and policy choices on total CO2 emissions, as seen in Figure 7.A.2. The amount of CO2 that would be emitted in 2035 is plotted for four cases. The base case has the coal price used in Figures 7.5 and 7.6, a CO2 emissions price of $100 per tonne CO2,
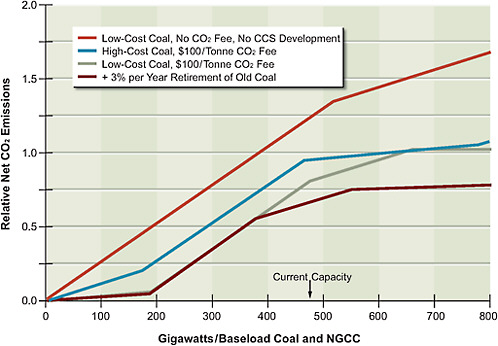
FIGURE 7.A.2 CO2emissions from baseload fossil plants in 2035 relative to 2008 emissions as a function of baseload fossil electricity consumed in 2035. (High natural gas price and CCS successful, unless otherwise stated.)
and no retirements of existing coal plants. In each of the other cases, just one of these assumptions is changed: (1) has a higher coal price—$100 per tonne, or about $3.70/million Btu; (2) has a CO2 emissions price of zero; and (3) has a 3 percent per year retirement rate beginning in 2020.
The highest emissions curve in Figure 7.A.2, as expected, is for the case corresponding to the lowest supply curve of Figure 7.11, which has no price on CO2 emissions. In the other three cases, where the CO2 price is $100 per tonne CO2, the total emissions never rise above current levels.
Note that this high-emission curve passes above 1.0 at the point on the power axis below that corresponding to today’s current capacity. Indeed, if total demand for fossil fuel in 2035 were the same as today, the mix of coal and natural gas in power production would shift toward coal because new coal plants outcompete existing natural gas plants, given the assumed high price of natural gas and the absence of a price on CO2 emissions.
The curve labeled “High-Cost Coal, $100/Tonne CO2 Fee” in Figure 7.A.2
lies mostly above the curve labeled “Low-Cost Coal, $100/Tonne CO2 Fee.” One might have expected low-cost coal to bring about greater use of coal, and indeed it does, but the coal power that is encouraged by a low coal price and a $100 per tonne CO2 price is coal power with CCS, and it is displacing natural gas power without CCS (which has higher emissions). As a result, greater competitiveness of coal in this instance means lower CO2 emissions.
Once again, Figure 7.A.2 says nothing about how much fossil-produced electricity will actually be consumed in the target year 2035; that amount depends on the intersection point between the supply curve and an efficiency-dependent demand curve.
Clean Coal Research Plan and Deployment Schedule
Largely through the DOE, this country annually spends about $744 million on research, development, and demonstration (RD&D) for advanced coal technologies related to power generation. The research is wide ranging and dynamic. For example, on July 31, 2008, the DOE announced that $36 million would be awarded to 15 projects aimed at developing advanced carbon-capture technologies for the existing fleet of coal-fired power plants. Technologies involved included membranes, solvents, solid sorbents, oxycombustion, and chemical looping (www.netl.doe.gov/publications/press/2008/08030-CO2_Capture_Projects_Selected.html). Figure 7.A.3 shows that these technologies are expected to enable continued reductions in the cost of carbon capture over the next 20 years.
A recent review of the DOE’s coal RD&D program (MIT, 2007) stressed the importance not only of research on innovative emerging technologies but also of government funding for first-of-a-kind commercial-scale demonstration projects. The AEF Committee notes that at this writing the DOE’s program is being redefined. The committee judges that demonstrations of CCS integrated at the scale of a large power plant are important, as is continued R&D to improve separation technologies such as those listed in Figure 7.A.3.
Figure 7.A.4 shows one example of a timetable for RD&D for advanced coal technologies (involving both improved efficiency and carbon capture and storage) proposed by EPRI, which judges the timetable to be aggressive but achievable. For pulverized-coal plants, steady improvements in materials are projected to enable higher boiler and turbine temperatures and pressures; improvements in oxygen separation and post-combustion gas-separation membranes could enable ultrasupercritical designs with post-combustion CCS to be demonstrated at scale
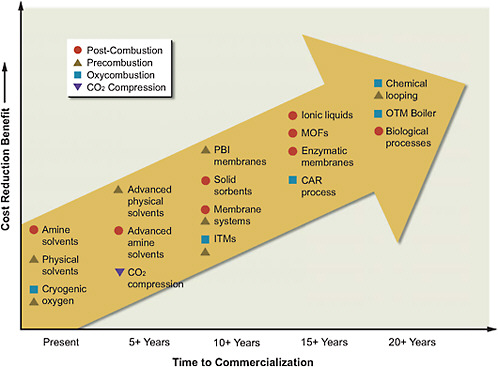
FIGURE 7.A.3 Assessment of the estimated time to deployment of various carbon-capture technologies.
Note: CAR = ceramic autothermal recovery; ITM = ion transport membrane; MOF = metal organic framework; OTM = oxygen transport membrane; PBI = poly[2,2’-(m-phenylene)-5,5’-bibenzimidazole].
Source: Bauer, 2008.
by 2025. For integrated gasification combined-cycle plants, improved gasifiers, precombustion gas-separation technologies, hydrogen turbine developments, and chilled ammonia methods of carbon capture could enable IGCC plants with CCS to be demonstrated by 2025. Integrated gasification fuel-cell plants, which could improve efficiency over gas turbines, could be demonstrated by about 2030. Finally, CCS could be fully demonstrated by about 2020, but three to five large-scale demonstration plants would be necessary to give vendors, investors, and private industry the confidence that the advanced technologies can be built and operated under normal commercial terms and conditions. While these specific
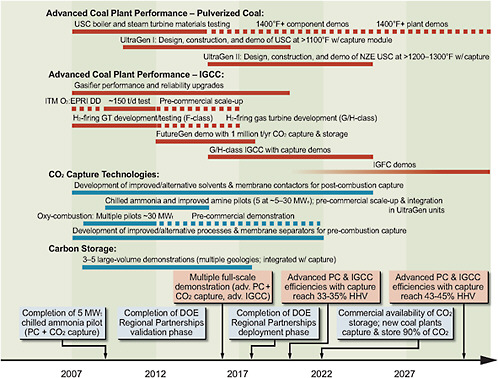
FIGURE 7.A.4 One proposed research, development, and demonstration timetable for clean coal technologies.
Source: EPRI presentation at the AEF Committee’s fossil fuels workshop, 2008.
recommendations differ somewhat from the committee’s estimates presented in Chapter 7 that about 10 GW of coal-fired electric power generation with CCS could be installed by 2020, they reflect a common view that there is a need to move to demonstration of CCS at large scale.
EPRI has estimated that the cumulative cost of the identified RD&D program would be $8 billion by 2017 and $17 billion by 2025, which is consistent with an earlier estimated need of $800–850 million per year (MIT, 2007). While many research projects are involved, the costs are dominated by the need to acquire years of experience with large-scale demonstration projects, both regard-
ing advanced generation technologies and CCS. Further, it is necessary to initiate these projects immediately in order to meet the timetable in Figure 7.A.4. Major nontechnical challenges must also be addressed before carbon storage can become a reality, including development of appropriate regulations, resolution of legal issues—largely having to do with ownership of reservoirs and liability in case of leakage—and incorporation of appropriate monitoring regimes.
Geologic Storage of CO2
A brief review of the case for rapid commercialization of CCS may be found in Sheppard and Socolow (2007). Three principal storage settings are being considered: oil and gas reservoirs; deep formations that contain salt water (saline aquifers); and coal beds too deep to be mined (see Figure 7.A.5). Varying amounts of
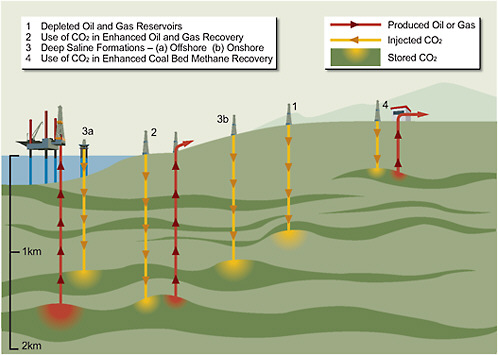
FIGURE 7.A.5 Overview of carbon dioxide capture and storage.
Source: IPCC, 2005, Fig. SPM.4.
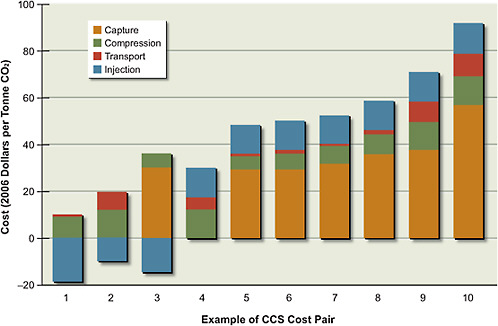
FIGURE 7.A.6 Component costs for the storage systems listed in Figure 7.14.
Source: Dooley et al., 2006.
testing of all three settings have been done. Use of basalt formations and organic-rich shales has been proposed, but neither has been tested in the field (Dooley et al., 2006; NETL, 2007b). And while sedimentary rocks that might be suitable for CO2 injection are widespread, not all locations would be appropriate. Storage in saline formations and coal beds will also require seal formations above the storage formation that prevent vertical migration of the CO2 to the surface. Appropriate sites will have to be selected that have sufficient pore space available and that have rock properties that allow the CO2 to be injected at a reasonable rate.
Figure 7.A.6 shows estimates of the cost components of CCS for various sources, sinks, and geographic distances between them. Note that there is no single homogeneous “CCS technology” or situation; economic viability will depend on specific source and sink characteristics. For situations in which the CO2 is already separated (natural gas processing, H2 production, or ammonia production, for example), the incremental separation cost is zero. About 6 percent of U.S.
emissions of CO2 come from high-purity sources of this sort (Dooley et al., 2006), which provides opportunities for testing geologic storage at significant scale without requiring additional separations or constructing new power plants. In the limited instances where those sources are relatively close to locations at which EOR might be undertaken, the net cost of storage could be negative, as the revenue from oil sales would likely exceed the cost of storage. At coal-fired power plants, the largest sources in numbers and total emissions of CO2, the cost of CO2 capture typically exceeds the estimated costs of compression, transportation, and injection into the subsurface.
Dooley et al. (2006) estimated CO2 capture costs ranging from zero (for plants that already separate a high-purity CO2 stream) to $57 per tonne CO2 (for a low-purity natural gas-fired combined-cycle power plant), and compression costs of $6–12 per tonne CO2. Transportation costs were estimated to range from $0.2 to $10 per tonne CO2, with the low-cost end of the range being for large-volume pipelines. Geologic storage costs are also likely to vary with the specific application. Dooley et al. estimated costs of minus $18 to plus $12 per tonne CO2 for saline aquifer, EOR, and enhanced coal bed methane-injection projects, with the negative- and low-cost estimates applicable when cost recovery through sale of hydrocarbons is possible. Costs that are roughly consistent with these numbers are reported in the IPCC Special Report on Carbon Capture and Storage (IPCC, 2002), when corrections to translate 2002 costs to 2006 are made.
The forgoing estimates of potential costs of storage are “bottom-up,” based largely on engineering estimates of expenses for transport, land purchase, drilling and sequestering, and capping wells. However, quantified factors based on engineering analysis may represent a lower bound on future costs. Uncertainty in the regulatory environment created by public resistance to CCS could result in costly delays in implementation at the project level, both during the demonstration phase over the next decade and even when CCS has attained full commercial-scale operation (Palmgren et al., 2004; Wilson et al., 2007; IRGC, 2008). Extra costs could be incurred at a given project site because of interruption of operations even at a different site, given that the technologies, monitoring, and regulation of storage are likely to be closely related across sites. Costs usually not taken into account also result from the likely need to secure storage rights a very large amount of belowground space for the lifetime of a facility (Socolow, 2005).
One feature of CCS that improves the odds of deployment evolving without major disruption is that many of the early CCS projects will be EOR projects. They would likely be located where the general population is already familiar with
and tends to be positively disposed toward the oil and gas industry, and where there will be revenue streams of benefit to all royalty holders, including local and state governments (Anderson and Newell, 2004).
Risks associated with storage are often handled uneventfully in the normal course of events, with smooth and reliable licensing, operation, and monitoring that make for minimal regulatory delays. Carbon dioxide is routinely transported long distances, injected underground, and stored at present without much attention from either the public or policy makers. Similarly, natural gas and chemical storage are longtime facts of life (Reiner and Herzog, 2004), and serious accidents and leaks do not threaten operations, at least not on an industry-wide basis. But counterexamples, from Bhopal to Three-Mile Island to Yucca Mountain, are easily cited as well. In short, public reaction is unpredictable.
Oil and Gas Reservoirs
Most of the experience in CO2 injection into the subsurface comes from oil fields. High-pressure CO2 has been used for more than three decades for enhanced oil recovery (EOR), with the largest operations being in west Texas. Most of the CO2 injected for EOR has come from natural underground CO2 sources rather than anthropogenic sources, but some has been obtained from natural gas processing operations that remove CO2 from the gas prior to sale.
Oil and gas reservoirs trap buoyant fluids that would otherwise escape to the surface, and hence the formations above the porous zones that contain the oil and gas should prevent vertical migration of CO2 as well. While similar principles apply to injection of CO2 into gas reservoirs, experience there is much more limited because the combination of gas prices and CO2 costs has not favored enhanced gas recovery using CO2. A test is currently under way, however, in the K12B gas reservoir in the Netherlands (IPCC, 2002).
In an oil- or gas-production operation, two key measures are critical: the amount of recoverable hydrocarbons, and the production rate per well. The analogy for CO2 storage or disposal is to determine the total mass of CO2 that can be injected into a target formation and the injection rate per well.
As an example, the Weyburn Field in Saskatchewan is injecting 95 million cubic feet per day of anthropogenic CO2 (from the Great Plains Synfuels Plant in North Dakota) into 37 wells (IPCC, 2005). This field has a total hydrocarbon volume of 1.4 billion barrels, of which 330 million had been produced—about 23 percent of the original oil in place—at the time CO2 injection commenced. It is
anticipated that about 20 million tonnes of CO2 will be injected and become permanently stored some 1400 m (4600 ft) underground over the 25-year lifetime of the EOR project (expected to produce an additional 130 million barrels of oil).
The Great Plains Synfuels Plant, constructed in 1984, produces a variety of feedstocks from coal for products that include fertilizer, pesticides, gasoline, resins, krypton and xenon gases, and liquid hydrogen, in addition to the carbon dioxide that is sold to the Weyburn Field for EOR. Over its lifetime, the Weyburn Field project will inject about one-third of the concurrent CO2 output of a 1000 MW coal plant.
Other currently active EOR projects using CO2 from natural underground sources have original-oil-in-place volumes ranging from about 40 million to 2 billion barrels and CO2 injection rates of 50–100 million cubic feet per day (3000–5000 tonnes CO2 per day). Typically, existing production wells can be transformed into injectors at less than the cost of drilling the new wells that would be required for sequestration in a saline aquifer. Also, EOR projects offset the injection costs with revenue from produced oil.
Using CO2 for EOR has obvious benefits, but project locations, injection rates, and service lives may not be sufficient for EOR, by itself, to accommodate the lion’s share of CO2 emissions from power plants. Although there is far more capacity for storing CO2 in saline aquifers, wherever storage through EOR is possible it should prove very attractive, given the potential for cost recovery and the use of at least a portion of an existing infrastructure within the oil fields.
Saline Aquifers
Saline-aquifer storage is expected to be the workhorse storage option in the United States (Dooley, 2006). Saline-aquifer storage has also been tested in the Sleipner Field of offshore Norway at a scale similar to that of the Great Plains example (IPCC, 2005). The Sleipner Field produces natural gas that contains CO2, which is separated from the natural gas and reinjected into the very large Utsira Formation, which is sandstone. Because that formation has high permeability (fluids flow relatively easily through the rock), only one injection well is required to handle about 1 million tonnes per year of CO2 (2700 tonnes per day). Seismic evidence collected periodically indicates that the CO2 has been contained in the Utsira Formation. While there is enough experience to date to indicate that CO2 injection into formations that contain salt water can be undertaken, the combination of technologies required to store CO2 from a large coal-fired power plant has not yet been demonstrated at sufficient scale.
Coal Beds
Coal-bed storage is the least well understood of the three main storage options. The mechanism depends on the fact that CO2 adsorbs onto coal surfaces, and it does so more strongly than does methane. In 2005 coal-bed methane production was 1.7 Tcf, about 9 percent of U.S. natural gas production (http://tonto.eia.doe.gov/dnav/ng/ng_enr_cbm_a_EPG0_r52_Bcf_a.htm). In a typical coal-bed methane project, water is removed to reduce pressure, and the methane released from the coal at the lower pressure flows through fractures in the coal to producing wells. CO2 injected into a fractured coal bed replaces adsorbed methane, which creates the possibility of enhanced coal-bed methane production using CO2. While some coals can take up significant quantities of CO2, flow through the coal becomes more difficult as the CO2 adsorbs. Injection of CO2 into a coal bed was tested at the Allison Unit in New Mexico, where significant permeability reductions were observed (IPCC, 2005). More testing will be required at various scales before significant storage in coal beds is likely to occur.
Retention of CO2in the Subsurface
Subsurface formations that are appropriate for CO2 storage will have rock layers above the storage zone that do not permit vertical flow. Those seal rocks, often shales or evaporites, will be needed to isolate the injected CO2 from the near-surface region for an extended period during which several physical mechanisms act to immobilize the CO2. When CO2 dissolves in brine, for example, the resulting mixture is slightly denser than brine alone, and hence the driving force for upward migration of the CO2 disappears, and the flow of the CO2-laden brine away from the CO2 zone helps dissolve the CO2 more quickly than it would by diffusion alone. When brine invades areas formerly occupied by CO2 as it dissolves, trapping of the CO2 as isolated bubbles occurs. These bubbles cannot move under the small pressure gradients present. Dissolution and trapping happen on timescales that range from centuries to a few thousand years, depending on the permeability of the formation (Riaz et al., 2006; Ide et al., 2007). On longer timescales (multiple thousands of years) chemical reactions can convert some of the CO2 to solid materials, depending on the composition of the brine and the minerals present in the rock.
Safe operations of storage sites will require that the amount of CO2 allowed to escape from the deep storage zone to the near-surface environment be very small. Oil and gas reservoirs provide an example of the kind of storage settings
that retain buoyant fluids for geologic time periods. Nevertheless, it is possible that some storage sites might leak, and hence the quantitative impact of leakage has been assessed. Based on IPCC emission scenarios, Hepple and Benson (2005) argue that overall rates of leakage less than 0.01 to 0.1 percent annually of the total amount stored would be sufficient to allow CCS to contribute effectively to the stabilization of CO2 concentration in the atmosphere, depending on the target. If leakage occurs, it is more likely to happen relatively early in the life of a storage site, when pressures are highest around an injection well. Wells are the most likely leak path, but well leakage is readily detected and can be repaired.
Careful attention to leakage hazards will be required in any CCS project. At low concentrations in air, CO2 is not dangerous. It is a normal component of air, and large power plants currently emit millions of tonnes per year directly to the atmosphere. At high concentrations, however, it is an asphyxiant and is toxic. A concentration of 4 percent CO2 is immediately dangerous to health, and the NIOSH and OSHA exposure limits (NIOSH, 1996) are 5000 ppm (0.5 percent). Because CO2 is denser than air is, designing and monitoring CO2 pipelines and wells to make sure that leaking CO2 does not collect in low-lying areas is essential. Storage security generally increases with time after injection ceases (IPCC, 2005), as the highest subsurface pressures relax, as CO2 dissolves in brine, and as trapping of CO2 occurs. Monitoring schemes such as those used at Sleipner and other field tests (Chadwick et al., 2008; Daley et al., 2008) can be used to determine whether the CO2 is remaining isolated from the surface over time.
Nontechnical Issues with CCS
Whichever of the three main options are used, significant regulatory issues will have to be addressed if geologic storage is to be undertaken on a large scale. These issues include long-term ownership of the CO2, liability exposures over time, requirements for the monitoring of storage sites, and regulations for safe operation. Figure 7.A.7 outlines the decision points associated with the life cycle of a storage facility. For a detailed discussion of the many issues that arise in site selection and project design and implementation, see Chapter 5 of IPCC (2005).
Site screening will include matching of potential CO2 sources and sinks, with appropriate attention to the feasibility of separating the CO2 and transporting it to the storage location. Similarly, attention must be given to understanding the subsurface characteristics: in particular, the potential storage capacity, the permeability of the formation (which will control injection rates and pressures), the
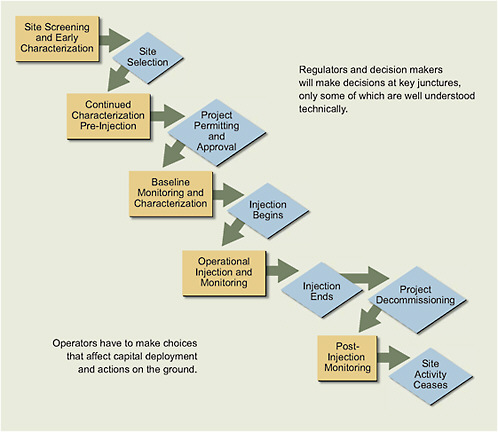
FIGURE 7.A.7 Key steps in the implementation of a large-scale CO2storage project.
Source: J. Friedmann, presentation at the AEF Committee’s fossil fuels workshop, 2008.
existence of appropriate barriers to vertical flow, and the absence of likely leak paths. Once potentially appropriate source/sink combinations have been identified, additional effort—including more detailed study of the properties of the geologic formation, the drilling of one or more test wells, and analysis of rock samples—will be required to refine the characterization of the subsurface. In that way, predictions of flow behavior and the long-term fate of injected CO2 can be made. These predictions will be part of a permitting process involving some combination of local, state, and federal regulatory agencies, depending on the specific location (Wilson et al., 2007).
As part of this process, an appropriate level of project-performance monitoring will need to take place. A number of geophysical techniques are available for monitoring the movement of the CO2 in the subsurface and the vicinity of the injection project (see Table 5.4 of IPCC [2005]). Which techniques are appropriate will depend on the geologic setting and on the project’s stage. During the injection phase, monitoring activities will likely be more extensive in the initial years to ensure that the injected CO2 is entering the intended formation and that surface leaks in the injection area do not occur (wells and the associated pipes and fittings are the most likely sources of leaks, but they can also be repaired most easily). Time-lapse seismic methods have been demonstrated for detection of the subsurface movement of the CO2, and electromagnetic and gravity surveys may also be used in some settings. After injection of CO2 ceases, there will still be a period in which gravitational forces cause the buoyant CO2 to move in the subsurface, but the rate of movement will decline with time; hence the need for frequent monitoring activities will also decline.
Many issues associated with the development of appropriate regulatory processes remain to be resolved. In particular, what entity would bear long-term liability after injection has ceased? Testing of geologic storage of CO2 is allowed under existing regulatory structures, but these regulations must be further developed in order to embrace large-scale implementation of CO2 injection for the purpose of avoiding emissions of CO2 to the atmosphere (Wilson et al., 2007). That development process is now in the beginning stages. In July 2008, the U.S. Environmental Protection Agency issued proposed rules for regulation of underground injection of CO2 under the Safe Drinking Water Control Act (www.epa.gov/safewater/uic/wells_sequestration.html#regdevelopment). The rules would create a new class of injection well for CO2 as part of the Underground Injection Control program. They would also include requirements for storage-site characterization, injection-well design and testing, monitoring of project performance, and demonstration of financial responsibility.
References for Annex 7.A
Allison, E. 2000. Department of Energy Methane Hydrate Research and Development Program: An update. Annals of the New York Academy of Sciences 912:437-440.
Anderson, S.R., and R. Newell. 2004. Prospects for carbon capture and storage technologies. Annual Review of Environment and Resources 29:109-142.
Bauer, C. 2008. Presentation to the workshop of the Fossil Energy Subgroup of the AEF Committee, National Research Council, Washington, D.C., January 29–30.
British Petroleum. 2006. BP Statistical Reviews of World Energy 2006. Available at www.bp.com/liveassets/bp_internet/Switzerland/Corporate_Switzerland/STAGING/local_assets/downloads_pdf/pq/pm_statistical_review_of_world_energy_full_report_2006.pdf.
Chadwick, R.A., D. Noy, R. Arts, and O. Eiken. 2008. Latest time-lapse seismic data from Sleipner yield new insights into CO2 plume development. Presented at the Ninth Greenhouse Gas Technology Conference, Washington, D.C., November 16–20, 2008.
Council of Canadian Academies. 2008. Energy from Gas Hydrates: Assessing the Opportunities & Challenges for Canada.
Daley, T., L. Myer, J. Peterson, E. Majer, and G. Hoversten. 2008. Time-lapse cross-well seismic and VSP monitoring of injected CO2 in a brine aquifer. Environmental Geology 54:1657-1665.
Dooley, J.J., R.T. Dahowksi, C.L. Davidson, M.A. Wise, N. Gupta, S.H. Kim, and E.L. Malone. 2006. Carbon Dioxide Capture and Geologic Storage. Technical Report. Global Energy Technology Strategy Program, Battelle, Joint Global Change Research Institute.
EIA (Energy Information Administration). 2008. Monthly Energy Review. DOE/EIA-0035(2008/04). Washington, D.C.: U.S. Department of Energy, Energy Information Administration.
EPRI (Electric Power Research Institute)–TAG. 1993. Technical Assessment Guide (TAG) Electricity Supply—1993. TR-102276-V1R7. Palo Alto, Calif.: Electric Power Research Institute.
Hepple, R.P., and S.M. Benson. 2005. Geologic storage of carbon dioxide as a climate change mitigation strategy: Performance requirements and the implications of surface seepage. Environmental Geology 47:576-585. DOI 10.1007/s00254-004-1181-2.
Ide, S.T., K. Jessen, and F.M. Orr, Jr. 2007. Storage of CO2 in saline aquifers: Effects of gravity, viscous, and capillary forces on amount and timing of trapping. Journal of Greenhouse Gas Control 1:481-491.
IPCC (Intergovernmental Panel on Climate Change). 2005. Special Report on Carbon Capture and Storage. Prepared by Working Group III of the Intergovernmental Panel on Climate Change. New York and London: Cambridge University Press.
IRGC (International Risk Governance Council). 2008. Regulation of Carbon Capture and Storage. Available at www.irgc.org/IMG/pdf/Policy_Brief_CCS.pdf. Accessed May 4, 2009.
Jayasinghe, A.G., and J.L.H. Grozic. 2007. Gas hydrate dissociation under undrained unloading conditions (abstract). P. 61 in Submarine Mass Movements and Their Consequences. Vol. IGCP-511. UNESCO.
MIT (Massachusetts Institute of Technology). 2007. The Future of Coal: Options for a Carbon-Constrained World. Cambridge, Mass.: MIT.
Moridis, G.J., T. Collett, R. Boswell, M. Kurihara, M.T. Reagan, C. Koh, and E.D. Sloan. 2008. Toward production from gas hydrates: Current status, assessment of resources, and simulation-based evaluation of technology and potential. Paper SPE 114163. Presented at the SPE Unconventional Reservoirs Conference, Keystone, Colo., February 10–12, 2008.
NETL (National Energy Technology Laboratory). 2007a. Cost and Performance Baseline for Fossil Energy Plants. DOE/NETL-2007/1281, Revision 1. U.S. Department of Energy.
NETL. 2007b. Carbon Sequestration Atlas of the United States and Canada. U.S. Department of Energy, Office of Fossil Energy. Available at www.netl.doe.gov/technologies/carbon_seq/refshelf/atlas/ATLAS.pdf.
NIOSH (National Institute of Occupational Safety and Health). 1996. Documentation for Immediately Dangerous to Life or Health Concentrations/Carbon Dioxide. Available at www.cdc.gov/niosh/idlh/124389.html.
NPC (National Petroleum Council). 2007. Facing the Hard Truths About Energy: Topic Paper No. 19. Washington, D.C.: NPC.
Palmgren, C., M.G. Morgan, W. Bruine de Bruin, and D.W. Keith. 2004. Initial public perceptions of deep geological and oceanic disposal of carbon dioxide. Environmental Science and Technology 38:6441-6450..
Reiner, D.M., and H.J. Herzog. 2004. Developing a set of regulatory analogs for carbon sequestration. Energy 29:1561-1570.
Riaz, A., M. Hesse, H. Tchelepi, and F.M. Orr, Jr. 2006. Onset of convection in a gravitationally unstable, diffusive boundary layer in porous media. Journal of Fluid Mechanics 548:87-111.
Ruppel, C. 2007. Tapping methane hydrates for unconventional natural gas. Elements 3:193-199.
Sheppard, M.C., and R.H. Socolow. 2007. Sustaining fossil fuel use in a carbon-constrained world by rapid commercialization of carbon capture and sequestration. AIChE Journal 53:3022-3028.
Socolow, R.H. 2005. Can we bury global warming? Scientific American (July):49-55.
Wilson, E.J., S.J. Friedmann, and M.F. Pollak. 2007. Risk, regulation, and liability for carbon capture and sequestration. Environmental Science and Technology 41:5945-5952.


