
11
Payment and Payer-Based Strategies
INTRODUCTION
To obtain better value for investments made in health care, significant discussion has emerged on how best to align economic and health incentives to achieve these goals (Dudley et al., 2007; IOM, 2007; Orszag and Ellis, 2007). Focusing on providers, attention has turned to the current fee-for-service reimbursement model. By placing the incentives on volume over value, fee-for-service fails to create incentives for preventive care and care coordination among providers (MedPAC, 2008; Miller, 2007). As physician practices spend an average of 3 hours a week interacting with health plans at a national cost of $23 billion to $31 billion a year, the administrative complexity created by multiple documentation requirements to varying billing, precertification, and credentialing forms takes time away from clinical care (Casalino et al., 2009). Failure to clearly differentiate the value and benefits of alternative providers, treatments, and health plans obfuscates the signals to consumers (Chernew et al., 2007). The papers in this chapter cover a range of strategies targeting the payment and payer systems as sources of opportunities for lowering costs and improving outcomes, underscoring the importance of streamlined and harmonized health insurance regulation, administrative simplification and consistency, and payment redesign to focus incentives on results and value.
Harold D. Miller of the Center for Healthcare Quality and Payment Reform reviews the broader evidence base of payment reform’s impact on costs and quality and provides a conceptual framework for possible payment policies. Building on Miller’s comments and recommendations on
strategies for transitioning to more value-based payment structures, Amita Rastogi of Bridges to Excellence discusses the promising effects of the PROMETHEUS (Provider payment Reform for Outcomes, Margins, Evidence, Transparency, Hassle-reduction, Excellence, Understandability, and Sustainability) payment system, based on a fee-for-episode system. She focuses in particular on the allowance in the PROMETHEUS system for potentially avoidable complications, which is designed to encourage reduction in such complications by at least 50 percent. Translating their estimates to the national level, she reports a potential cost savings of $165 billion nationally from reducing potentially avoidable complications in 13 medical conditions in the commercially insured population.
David R. Riemer of the Community Advocates Public Policy Institute highlights health insurance exchanges as a promising practice for introducing managed competition into the insurance market. Drawing on the lessons learned from one of the nation’s most long-lasting and successful exchanges, operated by the Wisconsin State Employee Health Plan in Dane County, he suggests that three conditions must be in place to maximize the ability of health insurance exchanges in lowering costs: the pool of potential enrollees should have an average or near-average risk profile; the pool of enrollees must be at least 20 percent of the population; and the enrollees must have clear financial incentives for selecting health insurance plans that have the lowest risk-adjusted bids.
Turning to consumer incentives, Niteesh K. Choudhry from Harvard University discusses value-based insurance design, focusing on the potential impact of tiering copayments for medications based on evidence-based value. He explains that, with insurance copayments set in a one-size-fits-all style, copayments for essential, high-value services are often set too high, and their resultant underuse leads to missed opportunities to prevent and treat morbid and expensive diseases while copayments for nonessential, low-value services are sometimes not set high enough to minimize their unnecessary use. Although the evidence base is limited, existing studies suggest that value-based insurance design for five chronic conditions may reduce costs by 1 to 6 percent, the equivalent of more than $2 billion annually. However, he cautions that these preliminary estimates, by necessity, aggregate groups of conditions into single disease categories, such as “heart disease,” do not account for patients with more than one related condition, and do not distinguish between the impact on patients of different disease severities. In a complementary discussion, Lisa Carrara of Aetna describes a variant of value-based insurance design with a discussion of tiered provider networks and consumer-directed health plans. Based on the experience of the Aetna Aexcel network of designating providers based on clinical quality and cost efficiency, she estimates that up to a 3 to 4 percent reduction in first year claims could be realized by customers if all Aetna patients demonstrated a 90 percent utilization of Aexcel-designated physicians.
Both Robin J. Thomashauer from the Council for Affordable Quality Healthcare (CAQH) and David S. Wichmann from UnitedHealth Group conclude this session by discussing different approaches to administrative simplification. Thomashauer describes CAQH’s work in driving payer collaboration and process consolidation through multistakeholder initiatives—the Committee on Operating Rules for Information Exchange (CORE) and the Universal Provider Datasource (UPD). Through development of standardized operating rules to facilitate administrative data exchange and promote interoperability, she relays that industry-wide adoption of CORE rules could save $3 billion over the next 3 years. Citing the success of this cross-industry, public–private collaboration, Thomashauer outlines the need for continued collaboration focused on both short- and long-term goals, coupled with appropriate policy support through the federal government. Meanwhile, Wichmann outlines how the use of current technology could improve payment speed and accuracy and streamline provider credentialing, privileging, and quality designation processes, yielding savings of $332 billion over the next decade. To achieve these savings and improve healthcare delivery, he urges shared, consistent action across all payers—commercial and governmental—in partnership with physicians and hospitals.
VALUE-BASED PAYMENTS, OUTCOMES, AND COSTS
Harold D. Miller, M.Sc.
Center for Healthcare Quality and Payment Reform
The goals of value-based payment are to give healthcare providers adequate resources to deliver efficient, quality care and to remove the penalties that exist today for improving quality and efficiency. Episode-of-care payment and comprehensive care payment systems can help providers prevent health problems; prevent the occurrence of acute episodes among individuals who have health conditions; prevent poor outcomes during major acute episodes, such as infections, complications, and hospital readmissions; and reduce the costs of successful treatment. By using payment changes to help address these major sources of waste and inefficiency, healthcare costs can be reduced significantly without “rationing” or denying care that patients need (Figure 11-1).
Using Episode-of-Care Payment to Reduce Waste and Inefficiency
Poor outcomes and high costs of major acute episodes can be reduced through the use of episode-of-care payment systems; this system defines a single amount to cover all of the services that are provided to a patient during a single episode of care (e.g., the treatment of a heart attack), rather than making separate payments for each individual service (Robinson,
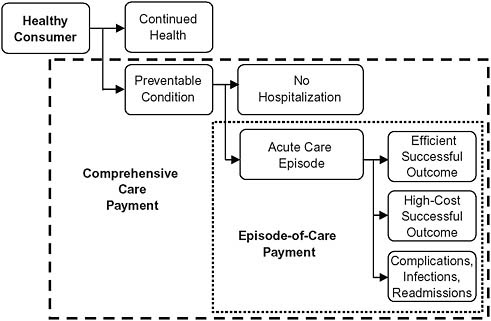
FIGURE 11-1 How value-based payment systems address sources of waste and inefficiency.
2001). Episode-of-care payment gives the involved providers an incentive to coordinate their activities, eliminate unnecessary services, and avoid complications that require additional services (Miller, 2009).
Defining an Episode-of-Care
There are different versions of episode-of-care payment that address different types of waste and inefficiency (Table 11-1). Although only the fourth and fifth categories—full-episode payments with a limited warranty based on either the type of treatment or diagnosis—can address the full range of problems that occur within a major acute episode, the narrower forms of episode-of-care payment could be used for types of patients where only one issue is of concern, or the narrower forms could be used as transitional steps toward full-episode payment (Center for Healthcare Quality and Payment Reform, 2009b).
Encouraging the Use of Higher-Value Providers and Services
As indicated in the fourth and fifth categories in Table 11-1, episode-of-care payment can be based on a particular type of treatment, or it can be based solely on the patient’s diagnosis, particularly where there is clear
TABLE 11-1 Variants of Episode-of-Care Payment That Address Different Aspects of Waste and Inefficiency in Major Acute Episodes
|
Category |
Component of Treatment |
Current Payment System |
Impact of Current System on Waste and Inefficiency |
Improved Payment Approach |
|
1 |
Treatment for conditions present on admission to the hospital |
Hospitals and doctors are paid separately and independently for the care they provide. Most physicians (except surgeons and obstetricians) are paid on a fee-for-service basis. |
No financial incentive exists for doctors and hospitals to work together to improve hospital efficiency. Payers and consumers cannot determine the full cost of treatment in advance. |
Inpatient bundled payment: a single payment covering both hospital and physician services for inpatient treatment |
|
2 |
Treatment for hospital-acquired conditions |
Hospitals are paid for higher diagnosis-related groups (DRGs) or given outlier payments when infections or complications occur. Most physicians are paid additional fees when additional care is provided. |
No financial penalty exists for infections, complications, or readmissions. Payers do not know the full cost of treatment in advance. |
Inpatient warranty: a payment for inpatient services based only on the cost of treatment of conditions present upon admission to the hospital |
|
3 |
Care after discharge from the hospital (e.g., rehabilitation, home health, outpatient care) |
Each provider is paid separately for any services they provide. |
No incentive exists to use posthospital care efficiently. Some desirable services may not be paid for at all. Payers do not know the full cost of treatment in advance. |
Bundled payment for inpatient and postacute services: a single payment covering both inpatient treatment and postacute care |
|
Category |
Component of Treatment |
Current Payment System |
Impact of Current System on Waste and Inefficiency |
Improved Payment Approach |
|
4 |
Readmissions to the hospital for reasons related to the original stay |
Hospitals and physicians are paid for any readmissions in addition to payment for the initial hospital stay. |
No incentive exists to prevent readmissions. Payers do not know the full cost of treatment in advance. |
Full-episode payment with a limited warranty (based on type of treatment): a single payment covering inpatient, postacute care, and preventable readmissions based on the cost of treatment for conditions present on the initial admission |
|
5 |
Choice of the highest-value treatment and facility for addressing the patient’s conditions |
Hospitals and doctors are paid based on the types of treatment provided (e.g., coronary artery bypass surgery) rather than based on the patient’s conditions (e.g., coronary artery blockage). |
No incentive to use lower-cost treatments or facilities that can achieve similar outcomes for the patient’s conditions. |
Full-episode payment with a limited warranty (based on type of diagnosis): a single payment to cover all needed services based on the cost of the highest-value treatment available for a patient’s diagnosis |
evidence as to the appropriate treatment(s) for the diagnosis. Basing payment on diagnosis creates an incentive for a provider to use higher-value treatments—those with equivalent outcomes and lower costs.1
Episode-of-care payment also enables providers to define a single, comprehensive price for an episode of care, which in turn would enable payers (and consumers, if the price is made public) to more easily see the full cost of treatment and to more accurately compare the costs of different providers that could provide the same treatment. Although there is evidence that costs for the same treatment can vary significantly among providers in the same community (Pennsylvania Healthcare Cost Containment Council,
2007), most payers (e.g., Medicare and major health insurance plans) do not give patients strong incentives to use providers who achieve similar outcomes at lower costs.
Why Episode-of-Care Payment Is Better Than Other Payment Reforms
Other payment changes that have been proposed or implemented in an effort to reduce infections, complications, and readmissions are not as effective in changing incentives as a true episode-of-care payment that includes a limited warranty. For example, pay-for-performance systems that give bonuses to hospitals for reducing infections do not change the underlying payment system and its rewards for providing more services. Medicare’s rules that exclude hospital-acquired infections from the diagnosis-related group (DRG) formula do not prevent hospitals from being paid for the complications resulting from those infections or from receiving outlier payments for those cases.
In contrast, if a hospital and physician commit to a “limited warranty,” similar to what has been done by Geisinger Health System through its ProvenCare program (Casale et al., 2007), they have both a financial and quality incentive to improve, and they can also advertise the warranty to patients and payers as a sign of high-quality care.
Experience with Episode-of-Care Payment
Although Medicare has been successfully using a narrow form of episode-of-care payment for over 25 years through the Inpatient Prospective Payment System, there has been relatively limited experience using episode-of-care payments that incorporate warranties or bundle together payments for multiple providers. The projects that have been evaluated have all focused on surgery episodes; the evaluations indicate that payers received savings ranging from 10 to 40 percent, without negative impacts on quality (Cromwell et al., 1997; Edmonds and Hallman, 1995; Johnson and Becker, 1994).
Using Comprehensive Care Payment to Help Prevent Episodes and to Encourage Use of High-Value Services
Despite the many improvements of episode-of-care payment over current fee-for-service payment systems, it still does not encourage preventing episodes of care from occurring in the first place. For example, the primary goal for patients with chronic diseases should not be to reduce the cost of each episode of hospitalization, but to reduce the number of hospitalizations. Many studies have demonstrated that large reductions in
hospitalizations—20 to 40 percent or more—can be achieved through relatively simple, low-cost services such as patient education, self-management support, telemonitoring, and so on (Bourbeau et al., 2003; Cordisco et al., 1999; Gadoury et al., 2005). However, many of these services are not paid for under Medicare or private insurance plans, whereas hospitals and physicians are paid for all hospitalizations, no matter how frequently they occur.
Comprehensive care payment is designed to solve this problem by defining a single amount to cover all of the services needed to manage a patient’s conditions during a fixed period of time, regardless of how many separate episodes of care occur (Miller, 2009). This gives the providers involved in the patient’s care the flexibility to try innovative approaches and tailor services based on the patient’s needs, and it gives them an incentive to avoid hospitalizations and unnecessary or overly expensive services.
In addition to supporting better care management of chronic diseases, comprehensive care payment can encourage the use of higher-value services for treatment of conditions by providing physicians with both the resources and incentive to engage in shared decision making with their patients. Research has shown that the frequency of many types of surgery can be reduced by 20 to 40 percent (O’Connor et al., 2004) and that the inappropriate use of diagnostic imaging can be reduced significantly (Bottles, 2009) when a neutral advisor helps patients make an informed choice, but providers are not compensated or rewarded for doing this under fee-for-service payment.
Table 11-2 provides a side-by-side comparison of episode-of-care payment and comprehensive care payment.
In theory, comprehensive care payment could also be used to encourage greater emphasis on preventing health conditions from occurring in the first place. However, a patient would have to commit to obtain care from the same provider over a multiyear period (and the patient would need a consistent health insurance plan that encouraged such multiyear arrangements) so that if the provider incurred higher costs for prevention today, there would be an assurance that it could reap the benefits of lower treatment expenditures in the future.
Why Comprehensive Care Payment Is Better Than Other Payment Reforms
Although “medical home” initiatives are attempting to change payment systems in order to fill some of the gaps defined above, there is no assurance that these programs will reduce spending since medical homes are not given explicit accountability for improved outcomes (Network for Regional Healthcare Improvement, 2009). At the other end of the spectrum,
TABLE 11-2 Comparing Episode-of-Care Payment to Comprehensive Care Payment
|
Episode-of-Care Payment |
Comprehensive Care Payment |
|
• A single, bundled payment would be paid to a provider or group of providers to cover all of the healthcare services needed by the patient during a specific episode of care (e.g., treatment for a heart attack, or surgery to replace a broken hip). This single amount would be paid instead of individual fees to doctors, DRG payments to hospitals, etc. |
• A periodic (e.g., monthly or quarterly) payment would be paid to a provider to cover all of the healthcare services (including care management, preventive care, and acute care services) needed for management of the patient’s health conditions during that period of time. This single amount would be paid instead of individual fees for services. |
|
• The providers involved in the episode could create joint arrangements for accepting and dividing up the episode-of-care payment among themselves, or the episode-of-care payment could be treated as a budget, and the payer (e.g., a health plan) could divide the payment among the involved providers based on their proportional shares of the care (Gosfield, 2009). |
• A single provider (e.g., a “medical home”) could accept the comprehensive care payment and make payments from it to other providers who deliver care during the time period covered, or the comprehensive care payment could be treated as a budget, and the payer (e.g., a health plan) could divide the payment among the involved providers based on their proportional shares of the total services provided. |
|
• The amount of the episode-of-care payment would vary based on the patient’s diagnosis or treatment and other patient-specific factors. However, there would be no increase in payment to cover preventable adverse events such as errors, infections, or hospital readmissions. |
• The amount of the comprehensive care payment would vary based on the patient’s characteristics—both the specific health conditions they have and other factors affecting the level of healthcare services they will need (e.g., whether they speak English). |
|
• Methods would be established for monitoring and reporting on the quality of health care delivered by providers during each episode, and there could also be bonuses or penalties for the providers based on the quality of care or the outcomes achieved. |
• Methods would be established for monitoring and reporting on the quality of health care delivered by providers during the period of time covered by the payment, and there could also be bonuses or penalties for the providers based on the quality of care or the outcomes achieved. |
|
• Ideally, patients would also receive incentives to use higher-quality or lower-cost providers and adhere to care processes jointly developed by them and their providers. |
• Ideally, patients would also receive incentives to use higher-quality or lower-cost providers and adhere to care processes jointly developed by them and their providers. |
proposals for “shared savings” payments to providers require a focus on outcomes, but do not change the underlying fee-for-service structure and fail to provide any up-front resources to implement new services (Center for Healthcare Quality and Payment Reform, 2009a). In contrast, comprehensive care payment gives physicians and other providers both greater
flexibility and greater accountability for the use of resources to deliver high-quality efficient care.
A comprehensive care payment system also avoids penalizing providers for treating sicker patients—one of the major problems with traditional capitation payment systems—because the amount of the comprehensive care payment would vary depending on the number and severity of a patient’s health conditions (Miller, 2009).
Experience with Comprehensive Care Payment
Although capitation systems have been widely used, there is little experience with true comprehensive care payment systems. One example is the Patient Choice program in Minnesota, in which groups of doctors and hospitals are paid based on the risk-adjusted cost of providing care to a population of patients (Robinow, 2008). An evaluation indicated that it contained costs without negatively affecting quality (Lyles et al., 2002). In 2009, PROMETHEUS Payment, Inc. began a yearlong pilot test of “evidence-informed case rates” for chronic disease patients (Prometheus Payment, Inc., 2009), and Blue Cross Blue Shield of Massachusetts implemented its Alternative Quality Contract (Blue Cross Blue Shield of Massachusetts, 2008), both of which incorporate key elements of comprehensive care payment.
Choosing a Value-Based Payment System
Different types of patients and conditions have different types of waste and inefficiency problems, and different types of payment systems are appropriate for addressing them (Miller, 2009). Episode-of-care payments are most appropriate for conditions where there is not a problem with overuse of treatment (e.g., hip fractures and labor and delivery) but where there are opportunities to reduce the cost and complications of the treatment. As noted earlier, comprehensive care payment should be used for conditions such as chronic diseases where there is concern about unnecessarily high rates of hospitalizations. It should also be used for conditions where there is concern about overuse of certain types of procedures (e.g., heart surgery vs. medical management of heart disease). Areas of underutilization, such as the delivery of prevention services with long-term impacts, may be best addressed through fee-for-service payment.
Setting the Payment Amount
Setting the right payment amount (i.e., the price) is as important as using the right payment method (Miller, 2009). If the amount is too low, providers will be unable to deliver quality care, and if it is too high, there is
no incentive to seek out efficiencies. There are several alternative methods of setting payment amounts, each with advantages and disadvantages (Table 11-3). Different price-setting approaches will likely be needed in different regions and for different providers and services depending on the local market structure; for example, regulation may be needed in regions where providers have a monopoly on particular services, whereas competition can be used in regions where there are multiple providers for most services.
TABLE 11-3 Alternative Ways of Setting Prices in a Payment System
|
Price-Setting Method |
Example |
Advantages |
Disadvantages |
|
Regulation: government defines the prices that a provider can charge. |
The Maryland Health Services Cost Review Commission sets all-payer rates for hospitals (Health Services Cost Review Commission). |
Avoids cost shifting to small payers. Enables sharing by all payers of costs of uncompensated care and of necessary but expensive services. |
Requires the regulator to determine the “right” price for services. Discourages price competition on services where multiple providers exist. |
|
Price-setting by large payers: large payers define the amounts they will pay providers. |
Congress and the Centers for Medicare & Medicaid Services (CMS) establish the rates that Medicare will pay. |
Enables consistent pricing of services regardless of a provider’s market power. |
Requires the payer to determine the “right” price for services. Discourages competition on price where multiple providers exist. |
|
Negotiation between payers and providers: payers negotiate with providers to determine prices. |
Commercial health insurance plans negotiate payment rates with major providers in most markets. |
Enables prices to be set based on the cost of delivering services and the value of the services to the payer and its member consumers. |
Result depends on size of payer vs. provider; monopoly/oligopoly providers can demand premium prices, particularly from small payers. |
|
Competition by providers: providers set prices in order to attract consumers. |
The State of Minnesota has created a process to define “baskets of care” for asthma, back pain, obstetrics, and others; providers who want to offer those packages of services set their price, and all (commercial) payers will be required to pay the same price (Institute for Clinical Systems Improvement; Minnesota Department of Health). |
Enables providers to define the “right” price for services, and gives them the opportunity to attract additional volume based on greater efficiency. |
Requires existence of multiple providers with similar quality to enable competition on price and with sufficient capacity to handle shifts in patient volume. Requires a benefit design that gives consumers an incentive to use lower-cost providers. |
Achieving Alignment of Multiple Payers
Finally, for changes in payment systems to enable a healthcare provider to transform the way it delivers care for all of its patients, most, if not all, of the payers in the community need to change their payment systems in similar ways. To avoid antitrust concerns, states or nonprofit regional health improvement collaboratives can facilitate consensus among local payers on payment changes (Miller, 2009). However, Medicare needs the ability to participate in such regionally defined payment reforms in order to achieve true alignment of incentives.
BUNDLED AND FEE-FOR-EPISODE PAYMENTS: AN EXAMPLE
Francois de Brantes, M.S., M.B.A., Amita Rastogi, M.D., M.H.A.,
Alice Gosfield, Doug Emery, M.S., and Edison Machado, M.D., M.B.A.
Bridges to Excellence
Ideas about how to pay providers to improve quality and reduce costs are the foundation for many current discussions about national healthcare reform. Most experts agree that a fundamental problem of the nation’s health system is that both the current fee-for-service and the capitation-style models of reimbursing providers encourage volume-based practice patterns rather than value-driven care (Lee and Ferris, 2009). Providers are rewarded for “doing things” (often too many or not enough), rather than delivering quality services that are proven to keep people healthy, reduce errors, and help avoid unnecessary care.
As opposed to fee-for-service, bundled payments place the focus of care on the entire continuum for a given condition (Paulus et al., 2008). Contrary to capitation that is based on per population payment irrespective of whether a member has a condition or not, payment by episodes are triggered only when a member has a condition and insulates providers from risk of occurrence. Creating a single reimbursement fee for a condition holds the providers accountable for delivering quality care in the most cost-effective manner, while adjusting payments based on patient-severity factors makes the system fair. Fee-for-episode payments with the right incentives would focus providers in managing care proactively in a patient-centered, coordinated fashion, reducing complications and improving outcomes across the continuum of care (Mechanic and Altman, 2009).
PROMETHEUS Payment is one such approach that seeks to ignite a transformation in healthcare payment by challenging the way providers and insurers conduct business—moving away from unit-of-service payment to episode-of-care payment (de Brantes and Rastogi, 2008). This consumer-centered model has developed “evidence-informed” case rates for several chronic, acute medical and procedural conditions, defining what services
are included in episode payments and adjusting reimbursements based on patient severity. It is built on a quality-improvement framework where a physician scorecard is tied to the potential for reducing complications. The model was launched in 2006 (Prometheus Payment Inc., 2008), and now has four pilots across the country through the support of the Robert Wood Johnson Foundation and is also being tested informally in several communities. This report outlines the lessons learned from PROMETHEUS.
Episodes of Care
At its core, the PROMETHEUS Payment model centers on packaging payment around a comprehensive episode of medical care that covers all patient services related to a single illness or condition. Covered services are determined by commonly accepted clinical guidelines or expert opinion that lay out the tested, medically accepted method for treating the condition from beginning to end.
To date, PROMETHEUS Payment has developed evidence-informed case rates for a significant number of acute events, procedures, and chronic care, including heart attacks, hip and knee replacement, diabetes, asthma, congestive heart failure, and hypertension, to name a few (Rastogi et al., 2009). These existing evidence-informed case rates can potentially affect payment for almost 33 percent of the entire insured adult population and represent a significant amount of dollars spent by employers and plans.
Evidence-informed case rates are budgeted at the patient level and encompass costs of all necessary care for a given condition (physician visits, prescriptions, lab tests, imaging, etc.) across the care continuum for a predefined period of time. The covered services are bundled across all providers who would treat a given patient and the case rate is adjusted to take into account the severity and complexity of the individual patient’s condition. However, services normally included within the total costs of patient care but used to care for potentially avoidable complications (PACs) are largely a result of care defects and are attributable to provider actions. Within PROMETHEUS, costs of these services are separated from costs attributable to patient factors and used to develop a warranty pool against care defects. The evidence-informed case rates therefore cover costs for typical and reliable care that is adjusted based on patient demographics and comorbidities, and an allowance that serves as a warranty or buffer against PACs.
Potentially Avoidable Complications (PACs)
PACs are usually deficiencies in care that cause harm to the patient, yet might have been prevented through more proactive care—for example, when a patient with diabetes ends up in the emergency room because of uncontrolled blood sugar levels. PACs represent a substantial opportunity
for improving patient care and reducing total cost of care. Unfortunately, PACs remain all too common in the U.S. healthcare system.
In analyzing large sets of national claims data, the PROMETHEUS Payment team found that an average of 21 to 77 cents of every dollar spent on chronic conditions and 15 to 34 cents of every dollar spent on acute medical care or procedural conditions are attributable to PACs (Figure 11-2). PACs are abundant and expensive, amounting to hundreds of billions of dollars for less than optimal care, and are a significant source of variation in costs due to errors, oversights, and failure of care coordination. Preventable hospitalizations constitute the bulk (67 percent) of all chronic medical PAC costs. The Centers for Medicare & Medicaid Services–defined “never events,” hospital-acquired conditions (9.5 percent), and readmissions (44 percent) constitute the bulk of inpatient acute medical and procedural PAC costs, others being PAC costs during the index stay and professional and pharmacy costs associated with these PACs.
PACs represented about 15 percent of the total of $45 billion of annual costs of care in a large national claims dataset after modeling 13 evidence-
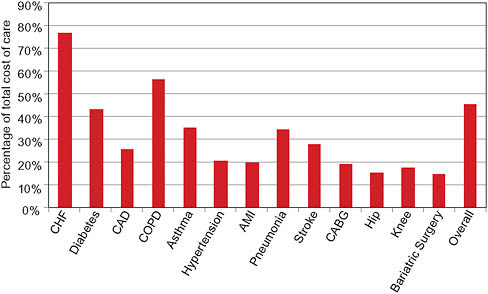
FIGURE 11-2 Cost of care defects as percentage of total costs of care for specified conditions/procedures.
NOTES: AMI = acute myocardial infarction; CABG = coronary artery bypass graft surgery; CAD = coronary artery disease; CHF = congestive heart failure; COPD = chronic obstructive pulmonary disease; Hip = hip replacement surgery; Knee = knee replacement surgery; Overall = weighted average of costs all care defect as a proportion of all costs of care for the 13 evidence-informed case rates in this figure.
informed case rates.2 Using best practices quoted in literature, these care defects could be decreased by half (de Brantes, under review) leading to a net savings opportunity of $3 billion (Table 11-4). Reducing these defects to zero would net close to $6.5 billion.
Given that there are 3.5 million covered lives under the age of 65 in this dataset, total potential savings for the 200 million commercially insured in the country could be approximately $165 billion. If these defects were reduced to zero, the U.S. healthcare system could save $355 billion.
Under PROMETHEUS Payment, the incentive for providers to act on and reduce PACs comes directly from the savings found in reducing them. A PAC allowance is calculated and included in each evidence-informed case rate price irrespective of the occurrence of PACs. This amounts to 50 percent of dollars spent today on these conditions. Should complications occur, this portion of the budget serves to offset the actual costs of the corrective treatment (de Brantes et al., 2009). The PROMETHEUS model rewards providers with fewer PAC rates and better-quality scores, giving them an additional allowance as “margin” for provider practice reengineering to improve care delivery. If providers can reduce or eliminate PACs, they can keep the entire allowance as a bonus and significantly improve their profit margin per patient, as the example depicted illustrates (Box 11-1).
One of the important features that makes PROMETHEUS Payment different from other healthcare payment systems and typical pay-for-performance models is its strong incentive for clinical collaboration to ensure positive patient outcomes. In addition to earning the base evidence-informed case rate payments, providers are given the opportunity to earn bonuses through a comprehensive quality “scorecard” tied to the reduction of potentially avoidable complications.
Comprehensive Quality Scorecard
The PROMETHEUS Payment comprehensive quality scorecard contains a variety of metrics built and expanded on the Bridges to Excellence Care Links that track and evaluate care across the entire scope of treatment (Rosenthal et al., 2008). These include scores for a range of items, including (1) each provider’s performance in meeting the clinical practice guidelines that define the evidence-informed case rates, (2) positive intermediate outcomes that lead to patient risk reduction and the avoidance of preventable complications, and (3) the patient’s satisfaction with care received.
When evidence-informed case rates are paid, a portion of the budget is withheld and then paid out depending on the scores that the providers and their clinical collaborators earn. To create a very clear incentive for clinical
TABLE 11-4 Savings Estimate: Commercially Insured Population
|
|
Total for Six Chronic Conditionsa (n = 1,361,685) |
Total for Seven Acute Medical / Proceduresb (n = 22,242) |
Total for 13 Conditions/Acute Medical / Proceduresc (n = 1,383,927) |
Total for 13 Conditions /Acute Medical / Proceduresc (n = 1,383,927) |
|
Base cost of care |
$6,909,752,883 |
$736,537,303 |
$7,646,290,186 |
$7,646,290,186 |
|
Underuse allowance |
$687,559,658 |
$0 |
$687,559,658 |
$687,559,658 |
|
Evidence-informed cost |
$7,597,312,541 |
$736,537,303 |
$8,333,849,844 |
$8,333,849,844 |
|
PAC target rate |
24% |
10% |
23% |
0% |
|
Allowance for PACs |
$3,319,149,766 |
$95,329,613 |
$3,414,479,379 |
$0 |
|
Total expected cost |
$10,916,462,307 |
$831,866,917 |
$11,748,329,224 |
$8,333,849,844 |
|
Net savings opportunity |
$2,951,882,322 |
$95,329,613 |
$3,047,211,935 |
$6,461,691,315 |
|
Net savings for all commercially insured plan members |
$162,353,527,710 |
$5,243,128,730 |
$167,596,656,440 |
$355,393,022,299 |
|
aThese conditions include congestive heart failure (CHF), diabetes, coronary artery disease (CAD), chronic obstructive pulmonary disease (COPD), asthma, and hypertension. bThese conditions include acute myocardial infarction (AMI), pneumonia, stroke, coronary artery bypass graft surgery (CABG), hip replacement surgery, knee replacement surgery, and bariatric surgery. cThese conditions include the 13 conditions listed above. |
||||
|
BOX 11-1 Example of Payments Under PROMETHEUS Payment A 45-year-old non-insulin-dependent diabetic with obesity and hyperlipidemia is routinely managed by an internist for control of his diabetes. He is also periodically seen by a cardiologist who is in a separate practice from the internist. The patient is adherent with his antidiabetic drugs, the antiplatelet therapy, and his daily statin intake. Given the patient’s comorbidities, the severity-adjusted prospective budget for this patient for professional and pharmacy services would include $6,500 for 1 year of management of diabetes, an additional $1,000 for care coordination and provider practice reengineering efforts, and a $3,000 allowance for potentially avoidable costs, for a total budget of $10,500. The patient is managed proactively and does not have any emergency room visits or hospitalizations during the year. He does have an ultrasound of the heart and a retinal exam during the year, which are included in the typical portion of the budget. Overall the actual claims costs for professional and pharmacy services for this patient for 1 year total $6,700. The two physicians are therefore eligible for a “joint” bonus of $3,800. |
collaboration, the final scores depend 70 percent on what the individual provider does and 30 percent on what every other provider treating that patient for that condition has done. The value of coordination across settings is critical, particularly in the management of chronic conditions.
Conclusion
Fee-for-episode payments when constructed fairly and with the right framework offer a realistic, rational, and sustainable blueprint for a new healthcare payment system. They could effectively promote and reward high-quality, efficient, patient-centered care; provide common performance incentives for all parties; and create an environment where doing the right things for patients would also allow providers and insurers to do well financially.
In the short term, successful implementation of a bundled payment system would not require any form of organizational change to the delivery system; it would simply require an act of collaboration in the current system. The savings achieved could be divided up among the collaborating providers based on a predefined formula according to the proportion of care they are accountable for. The payer could retain a role of an integrator across providers and as budgets are set prospectively, payment could continue for all fee-for-service claims submitted.
Quarterly, the actual spending could be reconciled against the budgets and bonuses paid for the upside, and any downside risk could be managed
by withholds. In the long term, as bundled payments would become the norm, provider groups would organize to create efficient provider communities that share in the upside and a more structured payment methodology would emerge.
Interestingly, early reports from the PROMETHEUS pilot implementation sites have demonstrated a curious ethical dilemma among hospital administrators against adopting PROMETHEUS. As demonstrated in the report, the savings are achieved primarily by reducing the waste within the healthcare system of which unnecessary hospitalizations are a major portion of the costs. This has caused a financial tension in the current hospital-centric provider organizations. Results from other pilot sites would demonstrate the extent to which bundled payments actually achieve their objective of decreasing costs and improving quality.
EFFECTIVE HEALTH INSURANCE EXCHANGES: AN EXAMPLE
David R. Riemer, J.D.
Community Advocates Public Policy Institute
Health insurance exchanges can be a powerful mechanism for lowering healthcare costs and improving healthcare quality. Evidence from one of the nation’s most long-lasting and successful exchanges, operated by the Wisconsin State Employee Health Plan in Dane County, suggests, however, that those savings and quality improvements can be realized only under the following specific conditions:
-
The exchange overcomes adverse selection and presents health insurance companies with a pool of potential enrollees whose average or near-average risk profile does not discourage insurers from submitting bids.
-
The exchange has a pool of enrollees that is large enough (20 percent or more of those not enrolled in Medicaid or Medicare) to make it economically necessary for insurers to submit bids.
-
The enrollees in the pool have a clear economic incentive to select the health insurance plans that submit the lowest risk-adjusted bids, by requiring enrollees to pay most of the extra cost of plans whose risk-adjusted bids are higher.
If properly designed and implemented in all states, exchanges could function as the “public plan” that many in Congress and the President are looking for to discipline the U.S. health insurance market, lowering cost growth so as to “bend the cost curve” in health care and improving quality. Exchanges’ cost-reducing and quality-improving potential both stem from
the same incentive they trigger: the incentive of health maintenance organizations (HMOs) and other insurance companies to gain customers, increase revenue, and enlarge profits by reducing the widespread error, waste, and inefficiency that permeate the delivery of health care in the United States.
What Is a Health Insurance Exchange?
An exchange is a formal structure, typically created (and at times managed) by government, which pools buyers of health insurance and gives them unimpeded access to multiple competing health insurance plans. Exchanges provide participating individuals with objective information about:
-
Standard benefit packages3 provided by plans;
-
The features of the competing healthcare plans themselves;
-
The plans’ doctors, clinics, and hospitals;
-
The plans’ premiums;
-
The portion of their premiums enrollees must pay to join a particular plan; and
-
The enrollment process.
Through exchanges, individuals enroll in their choice of healthcare plan. There is no underwriting; renewal is guaranteed. The plans must agree to this requirement as a condition of obtaining access to the exchange’s large pool of enrollees.
The exchanges—not the plans—also decide the “format” for setting premiums, such as whether premiums will be bid on a per-person or a family basis, or whether premiums may be adjusted based on age or other risk factors. Within these constraints, however, the plans set and bid their own premiums.
Finally, exchanges oversee and facilitate the enrollment process, coordinate the premium payments to chosen healthcare plans, and perform a variety of other essential administrative functions.4
Wisconsin’s Health Insurance Exchange
Since 1983, the Wisconsin State Employee Health Plan, administered by the Department of Employee Trust Funds, has operated a health insurance exchange for approximately 80,000 state employees. The benefit package, negotiated with the American Federation of State, County, and Municipal Employees and other powerful unions, is uniform across the state and excellent in scope. The benefits are also the same whether an employee enrolls in an HMO, which submit bids in the counties of the HMO’s choice, or the statewide fee-for-service Standard Plan. Employees choose during an annual open enrollment period among the “qualified” risk-bearing HMOs—there are at least two HMO choices in almost all counties, and four or more HMOs in many counties—or select the Department of Employee Trust Funds’ self-insured Standard Plan (Wisconsin Department of Employee Trust Funds, 2004b). Employees have an incentive to choose a low-cost HMO plan because they pay much (if not most) of the extra cost of any higher-cost HMO plan or the higher-cost Standard Plan.5 The current formula, in place since 2004, places all HMOs in one of three tiers based on their risk-adjusted premium bids. Tier 1 includes the HMOs that submit the lowest premiums or “close to” the lowest premiums. Tier 2 includes the significantly more expensive HMOs. Tier 3 is occupied by the high-cost fee-for-service Standard Plan. Employees have a clear economic incentive to choose a Tier 1 HMO because their share of the premiums is limited (in 2009) to $31 per month for single coverage and $78 per month for family coverage. A Tier 2 HMO costs more than twice as much per month—$69 for singles, $173 for families. The Tier 3 Standard Plan costs over twice as much again—$164 for singles and $412 for families.
The Dane County Exchange Model
The Department of Employee Trust Funds does not really operate a single statewide exchange; rather, it oversees 72 separate county exchanges. Depending on where a state employee resides, the employee enrolls in a different countywide exchange. The benefits are the same in all counties. The risk profile is comparable across counties. The incentives are identical in each county. The HMO selections, however, vary from county to county
|
they perform, exchanges typically charge a small fee, which is built into the premiums paid by enrollees but, of course, retained by the exchanges themselves. |
(Wisconsin Department of Employee Trust Funds, 2004b). But the biggest contrast lies in the way the exchange operates in Dane County compared to how it works in the other 71 counties.
Dane County, the seat of state government and home to the University of Wisconsin-Madison, was the residence in 2006 for approximately 40 percent of all state employees, or 81,832 of the Department of Employee Trust Funds’ covered lives. This large pool exceeded 20 percent of Dane County’s entire population not enrolled in Medicaid,6 Medicare, or other federally financed health insurance programs.
The exchange model in Wisconsin’s other 71 counties has the same features: equal benefits, comparable risk profile, and identical incentives. But one essential element is missing: a large pool exceeding 20 percent of the non-Medicaid, non-Medicare population. In no other locale does the Department of Employee Trust Funds come close to having this big a pool in its countywide exchange.
Bending the Cost Curve
The results? In the Dane County exchange model, where enrollees get an annual choice among four excellent HMOs, premium rates are much lower than in the other 71 counties. The Dane County exchange model has monthly HMO premiums in 2009 that average $528 for singles and $1,316 for families. In the other counties, the monthly average premium is $628 for singles and $1,565 for families—an annual average of $1,198 more for singles and $2,995 more for families.7
Of equal importance, the inflation rate for the Dane County exchange model has been substantially less than the inflation rate for the exchanges in the state’s other 71 counties. Between 2004 and 2009, the Dane County exchange model’s HMO premiums increased 35 percent for singles and 37 percent for families. In the other 71 counties, meanwhile, HMO premiums grew by 42 percent for singles and 45 percent for families—an increase of at least 18 percent.8
It is important to note that the Dane County exchange model did not involve any significant alteration of deductibles or copays to achieve these results. By contrast, U.S. employers in general have steadily increased de-
ductibles and copays in an artificial effort to contain premium growth. Yet despite this cost shift to workers, Kaiser Family Foundation data indicate that, compared to the most recent 6-year period (2004 through 2009) for the Dane County exchange model, U.S. employers’ average premiums rose faster—39 percent for singles and 40 percent for families—during the most recent 6-year period for which we have national data (Kaiser Family Foundation, 2008).
The Lesson for Policy
As Congress and the President forge a compromise on health insurance reform that may require removing the so-called public option (i.e., a government-run, Medicare-like insurance program), Congress and the President should give serious consideration to the Dane County exchange model as an economically sound—and politically acceptable—mechanism for “bending the cost curve.”
The model offers what liberal Democrats most want: excellent benefits, a wide choice of health insurers and providers, and lower cost growth. For conservative Democrats and Republicans, it offers a proven way to contain costs without a government-run insurance company; it instead deploys market forces—competition, choice, and incentives—to discipline insurers’ premiums.
The Dane County exchange model also promotes quality. To bid competitive premiums, insurers must work closely with doctors, clinics, and hospitals to drive out the errors, waste, and inefficiency that permeate the healthcare system.
VALUE-BASED INSURANCE DESIGNS AND HEALTHCARE SPENDING
Niteesh K. Choudhry, M.D., Ph.D.
Brigham and Women’s Hospital and Harvard Medical School
Incentive formularies and other similar benefit designs are used by the majority of public and private insurers to reduce healthcare spending (Kaiser Family Foundation and Health Research and Educational Trust, 2009), yet available data suggest that they achieve their goals inefficiently (Goldman et al., 2007). Copayments are set in a one-size-fits-all style that may create imperfect incentives for patients. Copayments for essential, high-value services are often set too high, and their resultant underuse leads to missed opportunities to prevent and treat morbid and expensive diseases; copayments for nonessential, low-value services are sometimes not set high enough to minimize their unnecessary use.
Value-based insurance design (VBID) is a cost-sharing system that cre-
ates appropriate incentives for patients based on the evidence-based value of specific services. Copayments are set at low levels for high-value services and at high levels for those services that are less valuable. This is radically different from the conventional system of basing copayments on the expense of treatment or medicine. This strategy was first proposed to address the dual goals of quality improvement and cost reduction for prescription drugs (Chernew et al., 2007; Fendrick et al., 2001). VBID may also be applied to nondrug treatments, healthcare providers, and disease management programs, although these have received less attention. As of 2008, VBID plans involving incentive copayment reductions had been implemented by more than 15 percent of large self-insured employers, with virtually all others expressing interest in initiating a VBID plan within the next 5 years (Mercer National Survey of Employer-Sponsored Health Plans, 2008).
Limited but Promising Evidence Supporting VBID
The existing evidence evaluating VBID is limited but supports its ability to improve targeted service use and to potentially improve clinical outcomes and reduce overall healthcare costs. Some promising examples that suggest the broader impact of this new approach include the following:
-
In a prospective study, a large employer eliminated copayments for generics, reduced copayments by 50 percent for brand-name drugs, and demonstrated a 3 to 4 percent increase in adherence, as compared to a control firm (Chernew et al., 2008).
-
Cost-sharing reductions introduced by Pitney Bowes were associated with a 26 percent reduction in emergency department visits for patients with diabetes and a slower rate of growth of overall healthcare costs than benchmark companies (Mahoney, 2005).
-
An HMO eliminated blood glucose monitor copayments for patients with diabetes and observed a doubling of the rate of self-monitoring initiation for patients treated with oral agents and a 0.6 percent reduction in hemoglobin A1c levels for initiators who had poor diabetes control at baseline (Soumerai et al., 2004).
Further supplementing the limited research base are several published, modeling studies (Table 11-5).
Two of these economic models evaluated the impact of eliminating cost-sharing for a standard secondary prevention regimen (beta-blockers, statins, angiotensin converting enzyme inhibitors [ACEI]/angiotensin receptor blockers [ARB], and aspirin) for acute myocardial infarction patients in typical insurance plans and those covered by Medicare Part D (Choudhry et al., 2007, 2008). Both analyses found that while providing full coverage increases drug expenditures, enhanced adherence will reduce mortality and
TABLE 11-5 Published Evaluations of Impact of Cost-Sharing Reductions on Total Health Care Costs
|
Disease |
Drugs |
Source |
Analytic Method |
Payor |
Time Frame |
Impact on per Patient Total Costs |
|
|
Absolute |
Relativea |
||||||
|
Myocardial infarction |
Beta-blockers, statins, ACEI, aspirin |
Choudhry et al., 2008 |
Cost-effectiveness analysis |
Medicare |
Lifetime |
−$2,453 |
−2% |
|
Beta-blockers, statins, ACEI/ARB, aspirin |
Choudhry et al., 2007 |
Cost-effectiveness analysis |
Commercial |
3 years |
−$1,181 |
−6% |
|
|
High cholesterol at moderate or high risk of coronary artery disease |
Statins |
Goldmanet al., 2006 |
Claims-based cross- sectional model |
Commercial |
1 year |
−$5,628b |
−1% |
|
Diabetes |
ACEI |
Rosenet al., 2005 |
Cost-effectiveness model |
Medicare |
Lifetime |
−$922 |
−1% |
|
NOTE: ACEI = angiotensin converting enzyme inhibitors; ARB = angiotensin receptor blocker. a Published VBID analyses provide estimates of absolute cost savings from copayment reductions. Because these models assess cost savings over a wide range of time frames, the estimates are not directly comparable. To overcome these differences, relative savings can be calculated from the published data. |
|||||||
rates of nonfatal reinfarction, stroke, and congestive heart failure readmission and consequently result in a net cost savings. Other analyses involving eliminating copayments for statins in patients at moderate or high risk of coronary artery disease (Goldman et al., 2006) and ACEI for patients with diabetes (Rosen et al., 2005) have also found substantial total cost savings. Although these analyses used different analytic techniques to evaluate different patient populations, drugs, payer perspectives, and time frames, their results are relatively consistent.
Despite the limitations of the published data evaluating VBID (Fairman and Curtiss, 2008), employers who have implemented these benefit design plans report success from them (Mercer National Survey of Employer-Sponsored Health Plans, 2008), and accordingly there has been substantial hope that the more widespread use of VBID plans will lead to reductions in overall healthcare spending.
Generating National Estimates
Generating national estimates of the impact of VBID scaled to national levels is significantly hampered by the nascent research base in the area—whether based on experimental design or on modeling. However, as a quicker approach, we can use estimates of the relative net savings from existing economic models of copayment reductions, apply these estimates to overall health expenditures for VBID candidate conditions, and test the generated results across a range of plausible relative savings estimates.
Applying the range of expected relative savings generated from existing economic evaluations to current national expenditure for the candidate conditions yields national estimates of health savings from VBID (Table 11-6). Even with a relatively conservative assumption of 1 percent cost reduction from VBID applied to just five conditions, annual savings are estimated to be more than $2 billion.
Limitations of This Approach
There are several potential limitations to this simplistic approach. First, because the true impact of VBID on healthcare expenditure is unknown, this analysis relies on estimates derived from economic models, which in turn are reliant on potentially imperfect estimates of elasticity of demand. Second, the use of relative rates as a basis for calculating national savings estimates may be inappropriate if the cost savings from copayment reductions do not accrue at a constant rate (i.e., if there is violation of a proportional hazards assumption). As observed, relative cost savings range from 1 to 6 percent and are not obviously related to the study time horizon, thereby minimizing this concern. Further, the magnitude of these results is
TABLE 11-6 Projected Annual National Savings from Selective Copayment Reduction for Five Common Chronic Conditions
|
Disease |
Annual National Expenditure (excluding Medicaid) in Billionsa |
Annual Savings from VBID Across a Range of Relative Savings Estimates, in Billions |
||
|
1% |
2.5% |
6% |
||
|
Heart disease |
$71.99 |
$0.72 |
$1.80 |
$4.32 |
|
COPD/Asthma |
$44.22 |
$0.44 |
$1.11 |
$2.65 |
|
Hypertension |
$43.65 |
$0.44 |
$1.09 |
$2.62 |
|
Diabetes |
$41.83 |
$0.42 |
$1.05 |
$2.51 |
|
Hyperlipidemia |
$25.34 |
$0.25 |
$0.63 |
$1.52 |
|
Total |
$227.04 |
$2.27 |
$5.68 |
$13.62 |
|
aRecent nonoverlapping national estimates of total healthcare expenditures associated with different chronic conditions can be obtained from the Agency for Healthcare Research and Quality’s 2006 Medical Expenditure Panel Survey (AHRQ, 2005b).VBID plans are unlikely to be implemented by public plans that have very little cost sharing, such as Medicaid; thus Medicaid’s contribution to overall health spending for these conditions should be excluded from national expenditure estimates. Disease-specific estimates, less Medicaid expenditures, for those conditions for which relative cost savings were generated above are presented here. |
||||
consistent with those that would be expected from a large, although primary cross-sectional, literature examining the impact of increasing medication adherence on total healthcare spending (Balkrishnan et al., 2003; Sokol et al., 2005), which is the central mechanism by which VBID is believed to work. Third, VBID is unlikely to be used by payers who already set copayments at a very low level. Spending attributable to Medicaid, but not other payers, was removed from the calculations and thus the amount of spending that VBID could potentially affect may have been overestimated. Finally, the national expenditure estimates used for this analysis, by necessity, aggregate groups of conditions into single disease categories, such as “heart disease” and do not account for patients with more than one related condition (for example, copayments for ACEI may be offered to patients with diabetes and coronary disease). Further, these estimates do not distinguish between patients of different disease severities and, thus, the analysis ignores the fact that VBID may have little impact on health spending for some patients within these disease groupings and a large impact for others.
Strategies for Maximizing the Cost Savings from VBID
As more sophisticated modeling exercises are undertaken and the results of ongoing implementations become available, there are several strategies for maximizing the cost savings from VBID that should be carefully explored (Choudhry et al., 2007).
Because patients with a given disease are heterogeneous, the reduction in clinical events that results from more appropriate medication use should be greatest for patients at the highest risk for preventable events (Chernew et al., 2007). As a result, the potential cost savings from selective copayment reduction may be maximized by preferentially reducing copayments for high-risk patients with high-risk conditions, rather than reducing cost sharing for all patients with a given condition or for all patients receiving a particular treatment. In this way, VBID is sensitive to the characteristics of diseases, treatment, and patients. Targeting VBID is more resource intensive than broad-based copayment reductions, and these implications must be fully considered (Choudhry et al., unpublished).
Selectively raising copayments for low-value services may achieve cost-savings by directly reducing the use of unnecessary services. A wealth of data demonstrates the effect of this strategy, which may be particularly important to offset the initial increase in costs from copayment reductions, yet this important part of VBID has not been successfully implemented in practice. Goldman and colleagues modeled the effect of raising statin copayments for low-risk coronary artery disease prevention while lowering them for higher-risk patients and found no change in short-run health plan costs and reduced long-run costs that were similar in magnitude from those obtained by only reducing copayments for higher-risk patients (Goldman et al., 2006). The critical challenge remains to accurately identify the value of individual health services.
Although VBID has been used primarily for prescription drugs, its scope extends to other high-value medical interventions that are influenced by cost sharing. For example, relatively small differences in copayments are associated with substantial changes in mammography rates for women who are recommended to undergo screening (Trivedi et al., 2008). VBID can also be used to promote the choice of different treatment modalities for single diseases or the selection of healthcare providers. For example, the use of medical therapy rather than percutaneous intervention for patients with stable angina or watchful waiting rather than surgery for patients with localized prostatic cancer may be stimulated by copayment changes. Of course, these complex trade-offs often require a nuanced evaluation of clinical circumstance and patient preference. There may, nevertheless, be situations in which the clinical evidence is sufficiently clear to allow benefit design to assist in appropriate treatment choice.
Policy Implications
VBID is a novel benefit design strategy that has attracted much attention in the payer community. While the evidence supporting its ability to improve healthcare quality and reduce health spending has notable limita-
tions, reasonable analyses based on conservative assumptions support the promise of VBID to be a useful adjunct for maximizing healthcare value.
TIERED-PROVIDER NETWORKS AND VALUE
Lisa Carrara
Aetna
There is broad agreement among clinicians, payers, and employers that our current healthcare system needs improving. Along with cost-related concerns, there are healthcare inefficiencies and quality gaps in care delivery. As consumers take more responsibility for healthcare decision making, the demand for specific information on healthcare quality and costs is gaining momentum.
This paper focuses on Aetna’s model of a tiered specialist network that is based on provider performance evaluations. Using certain industry-recognized clinical performance measures and cost efficiency criteria, Aetna analyzes performance of contracted physicians in 12 specialty categories.9 Those who meet necessary standards receive the Aexcel designation. The success of this approach is predicated on the assumption that Aexcel designation can identify and then encourage patient access to specialists who have shown that they deliver efficient, effective care, which can lead to speedier recoveries, fewer complications, and fewer repeat procedures.
Managing Healthcare Costs
One option for managing healthcare costs has been the growth of consumer-directed health plans that place more decision making and financial responsibility directly on consumers. However, for consumer-directed health plans to be effective, consumers need clear, easy-to-understand information. A response to this call for more transparency of cost and clinical quality has been the growth of tiered networks and consumer decision support tools.
Aetna was the first national health insurer to add a consumer-directed health plan to our comprehensive product mix. This effort was closely followed by an introduction of a specialist designation program, called Aexcel, within a tiered network benefit design. The Aexcel designation is given to specialists who demonstrate effectiveness in the delivery of care based on a balance of certain measures of clinical performance and cost-efficiency. Like
tiered pharmaceutical benefits, which set different copayments for generic, brand-name, and nonformulary drugs, tiered networks encourage patients to see Aexcel-designated physicians when in need of specialty care.
Aetna members in all or parts of 23 states and the District of Columbia have online access to clinical quality and efficiency information for Aetna-participating physicians in 12 specialty categories. These specialty categories account for 70 percent of specialty spending and 50 percent of overall medical costs. Specialists who have met certain clinical performance and cost-efficiency standards are designated as physicians that have met these Aexcel standards.
The clinical performance criteria are based on nationally recognized standards, consistent with leading associations, such as the National Quality Forum, National Committee for Quality Assurance, American Board of Medical Specialties, American Osteopathic Association, American Heart Association, American College of Obstetricians and Gynecologists, Agency for Healthcare Research and Quality, Society of Thoracic Surgeons, and Centers for Medicare & Medicaid Services. We also look at external recognition and board certification information specific to the physicians’ Aexcel specialty. When evaluating efficiency, we analyze the cost for services and the number and type of services performed. Our review includes inpatient, outpatient, diagnostic, laboratory, and pharmacy claims. We also use risk-adjustment factors to account for differences in the use of healthcare resources.
Early Observations
Provider performance evaluation programs and the growth of tiered networks are starting to shift behaviors among patients, physicians, and other constituencies in health care. For example, we see a continuous increase in use of our Web-based decision support member tools. As a result, we hope that consumer engagement may ultimately lead to increased provider competition leading to greater value for the consumer. As consumers are better able to assess cost and clinical quality (through Web-based tools), they will make decisions that could result in providers improving their cost competitiveness and enhancing the clinical quality of their services.
Already one of the real benefits of Aexcel has been the way we are able to use the data to better engage physicians. We found many physicians do not have access to information about how their practice compares to their peers in the community. Through the Aexcel evaluation and designation process, we are able to work with physician groups to assist them in better understanding their practice patterns and where they might make improvements.
Savings Estimates
Aexcel providers have demonstrated performance that is 1 to 8 percent more cost-efficient than their peers within a given network. This efficiency calculation is derived based on a plan design that considers specialists in the 12 specialist categories who do not receive Aexcel designation as out-of-network providers for Aexcel members. This plan design also assumes no out-of-network benefits. By implementing such a plan design model and assuming roughly 90 percent use of Aexcel-designated specialists (some specialists that may not have met the Aexcel criteria may sometimes be needed for access purposes, consequently 100 percent use probably will not occur), we estimate a customer may save in a range of 3 to 4 percent of its annual claims in its first year, offset by a service charge.
If this type of tiering program were implemented more broadly, we could extrapolate our program savings calculation more broadly. A review of the experience of Aetna members in 2008 and 2009 showed that, on average, Medicare members used twice as many specialist services as their commercial counterparts and that Medicaid members used about the same, or slightly more. Aetna’s Medicaid members are primarily under age 65 and not dually eligible.
Based on our experience, we hypothesize that the savings realized on a national scale might be similar or potentially greater than the savings that our commercial customers realize as savings are directly tied to use of specialist providers, which Medicare and Medicaid beneficiaries generally use at greater frequencies than commercially insured members at Aetna. Our estimates apply only to those specialties included in our tiered network design.
Drivers of Success
Aetna’s experience has revealed some critical drivers of success that are essential in implementation of tiered networks. We establish a tiered network in markets where
-
Significant customer commitment and willingness to collaborate exists,
-
The existing Aetna network is sufficiently robust to allow for the selection of a performance specialist network, and
-
Variation in cost-efficiency across specialists is significant such that selecting a performance network results in projected financial savings sufficient to warrant a limitation of the network.
Benefit plan design with member incentives that requires the exclusive use of Aexcel-designated physicians for the 12 specialty categories appears
to be more effective in persuading members to use specialists in the tiered networks. Physicians’ participation in the designation process greatly contributes to the successful roll out and maintenance of tiered networks. We proactively collaborate with the medical community, including outreach to key medical organizations and local markets’ staff engagement with providers in their geographical areas. Our Aexcel selection methodology aligns with the physician contracting process and allows for performance evaluation at the group level rather than individual physician level.
Future Considerations
Even though Aexcel provides a promising model for broader replication, there are still gaps in data that need to be considered as we move forward. The claim-based clinical quality and efficiency information is based on Aetna member claim data only. We support industry-wide data collection initiatives, and when this credible combined data becomes available, we will consider using it in our evaluations. The information used to evaluate physicians does not include all procedures, lab, or pharmacy data—only those for which Aetna has claim data. We strongly encourage physicians to reach out to us with additional data they might have in medical charts that is not available to us through claims data. Some providers and provider groups cannot be evaluated for Aexcel designation due to too few Aetna patient encounters for credible analysis. During the review process, we consider that some doctors may treat patients with more than one health issue or more complex conditions. While we use industry-recognized methods for accounting for this issue, a perfect mechanism that accounts for all variations between patient populations still does not exist.
Peer performance fluctuation—since providers are evaluated against their peers in the same specialty and in their geographical area, changes in peer performance affect performance results of a given provider, which may affect projected savings. Another consideration is that provider contracting and movement (e.g., leaving an existing group, joining a new practice, gaining or losing an affiliation with a hospital) causes fluctuation in network configuration and savings from year to year. This is a characteristic common to all provider networks.
Physician performance measurement initiatives and healthcare transparency are at the top of the list for professional medical organizations, health plans, legislators, consumer rights groups, and providers themselves. Many health plans now operate under the oversight of an external monitor, a third party that regularly audits these selection processes. Recommendations by the external monitor to the health plan are a natural and expected outcome of these audits and are intended to ensure complete compliance with the agreement provisions and review requirements. Health plans are expected to incorporate the recommendations and make adjustments to
their programs as appropriate in a timely manner. Failure to do so may result in disciplinary and financial consequences to the health plan.
Conclusion
The Aetna Performance Network featuring Aexcel-designated specialists is one of a series of industry-leading initiatives from Aetna designed to address rising medical costs, maintain access to quality care, and help consumers make more informed healthcare decisions. Aexcel designation can encourage access to specialists who have shown that they deliver efficient, effective care, which can lead to speedier recoveries, fewer complications, and fewer repeat procedures.
SIMPLIFYING ADMINISTRATIVE COMPLEXITY
Robin J. Thomashauer, M.H.S.A.
Council for Affordable Quality Healthcare
Recent studies estimate that between $30 billion and $33 billion of unnecessary costs can be extracted from the healthcare industry specifically by automating administration, which is still predominantly a manual and paper-based system (Goldstein, 2009; U.S. Healthcare Efficiency Index, 2009). Industry collaboration addressing the use of electronic administrative data are significantly reducing administrative burden for both payers and providers in several areas. These efforts have sparked renewed interest within the national dialogue on health reform.
The Council for Affordable Quality Healthcare, a nonprofit healthcare industry alliance that is helping drive payer collaboration and process consolidation through national, multistakeholder initiatives, is engaged in two initiatives that are producing real results in the marketplace today: the Committee on Operating Rules for Information Exchange (CORE) and the Universal Provider Datasource (UPD). This paper provides an overview of UPD and CORE as two examples of effective industry collaboration with a special focus on a recent study of the actual cost savings, benefits, and national implications of CORE certification.
Universal Provider Datasource (UPD)
UPD replaces multiple organization-specific paper processes with a single uniform system for the collection of provider data that is used for a wide range of purposes including credentialing and provider directories. Through a secure, centralized online service, the system has already reduced the administrative costs associated with credentialing healthcare provid-
ers by almost $90 million per year and eliminated more than 2.3 million legacy paper applications. Participating organizations report significant increases in the efficiency of numerous processes, including outreach to providers, data entry, application storage, and application turnaround time (Figure 11-3). UPD is used by over 745,000 providers and more than 500 public and private organizations throughout the United States, with enrollment increasing by approximately 8,000 providers per month. Use of the data is authorized only by the individual provider. Currently, 12 states have adopted the Council for Affordable Quality Healthcare Uniform Provider Credentialing application as their state standard. The initiative has received strong and broad-based industry support from America’s Health Insurance Plans, American Academy of Family Physicians, American College of Physicians, American Health Information Management Association, American Medical Association, Medical Group Management Association, Healthcare Administrative Simplification Coalition, and others.
Although the UPD was originally conceived as a credentialing tool for hospitals and health plans, its value as a data source for other uses is quickly growing. Kentucky has the first state Medicaid agency to participate in UPD for its provider enrollment efforts, with New York, Pennsylvania, Arizona, and Virginia Medicaid agencies now in active discussions. The Council for Affordable Quality Healthcare is also piloting the use of UPD to enable providers to volunteer in the event of a large-scale emergency by allowing electronic forwarding of their data to designated state emergency responder registries. The Massachusetts System for Advanced Registration is the first such program to collaborate on this effort. In addition, hospitals are increasingly using UPD as an administrative simplification solution with almost 50 organizations currently participating. To address the interests of a range of different size hospitals, the Council for Affordable Quality Healthcare is working with natural aggregators such as the Vermont Association of Hospitals and Health Systems to encourage standardization of data collection for credentialing.
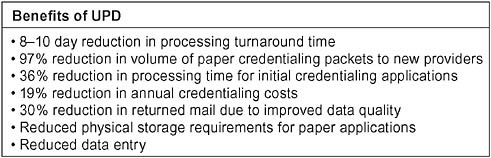
FIGURE 11-3 Efficiencies reported to the Council for Affordable Quality Healthcare by UPD participants.
Additionally, the Council for Affordable Quality Healthcare is studying the feasibility of expanding the UPD functionality to include a continuous primary source verification process. There is potential for a game-changing approach to primary source verification that will eliminate the need for periodic recredentialing, while improving the quality, timeliness, and consistency of reported primary source data at a lower cost for the industry.
Committee on Operating Rules for Information Exchange (CORE)
CORE is developing and promulgating operating rules built on national standards, such as the Health Insurance Portability and Accountability Act (HIPAA), that are facilitating administrative data exchange and promoting interoperability. The vision of CORE is to enable provider access to healthcare administrative information before or at the time of service using the electronic system of their choice for any patient or health plan. A recent study concluded industry-wide implementation of CORE phase I could save the industry an estimated $3 billion over 3 years (IBM Global Business Services, 2009). Phase I rules target eligibility and benefits data to address the need for providers to receive actionable information when verifying patient coverage. Through subsequent phases, CORE is employing its operating rule concept to other administrative transactions in the claims process. Receiving this information electronically and in real time removes a key barrier to broader adoption of information technology by giving providers valuable information that affects their revenue cycle and creates a sustainable environment encouraging change.
A cost benefit study of CORE phase I rules conducted by IBM revealed that electronic transactions for eligibility verification increased 33 percent in one year for participating health plans (Table 11-7), with an average annual cost avoidance of over $2.6 million (Table 11-8) and total return on investment realized within the first 12 months.
Providers in the same study improved accounts receivables through reducing claim eligibility denials by 10 to 12 percent and saving $2.60 for every electronic verification (Table 11-8). Additionally, the average provider saw patient visit verifications increase by 24 percent while some doubled the number of patients verified.
Results common across stakeholder groups include enhanced flow of information between providers and health plans, and the ability of stakeholders to leverage current infrastructure investments and streamline implementations with partners that are CORE certified (Figure 11-4).
The study analyzed eligibility-related data from 3 months prior to health plan CORE certification and 1 year after, including eligibility verification methods and volumes, claim rejections and denials, customer satisfaction, and cost of adoption. Participants were from various stakeholder
TABLE 11-7 Change in Health Plan Electronic Eligibility Volumes 1 Year After CORE Certification
|
Method |
Percent Change in Volumes (total for all plans) |
Largest Percent Change for an Individual Plan |
Smallest Percent Change for an Individual Plan |
Comments |
|
Real-time electronic eligibility, integrated and “on demand” (using HIPAA 270/271 eligibility transactions) |
39% |
48% |
10% |
Largest/smallest percentage changes exclude a plan that did not previously offer real time |
|
Real-time electronic eligibility via direct data entry (using health plan or branded portal product) |
30% |
57% |
18% |
|
|
Total electronic eligibility (real-time “on demand” plus real-time direct data entry and batch) |
33% |
74% |
15% |
Includes batch that was only reported by one plan and decreased when real time was offered |
|
SOURCE: IBM Global Business Services, 2009. |
||||
groups with all but some providers CORE certified, including national and regional health plans, clearinghouses, vendors, and providers representing 33 million commercial members and 30 million claims per month.
Potential savings to the industry due to industry-wide CORE phase I certification are substantial, estimated at $3.3 billion over three years beginning in 2010 through 2012 (Table 11-9).10 The foundation has been established to build on CORE in order to realize those savings. Beyond
TABLE 11-8 Benefits to Health Plans and Providers
|
Stakeholder |
Description of Benefit |
Cost Benefit |
|
Health plan results* |
One-time cost of certification |
$542,800 |
|
Annual ongoing costs |
$49,200 |
|
|
Ratio of verification to claims |
Up from .63 to .73 |
|
|
Annual savings due to shift from telephone to electronic |
|
|
|
Provider results |
Decrease in claim eligibility denials |
10-12% |
|
Increase in percent of patients verified |
24% |
|
|
Save 7 minutes per electronic verification |
$2.60 per verification |
|
|
*Percent change first quarter 2008 over first quarter 2007. Plans in the study had high baseline electronic eligibility volumes compared to the industry, so results could be even more substantial for health plans with lower electronic verification rates SOURCE: IBM Global Business Services, 2009. |
||
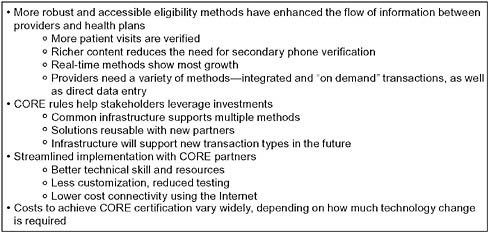
FIGURE 11-4 Results common to all stakeholders.
SOURCE: IBM Global Business Services, 2009.
phase I, CORE has established the industry structure for expanding the concept of operating rules across all administrative transactions, thereby
TABLE 11-9 Potential National Savings Due to Industry-Wide CORE Phase I Certification
|
|
2010 |
2011 |
2012 |
3-Year Total |
|
|
(in millions) |
|||
|
Savings/electronic eligibility volumes |
|
|
|
|
|
Estimated number of electronic eligibility transactions, baseline 10% *CAGR |
572 |
629 |
692 |
1,893 |
|
Estimated number of electronic eligibility transactions with CORE, 25% CAGR |
650 |
813 |
1,016 |
2,478 |
|
Additional electronic eligibility transactions due to CORE |
78 |
183 |
324 |
585 |
|
Savings due to additional electronic transactions due to CORE |
$359 |
$843 |
$1,488 |
$2,690 |
|
Foundation for other administrative healthcare transactions |
$90 |
$211 |
$372 |
$673 |
|
TOTALS |
$449 |
$1,054 |
$1,860 |
$3,363 |
|
Other Impacts |
|
|
|
|
|
Percentage of visits verified with CORE (target 100%) |
55% |
61% |
69% |
n/a |
|
Reduced claim denials due to eligibility |
10-12% reduction in denials, 0.5-1.5% of net patient revenue |
|||
|
Reduced time to set up new information exchange partners |
20-80% |
|||
|
Reduced connectivity costs |
To be determined |
|||
|
*CAGR = compound annual growth rate. SOURCE: IBM Global Business Services, 2009. |
||||
significantly increasing the potential savings. In fact, organizations can leverage the investment already made in CORE to support additional transactions and incorporate newer technologies such as swipe cards and real-time adjudication. As the partners of CORE-certified entities also begin to follow the rules, they can continue to shift transactions from proprietary solutions to standard real-time and batch electronic transactions. Although the full capabilities needed for interoperability will take time to evolve into marketplace reality, real, lasting, and broad change can happen now. For example, many providers are already enhancing the eligibility process by moving to electronic transactions, creating streamlined electronic connections, modifying work flow, and training staff to take advantage of the improved information coming from CORE-certified health plans.
Leveraging Clinical Information System Reform
As the federal government works to implement the Health Information Technology for Economic and Clinical Health Act (HITECH) of the American Recovery and Reinvestment Act, the inclusion of administrative data in the framework defining the “meaningful use” of health information technology is critical to realizing national policy priorities. The use of administrative data in the near and medium term represents an essential and available migration path to the eventual marriage of clinical and administrative data, providing visibility and transparency into the cost-effectiveness of high-quality healthcare services.
Until clinical data becomes more readily available, administrative data remains a key source of information with which to evaluate the progress toward a value-driven system. It can be used to support near-term population-level research priorities, to benchmark quality initiatives, and to support the growing adoption of electronic personal health records and electronic medical records.
Administrative data also serves as part of the foundation needed to promote coordination of care across providers in a health information exchange. For example, market adoption of the CORE transport has enabled one-to-one exchange between providers and payers across the country, creating a basis for one-to-many data exchange relationships that is essential to the proliferation of interoperable systems. In a study by the eHealth Initiative, eligibility inquiries represent some of the high transaction volumes within health information exchange efforts focused on clinical data interchange (eHealth Initiative, 2008). The more the “meaningful use” objectives incorporate current health information technology in federal efforts and/or industry initiatives that have significant momentum, the greater potential for accomplishing federal policy priorities. For example, the CORE technical specifications gaining momentum in administrative data transport, also known as connectivity, were designed to be aligned with the Healthcare Information Technology Standards Panel specifications. CORE also aligned its data content rules with the expected requirements for V5010 of HIPAA. Both of these examples demonstrate the importance of integrating multiple approaches in order to advance adoption. Through agreement on a common transport and its related authentication and security, the full potential of the Internet to serve as a mechanism in changing health care moves closer to becoming a reality.
Finally, administrative cost savings, such as those enabled by CORE, will help providers achieve the benefits they need to embrace the bigger vision of transforming the system since stimulus dollars alone will not be enough to fund the move to broader healthcare information technology needed in the care delivery process.
Final Note
Cross-industry, public–private collaboration is a successful strategy for developing solutions with lasting change. UPD is saving millions of dollars for providers, and its established framework is now being considered as a vehicle for achieving additional industry-wide savings and quality improvements. CORE continues to expand operating rules built on national standards that are helping organizations achieve the interoperability that has eluded the healthcare industry for many years. Continued collaboration focused on both short- and long-term goals, coupled with appropriate policy support through the federal government, is necessary to achieve the widespread adoption of administrative simplification solutions; solutions that promise real reform in both cost efficiency and quality.
TECHNOLOGY AND SIMPLIFYING HEALTHCARE ADMINISTRATION
David S. Wichmann
UnitedHealth Group
The nation is grappling with how to respond to the stark and disturbing realities of too little quality health care and too much waste. America is simply not getting good value for the $2.6 trillion it spends on health care (CBO, 2008a). Of the $2.6 trillion, an estimated $290 billion per year is spent on the administrative costs at care providers and public and private payers (CBO, 2008a).
This article identifies practical ways in which technology can save money by modernizing the administrative and transactional aspects of health care. Its focus is on savings across the healthcare system as a whole—savings that will initially accrue to physicians, hospitals, payers, and government—but ultimately to consumers of health care through reduced premiums, lower taxes, and improved diagnosis, treatment, and outcomes.
Through 12 building blocks, we have identified administrative savings opportunities of $332 billion in national health expenditures over the next decade (UnitedHealth Group, 2009). Of these savings, approximately 50 percent would accrue to providers, 20 percent directly to government in its role as healthcare payer, and 30 percent to commercial payers (UnitedHealth Group, 2009). These savings would likely benefit families and employers through lower healthcare costs. As importantly, they would simplify the lives of patients and eliminate much frustration on the part of doctors and hospitals.
These proposals and the savings estimates included herein are derived from UnitedHealth Group’s experience—not just as a large payer and care
management organization, but as one of the largest healthcare technology companies in the United States. UnitedHealth Group’s 12,000 technology professionals oversee 30 terabytes of healthcare data, invest 7 million hours in application development, and oversee 60 billion transactions annually. In funding and arranging $115 billion of health care we interact with over 5,000 hospitals and 650,000 physicians across the country.
In this analysis, we limit the discussion to administrative savings, but several of the options raised here easily translate into medical cost savings and better health outcomes. For instance, integrating essential elements of personal health and electronic medical records and using predictive modeling to prescore claims could save an additional $464 billion in medical costs over the next decade (UnitedHealth Group, 2009). None of these savings are included in the $332 billion administrative cost savings figure.
The Options
The ideas in this article are supportive of industry-wide approaches to administrative simplification being advanced by others. While not intended as a comprehensive list of options, we believe the 12 approaches identified provide a strong foundation from which to advance an ongoing administrative simplification agenda. The options we studied fall into three broad categories11:
-
Use common technology and information standards with enhanced interoperability and connectivity. These reforms leverage the benefits of modern and available technology to reduce administrative waste.
-
Use advanced systemwide techniques to improve payment speed and accuracy. Common claims handling and clearing improves claims processing and proactively prescores claims to prevent overpayments.
-
Streamline provider credentialing, privileging, and quality designation processes. There are numerous opportunities for deployment of select industry utilities to reduce administrative burdens, particularly on care providers.
In more detail, these three categories can be further broken down into 12 specific recommendations, summarized in Table 11-10. The cost drivers targeted in each of these options include excessive manual processing, duplicate entry of data, paper distribution of transaction authentication and other information, use of intermediaries where they enable excessive process variation, administration associated with medical overpayments, and the costs of process proliferation. In each case, where individual options are interdependent or potentially overlap, we sought to account for possibly duplicative savings estimates. Further, each estimate is prepared net of the costs to administer each option.
Use Common Technology and Information Standards, with Enhanced Interoperability and Connectivity
The necessary reforms for reducing administrative waste require a firm foundation. More rapid adoption of tighter data and transaction standards, starting with CORE phase I and II eligibility and benefit rules, should precede a quick move to tightened standards for exchanging other HIPAA items, including claims submission, claims inquiry, electronic funds transfer, electronic remittance and autoposting, prior authorization/notification, and demographic updates. These new standards should also cover critical encounter data, such as care plan, lab results, conditions, and medication orders. A health information exchange could facilitate the sharing of this information in a fully secure, private environment. The information will then assist care providers and health plans in engaging patients and coordinating care.
From this foundation, a number of other reforms will be necessary and, in fact, are natural extensions of the new commitment to interoperability and connectivity. Using secure swipe card technology—or an appropriate automated link to a doctor’s or hospital’s systems—the provider can view in real time the patient’s eligibility for benefits, and accurately ascertain what will be reimbursed by the insurer/employer and process the claim. Consumers receive monthly health statements electronically instead of an explanation of benefits for each individual service. These statements would combine all healthcare activity and explain clearly to patients which elements their employer/insurer was responsible for. In fact, all providers should be required to receive both claims payments and remittance advices electronically, which eliminates millions of dollars in printing and postage
TABLE 11-10 Summary of Proposed Actions/Recommendations: 2010-2019 Savings
|
Option |
2010-2019 Savings |
|
A. Use of common technology and information standards, with enhanced interoperability and connectivity |
|
|
Option 1: Rapidly develop and adopt systemwide data and transaction standards to simplify administration and improve patients’ diagnosis, treatment, and outcomes. |
Foundational |
|
Option 2: Use of automated cards to validate patient eligibility and benefits at the point of service. |
~$18 billion |
|
Option 3: Eliminate explanation of benefits for each transaction and replace with monthly personalized health statements, delivered through secure online portals where possible. |
~$14 billion |
|
Option 4: Eliminate paper checks and paper remittance advice in favor of electronic funds transfer and electronic remittance advice. |
~$109 billion |
|
Option 5: Implement multipayer transactional capability on practice management information systems. |
~$29 billion |
|
Option 6: Expand use of electronic data interchange for claims, eligibility, and coverage verification, notification/administration, and claims status. |
~$31 billion |
|
Option 7: Integrate practice management information systems and payer administrative systems. |
~$11 billion |
|
Option 8: Integrate essential elements of electronic medical records and personal health records and promote information sharing and use of data to improve prevention and coordination of care. |
~$13 billion |
|
B. Use advanced systemwide techniques to improve payment speed and accuracy |
|
|
Option 9: Use predictive modeling to prescore claims for coordination of benefits, upcoding, subrogation, fraud and medical management prior to payment. |
~$47 billion |
|
Option 10: Create a national payment accuracy clearinghouse to settle underpayments and overpayments. |
~$41 billion |
|
C. Streamline provider credentialing, privileging, and quality designation processes |
|
|
Option 11: Eliminate multiple payer credentialing and separate hospital privileging. Develop industry utility for credentialing. |
~$18 billion |
|
Option 12: Adopt common quality designation standards and create single health information database for quality determination. |
~$1 billion |
|
SOURCE: UnitedHealth Center for Health Reform & Modernization. 2009. Health Care Cost and Containment—How Technology Can Cut Red Tape and Simplify Health Care Administration-Working Paper #2. Minneapolis: UnitedHealth Center for Health Reform & Modernization. Reprinted with permission from UnitedHealth Center for Health Reform & Modernization. |
|
costs and improves efficiency with bundled payments deposited directly into providers’ bank accounts.
These systems require an information system infrastructure that is still far from a reality in most areas of this country. But if the variation arising from individual payers’ requirements were meaningfully reduced or eliminated, direct provider Practice Management Information System to payer connectivity would be possible. The resulting system would support a few superregional hub gateways that aggregate payer connectivity and that provide gateways to direct provider connectivity or local geographic aggregator health information exchanges. These gateways would handle the full range of electronic connectivity for payers and could, in addition to providing administrative and financial functions, also provide clinical connectivity and analytics, surveillance, and other services.
Systemwide Techniques to Improve Payment Speed and Accuracy
A national predictive model prescoring service would actively monitor and flag claims prior to payment, leading to a more robust real-time adjudication process for most payments. This service, coupled with the establishment of a national payment accuracy clearinghouse, would reduce the instances of mispayment and administrative friction between payers and providers.
Provider Credentialing, Privileging, and Quality Designation Processes
Using a single standardized process for accreditation and licensing nationwide would reduce costs for physicians and hospitals without compromising quality. The government could facilitate this process by creating an antitrust safe harbor allowing hospitals and health plans to agree on common rules and standards. An industry program would then be developed and deployed for provider credentialing.
Similarly, we could accelerate the adoption of industry-wide rules and systems for data aggregation and measurement methodologies. Health plans and Medicare, working collaboratively with physicians, hospitals, and other key stakeholders, would agree on the infrastructures and processes necessary to efficiently pool local data across health plans and settings of care. A new independent public–private partnership at the national level would lead and accelerate consistency in the processes necessary to achieve this and ensure uniformity across the country. As a result, physicians would be able to access, correct, and use their local aggregated data for performance improvement. Researchers and others would benefit by using the aggregated data for tracking and developing quality improvement interventions. Regarding performance measures themselves, and the
methodologies underlying the process of performance measurement, there currently exists a useful infrastructure upon which to build (e.g., National Quality Forum and the American Medical Association’s Performance Consortium for Performance Improvement).
Focusing on Administrative Waste in Context
Administrative programs can have important positive effects on reducing wasteful medical costs. Fraud reduction programs are the most obvious example, where there is ample evidence that Medicare’s administrative underinvestment in fact costs taxpayers through avoidable fraud (GAO, 2008a, 2008b, 2009). Health plans—and self-insured employers—also spend administratively on a wide range of programs that provide patients information to support them in making informed choices, and that identify and offer incentives for best practices on the part of physicians and hospitals.
Even so, the Congressional Budget Office estimates that health plans’ use of these administrative initiatives can reduce medical costs by 5 to 10 percent (CBO, 2008b). It follows that minimizing administrative costs should not be a public policy goal in isolation, and reform options for new programs should be assessed against their ability to tackle the well-documented problems of fraud, waste, and inappropriate use that affect U.S. health care today.12
What’s Next?
Our experiences suggest that even where the technology exists and efforts have been made to introduce it, its full potential is not being realized. We believe that shared consistent action is now needed across all payers—commercial and governmental—in partnership with physicians and hospitals calling for tighter data and transaction standards, seamless health information exchanges, automated processes to replace antiquated manual systems, and standardization of such processes as credentialing and quality measurement.
With this commitment, we should be able to identify and support only those value-added administrative programs including those that make a substantive contribution to achieving better care.
The momentum is building. America’s Health Insurance Plans, the Council for Affordable Quality Healthcare, the American Medical Associa-
tion, and others have been working with government and the private sector to address the opportunities outlined herein. Key to that success will be to first lay the foundations of tighter standards and information exchange through a series of public–private partnerships that overcome traditional barriers to implementation—while maintaining the spirit of innovation that rests within the private sector—and will improve health care for decades to come.
REFERENCES
AHIP (America’s Health Insurance Plans). 2006. An updated survey of health care claims receipts and processing times. AHIP Center for Policy and Research.
——. 2009. Administrative simplification recommendations: Provider-health plan interface. AHIP Administrative Simplification Task Force.
AHRQ (Agency for Healthcare Research and Quality). 2005. Percent distribution of total expenses by source of payment: United States, medical expenditure panel survey component data. Rockville, MD: AHRQ.
Balkrishnan, R., R. Rajagopalan, F. T. Camacho, S. A. Huston, F. T. Murray, and R. T. Anderson. 2003. Predictors of medication adherence and associated health care costs in an older population with type 2 diabetes mellitus: A longitudinal cohort study. Clinical Therapeutics 25(11):2958-2971.
Blue Cross Blue Shield of Massachusetts. 2008. The Alternative Quality Contract. http://www. qualityaffordability.com/solutions/alternative-quality-contract.html (accessed 2009).
Bottles, K. 2009. Decision-support alternative to prior authorization for ordering high-tech diagnostic imaging scans. Institute for Clinical Systems Improvement.
Bourbeau, J., M. Julien, F. Maltais, M. Rouleau, A. Beaupre, R. Begin, P. Renzi, D. Nault, E. Borycki, K. Schwartzman, R. Singh, and J. P. Collet. 2003. Reduction of hospital utilization in patients with chronic obstructive pulmonary disease: A disease-specific self-management intervention. Archives of Internal Medicine 163(5):585-591.
Casale, A. S., R. A. Paulus, M. J. Selna, M. C. Doll, A. E. Bothe, Jr., K. E. McKinley, S. A. Berry, D. E. Davis, R. J. Gilfillan, B. H. Hamory, and G. D. Steele, Jr. 2007. “ProvenCaresm”: A provider-driven pay-for-performance program for acute episodic cardiac surgical care. Annals of Surgery 246(4):613-621; discussion 621-613.
Casalino, L., S. Nicholson, D. Gans, T. Hammons, D. Morra, T. Karrison, and W. Levinson. 2009. What does it cost physician practices to interact with health insurance plans? Health Affairs (Millwood) 28(4):w533-w543.
CBO (Congressional Budget Office). 2008a. Key issues in analyzing major health insurance proposals. Washington, DC: Congressional Budget Office.
——. 2008b. Key issues in analyzing major health insurance proposals. Washington, DC: Congressional Budget Office.
Center for Healthcare Quality and Payment Reform. 2009a. Is shared savings the way to reform payment? http://www.chqpr.org/downloads/SharedSavings.pdf (accessed 2009).
——. 2009b. Transitioning to episode-based payment. http://www.chqpr.org/downloads/TransitioningtoEpisodes.pdf (accessed 2009).
Chernew, M. E., A. B. Rosen, and A. M. Fendrick. 2007. Value-based insurance design. Health Affairs (Millwood) 26(2):w195-203.
Chernew, M. E., M. R. Shah, A. Wegh, S. N. Rosenberg, I. A. Juster, A. B. Rosen, M. C. Sokol, K. Yu-Isenberg, and A. M. Fendrick. 2008. Impact of decreasing copayments on medication adherence within a disease management environment. Health Affairs (Millwood) 27(1):103-112.
Choudhry, N. K., J. Avorn, E. M. Antman, S. Schneeweiss, and W. H. Shrank. 2007. Should patients receive secondary prevention medications for free after a myocardial infarction? An economic analysis. Health Affairs (Millwood) 26(1):186-194.
Choudhry, N. K., A. R. Patrick, E. M. Antman, J. Avorn, and W. H. Shrank. 2008. Cost-effectiveness of providing full drug coverage to increase medication adherence in post-myocardial infarction Medicare beneficiaries. Circulation 117(10):1261-1268.
Choudhry, N. K., M. B. Rosenthal, and A. Milstein. unpublished. Basing cost sharing on value: An evidence-based look at value-based insurance design. Unpublished.
CMS (Centers for Medicare & Medicaid Services). 2008. National health expenditures and selected economic indicators, levels and annual percent change: Calendar years 2002-2017.
——. 2009. National health expenditure projections 2008-2018. http://www.cms.hhs.gov/NationalHealthExpendData/downloads/proj2008.pdf (accessed June 11, 2009).
Cordisco, M. E., A. Benjaminovitz, K. Hammond, and D. Mancini. 1999. Use of telemonitoring to decrease the rate of hospitalization in patients with severe congestive heart failure. American Journal of Cardiology 84(7):860-862, A868.
Cromwell, J., D. A. Dayhoff, and A. H. Thoumaian. 1997. Cost savings and physician responses to global bundled payments for Medicare heart bypass surgery. Health Care Financing Review 19(1):41-57.
de Brantes, F. under review. Chronic care cost burden: Approximately half the cost of care spent on six chronic conditions is potentially avoidable. Health Affairs.
de Brantes, F., and A. Rastogi. 2008. Evidence-informed case rates: Paying for safer, more reliable care. Issue Brief (Commonwealth Fund) 40:1-13.
de Brantes, F., G. D’Andrea, and M. B. Rosenthal. 2009. Should health care come with a warranty? Health Affairs (Millwood) 28(4):w678-687.
Dudley, R., C. Tseng, K. Bozic, W. Smith, and H. Luft. 2007. Consumer financial incentives: A decision guide for purchasers. Rockville, MD: Agency for Healthcare Research and Quality.
Edmonds, C., and G. L. Hallman. 1995. Cardiovascular care providers. A pioneer in bundled services, shared risk, and single payment. Texas Heart Institute Journal 22(1):72-76.
eHealth Initiative. 2008. Fifth Annual Survey of Health Information Exchange at the State and Local Levels: Overview of 2008 Findings. Washington, DC: eHealth Initiative.
Fairman, K. A., and F. R. Curtiss. 2008. Making the world safe for evidence-based policy: Let’s slay the biases in research on value-based insurance design. Journal of Managed Care Pharmacy 14(2):198-204.
Fendrick, A. M., D. G. Smith, M. E. Chernew, and S. N. Shah. 2001. A benefit-based copay for prescription drugs: Patient contribution based on total benefits, not drug acquisition cost. American Journal of Managed Care 7(9):861-867.
Gadoury, M. A., K. Schwartzman, M. Rouleau, F. Maltais, M. Julien, A. Beaupre, P. Renzi, R. Begin, D. Nault, and J. Bourbeau. 2005. Self-management reduces both short- and long-term hospitalisation in COPD. European Respiratory Journal 26(5):853-857.
GAO (Government Accountability Office). 2008a. Medicare Part B imaging services: Rapid spending growth and shift to physician offices indicate need for CMS additional management practices. GAO-08-452.
——. 2008b. Medicare: Covert testing esposes weaknesses in the durable medical equipment supplier screening process. GAO-08-955.
——. 2009. Medicare: Improvements needed to address improper payments in home health. GAO-09-185.
Goldman, D. P., G. F. Joyce, and P. Karaca-Mandic. 2006. Varying pharmacy benefits with clinical status: The case of cholesterol-lowering therapy. American Journal of Managed Care 12(1):21-28.
Goldman, D. P., G. F. Joyce, and Y. Zheng. 2007. Prescription drug cost sharing: Associations with medication and medical utilization and spending and health. Journal of the American Medical Association 298(1):61-69.
Goldstein, M. 2009. United Health Sees $332 Billion in U.S. Health Savings. http://www.reuters.com/article/rbssFinancialServicesAndRealEstateNews/idUSN3044468420090630 (accessed 2009).
Gosfield, A. 2009. Getting the team paid: How Medicare physician payment policies impede quality. Health Law Handbook 2(17):72.
IBM Global Business Services. 2009. CAQH CORE Phase 1 Measures of Success Study. http://www.caqh.org/COREIBMstudy.php (accessed 2009).
IOM (Institute of Medicine). 2007. Rewarding Provider Performance: Aligning Incentives in Medicare (Pathways to Quality Health Care Series). Washington, DC: The National Academies Press.
Johnson, L. L., and R. L. Becker. 1994. An alternative health-care reimbursement system—Application of arthroscopy and financial warranty: Results of a 2-year pilot study. Arthroscopy 10(4):462-470; discussion 471-462.
Kaelber, D., and E. C. Pan. 2008. The value of personal health record (PHR) systems. American Medical Informatics Association Annual Symposium Proceedings 343-347.
Kaiser Family Foundation. 2008. Employer Health Benefits: 2008 Annual Survey: Annual Average Premiums for Single and Family Coverage, 1999-2008. Kaiser Family Foundation and Health Research & Educational Trust.
Kaiser Family Foundation and Health Research & Educational Trust. 2009. Employer Health Benefits Annual Survey, 1999-2008. http://www.kff.org/insurance/7672/index.cfm (accessed July 9, 2009).
LeCuyer, N., and S. Singhal. 2007. Overhauling the U.S. Health Care Payment System. http://www.mckinseyquarterly.com/Overhauling_the_US_health_care_payment_system_ 2012 (accessed 2009).
Lee, T. H., and T. G. Ferris. 2009. Pay for performance: A work in progress. Circulation 119(23):2965-2966.
Lyles, A., J. P. Weiner, A. D. Shore, J. Christianson, L. I. Solberg, and P. Drury. 2002. Cost and quality trends in direct contracting arrangements. Health Affairs (Millwood) 21(1):89-102.
Mahoney, J. J. 2005. Reducing patient drug acquisition costs can lower diabetes health claims. American Journal of Managed Care 11(5 Suppl):S170-S176.
Mechanic, R. E., and S. H. Altman. 2009. Payment reform options: Episode payment is a good place to start. Health Affairs (Millwood) 28(2):w262-w271.
MedPAC (Medicare Payment Advisory Commission). 2008. Report to Congress. http://www. medpac.gov/documents/Jun08_EntireReport.pdf (accessed August 26, 2009).
Mercer National Survey of Employer-Sponsored Health Plans. 2008.
Miller, H. 2007. Creating payment systems to accelerate value-driven health care: Issues and options for policy reform. New York: The Commonwealth Fund.
Miller, H. D. 2009. From volume to value: Better ways to pay for health care. Health Affairs (Millwood) 28(5):1418-1428.
Minnesota Department of Health. State of Minnesota’s Baskets of Care Initiative. http://www. health.state.mn.us/healthreform/baskets/index.html (accessed 2009).
Network for Regional Healthcare Improvement. 2009. Pay for innovation or pay standardization: How to best support the patient-centered medical home. http://www.nrhi.org/downloads/NRHI-HowtoSupporttheMedicalHome.pdf (accessed 2009).
O’Connor, A. M., H. A. Llewellyn-Thomas, and A. B. Flood. 2004. Modifying unwarranted variations in health care: Shared decision making using patient decision aids. Health Affairs (Millwood) Suppl Web Exclusives:VAR63-VAR72.
Orszag, P. R., and P. Ellis. 2007. The challenge of rising health care costs—A view from the Congressional Budget Office. New England Journal of Medicine 357(18):1793-1795.
Paulus, R. A., K. Davis, and G. D. Steele. 2008. Continuous innovation in health care: Implications of the Geisinger experience. Health Affairs (Millwood) 27(5):1235-1245.
Pennsylvania Healthcare Cost Containment Council. 2007. Cardiac Surgery in Pennsylvania 2005. http://www.phc4.org (accessed 2009).
Prometheus Payment, Inc. 2008. Prometheus Payment, Inc. http://www.prometheupaymnet.org/ (accessed August 1, 2009).
——. 2009. Prometheus Newsletter Issue 2. http://www.prometheuspayment.org/news-events/newsletters/2009/PPInewsletter09issue2.pdf (accessed 2009).
Rastogi, A., B. A. Mohr, and B. S. Williams. 2009. Prometheus payment model: Application to hip and knee replacement surgery. Clinical Orthopedics and Related Research 2009 467(10).
Robinow, A. 2008. Patient Choice Health Care Payment Model Case Study. http://www.nrhi.org/downloads/RobinowPresentation2008NRHISummit.pdf (accessed November 2009).
Robinson, J. C. 2001. Theory and practice in the design of physician payment incentives. Milbank Quarterly 79(2):149-177, III.
Rosen, A. B., M. B. Hamel, M. C. Weinstein, D. M. Cutler, A. M. Fendrick, and S. Vijan. 2005. Cost-effectiveness of full medicare coverage of angiotensin-converting enzyme inhibitors for beneficiaries with diabetes. Annals of Internal Medicine 143(2):89-99.
Rosenthal, M. B., F. S. de Brantes, A. D. Sinaiko, M. Frankel, R. D. Robbins, and S. Young. 2008. Bridges to excellence—recognizing high-quality care: Analysis of physician quality and resource use. American Journal of Managed Care 14(10):670-677.
Sokol, M. C., K. A. McGuigan, R. R. Verbrugge, and R. S. Epstein. 2005. Impact of medication adherence on hospitalization risk and healthcare cost. Medical Care 43(6):521-530.
Soumerai, S. B., C. Mah, F. Zhang, A. Adams, M. Barton, V. Fajtova, and D. Ross-Degnan. 2004. Effects of health maintenance organization coverage of self-monitoring devices on diabetes self-care and glycemic control. Archives of Internal Medicine 164(6):645-652.
Trivedi, A. N., W. Rakowski, and J. Z. Ayanian. 2008. Effect of cost sharing on screening mammography in Medicare health plans. New England Journal of Medicine 358(4):375-383.
UnitedHealth Group. 2009. Health Care Cost and Containment—How Technology Can Cut Red Tape and Simplify Health Care Administration-Working Paper #2. Minneapolis: UnitedHealth Center for Health Reform & Modernization.
U.S. Healthcare Efficiency Index. 2009. www.ushealthcareindex.com (accessed July 2009). Wisconsin Department of Employee Trust Funds. 2004a. It’s your choice: Group health insurance plans and provisions: 2009.A-3 and A-14.
——. 2004b. It’s your choice: Group health insurance plans and provisions: 2009.A-4 and A-5.
Wyman, O. 2008. Trends in Health Claims for Fully Insured, Health Maintenance Organizations in Massachusetts, 2002-2006. http://www.mass.gov/Eoca/docs/doi/Consumer/MAHMOTrendReport.pdf (accessed November 2009).


