
2
Unnecessary Services
INTRODUCTION
In the 1970s, John Wennberg highlighted the variation in surgical procedures performed among similar patients in various parts of the country (Wennberg and Gittelsohn, 1973). Since then we have learned much more about these practice differences, including their impacts on spending. For example, end-of-life care spending per Medicare beneficiary in New Jersey cost $59,379, compared to $32,523 per beneficiary in North Dakota (Wennberg et al., 2008). Yet existing evidence finds no relationship between higher levels of spending and the quality of care received by patients (Baicker and Chandra, 2004; Yasaitis et al., 2009).
To further explore this area, speakers in this session examine the provision of unnecessary services, highlighting the sequelae of scientific uncertainty, perverse economic and practice incentives, and lack of patient engagement in decisions. In turn, each discusses not only the inefficiencies in the system but opportunities to improve healthcare quality and outcomes for patients. Amitabh Chandra of Harvard University examines quality and cost at the hospital level, confirming that the correlation between cost and quality was either nil or negative. Significantly, he additionally categorizes hospitals in a region by their relative costs and their relative quality based on patient mortality. Using this two-dimensional matrix, he describes the implications on cost and health outcomes should hospital practices in all hospitals mirror those of the most efficient and effective hospitals, estimating that this would not only save thousands of lives but also yield $1 billion or more in savings. While this analysis was limited by
adequate risk-adjustment of claims data, it is suggested that with savings of this magnitude for just three conditions, the potential across all conditions and populations could be substantial. Chandra concludes that these findings support a broader message that, despite the inefficiencies within the American healthcare system, it is possible to save both money and lives.
Using a similar approach of benchmarking, Elliott S. Fisher of Dartmouth College details analyses demonstrating that decreased use of discretionary services in the Medicare program could save approximately $50 billion a year, or approximately 20 percent of current spending. However, he simultaneously acknowledges that this analysis does not account for the significant variation that occurs within regions nor does it specify the policies needed to reduce the observed variations. In conclusion, Fisher suggests that therefore a gradual transition toward a more frugal healthcare system is not only possible but that it could yield substantial savings without lowering quality.
Narrowing the focus to individual clinical decisions, David Wennberg of Health Dialog discusses the use of shared decision-making models as a method for reducing costs as well as for more effectively empowering patients to take control of their treatment decisions. By empowering informed and shared choice by patients through the use of decision aides, Wennberg concludes that the use of surgical procedures, for instance, could be reduced by 20 percent compared to controls. Based on the evidence, he asserts that systematic application of shared decision making (SDM) could reduce total U.S. healthcare expenditures between 1 and 5 percent. Wennberg cautions that data are still needed to assess the financial impact of provider-based SDM on total expenditures, and the effect benefit designs and reimbursement models could have on increasing use of SDM. However, given the potential savings, he recommends a paradigm shift from informed patient consent to informed patient choice.
SAVING MONEY (AND LIVES)
Amitabh Chandra, Ph.D., Harvard University; Jonathan S. Skinner, Ph.D., M.A., and Douglas O. Staiger, Ph.D., Dartmouth College
In a climate of growing concerns about how much our country spends on health care, it is increasingly important to know what we are getting for our money. Previous research has demonstrated a negative relationship between quality and spending at the regional level. However, findings at the level of the Hospital Referral Region (HRR)—a geographic designation devised for the Dartmouth Atlas of Health Care, reflecting referral hospitals’ typical service areas—do not lend themselves to actionable policy. This paper examines the relationship between mortality and spending at an actionable level—in hospitals.
In previous work at the hospital level, we examined whether hospitals that spent more Medicare dollars on their patients in the last 2 years of life performed better on quality indicators (Yasaitis et al., 2009). In that analysis our quality measures came from the publicly available Hospital Compare dataset for the years 2004-2007. We examined 10 measures that collectively encompass care delivered for acute myocardial infarction, congestive heart failure, and pneumonia. Our measure of spending was the portion of end-of-life spending on Medicare beneficiaries that can be attributed to differences in the intensity of use, as opposed to payments that reflect differences in price levels, Disproportionate Share Hospital payments for treating low-income patients, or graduate medical education. When we compared spending to performance on quality indicators, we found no evidence of a positive relationship, and obtained similar results when we limited our investigation to academic medical centers and when we examined the relationship between spending and quality within narrowly defined HRRs.
In this report, we extend our earlier published study by looking at survival as an outcome measure and Medicare spending per beneficiary. While in the past we looked at process-based, quality-of-care indicators, here we focus on the more relevant measure of survival, yet recognizing that it is also substantially more sensitive to risk adjustment. While HRRs, which are large geographic units, may have patients with similar illnesses, individual hospitals are more likely to vary in the degree to which they treat sick and healthy patients. Consequently, risk adjustment at the hospital level is a more important concern than at the HRR level. While we continue to make progress on this challenge, it remains an important caveat to the analysis below.
Relationship Between Spending and Outcomes
We measured 1-year survival and total costs (Medicare Parts A and B spending) at the hospital level for Medicare beneficiaries with acute myocardial infarction, hip fracture, and colon cancer in 2003-2005.1 These conditions have higher rates of 1 year of mortality and generally require some inpatient care. Also, these conditions have a much narrower clinical area for physician discretion in diagnosis. Because our spending measure incorporates both inpatient spending and spending on physician services
we are unable to separate the role of factors within the hospital (such as the quality of facilities and nursing staff) from explanations that rely on physicians being responsible for the variation in outcomes. Therefore, we use the words hospital and provider interchangeably in our descriptions to reflect the joint (hospital and physician) nature of production. The relationship between total 1-year costs and survival is reported in the scatter plot shown in Figure 2-1.
We drew a horizontal line at 70 percent (average 1-year survival rate) to highlight the lack of association between spending and outcomes. Similar to the findings noted earlier, at each level of spending there are high- and low-performing providers. To quantify the magnitude of savings that would occur if it were possible to take hospitals in the lower-right corner of the above figure (high cost, high mortality) and move them to the upper-left of the figure (low cost, low mortality), we first assigned hospitals to five performance cells from highest (low cost, low mortality) to lowest (high cost, high mortality), as shown in Figure 2-2. We used quartiles of performance on costs and quality to ensure that 25 percent of patients were in each quartile of spending and mortality. Providers in the lowest performance cell are those who have the highest costs and highest mortality, while those in the highest performance cell deliver the best care at the lowest cost. Providers
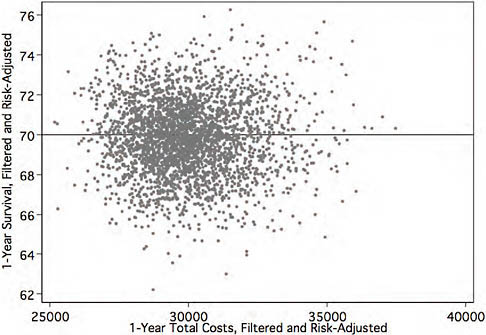
FIGURE 2-1 Relationship between 1-year survival rates and total inpatient costs for Medicare beneficiaries with three common conditions, 2003-2005.
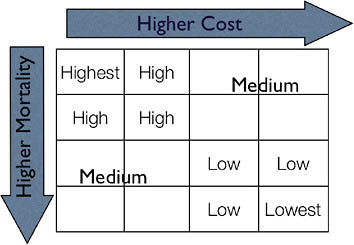
FIGURE 2-2 Conceptual intersection between cost and quality.
labeled as medium are those whose performance is difficult to rank: some do better than average on costs, but worse on outcomes. Their performance is better than those who are labeled as low or lowest, and worse than the high- and highest-performing providers, but without making further assumptions about society’s willingness to accept low-quality providers who are also low cost, we cannot rank medium providers better. In this analysis, we quantify the improvement in costs and mortality when lower-performing providers are moved toward the performance of higher-performing providers (from lower right to upper left).
Figure 2-3 reports the average difference in costs, as measured by total Parts A and B spending per patient, between different types of providers (high, medium, low, and lowest) and relative to the highest-performing providers (highest, or those with the lowest costs and mortality). The lowest-performing providers spend $4,800 more per patient than the highest-performing providers. About half of this amount is a difference in the use of Part B services.
While there are substantial differences in 1-year costs (of which half are accounted for by the Part B program), the differences in mortality are even larger: a 5-percentage point difference in 1-year mortality (on a base mortality rate of 30 percent) represents a 17 percent higher mortality rate in the lower-performing hospitals relative to the best providers (Figure 2-4).
Potential for Cost Savings and Quality Improvement
Our classification permits us to simulate how many lives and how much money would be saved if hospitals not performing at the highest
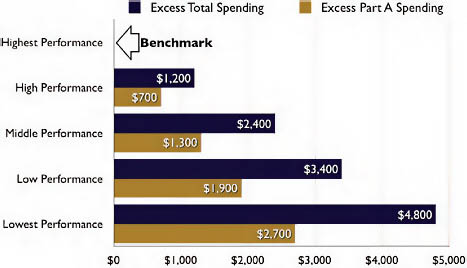
FIGURE 2-3 Average difference in costs between providers relative to those of highest performance.
level (lowest, low, middle, high) moved to the average cost and outcomes of the highest-performing group (highest). The cost savings would be a little over $1 billion annually, with half of the savings occurring as a result of efficiency improvements in the Part B program. These are gross savings as we have not priced the cost of implementing these performance improve-
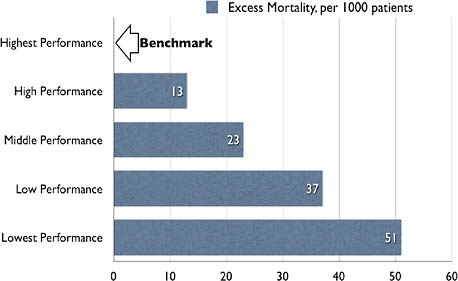
FIGURE 2-4 Mortality differences between providers relative to those of highest performance.
ments. These savings may seem small given the almost $5,000 difference in 1-year spending between the highest and lowest performing providers. The key is to remember that most hospitals are in the middle group, and for these hospitals the savings are much smaller. Moving the lowest-performing providers to middle performance would yield $68 million in Medicare savings annually, and moving both the lowest- and low-performing providers to middle performance would yield $155 million annually (Figure 2-5). We report the different types of simulations because our analysis has nothing to say about the costs of improving performance: it may be easier to improve the performance of high-performing providers to the level of those with the highest performance than it is to improve that of the lowest-performing providers to the next level.
The corresponding improvement in survival from performance improvements is impressive (Figure 2-6). Moving the lowest providers to the middle-performance group would save 786 lives annually, and moving both the lowest and low providers to the middle-performance group would save 2,078 lives annually. The most significant improvements would occur if all providers were able to achieve the average performance of those in the highest group: successfully implementing such a policy would yield over $1 billion annually (for these three cohorts of patients alone) and result in over 11,500 patients receiving at least another year of life. The cost savings would be evenly distributed between Part A and B services, suggesting that even for acute high-mortality conditions, there is more to improving efficiency than simply focusing on payments to hospitals and physicians.
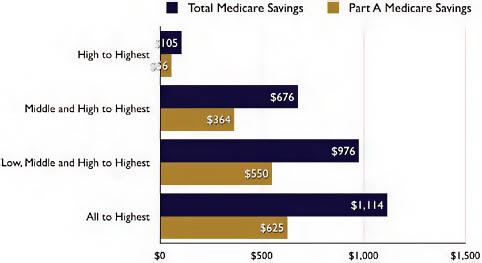
FIGURE 2-5 Potential for cost containment.
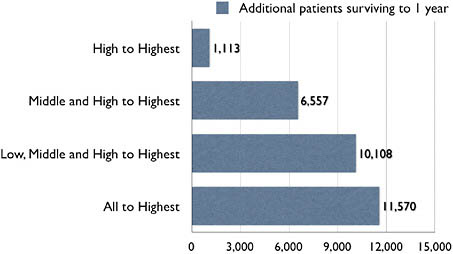
FIGURE 2-6 Potential for survival improvements.
These estimates constitute an 8 percent reduction in costs and an 8 percent reduction in mortality. Assuming that our willingness to pay for an additional life-year is $100,000, and each of these patients lived on average for 3 additional years, the survival gains alone would be worth $3.45 billion (11,500 × 3 × $100,000).
While not reported in the figures, it is also possible to ask how much of the variation in outcomes and costs is explained by HRR-level characteristics. For survival, we noted that about 75 percent of the hospital-level variation was present within HRRs, and that 50 percent of the cost variation persisted within HRRs. This suggests that policies that tried to improve the performance of providers within HRRs would be successful in realizing substantial savings to costs and mortality. These regional policies may be more palatable to providers.
Conclusion
Our analysis examined the association between 1-year survival and spending for three cohorts of Medicare patients who were admitted for acute myocardial infarction, hip fractures, and colorectal cancer. We find that even for high-mortality conditions such as heart attacks, hip fractures, and colorectal cancer, there is large hospital-level variation in outcomes (as measured by 1-year mortality) and spending (as measured by total Medicare Part A and B spending). Secondly, more intensive (and expensive) care does not result in better outcomes. Rather, as we illustrate, the relationship
between more spending and better outcomes is nil; at each level of spending there are providers who are able to deliver the exemplary care.
Whether the patterns that we note in this analysis (based on Medicare data), extend to the commercial population is not known. On the one hand, Baker and colleagues (2008) demonstrate that hospital-level resource use is similar between fee-for-service Medicare and the commercial program. This result is consistent with the “practice style” hypothesis where physicians use common decision rules to treat patients. On the other hand, there are a number of theoretical reasons to believe that Medicare’s administratively set prices cause hospitals and physicians to offset pricing imperfections with increased use in the non-Medicare population. Providers’ ability to offset the effects of Medicare’s reimbursement policy vary with the competitiveness of local healthcare markets. We are unaware of any research that demonstrates the existence of this channel and are working on another project to evaluate its presence. For now, we assume that the common practice style hypothesis applies, and that the potential for spending and survival improvements extends to the non-Medicare population. We emphasize once again that our estimates of cost savings do not account for the costs of initiating performance improvements.
The key limitation of our analysis is our ability to risk-adjust adequately with Medicare claims data. In other work we have found that risk-adjustment for heart attack patients using chart data such as those that are available in the Cooperative Cardiovascular Project (CCP) resulted in a similar ranking of providers on mortality to those obtained from claims-level risk-adjustment. If this is a general result, then the relative distribution of mortality that we report may not be biased even if we may have understated illness severity in every hospital. More problematic for our analysis would be if the sickest patients received the most health care, which would generate a negative relationship between survival and spending. However, we do not see such a relationship in our analysis. It is also possible that we may have understated the savings as we ranked hospitals on the component of costs and mortality that was common to all three conditions. Because hospital performance is not tightly correlated across different conditions, had (some who are good for heart attack treatments may not be good at treating hip fractures) we done a separate analysis for each condition, we would have predicted greater savings.
Whether the observed correlation between spending and outcomes tips in one direction or the other may be less important than the fact that spending and quality are nearly independent of one another. This analysis, as well as earlier findings using process-based measures of quality, supports the view that (1) spending more does not seem to do much of anything, at least with our current quality measures, and (2) there is tremendous potential to both save money and save lives by moving the vast majority
of U.S. hospitals closer to the efficiency “frontier”—to the level of those hospitals able to provide high-quality care at lower costs. Finally, we also found that the efficiency with which providers deliver care is determined by more than the intensity with which patients are treated within a hospital; there is also large variation in the use of physician and outpatient services. It is instructive to consider these variations in the framework of Bentley and colleagues (2008). In this work, the authors construct a typology of waste: administrative waste, operative waste (duplication of services, inefficient processes, overly expensive inputs and errors), and clinical waste, which is health care whose marginal benefit is not larger than that of less costly alternatives. In our view, the distinction between operative and clinical waste is fuzzy; duplicate testing is operatively wasteful and offers no benefit over doing nothing. Bentley and colleagues view the “variations” literature as proving an example of clinical waste, and while we agree with that view, many features of clinical waste are also the consequence of fragmentation and operative waste.
Our finding that half of spending variation arises from the use of Part B services suggests that the greater use of bundled payments offer a way to restrain cost growth. In Chandra and Sabick (2009) we note that a substantial portion of cost growth comes from the greater use of services that are in the “gray areas” of medicine: specialist visits and greater use of diagnostic services such as CT/MRI imaging. Medical education and textbooks are largely silent on the right rate for these procedures, and while they are surely valuable in some patients, the scope for overuse is tremendous. The value of these procedures is also difficult to evaluate in a trial for they generate value on dimensions that are notoriously difficult to quantify, such as improved satisfaction or reduced anxiety. Bundled payments try to reduce the incentives to overuse care of uncertain value by combining reimbursements for inpatient, outpatient, and home health into a single payment. If bundled payments work (they did reasonably well with the introduction of the Medicare inpatient hospital prospective payment system, or PPS), we will realize fairly large one-time savings as hospitals figure out ways to cut waste in follow-up visits. But to fully realize the savings from bundled payments, bundled payments must be used over long periods of time; bundling payments for, say, the first 30 days of care assures that there will be a spike in use on day 31. Nor would relatively short bundles do anything about care provided in days 30-365 after acute care hospital admission, a large source of cost growth. The focus on bundling payments is a very different policy response than cutting payments to higher-spending providers. In other work we have argued that higher-spending providers have specialized in the type of care that they deliver and that simply cutting spending does not decrease the volume of care they provide, thereby doing little to reduce cost growth (Baicker and Chandra, 2004; Chandra and Staiger, 2007; Skinner et al., 2006).
While our analysis did not evaluate the specific policy levers that would improve survival and reduce spending, the scope for productivity improvements is large: the three conditions that we study would generate an annual savings of $1 billion to Medicare in direct cost savings. This may seem small, but if the result extends to other conditions and other populations, the savings would imply an 8 percent reduction in costs and mortality. Improvements to survival are not “scored” by the CBO, which is concerned with the long-term budget situation for the federal government. But that should not distract from the broader message that American health care is inefficient to the point that it is possible to save money and lives.
REGIONAL INSIGHTS AND U.S. HEALTH CARE SAVINGS
Elliott S. Fisher, M.D., M.P.H., and Kristen K. Bronner, M.A.
Dartmouth College
The high and rising costs of U.S. health care limit equitable access to care and threaten the solvency of the U.S. economy (Orszag and Ellis, 2007). The sources of inefficiency in U.S. health care are many: high administrative and underwriting costs of health insurance, burdensome and complex payment and regulatory systems, and defensive medical practices driven by an onerous malpractice system.
At the same time, the marked geographic variations in spending and practice observed across U.S. hospital referral regions (HRRs) suggest that, even within the current administrative, payment, and legal systems, substantial savings might be possible. This paper applies the principles of benchmarking (Schoen et al., 2006; Weissman et al., 1999) to identify high-performing regions—and then estimates the potential savings that could be achieved in the Medicare program if all U.S. regions were able to achieve their level of performance.
Regional Variations in Spending and Quality
Spending Across Regions Differs Significantly
Two- to three-fold difference in spending have been widely and repeatedly documented since John Wennberg carried out his original small-area analyses of practice and spending in Vermont (CBO, 2008; Wennberg and Gittelsohn, 1973; Wennberg et al., 1987, 2002). While some of the differences in spending across regions can be attributed to differences in both individual health status and the prices paid for Medicare services, a number of later studies have controlled carefully for both of these factors and documented that twofold or greater differences in spending remain (CBO, 2008; Fisher et al., 2003a).
Yet Low Spending Areas Have Better Outcomes
The quality and outcomes of care achieved by low-spending U.S. regions also equal or exceed those of higher-spending regions. Studies examining the technical quality of care—for example, adherence to evidence-based practices such as the use of preventive services or proper inpatient treatment for patients with pneumonia, congestive heart failure, and heart attacks—have consistently found low-spending regions and states to provide better care (Baicker and Chandra, 2004; Fisher et al., 2003a, 2003b). Patients’ reports of their experiences in ambulatory care are equal or better in low-spending regions (Fisher et al., 2003c), and hospitalized patients also rate their inpatient experiences more highly in low-spending regions. They are less likely to report problems with pain management, preparation for discharge, or whether hospital staff responded quickly (Wennberg et al., 2009). Physicians in low-spending regions are more likely than those in high-spending regions to report that their ability to provide high-quality care is better, and that they have the necessary continuity of care and quality of communication with other physicians required to deliver high-quality care (Sirovich and Fisher, 2006). Finally, health outcomes in lower-spending regions are equal to or better than those observed in high-spending regions; patients with myocardial infarction in slower-growth regions have survival rates that are as good or better than regions with rapid growth in spending (Fisher et al., 2003c; Skinner et al., 2006). Although there are clearly variations across health systems within regions (Yasaitis et al., 2009), the equal or better quality of low-spending regions suggests that these regions as a whole could provide reasonable benchmarks of performance for the U.S. healthcare system.
Spending Variation Driven by Discretionary Medical Services
Further evidence that points to the potential for substantial savings arises from studies of the content of care in different regions. Almost all of the differences in spending across regions can be explained by greater use of discretionary medical services. Following similar patients for several years after an initial hospitalization for a heart attack, hip fracture, or cancer, patients in higher-spending regions had higher hospitalization and readmission rates, more frequent physician visits, more frequent referrals to specialists, and greater use of diagnostic tests, minor procedures, and imaging services (Fisher et al., 2003a). The discretionary nature of these services was confirmed by a study that used clinical vignettes to study physician decision making in high- and low-spending regions (Sirovich et al., 2008). No differences were found across regions of differing spending levels in physicians’ responses to questions where strong evidence supported a
specific treatment. But physicians in higher-spending regions were much more likely to intervene in “gray area” decisions, such as when to see a patient with well-controlled hypertension or refer a patient with heartburn to a gastroenterologist.
Estimating Potential Savings
To estimate the potential savings that could be achieved if all U.S. hospital referral regions could adopt the practice patterns of low-spending regions, we first categorized all U.S. regions according to a selected measure of cost performance that accounts for differences in both illness and price across regions. This allowed us to define our benchmarks. Then, we compared the use rates of specific services across U.S. regions sorted by this intensity measure, and estimated the savings if all U.S. regions achieved the proposed benchmarks. We ran these analyses for both specific healthcare services and for overall Medicare spending.
Prior research has indicated that, while there may be some differences in the relative prices paid by Medicare and private payers across U.S. regions, use rates for the under- and over-65 population are reasonably well correlated (Baker et al., 2008). The percentage reduction in use rates estimated using the benchmarks could thus provide at least some indication of the potential magnitude of savings in use of these services that could be achieved for the U.S. healthcare system overall. The data for the analysis were obtained from the Dartmouth Atlas of Health Care for 2005 and 2006 and were for Medicare beneficiaries over age 65, who were not enrolled in health management organizations (HMOs).
We used the End-of-Life Expenditure Index (EOL-EI) as our primary measure of the regional intensity of care provided to Medicare beneficiaries. The EOL-EI has been used in many prior studies examining intensity of treatment, quality of care, and comparative regional spending because it is independent of regional differences in illness and price and yet strongly predictive of differences in per capita spending (Fisher et al., 2003a; Sirovich and Fisher, 2006). The EOL-EI is calculated as the age-race-sex adjusted rate of price-standardized spending on hospital and physician services in an HRR for Medicare beneficiaries during their last 6 months of life. As this measure has been previously used in the literature, we can be relatively confident that the quality of care provided in the lowest-intensity (and thus lowest-spending) regions is equal or better to that provided in higher-spending regions.
All U.S. hospital referral regions were sorted according to the EOL-EI, with the benchmarks set at the lowest-intensity HRRs that included either 10 percent or 20 percent of the Medicare population overall. The two different percentages are required because in many benchmarking efforts,
the best performing 10 percent of providers has been used as the benchmark (Weissman et al., 1999). Where potential differences in case-mix or provider attributes may be important, the best performing 20 percent of regions or providers may be a more reasonable standard to apply (Schoen et al., 2006). The subsequent analyses estimate the savings that would be achieved with each of these benchmarks.
To estimate the potential savings that could be obtained if all U.S. regions achieved the performance observed in the lowest-intensity regions, we applied the use rate observed either in the best decile or the best quintile of U.S. regions to the Medicare population of all other U.S. regions and then determined how much use or spending within the other regions would have declined if the benchmark rate had prevailed. For the estimates of Medicare savings, we used total price-adjusted per capita spending in each HRR. This estimate removes any effect of regional differences in prices or policy payments (Medicare pays more to both physicians and hospitals in some regions to account for higher rents and salaries; similarly, Medicare makes additional policy-related payments for graduate medical education and for hospitals that provide care to low-income or uninsured populations).
Decreasing Discretionary Service Use
Figure 2-7 shows rates of hospital use in each decile of U.S. HRRs, sorted according to the overall intensity of care (EOL-EI). The rate of medical discharges across deciles ranges from a low of 192 per 1,000 in the best-performance decile to over 250 per 1,000 in each of the five highest deciles. As has been seen in other studies (Fisher et al., 2003a; Wennberg et al., 2002), surgical discharge rates are largely unrelated to overall per capita spending. Total inpatient days, however, are strongly related to spending, with inpatient days per person ranging from 1.3 to 2.3 across the deciles.
Figure 2-8 shows rates of use of selected physician services and how these vary across regions of differing intensity. The frequency of physician visits ranges by a factor of nearly two across the deciles (from 8.3 per person to 15.5 per person). Primary care physician visit rates are somewhat higher in high-intensity compared to low-intensity regions, but the frequency of visits to medical specialists is much higher in the higher-intensity regions (2.3 in the lowest-intensity decile to 6.6 in the highest-intensity decile).
These analyses suggest that there is in fact wide variation in the practice patterns of high-spending and low-spending regions, and that changes in use could drive cost savings. Table 2-1 summarizes the potential savings in use and Medicare spending that could be achieved if all U.S. regions adopted the practice patterns of the lowest-intensity quintile or decile of regions. Reductions in inpatient days range from 23.4 percent to 28.4 percent and reductions in physician visits range from 21.9 percent to 27.4 per-
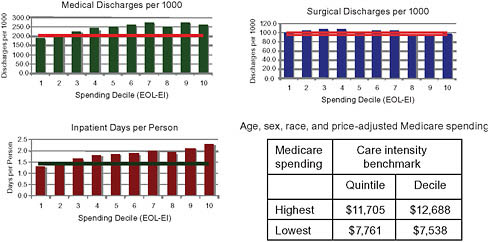
FIGURE 2-7 Medicare use rates for hospital services across deciles of care intensity.
NOTE: Each vertical bar shows the rate of the specific service in U.S. hospital referral regions grouped according to increasing care intensity, measured by the EOL-EI. Age, sex, race, and price-adjusted per capita spending varied from $7,538 in the lowest-intensity decile (decile 1) to $12,688 in the highest-spending decile. The horizontal line is placed at the level of the benchmark for the highest-performing quintiles.
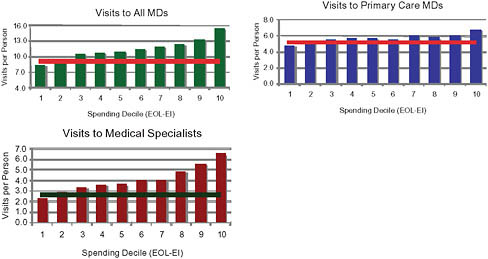
FIGURE 2-8 Medicare use rates for physician services across deciles of care intensity.
NOTE: Each vertical bar shows the rate of physician visits in U.S. hospital referral regions grouped according to increasing care intensity, measured by the EOL-EI.
TABLE 2-1 Potential Reductions in Overall Medicare Use Rates for Specific Services if All U.S. Regions Adopted the Practice Patterns of Best-Performing Quintile or Decile of Regions
|
|
Care Intensity Benchmark |
|
|
|
Best Quintile (%) |
Best Decile (%) |
|
Medical discharges |
17.8 |
21.3 |
|
Inpatient days |
23.4 |
28.4 |
|
Physician visits (overall) |
21.9 |
27.4 |
|
Primary care visits |
11.7 |
16.1 |
|
Medical specialist visits |
37.2 |
44.1 |
cent. In each case, these suggest that reductions in use of nearly 30 percent would be possible. The potential reductions in medical specialist visits are substantially larger—with declines of over 40 percent possible if the best decile of performance is used as the standard.
Likewise, estimates of the potential dollar savings to Medicare if all regions could achieve best decile or best quintile levels of performance are shown in Table 2-2. Estimated savings are in the range of $50 billion per year: an 18 percent to 20 percent reduction in per capita spending under fee-for-service Medicare.
Opportunity for Reduction of Medicare Costs
Using regional benchmarks defined as the best quintiles or deciles of U.S. regions in overall intensity of care, we estimate that Medicare spending would be able to decline by 18 percent to 20 percent overall. Use rates for physician and hospital services, which were used to establish the benchmarks, would decline by between 22 percent and 28 percent, depending upon the benchmark chosen.
TABLE 2-2 Potential Reductions in Overall Medicare Use Rates for Specific Services if All U.S. Regions Adopted the Practice Patterns of Best Performing Quintile or Decile of Regions, Based on Stratification Using the End-of-Life Expenditure Index
|
|
Care Intensity Benchmark |
|
|
|
Best Quintile |
Best Decile |
|
Percent reduction in spending, 2006 |
17.6% |
19.8% |
|
Savings to Medicare, 2006 |
$47.8 billion |
$53.9 billion |
Several limitations of the current analysis deserve consideration. First, the use of regional benchmarks ignores the substantial variation in cost and quality observed within regions. The analysis does not quantify the potential savings from improving the administrative efficiency of U.S. health care or from reducing the practice of defensive medicine through malpractice reforms. And the analysis does not account for potential savings that could be achieved through reforms of the payment system or greater integration and coordination of care. Each of these considerations would argue that the estimates of potential savings are relatively conservative.
A second serious limitation is inherent in the method of benchmarking; the method says nothing about whether it is possible to achieve real savings within the context of the current U.S. delivery and payment system. It is unlikely, for example, that simple cuts in the prices paid to physicians and hospitals or cuts in overall payments to higher-spending regions would have anything but a harmful and disruptive effect on the current care of Medicare beneficiaries in affected regions (Garber and Skinner, 2008). Efforts to foster the integration of care and align payment systems to support improved care at lower cost are intended to directly address concerns about how to support the transition to a lower-cost, higher-quality delivery system (Fisher et al., 2009b).
Recent findings that highlight the dramatic variations in spending growth across U.S. regions are therefore relevant. While average per capita spending growth in Medicare, adjusted for inflation, was 3.5 percent between 1992 and 2006, some regions grew at rates under 2.5 percent, while others grew at rates above 5 percent (Fisher et al., 2009a). These variations in growth rates suggest that slower growth may well be possible within the context of the current delivery system. And if the United States were able to reduce spending growth by 1 percent per year over the next 15 years, Medicare would be about $1.4 trillion better off than under current projections (Fisher et al., 2009a). This suggests not only that a gradual transition toward a more frugal healthcare system is possible but that it would make a substantial difference.
OPPORTUNITIES TO REDUCE UNWARRANTED CARE DIFFERENCES
David Wennberg, M.D., M.P.H.
Health Dialog
Patients make a surprisingly large number of medical decisions each year: 82 percent of adults over the age of 40 have made a decision about having a surgery or screening test done or taking a new medication in the past 2 years (Dartmouth Medical School, 2005). Roughly one-third of all
medical decisions are about surgeries, tests, treatments, and procedures that have two or more treatment options (Dartmouth Medical School, 2005). These “preference-sensitive” care decisions drive about one-fourth of all healthcare expenditures, as patients are often encouraged to have their physicians drive these decisions rather than sharing more actively in the decision-making process. As a result, patients are frequently undergoing more expensive treatments that they would not have chosen under a shared decision-making model.
The choice of treatment should be decided upon by the fully informed patient in partnership with a physician, and this can be successfully accomplished through shared decision-making programs. Not only do these programs benefit patients by affording them the services and treatment most responsive to their needs, but they yield the broader benefit of driving costs down as patients often choose more conservative (and less expensive) treatment after carefully weighing the trade-offs.
Preference-Sensitive Care
Preference-sensitive care addresses conditions where (1) treatment options exist, (2) the treatment options involve significant trade-offs in quality or quantity of life, and (3) the choice of treatment should be based on the preferences of the fully informed patient in partnership with their physician (O’Connor et al., 2004).
These conditions include a herniated lumbar disc, osteoarthritis of the hip and knee, chronic stable angina, prostate cancer, benign prostatic hypertrophy, early-stage breast cancer, and others. Because the current state of health care is for patients to rely on physicians to drive the treatment decisions without much of their input—delegated decision making—excess use of expensive treatment options has been high. Patients assume their physicians are able to adequately assess their values and preferences when recommending a treatment plan. Delegated decision making is confounded by geographic variation (practice pattern variation) and by fee-for-service reimbursement. Thirty years of research from Dartmouth has affirmed that a considerable portion of this variation cannot be explained by illness, medical need, patient preference, or the dictates of evidence-based medicine—these variations are unwarranted.
These variations are driven in part by a system-wide failure to adequately inform patients of their treatment options. Options have varied risks and benefits that only the patient can experience. Patients must take an active role in making preference-sensitive decisions to ensure that their personal values and preferences are reflected in the ultimate treatment choice. This lack of information leads to lack of patient engagement. Failing to adequately engage patients in informed choice leads to interventions
(and costs) that fully informed patients would choose not to have, which can, in turn, reduce unwarranted variation in the delivery of care, as discussed next.
Shared Decision Making
Shared decision making is a process that aims to foster collaboration between patients and their providers to arrive at providing patients with the care they want (Greenfield, 2001). The process involves a patient using a decision aid that then leads to a constructive discussion between the patient and his or her healthcare provider. The decision aid provides unbiased estimates of the varied risks and benefits for each treatment option. Ideally, it also allows the patients to vicariously “experience” the likely outcomes by seeing through the eyes of other patients who have faced the same decision. The desired outcome of the shared decision-making process is a treatment decision that most closely reflects a fully informed patient’s values and preferences. In the shared decision-making process, both the provider and the patient have important contributions to the dialogue. The provider can augment the decision aid by contributing expert medical knowledge of available treatment options and the risks, benefits, and areas of scientific uncertainty associated with each, and by exploring the patient’s understanding of the options, risks, and benefits. The patient contributes personal expertise of his or her tolerance for risk, lifestyle, and values. Finally, the physician can also assess the concordance between the patients expressed choices and preferences. The end result is a mutually agreeable course of action for treatment.
Evidence of Impact
The most comprehensive assessment of the evidence and results of decision aids and shared decision making is the Cochrane Collaboration’s review of decision aids (O’Connor et al., 1999, 2004). The review is a systematic assessment of the peer-reviewed literature on decision aids for screening tests and treatment decisions. They identified eight randomized trials comparing the use of decision aids for patients facing decisions for conditions where surgical and nonsurgical options existed. These varied from back pain with sciatica, to chronic stable angina, to benign conditions of the uterus. Individuals using decision aids were less likely to choose surgical intervention compared to those who were not (summary measure relative risk = 0.8 [95 percent confidence interval 0.60-0.94]).
The finding that patients exposed to decision aids were more likely to choose conservative treatment was consistent across conditions and geographies (studies were done in the United Kingdom, United States, and
Canada). Although these studies showed a reduction in surgical interventions, they were of insufficient power to assess the impact of decision aids and shared decision making on the overall costs of care. Semi-quantitative studies have been presented in the Dartmouth Atlas (O’Connor et al., 2004) that suggest the costs of care could be approximately 10 to 20 percent lower for the cohorts in the conservative treatment arm. A recent article in the New York Times lays out a similar argument for prostate cancer (Leonhardt, 2009).
One large randomized population-based trial of the effect of decision aids and health coaching on total healthcare expenditures has been presented in abstract form (Wennberg, 2007). This study of 180,000 individuals compared two levels of engagement for patients with chronic illness and/or preference-sensitive conditions. In the broader engagement group, health coaching combined with decision aids reduced total population costs by 3.6 percent, with 40 percent (approximately 1.5 percent of total population costs) arising from the preference-sensitive cohorts. This savings were primarily accounted for by an 11.3 percent reduction in admissions for preference-sensitive surgeries.
Conclusion
To summarize the potential reduction in costs through the broad implementation of decision aids and shared decision making we make the following assumptions:
-
Preference-sensitive care accounts for approximately 25 percent of all healthcare expenditures.
-
One randomized controlled trial powered to assess cost implications found a reduction of 1 to 1.5 percent in total population costs through patient intervention alone for preference-sensitive care.
-
The Cochrane Collaboration found a relative reduction in use of invasive treatment of 20 percent when provided to ideal candidates.
-
Benefit and provider reimbursements models to encourage shared decision making should increase the uptake of the intervention.
In light of the literature and in the context of these assumptions, we conclude that if systematically applied shared decision making did have a substantial impact on total U.S. healthcare expenditures, then the following would occur:
-
Systematic use of shared decision making directly with patients could be expected to reduce net health costs by 1 to 1.5 percent.
-
Systematic use of decision aids and coaching in a provider setting could be expected to reduce net health costs by 4 to 5 percent.
-
Given prior research on reimbursement and copays, adding provider reimbursement and benefit design could be expected to result in a larger than 5 percent net healthcare cost reduction.
Several caveats must be considered. First, no healthcare economy has systematically applied shared decision making. Second, no provider intervention to date has been of sufficient scale to assess the financial impact of provider-based shared decision making on total expenditures. Finally, benefit designs and reimbursement models aimed at increasing the use of shared decision making have not been tested.
Despite these caveats, shared decision making is a powerful tool in patient care. For shared decision making to have a significant impact on the healthcare delivery system, patient choice must be established as the standard of care. It should be ethically required and could be used as a way to replace informed consent requirements. Changes in benefit structures to provide incentives for participation in shared decision making would help programs gain traction. It could also be taken a step further with cost sharing for more expensive treatments. Perhaps the most important element to any emerging effort is the way in which the services are reimbursed. We need to pay for achieving high-quality patient decision making and follow up with supportive infrastructures that systematically deliver shared decision making.
REFERENCES
Baicker, K., and A. Chandra. 2004. Medicare spending, the physician workforce, and beneficiaries’ quality of care. Health Affairs (Millwood) Suppl Web Exclusives:W4-184-W4-197.
Baker, L. C., E. S. Fisher, and J. E. Wennberg. 2008. Variations in hospital resource use for Medicare and privately insured populations in California. Health Affairs (Millwood) 27(2):w123-w134.
Bentley, T. G., R. M. Effros, K. Palar, and E. B. Keeler. 2008. Waste in the U.S. health care system: A conceptual framework. Milbank Quarterly 86(4):629-659.
CBO (Congressional Budget Office). 2008. Geographic Variation in Health Care Spending. Washington, DC: Congressional Budget Office.
Chandra, A., and L. Sabick. 2009. Cost Growth in Medicare: 1992-2006. National Bureau of Economic Research.
Chandra, A., and D. O. Staiger. 2007. Productivity spillovers in healthcare: Evidence from the treatment of heart attacks. J Polit Econ 115:103-140.
Dartmouth Medical School. 2005. Dartmouth atlas project topic brief: Preference-sensitive care 6. http://www.dartmouthatlas.org/topics/preference_sensitive.pdf (accessed May 22, 2009).
Fisher, E. S., D. E. Wennberg, T. A. Stukel, D. J. Gottlieb, F. L. Lucas, and E. L. Pinder. 2003a. The implications of regional variations in Medicare spending. Part 1: The content, quality, and accessibility of care. Annals of Internal Medicine 138(4):273-287.
——. 2003b. The implications of regional variations in Medicare spending. Part 2: Health outcomes and satisfaction with care. Annals of Internal Medicine 138(4):273-287.
——. 2003c. The implications of regional variations in Medicare spending. Part 2: Health outcomes and satisfaction with care. Annals of Internal Medicine 138(4):288-298.
Fisher, E. S., J. P. Bynum, and J. S. Skinner. 2009a. Slowing the growth of health care costs—lessons from regional variation. New England Journal of Medicine 360(9):849-852.
Fisher, E. S., M. B. McClellan, J. Bertko, S. M. Lieberman, J. J. Lee, J. L. Lewis, and J. S. Skinner. 2009b. Fostering accountable health care: Moving forward in Medicare. Health Affairs (Millwood) 28(2):w219-w231.
Garber, A. M., and J. Skinner. 2008. Is American health care uniquely inefficient? Journal of Economic Perspectives 22(4):27-50.
Greenfield, J. A. 2001. Medical decision-making: Models of the doctor-patient relationship. Health Communication Review 1(1) (accessed May 26, 2009). http://www.healthcp.org/hcr/v1n1-medical-decisionmaking.pdf.
Leonhardt, D. 2009. In Health Reform, a cancer offers an acid test. New York Times, July 8, 2009, A1.
O’Connor, A. M., A. Rostom, V. Fiset, J. Tetroe, V. Entwistle, H. Llewellyn-Thomas, M. Holmes-Rovner, M. Barry, and J. Jones. 1999. Decision aids for patients facing health treatment or screening decisions: Systematic review. British Medical Journal 319(7212):731-734.
O’Connor, A. M., H. A. Llewellyn-Thomas, and A. B. Flood. 2004. Modifying unwarranted variations in health care: Shared decision making using patient decision aids. Health Affairs (Millwood) Suppl Web Exclusives:VAR63-VAR72.
Orszag, P. R., and P. Ellis. 2007. The challenge of rising health care costs—a view from the Congressional Budget Office. New England Journal of Medicine 357(18):1793-1795.
Schoen, C., K. Davis, S. K. How, and S. C. Schoenbaum. 2006. U.S. health system performance: A national scorecard. Health Affairs (Millwood) 25(6):w457-w475.
Sirovich, B., and E. S. Fisher. 2006. Regional variations in health care intensity and physicians’ perceptions of care quality. Annals of Internal Medicine 145(10):789.
Sirovich, B., P. M. Gallagher, D. E. Wennberg, and E. S. Fisher. 2008. Discretionary decision making by primary care physicians and the cost of U.S. health care. Health Affairs (Millwood) 27(3):813-823.
Skinner, J. S., D. O. Staiger, and E. S. Fisher. 2006. Is technological change in medicine always worth it? The case of acute myocardial infarction. Health Affairs (Millwood) 25(2): w34-w47.
Weissman, N. W., J. J. Allison, C. I. Kiefe, R. M. Farmer, M. T. Weaver, O. D. Williams, I. G. Child, J. H. Pemberton, K. C. Brown, and C. S. Baker. 1999. Achievable benchmarks of care: The ABC’s of benchmarking. Journal of the Evaluation in Clinical Practice 5(3):269-281.
Wennberg, D. 2007. The Deep Dive. DMAA Annual Meeting, September 17, Las Vegas, Nevada.
Wennberg, J., and Gittelsohn. 1973. Small area variations in health care delivery. Science 182(117):1102-1108.
Wennberg, J. E., J. L. Freeman, and W. J. Culp. 1987. Are hospital services rationed in New Haven or over-utilized in Boston? Lancet 1(8543):1185-1189.
Wennberg, J. E., E. S. Fisher, and J. S. Skinner. 2002. Geography and the debate over Medicare reform. Health Affairs (Millwood) Supp Web Exclusives:w96-w114.
Wennberg, J. E., E. S. Fisher, D. C. Goodman, and J. S. Skinner. 2008. Tracking the care of patients with severe chronic disease. The Dartmouth Atlas.
Wennberg, J. E., K. Bronner, J. S. Skinner, E. S. Fisher, and D. C. Goodman. 2009. Inpatient care intensity and patients’ ratings of their hospital experiences. Health Affairs (Millwood) 28(1):103-112.
Yasaitis, L., E. S. Fisher, J. S. Skinner, and A. Chandra. 2009. Hospital quality and intensity of spending: Is there an association? Health Affairs (Millwood) 28(4):w566-w572.


