
3
Inefficiently Delivered Services
INTRODUCTION
As the debate on healthcare reform continues to focus on the financial impacts of rising expenditures, the discussion has simultaneously included analyses of cost-control methods (Pear, 2009). Specific attention has been drawn to the potential for care management, clinical service reengineering, and administrative simplification to increase the efficiency of care delivery (The Commonwealth Fund, 2009; UnitedHealth Group, 2009). In this session, speakers continue to use the lens of efficiency to focus the discussion of opportunities to improve quality of care and decreased costs. Whereas in the previous session, the focus was on how to maintain quality by eliminating unnecessary services, the presenters now focus on the savings opportunities available if appropriate services were provided in the most efficient ways possible, drawing clear connections to the problems resulting from underlying system fragmentation, and perverse economic and practice incentives.
In 1999, the Institute of Medicine (IOM) landmark study To Err Is Human (IOM, 2000) pushed medical safety to the forefront of the American consciousness. Building on the study’s report that at least 44,000 people, and perhaps as many as 98,000 people, die in hospitals each year as a result of medical errors that could have been prevented, Ashish Jha from Harvard University discusses reducing the prevalence of adverse events and duplication in testing in the inpatient setting. Calculating that over 3 million preventable adverse events occur in hospitals annually, with over half of these attributable to hospital-acquired infections and adverse drug events,
he estimates that eliminating clearly preventable adverse events and redundant tests could save hospitals a potential $25 billion, or 8.2 percent of all inpatient costs. In describing the limitations of his analysis, he highlights in particular that the estimates were based on data that were several years old, and therefore may not reflect current costs, and that data were not available for all patient populations (e.g., women admitted to the hospital for labor and delivery). Jha concludes by suggesting that improving quality of care while saving costs will require additional efforts to systematically measure and publicly report adverse event rates in U.S. hospitals.
Gary S. Kaplan’s discussion of the recent work at Virginia Mason Medical Center (VMMC) demonstrates that coordinated systems can dramatically cut costs for high-cost conditions, such as the treatment of back pain. However, coordinated systems can also address other quality issues, such as patient satisfaction with services. By focusing on back pain, migraines, and breast nodules and by applying a systems-based healthcare model to these common, high-cost conditions, Kaplan describes how healthcare spending at VMMC fell between 5 and 9 percent relative to industry peers. Furthermore, waiting time for appointments decreased from 1 month to less than 2 days, patient satisfaction grew to 96 percent of maximum, and 95 percent of patients suffered no loss of work time. Kaplan attributes these savings and improved outcomes to reductions in unnecessary imaging and provider visits, as well as eliminating the overuse of physician providers in favor of nurse practitioners when appropriate, and the often concomitant poor coordination of care. Mapping this analysis to the national healthcare landscape, he suggests that more efficient use of mid-level practitioners for common conditions could reduce national expenditures by $13 billion annually. In closing, he outlines key factors to affordable health care, including: accountability; efficient use of labor; use of effective care pathways for high-cost conditions; alignment of reimbursement with value; and electronic health records embedded with evidence-based decision rules.
Framing clinical and administrative waste in terms of intra- and interorganizational contexts, William F. Jessee of the Medical Group Management Association focuses on inefficiencies within medical practices. He describes considerable unexplained variation among medical practices in the cost of producing care, and identifies almost $26 billion in possible cost reductions from increasing the efficiency of delivering care in physician offices. While Jessee suggests that this estimate is provocative, he also cautions that it is preliminary in nature, as it was based on limited cross-sectional survey data. Arnold Milstein of Pacific Business Group on Health continues this discussion by addressing inefficiencies in hospitals. Referencing the analyses of the Medicare Payment Advisory Commission, he explains that if all hospitals replicated the attainment of the top 12 percent in terms of
cost per case and quality, their 30-day mortality rates would decline by about 18 percent and inpatient costs by 12 percent, yielding 2 percent savings in national health expenditures, all without lowering quality of care. He further identifies technical assistance in the form of standardized care pathways, other clinical reengineering processes, and procompetitive policies as the most promising avenues of intervention.
Cost-saving strategies need to focus not only on inefficiencies, specifically within hospitals and provider offices, but also on those inefficiencies generated by poorly coordinated service systems. Mary Kay Owens concentrates on the cost of care fragmentation, an increasingly common problem given the aging population and increasing numbers of individuals with multiple chronic conditions (Martini et al., 2007; Meara et al., 2004; Wolff et al., 2002). She estimates a potential opportunity for $240 billion in savings exists from improved care coordination through such initiatives as disease management programs, patient education programs, and the development of new provider delivery and payment models. She additionally emphasizes that these estimates do not account for the population of uninsured nor do they factor in future demographic trends in chronic disease or a growing elderly population.
COSTS OF ERRORS AND INEFFICIENCY IN HOSPITALS
Ashish Jha, M.D., M.P.H.
Harvard University
Ever since the publication of To Err Is Human, there has been considerable interest in improving patient safety, but there is very little evidence that safety has improved. Prior estimates of the costs of adverse events have been limited to studies at individual institutions or national extrapolations from the data of a small number of institutions. To Err Is Human suggested that preventable medical injuries were responsible for between $17 and $28 billion in direct medical costs (IOM, 2000). These estimates were based on data that were from two epidemiologic studies that were conducted nearly 2 decades ago. Other estimates are derived from administrative data, which are well known for undercounting many types of adverse events, such as healthcare-associated infections and adverse drug events. One such study used National Inpatient Sample (NIS) data and patient-safety indicators (PSIs) to estimate the cost of 18 types of adverse medical events at $4.6 billion (Zhan and Miller, 2003). However, given that the coding of PSIs is inconsistent, the inaccurate measurement of the actual occurrence of adverse events commonly occurs.
These studies give us a significant starting point, but our current understanding of the impact of adverse medical events is neither current nor
granular enough to know where and how to focus our activities in these areas.
Calculation of National Estimates
A Health Affairs publication presents a detailed analysis of how reducing adverse medical events and eliminating redundant tests could contribute to a dramatic reduction in hospital spending (Jha et al., 2009). Since there was no precise, current data available for the prevalence of adverse events, we used a combination of literature review, consultation with experts, and review both of unsafe care lists compiled by patient safety advocate groups and of major epidemiologic studies. We used a working definition of adverse event that included injuries from medical care not caused by the underlying condition (Jha et al., 2009). We further categorized the adverse events as either preventable or nonpreventable, based on the provision of error-free care: if a patient experienced an adverse event despite having received error-free care, that adverse event was considered to be nonpreventable. We also examined the prevalence of redundant laboratory and radiologic tests.
Based on our results from the literature review, we selected 10 adverse events commonly described in over 3,000 studies: adverse drug events, falls, pressure ulcers, pneumothorax, thromboembolic disease, surgical site infection, catheter-related blood stream infection, urinary tract infection, pneumonia, and hematoma. Using these studies as a foundation and looking specifically at these 10 adverse events, we were able to use an iterative methodology to estimate the at-risk population, prevalence of these events, and the associated impact of those prevalences in terms of dollars expended and redundant or unnecessary services provided.1
|
1 |
We used nationally representative data from the 2004 National Inpatient Sample (NIS) to determine the population that was at risk for suffering each of these adverse events. To estimate the number of patients that actually experience an adverse event, we multiplied the number of at-risk patients by the incidence among the at-risk population (Jha et al., 2009). We used a range of incidences to account for the variation observed in the literature. We then multiplied that figure by the fraction of events that is considered preventable, as determined by the literature and by quality improvement studies, to calculate the number of preventable adverse events for each category (Table 3-1). To determine the potential savings associated with the reduction or elimination of an adverse event, we considered only the direct medical costs associated with that adverse event and did not factor in incidental costs, such as the patient’s lost wages. After inflating all costs to constant 2004 dollars with the Producer Price Index (PPI), we calculated potential savings based on estimates found in our literature review. Because there were often multiple values cited for these savings, we used the midpoint of the ranges in our calculations. We subsequently built Monte Carlo simulation models, and obtained almost identical results to the midpoint calculations. We therefore used the Monte Carlo results for our analysis in the manuscript. To determine the cost of completely eliminating an |
Potential Savings Nationally
In 2004, patients who received care in U.S. hospitals experienced approximately 5.7 million adverse events (Table 3-1). The majority of these adverse events were adverse drug events (2.2 million events) and hospital-acquired infections (1.7 million events). Of these 3.9 million events, 46 percent were preventable adverse events (389,000 adverse drug events and 1.4 million hospital-acquired infections). Avoidable costs were those associated with adverse events that were clearly preventable based on currently available approaches, while total costs included the financial impact of all adverse events. Adverse drug events cost the system an avoidable $3.8 billion (95 percent confidence interval [CI], $3.1-$4.6 billion) in 2004 (Table 3-2), and, if eliminated entirely, could result in a savings of $8.8 billion (95 percent CI, $7.4-$10.2 billion).
The sum of all categories of preventable adverse events represents an avoidable cost to the system of $16.6 billion (95 percent CI, $12.9-$21.2 billion) (Jha et al., 2009). If redundant tests are added to this figure, the avoidable costs are $24.8 billion (95 percent CI, $20.4-$30.7 billion), or 8.2 percent of all inpatient costs (Table 3-2). Were the errors and redundant tests to be eliminated entirely, the figure jumps to $40.5 billion (95 percent CI, $31.9-$50.5 billion), or 13.5 percent of inpatient costs (Table 3-2). A breakdown of the percentage of cost savings by adverse event is shown in Figure 3-1.
The prevalence of these adverse events also appears to be correlated with other factors. We examined the prevalence of adverse events and redundant tests in various hospital settings: by location (urban vs. rural), by size, and by teaching status—and found, for example, that patients in teaching hospitals were most likely to experience adverse events. Reforms in these teaching hospitals could account for $11 billion or 45 percent of the potential savings discussed here (Jha et al., 2009).
Primary Caveats and Assumptions
Despite best efforts, there were limitations to this study. We used Monte Carlo simulations to account for variation in the data and to compensate
TABLE 3-1 Estimates of Total Adverse Events and Number of Preventable Adverse Events
|
|
Estimated Number of Total Adverse Events (thousands) |
Estimated Number of Preventable Adverse Events (thousands) |
|
Thromboembolic disease |
828 |
511 |
|
Hospital-acquired infections |
1,725 |
1,449 |
|
Adverse drug events |
2,169 |
589 |
|
Decubitus ulcers |
226 |
184 |
|
Other adverse events |
783 |
290 |
|
Total adverse events |
5,731 |
3,023 |
for some of the weaknesses in the data from our review. Even so, some of the study data were several years old, and therefore our estimates may not be current. It is likely that, given that the hospitalized patient population has become sicker, we may have underestimated the rates of adverse events and their associated costs.
There were also important patient populations for whom we could not estimate the frequency or costs of adverse events. For example, we found no reliable estimates for women admitted to the hospital for labor and delivery or for pediatric patients (except for adverse drug events). Again, the omission of these hospitalizations likely led to an undercount of the number of adverse events and their associated costs (Jha et al., 2009).
TABLE 3-2 Avoidable and Total Costs and the Percentage of Inpatient Costs They Represent
|
|
Avoidable Costs in Millions* (95% CI) |
Percent of Inpatient Costs |
Total Costs in Millions* (95% CI) |
Percent of Inpatient Costs |
|
Thromboembolic disease |
$3,090 |
1.0 |
$5,041 |
1.7 |
|
($1,979-$4,466) |
|
($3,444-$6,966) |
|
|
|
Hospital-acquired infections |
$5,797 |
1.9 |
$8,912 |
3.0 |
|
($3,773-$8,198) |
|
($5,833-$12,515) |
|
|
|
Adverse drug events |
$3,823 |
1.3 |
$8,840 |
2.9 |
|
($3,067-$4,626) |
|
($7,442-$10,181) |
|
|
|
Decubitus ulcers |
$748 |
0.3 |
$913 |
0.3 |
|
($256-$1,332) |
|
($343-$1,595) |
|
|
|
Other adverse events |
$3,165 |
1.1 |
$8,569 |
2.7 |
|
($526-$7,884) |
|
($1,905-$18,192) |
|
|
|
Redundant labs and radiology tests |
$8,229 |
2.7 |
$8,229 |
2.7 |
|
($5,015-$11,829) |
|
($5,015-$11,829) |
|
|
|
Total potential savings |
$24,848 |
8.2 |
$40,503 |
13.5 |
|
($20,386-$30,673) |
($31,929-$50,464) |
|
||
|
*Costs in 2004 dollars. |
||||
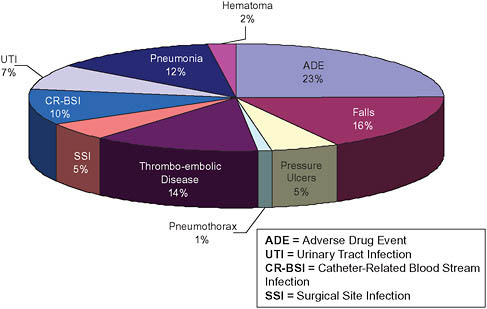
FIGURE 3-1 Breakdown of potential national savings by type of adverse event.
SOURCE: Copyrighted and published by Project Hope/Health Affairs. Jha, A. K., D. C. Chan, A. B. Ridgway, C. Franz, and D. W. Bates. 2009. Improving safety and eliminating redundant tests: Cutting costs in U.S. Hospitals. Health Aff (Millwood) 28(5):1475-1484.
Our estimates represent only the direct costs associated with the care provided in hospitals. They do not account for additional sources of savings, such as the lost productivity and wages of individuals affected by poor medical care. So, in all of these cases, the limitations of this study are likely to cause us to understate the costs and therefore potential savings from an intervention aimed at preventing adverse events.
Lastly, and quite significant for public policy, we chose not to examine what kind of financial impact hospitals might face in implementing solutions to decrease adverse events and redundant tests. Yet, the cost of such interventions and its relationship to the potential savings of eliminating adverse care will be important considerations for policy makers who wish to target these sources of potential cost savings.
Thoughts About Next Steps
Eliminating clearly preventable adverse events and redundant tests could save hospitals a potential $24.8 billion (2004 dollars), or 8.2 percent
of all inpatient costs. Although current efforts by the Centers for Medicare & Medicaid Services (CMS) and others around the “no-pay” rules are meant to begin to capture some of these savings, most of the early data from other similar efforts suggest that the rules are unlikely to have a major impact. More salient will be efforts to systematically measure and publicly report adverse event rates in U.S. hospitals, which will force hospitals to examine their own processes and, as we have seen with public reporting efforts elsewhere, make concerted efforts to improve care. Such a strategy will improve patient well-being while simultaneously enabling the healthcare system to save billions of dollars.
COSTS FROM INEFFICIENT USE OF CAREGIVERS
Robert S. Mecklenburg, M.D., and Gary S. Kaplan, M.D.
Virginia Mason Medical Center
President Obama’s Council of Economic Advisors estimates that 30 percent of U.S. healthcare expenditures do not contribute to positive healthcare outcomes (Romer, 2009). Providing care for all Americans while reducing per capita spending requires improving the efficiency of the current delivery system. Because most of the cost of producing health care relates to the cost of labor, the inefficient or unnecessary use of healthcare workers is a major avoidable expense for providers that is passed on to purchasers. Identifying, quantifying, and reducing healthcare encounters that are inefficient or unnecessary offers immense opportunity for savings.
For example, one retrospective study of national survey records (Mehrotra et al., 2007) indicated that 8 percent of ambulatory care visits were for preventive health examinations at an annual cost of $7.8 billion. Most preventative care occurred in conjunction with other visits, however, and 75 percent of patients had been seen by providers for other reasons within the previous year. It is likely that a greater proportion of preventive care services could be delivered in an equally effective but more efficient manner.
At VMMC, we have directly measured cost reductions from decreasing non-value-added healthcare encounters and projected the savings to a national level.
A Collaborative Approach to Enhancing Efficiency and Quality of Care
In 2002, VMMC began removing costly waste in healthcare delivery by applying the principles of the Toyota Production System (Bush, 2007; Bohmer and Ferlins, 2005). This method uses standardized best practice reinforced by reliable systems to reduce costly individual variation. Quality and timeliness become system attributes, ensuring consistent, high-value performance from each healthcare provider. In 2004, VMMC expanded this
work by engaging employers and health plan executives in “Marketplace Collaboratives” to identify and reward value in the delivery of health care (Fuhrmans, 2007; Pham et al., 2007). These groups approached the issue of efficiency in healthcare delivery by doing the following:
-
Assigning priority to prevalent and costly medical conditions based on claims data of employers. Three such conditions included back pain, headache, and breast conditions.
-
Defining measurable value from the customer’s perspective with five quality indicators:
-
Same-day access to care,
-
Rapid return to function,
-
Prospectively defined, value-added, evidence-based care pathways,
-
100 percent patient satisfaction, and
-
Reduced cost for both purchasers and providers.
-
-
Applying a general model of care delivery that eliminates both non-value-added components and waits and delays, meets quality specifications, and reduces costs.
Collaboratives produced standardized pathways that featured rapid access to evidence-based care, aligning skill and training of providers with appropriate clinical tasks.
As collaborative teams improved efficiency, we quantified waste eliminated from the preexisting system. We measured reduced use by direct observation of clinical operations during process improvement, including the number of MRI procedures. CareConnections measured physical therapy use and work loss for back pain. VMMC’s finance section provided data for 2009 on reimbursement and VMMC’s cost of producing care.
Reduction of Unnecessary Health Encounters
Assuming our costs and reimbursement rates are generally applicable, the savings we identified would generate savings in the United States of over $22 billion per year while improving speed of access, quality of care, and capacity to care for more patients. The first category of major savings realized by the collaboratives was in the area of reducing unnecessary visits and services.
Fewer Unnecessary Office Visits
Outpatient visits were reduced by using an evidence-based scheduling tool that matched a patient’s condition with an appointment that integrated evaluation, education, and therapy into a single same-day visit. In the back
pain pathway, 96 percent of patients returned to work after an initial appointment with a physical therapist and a physician. For those requiring additional physical therapy, return to function was accomplished with an average of 4.4 visits compared to 8.8 visits for marketplace peers. In the breast value stream, care was completed in a single same-day visit for the 89 percent of women who do not require biopsy. For patients with uncomplicated migraines, one same-day visit was needed for evaluation and treatment for most patients. Our model eliminated at least 50 percent of office visits for these conditions, including “new visits” to multiple providers.
Applying VMMC’s experience to the national level, reduction of unnecessary office visits related to such common conditions as back pain, headache, and breast nodules can generate savings of up to $5.1 billion annually (Table 3-3).2
Less Unnecessary Imaging
Unnecessary visits for imaging represented another opportunity to reduce non-value-added care. We installed a system within the process flow of scheduling for imaging that required the provider to designate one of a list of evidence-based indications to complete the order. Prior to installing such systems for back pain and migraine, VMMC performed 17,128 MRI studies per year of which 1,886 (11 percent) were lumbosacral spine images and 1,026 (5.9 percent) were brain images.
When such evidence-based decision rules were embedded in the sched-
TABLE 3-3 Cost Savings from Reductions in Unnecessary Office Visits*
uling process, MRI volumes decreased 31 percent for back pain and 41 percent for headache at a time when patient volumes for these conditions were increasing (Table 3-4).3
If 30 percent of all MRI studies in the nation did not add value and could be avoided, the same type of evidence-based process successful at VMMC could realize savings of up to $6.5 billion per year. Although we have no direct data to confirm the projection of 30 percent unnecessary imaging to all MRI studies, it is our opinion that our sample likely reflects general practice.
TABLE 3-4 Cost Savings from Reductions in Unnecessary Imaging
|
VMMC rate of reduction for unnecessary lumbosacral spine imaging |
31% |
|
|
VMMC rate of reduction for unnecessary brain imaging |
41% |
|
|
|
Medicare Health Insurance |
Commercial Health Insurance |
|
Total U.S. MRI examinations performed |
9M |
17M |
|
Estimated total for lumbosacral imaging |
0.99M |
1.87M |
|
Estimated total for brain imaging |
0.53M |
1.0M |
|
Potential reduction in number of U.S. imaging examinations |
2.7M |
5.1M |
|
Reduction in number of lumbosacral examinations |
0.31M |
0.58M |
|
Reduction in number of brain imaging examinations |
0.22M |
0.41M |
|
Reimbursement rate per visit |
$500 |
$1000 |
|
Potential savings in dollars |
$1.4B |
$5.1B |
|
From reduction in lumbosacral examinations |
$153M |
$580M |
|
From reduction in brain imaging examinations |
$109M |
$411M |
|
NOTE: B = billion; M = million; MRI = magnetic resonance imaging; VMMC = Virginia Mason Medical Center. |
||
Improving Efficiency of Office Visits
Applying the reforms detailed above to reduce non-value-added office visits and extending a similar approach to additional prevalent, high-cost conditions such as shoulder, knee, and hip pain, routine exams, and irritable bowel syndrome, we believe a minimum of 5 percent of office visits could be eliminated. Such a reduction leaves 95 percent, or 1.05 billion office visits per year remaining for efforts to improve efficiency. The second major opportunity for cost savings is improvement of efficiency of necessary office visits.
Using Less Costly Providers
At VMMC, labor costs represent 65 percent of operating expenses. Efficient use of skilled mid-level providers can reduce healthcare costs substantially for both purchasers and providers.
In the care pathway for breast nodules, more than 90 percent of patients require no surgery. Using an experienced advanced registered nurse practitioner (ARNP) instead of a breast surgeon for the initial office visit reduces cost of providing care. In the headache care pathway, using an ARNP instead of a physician for prescreened uncomplicated problems achieves similar savings. The back pain care pathway substitutes an initial physician
evaluation with an initial evaluation that is performed by a physical therapist with minimal physician support. Access, patient satisfaction, and rapid return to function are outstanding with this model (Mecklenburg, 2008).
Well over 183,000 episodes of care at VMMC financed through employer-based benefits from 2006 to 2008 were for uncomplicated conditions (Table 3-5).4 From our experience in redesigned care pathways we believe that ARNP or physician assistant (PA) providers could deliver at least 50 percent of our episodes of care at a substantial cost reduction.
Again, assuming that on a national level half the episodes of care were for uncomplicated conditions that could be handled capably by an ARNP or PA, the savings nationally could be as high as $8.3 billion (Table 3-6).5
Using mid-level providers is financially favorable for provider groups because the labor component of the cost of production often decreases by half, saving $25 per visit. If labor costs were reduced by even $1 per minute by using mid-level providers for 50 percent of total U.S. outpatient visits the cost of providing care for providers would decrease nationally by $13.1 billion (Table 3-7).6 In our experience with the back pain pathway, patient volumes quadrupled, daily individual physician billable units doubled, and VMMC’s margin increased even as revenue from unnecessary imaging declined.
Yet another creative use of mid-level providers could be in the area of patients with essential hypertension, diabetes, and disorders of lipid metabolism. These three conditions account for 75 million visits per year.
TABLE 3-5 Distribution of 183,418 Service Episodes Paid by One Health Plan to VMMC, 2006-2008
TABLE 3-6 Potential Savings to Purchasers from Use of Mid-level Providers for Office Visits Based on VMMC Experience
|
Total “necessary ” U.S. outpatient visitsa |
1.05 billion |
|
|
|
Medicare Health Insurance |
Commercial Health Insurance |
|
Number of ambulatory visits per yeara |
242 million |
620 million |
|
Potential number of visits with mid-level practitionersb |
121 million |
310 million |
|
Savings to purchasers per visit |
$10 |
$23 |
|
Potential total U.S. savings to purchasers in dollars |
$1.2 billion |
$7.1 billion |
|
a For patients age 15 and older. b For uncomplicated conditions. |
||
Again, if half of the visits for these patients could be managed by an ARNP or PA, and if half of them could be managed by telephone or e-mail, with reimbursement at 50 percent of an office visit then the national savings could add up to $2.3 billion annually.7
TABLE 3-7 Potential Savings to Purchasers and Providers Using Mid-Level Providers
|
|
Purchaser Cost of Commercial Visit* |
Purchaser Cost of Medicare Visit* |
Labor Costs to Providers |
|
Physician |
$152 |
$69 |
$50 |
|
ARNP/PA |
$129 |
$59 |
$25 |
|
Percentage difference between costs |
15% |
14% |
50% |
|
|
Commercial Purchasers |
Medicare |
Providers |
|
National savings if half of total annual office visits seen by mid-level practitioners |
$7.1 billion |
$1.2 billion |
$13.1 billion |
|
NOTE: ARNP = advance registered nurse practitioner; PA = physician’s assistant. *For 25-minute visit. |
|||
Lessons for the Delivery System
The total $22 billion savings per year we have identified in a small segment of the delivery system is 22 percent of the $100 billion per year that President Obama requires over the next decade to finance health care for all Americans (Obama, 2009).
In our experience, the path to affordable health care includes:
-
Creating accountable care organizations to control quality and cost;
-
Increasing the proportion of mid-level providers and deploying them effectively;
-
Defining efficient, effective care pathways for high-cost conditions;
-
Defining quality in terms of outcomes, access, and patient satisfaction;
-
Aligning reimbursement with value; and
-
Using an electronic medical record to limit variation by embedding “mistake-proofed” evidence-based decision rules into the work flow.
The savings discussed here are driven to a large degree by the infrastructure available at VMMC—an infrastructure that many providers do not have. The savings we achieved were accomplished in the format of an “accountable care organization,” an integrated delivery system populated
by teams of physicians and mid-level providers using reliable systems to reduce variation among individual practitioners. Providers practice with the benefit of standardized “mistake-proofed” evidence-based protocols embedded in their work flow. We collaborate with purchasers to create actionable information from claims data, set priorities with the greatest opportunities, define quality, and develop relevant measurement and reporting methods. In our view each of these elements has assisted us in improving efficiency and effectiveness.
Most of our savings are related to more efficient deployment of our workforce. By aligning nonphysician providers with less complicated clinical tasks, we recovered physician time for the fewer but more complex cases. Our capacity to see additional patients increased, and patients had very rapid access to both physician and nonphysician providers. We believe that if more healthcare workers are needed, a substantial proportion of these will be mid-level providers.
For physicians, a strategy of cost reduction through improving access and quality is more reliable and sustainable than a strategy of revenue enhancement. When providers insist on substantial yearly increases in revenue it disadvantages purchasers, the community, and ultimately the providers themselves. As VMMC learns to operate more efficiently, our margin improves while capturing savings for purchasers and providing care for many more patients.
Healthcare costs are the product of use and reimbursement. While providers are accountable for producing value, CMS and health plans are accountable for aligning reimbursement with value. The current reimbursement model easily cancels savings achieved by providers when it fails to fund effective low-cost interventions and provides full reimbursement for unnecessary care. In addition, contracted reimbursement rates between health plans and providers escalate healthcare cost unrelated to value. For provider groups in the Seattle market in 2007 (Washington State Department of Health) the contracted “conversion factor” varied from $68 to $103 per relative value unit, a difference unrelated to value, quality, safety, access, or patient satisfaction. We estimate a 25 percent cost additional savings for employers if health plans used the funds of their clients to purchase quality and value.
It is our belief that health care will become affordable when the politics of self-interest is replaced by the politics of collaboration, when quality is defined on the basis of improved outcomes for our patients, and when the rewards we receive as providers are commensurate with the value we deliver. At VMMC we have moved in this direction with employers. It is our experience that it is both possible and necessary to deliver health care that is better, faster, and more affordable.
COSTS FROM PHYSICIAN OFFICE INEFFICIENCIES
William F. Jessee, M.D., FACMPE
Medical Group Management Association
There is increasing consensus that a considerable portion of the $2.3 trillion expended annually on health care in the United States is wasted. In considering how health care can be reformed and more Americans provided with access to necessary health services, reducing the resources consumed by waste becomes of vital importance.
There are a wide variety of sources of waste in health care. Clinical waste is associated with the processes of delivering healthcare services to patients, and administrative waste is associated with the systems and processes for financing and payment for care. In addition, waste may occur entirely within a healthcare delivery or financing organization (intraorganizational waste) or as a consequence of the interactions between and among such organizations (interorganizational waste). Table 3-8 illustrates several examples of each category of waste.
This paper focuses on clinical and administrative waste occurring within physicians’ office-based medical practices. It does not attempt to separate clinical from administrative waste. Therefore, the estimate of savings potential presented here may overlap with other analyses presented in these proceedings.
Estimating Waste in Physician Offices
The Medical Group Management Association (MGMA) conducts an annual survey of medical group practice costs and revenues, collecting a
TABLE 3-8 Examples of Healthcare Waste
|
|
Intraorganizational |
Interorganizational |
|
Clinical |
|
|
|
Administrative |
|
|
variety of information, including total relative value units (RVUs) produced per physician; work RVUs per physician; total cost per physician, physician compensation; and total operating cost per physician, which does not include physician compensation (MGMA, 2008a, 2008b). The estimates here draw on data collected for 2007. For this survey, 10,586 medical group practices were invited to participate. These practices are approximately representative of the population of medical group practices in the United States, but they do not include solo or two-physician practices. Further, potential bias may be present due to respondent self-selection. For the 2007 data, there were complete, usable responses from 1,470 practices (a 14 percent response rate) representing 28,177 physicians.
The distribution of total cost (including physician compensation) per total RVU produced was calculated to represent the standardized “cost of production.” This cost measure represents the true cost to payers and consumers. However, inclusion of the cost of physician compensation introduces an uncontrollable variable beyond the efficiency of the practice. Therefore, operating cost per total RVU was also included in this analysis. By excluding physician compensation, a better measure of efficiency, or the cost to the practice of producing an RVU, can be expressed. One notable limitation of this analysis is that the cost figures used exclude any cost incurred by hospitals for care not provided in the physician’s office-based practice. The data do, however, include RVUs produced through inpatient care, since billing for that care occurs through the physician’s practice. Accordingly, both sets of figures—production costs and operating costs—understate the total cost of production through the omission of the cost of providing inpatient care.
Savings Potential in Physicians’ Offices
The distribution of production costs per RVU produced for all practices varies (Tables 3-9 and 3-10). Similar variation is seen among four representative examples of practice types—multispecialty, cardiology, gastroenterology, and general surgery.
The distribution of production costs for all types of practices is skewed to the right. For example, the range from the median to the 75th percentile for multispecialty groups is $12.88, while the range from the 25th percentile to the median is only $7.15. This skew is likely driven in part by differences in physician compensation. Differences in insurance payment rates or differences in the generation of revenues from sources other than professional services are likely drivers of differences in physician compensation. However, the fact that there is a similar skew in the distribution of total operating cost per RVU indicates that at least some of the higher cost is related to differences in practice efficiency.
TABLE 3-9 Total Production Cost (Including Physician Compensation), per Total RVU Produced, for Selected Practice Types (2007)
There is wide variation in the cost of producing an RVU—from as little as $31.80 at the 10th percentile of cardiology practices, to as much as $95.45 at the 90th percentile of multispecialty groups,a more than threefold differential. Assuming that an RVU is, indeed, a standardized measure of production, at least some of this variation must represent differences in production efficiency. However, the literature on this topic is essentially nonexistent.
Several factors are associated with higher median cost per RVU. Multispecialty groups have a median production cost per RVU of $57.66, compared with a median of $53.32 for pooled single-specialty groups. This difference persists even when operating cost per RVU is the variable of interest ($33.93 for multispecialty groups, and $25.81 for pooled single-specialty groups). This is consistent with an explanation that single specialty groups are more efficient than multispecialty groups. However, when the mean cost is considered (rather than the median), a somewhat different picture emerges. Multispecialty groups have much less variation in their cost per RVU. The mean production cost per RVU is $64.59, and the mean operating cost per RVU is $38.28 for multispecialty groups. The standard
TABLE 3-10 Total Operating Cost (Excluding Physician Compensation), per Total RVU Produced, for Selected Practice Types (2007)
deviations for these two numbers are $24.43 and $16.80, respectively. By contrast, for pooled single-specialty groups, the mean production cost per RVU is $101.22, and the mean operating cost per RVU is $36.53, with standard deviations of $223.75 and $40.06, respectively. The much higher mean and standard deviation observed in single-specialty groups when physician compensation is included indicates that a few very high physician compensation numbers are significantly skewing the distribution.
Other factors associated with modestly higher median cost per RVU are:
-
Hospital vs. physician ownership of the practice (total cost per RVU = $59 for hospital-owned practices compared with $52.46 for physician-owned practices);
-
Primary care vs. specialty care (total cost per RVU = $56.83 for primary care practices compared with $54.05 for specialty practices); and
-
Paper-based vs. electronic health record (EHR) systems (total cost per RVU for practices with no EHR = $56.58 compared with $53.20 in practices using an EHR).
While these analyses are provocative, they are clearly preliminary and should not form the basis for any policy recommendations at this time. Though there is some suggestion that inefficiency drives increased cost (in the comparison of production and operating costs), much of the variation in cost is still likely driven by factors such as geographic differences in cost of wages, rent, malpractice insurance, supplies, compliance with insurer requirements, and other practice expenses that are outside the control of practice managers and physicians. None of these have been considered in these calculations.
Although it is perilous to make such inferences owing to the lack of research in this area, we can offer a reasonable estimate of efficiency gain opportunities by normalizing the distribution of cost of production and assuming that some proportion of the difference between the observed curve and the normalized curve represents “waste.” When the curve is normalized, we find that about $25.5 billion in cost reductions might be possible.8 However, we assume that most of this estimate is driven by differences in physician compensation, rather than differences in efficiency. A conservative, but somewhat arbitrary, estimate of savings from improved efficiency
might be 25 percent of this number, or about $6.4 billion annually (in 2007 dollars), about 0.2 percent of total healthcare costs in the United States.
In summary, there is considerable unexplained variation among medical practices in the cost of producing an RVU of care, and additional research is sorely needed to understand the drivers of that variation. However, inefficiency is likely one of those drivers, and reducing clinical and administrative inefficiency might reduce national healthcare expenditures by about 0.2 percent annually.
LOW-COST HOSPITALS WITH HIGH-QUALITY SCORES
Arnold Milstein, M.D., M.P.H.
Pacific Business Group on Health and Mercer Health & Benefits
Sources of waste in the production of hospital services are multiple and no different from any other industrial sector. They include waste from over-production, time on hand (waiting), excess transportation, excess processing, stock on hand (inventory), excess movement, and delivery of defective services (Bush, 2007). Information from Medicare’s prospective payment system impact file, MedPAR, Medicare cost report data, and Medicare’s Hospital Compare reports enable estimation of the percentage reduction in national spending for inpatient care if all hospitals produced inpatient care for the same cost per admission as their low-cost, high-quality peers.
Such an opportunity analysis was published by the Medicare Payment Advisory Commission (MedPAC), on which the author serves, in its March 2009 report to Congress (2009). MedPAC placed 12 percent of U.S. hospitals in a “relatively efficient” group based on favorable performance on a set of risk-adjusted cost and quality measurements for 2004-2006. Per case costs were standardized for area wage rates, case mix, severity, outlier cases, interest expense, low-income patient share, and teaching intensity. A composite mortality rate was computed using methodology defined by the Agency for Healthcare Research and Quality (AHRQ) to compute risk-adjusted mortality for eight common high-risk conditions and procedures (acute myocardial infarction [AMI], congestive heart failure [CHF], pneumonia, gastrointestinal hemorrhage, stroke, craniotomy, coronary artery bypass graft, and abdominal aortic aneurysm repair). Mortality rates for each condition or procedure were then weighted for each type of discharge by the share of such discharges in each hospital.
MedPAC defined relatively efficient hospitals as all hospitals ranking in the top 12 percent nationally on a composite measure of low risk-adjusted cost per case and high-quality scores. The MedPAC analysis demonstrated that if the other 88 percent of U.S. hospitals attained the performance level of these relatively efficient hospitals, their 30-day mortality would decline
by approximately 18 percent; readmissions would decline by about 4 percent; and cost of inpatient care by about 12 percent, all while patients’ experiences of care remain unaffected (see Table 3-11).
Another way of stating the savings opportunity associated with closing the performance gap is that overall U.S. hospital inpatient cost per case would decline by about 11 percent. If these hospital cost savings were passed along to consumers, it would lower U.S. healthcare spending by nearly 2 percent, since inpatient spending comprises approximately 60 percent of hospital spending, and hospital spending comprises approximately 30 percent of total healthcare spending.
Failure to collect comprehensive nationally standardized information on hospital structural features and processes in the United States prevents full understanding of what accounts for better performance by the highest ranking 12 percent. However, data available to MedPAC shows that lower hospital costs are highly associated with financial pressure on hospitals in the form of lower negotiated average price per case by payers other than Medicare; more non-Medicare financial pressure on hospitals is associated with lower hospital production cost (see Table 3-12).
Capturing the Potential Savings
How might these savings be captured in the United States? Combining the dissemination of standardized care pathways and other successful elements of clinical process reengineering in top-performing hospitals with more procompetitive health industry regulatory policies appears to be a promising approach. If this approach were implemented vigorously, it is likely that today’s “price-performance frontier” in U.S. hospital care would also advance, generating a long-term flow of gains in hospital cost and quality. This would constitute a virtual cycle of efficiency comparisons, rewards
TABLE 3-11 Hospital Performance on Quality Measures, 2004-2006
TABLE 3-12 Impact of Financial Pressure on the Financial Characteristics of U.S. Hospitals
|
Financial characteristics, 2007 (medians) |
Level of Financial Pressure, 2002-2005 |
||
|
High Pressure (non-Medicare margin < 1%) |
Medium Pressure |
Low Pressure (non-Medicare margin > 5%) |
|
|
Non-Medicare margin (private, Medicaid, uninsured) |
–2.4% |
4.5% |
13.5% |
|
Standardized cost per discharge |
$5,800 |
$6,000 |
$6,400 |
|
Annual growth in cost per discharge 2004-2007 |
4.8% |
4.9% |
5.0% |
|
SOURCE: MedPAC, 2009. |
|||
for excellence, and faster hospital productivity gain; comparable to what occurred in most other U.S. service and product sectors, beginning in the 1990s. Though MedPAC has not yet completed similar analyses for other provider types, there is no a priori reason to expect that the size of the efficiency gap or the best closure method would substantially differ.
COSTS OF UNCOORDINATED CARE
Mary Kay Owens, R.Ph., C.Ph.
Southeastern Consultants, Inc.
As the United States faces a daunting future where healthcare spending promises to double to over $4 trillion dollars per year within the next decade (CMS, 2009), several strategies have emerged in response, such as enhanced care coordination, payment reform, and the implementation of health information technology in order to cut costs and improve health outcomes. A concrete example is provided by the Patient-Centered Primary Care Collaborative (PCPCC), which has recently supported the patient-centered medical home (American College of Physicians, 2007). This approach has already improved quality of care and access to services and reduced cost through an interprofessional, multidisciplinary team approach to patient-centered care coordination across a variety of systems. In the following analysis, we review the benefits of efforts to coordinate care, which include such innovations as the patient-centered medical home, and estimate the cost savings possible from these reforms.
The Problem
In a recent analysis by Southeastern Consultants, Inc. (SEC) of 9 million Medicaid only and Medicaid/Medicare dually enrolled patients in five
large states, we found a cohort of patients exhibiting patterns of extreme uncoordinated care.9 In the state example provided, these uncoordinated care patients represented less than 10 percent of patients, but they accounted for an average of 46 percent of drug costs, 32 percent of medical costs, and 36 percent of total costs for the population. These percentages of total cost contributed by the uncoordinated care populations did not differ significantly among the various states examined (Figure 3-2).
The following is an example of an actual patient with extreme uncoordinated care identified in the datasets. This patient is a 46-year-old female with a cardiac condition, chronic obstructive pulmonary disease, and depression who had use patterns within the 12-month period that included a total of 185 prescriptions ($8,388) from 34 different prescribing physicians, and used 21 different pharmacies. This patient also had 395 separate medical events ($28,125) among which included 45 emergency room (ER) visits ($10,012), 147 outpatient visits ($14,120), and 85 physician visits ($2,237) from 54 different treating physicians, and received other numerous types of services as well. This patient is representative of many patients we observed with extreme uncoordinated care and inefficient use patterns that drive up costs unnecessarily and compromise quality of care.
Moreover, these uncoordinated care patients have significant differences in all cost service components, including lab, outpatient, ER, pharmacy, practitioner, and hospital services. Comparisons of average annual
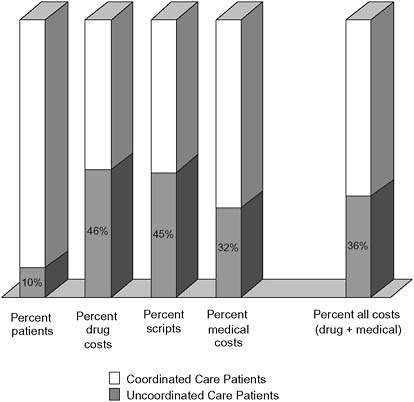
FIGURE 3-2 State example: uncoordinated care percentages for Medicaid only group.
total cost observed for the most extreme uncoordinated care patients were $15,100 compared to $3,116 for those with better coordinated care observed in the remaining population (Figure 3-3).
The patterns were even more significant among the subset of older (pre-Medicare) and Medicare dual patients who experience a greater prevalence of chronic diseases and comorbid conditions. For example, about one-quarter (28 percent) of these patients exhibited patterns of extreme uncoordinated care and accounted for an astounding 71 percent of drug costs, 44 percent of medical costs, and 52 percent of total costs for that population (Figure 3-4). The results were similar among the states studied.
How Much Does Uncoordinated Care Cost?
In the SEC analysis, we found that patients with uncoordinated care exhibited many of the same patterns in their care histories. The variables that seem to be predictors of higher than expected total cost, and thus are
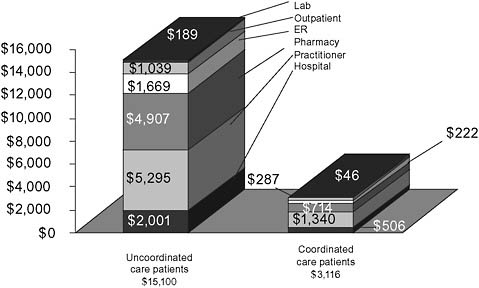
FIGURE 3-3 State example: Medicaid only group total annual expenditures—patients with and without uncoordinated care.
markers for identifying patients with the greatest savings opportunities, were those that were correlated with episodes of uncoordinated care and treatment. These predictors included excessive or inappropriate numbers and types of prescriptions, high numbers of different prescribing and treating physicians, using a high number of different pharmacies, and frequently accessing the ER for nonemergent or preventable care (Billings, 2000). All of these patterns contribute to higher than expected unnecessary costs. One very significant characteristic observed in the population studied was inappropriate medication usage, including both overuse and low adherence, which highlights an important opportunity for pharmacists to provide medication therapy management and monitoring services to patients and the entire healthcare team in a collaborative effort to improve outcomes and reduce costs.
Once these uncoordinated care patients were identified, we could begin to compare their care histories with those of similar patients in order to estimate the cost or the opportunity for savings should these uncoordinated care scenarios shift to a more continuous and coherent care plan. Below, we provide an illustrative example from one of the state datasets for a group of 10,081 uncoordinated care patients matched to 37,873 coordinated care patients by age, gender, primary disease (as shown), major comorbid disease(s), and severity of illness score. Comparing the costs of each group and using the healthcare costs associated with the coordinated group as the
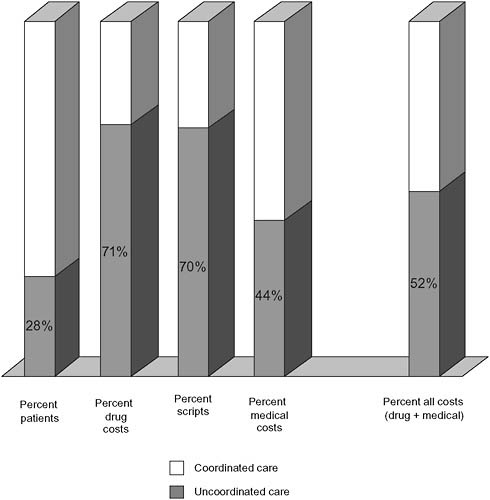
FIGURE 3-4 State example: Uncoordinated care expenditures for pre-Medicare group (ages 55-64).
baseline, the estimated excess cost of uncoordinated services is $74 million (43 percent of the total actual cost of $172 million) or $7,340 per patient (Figure 3-5). In the analysis, we adjusted for numerous contributing factors and found that the cost differences were in fact driven primarily by those selected variables correlated with patterns of extreme uncoordinated care.
The Opportunity
Patients with extreme uncoordinated care clearly account for a disproportionate share of costs. In fact, the costs of uncoordinated care averages approximately 30 percent of total plan costs studied. Based upon multiple analyses, we estimated that an average of 35 percent of the costs contrib-
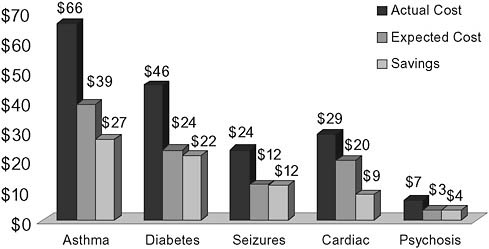
FIGURE 3-5 State example: $74 million in estimated cost savings due to uncoordinated care.
uted by patients with extremely uncoordinated care should be avoidable with improved care integration, enhanced and targeted interventions, and care coordination between providers. Again, this figure is derived from the various comparisons among uncoordinated care patients and matched cohorts of patients demonstrating more coordinated care.
Extending these estimates to the national level, the savings opportunities are formidable. Assuming that national health reform efforts aimed at these uncoordinated care patients are developed and phased in over 3 years (realizing savings at 25, 50, and then 75 percent levels), the average savings in the period 2010-2018 are estimated at $240.1 billion per year or an average of 8.8 percent of total annual expenditures. (Table 3-13).
Key Assumptions
Similar Costs for Uncoordinated Care Patients Among the Publicly and Privately Insured
According to the 2009 Almanac of Chronic Disease, 75 percent of U.S. healthcare spending overall is for patients with one or more chronic conditions, and 83 percent of all Medicaid spending and 96 percent of all Medicare spending is for patients with one or more chronic conditions (Kott, 2009). Furthermore, a national Gallup Serious Chronic Illness Survey reveals that 81 percent of people with a serious chronic condition were treated by two or more different physicians, and of that group over 32 percent of people were treated by four or more physicians (Anderson,
TABLE 3-13 Estimates of National Savings from Improved Coordination of Care (Billions)
|
Year |
NHE Total Projected Costsa |
Estimated Total Cost Contributed by Patients with Uncoordinated Care (30%) |
Estimated Cost Savings from Improved Coordination of Care (35% avg. savings) |
Estimated Coordinated Care Annual Savings (phase in over 3 years) |
Percent Coordinated Care Savings of Total Cost |
|
2010 |
$2,040.1 |
$612.0 |
$214.2 |
$53.6 |
2.6% |
|
2011 |
$2,152.8 |
$645.8 |
$226.0 |
$113.0 |
5.3% |
|
2012 |
$2,278.5 |
$683.6 |
$239.2 |
$179.4 |
7.9% |
|
2013 |
$2,420.8 |
$726.2 |
$254.2 |
$254.2 |
10.5% |
|
2014 |
$2,581.2 |
$774.4 |
$271.0 |
$271.0 |
10.5% |
|
2015 |
$2,761.3 |
$828.4 |
$289.9 |
$289.9 |
10.5% |
|
2016 |
$2,956.7 |
$887.0 |
$310.5 |
$310.5 |
10.5% |
|
2017 |
$3,169.5 |
$950.9 |
$332.8 |
$332.8 |
10.5% |
|
2018 |
$3,398.4 |
$1,019.5 |
$356.8 |
$356.8 |
10.5% |
|
Total |
$23,759.3 |
$7,127.8 |
$2,494.7 |
$2,161.2 |
|
|
|
Average annual coordinated care savings 2010-2018 |
$240.1 |
8.8% |
||
|
NOTE: NHE = National health expenditure data. aThe categories of NHE spending used to compile the baseline costs included direct care expenditures for hospital, professional, home health, and medical products and excluded administrative, nursing home, structures, and investments. Source data: National Health Expenditure Data Projections for 2010-2018, Table 2, Centers for Medicare & Medicaid Services, Office of the Actuary, released January 2009. |
|||||
2007). Again, treatment by many different physicians was a common characteristic among uncoordinated care patients. So available data would suggest that in public and private payer contexts, chronically ill patients and patients with uncoordinated care are certainly common and likely occur at comparable rates.
Mental Health Does Not Drive the Observed Cost Variance
Even though it may be a contributing factor, patients with serious mental health conditions such as psychosis or bipolar disorder accounted for only 20 percent of the patients and 34 percent of the total cost for the entire group of extreme uncoordinated care patients.
Caveats
First, even though we removed all suspected fraudulent, incorrectly paid, duplicate, and otherwise aberrant claims from our analysis, it is pos-
sible that some small percentage of fraudulent claims remained undetected and were included in this analysis.
Second, all patients with catastrophic illnesses and at the end-of-life were removed from the datasets and excluded from the analysis and cost-saving estimates. These included patients with severe trauma such as those with head injuries, burns, or other catastrophic conditions and any patient who died during the 12-month analysis period.
Third, only the most extreme uncoordinated care patients were identified and included in the cost-saving estimates. Therefore the estimates are very conservative since moderately uncoordinated care patients were not included in the cost-saving estimates and certainly represent additional savings opportunities.
Fourth, the cost-saving estimates do not include future cost avoidance in nursing home and long-term care costs that can reasonably be expected to occur due to improved coordination of care and enhanced clinical outcomes of patients who receive appropriate treatment earlier in the course of their disease and extend their physical and mental functionality and independence.
Fifth, the cost-saving estimates do not account for the 47 million uninsured people who may soon be integrated into the healthcare system since the national health expenditure (NHE) data does not include that possible scenario in the national healthcare cost projections.
Finally, the cost-saving estimates do not account for the rapidly increasing rates of chronic disease and obesity since NHE data appears to only use population and demographic trend factor adjustments and not disease prevalence-based adjustments in the projections for future healthcare expenditures.
Conclusion
The findings from these comprehensive claims analyses provide compelling evidence that the opportunity for effective cost avoidance is significant. Measures to improve care delivery and payment models, as well as efforts to leverage health information technologies to facilitate system wide, enhanced coordination, should be implemented within existing state, federal, and commercial program structures. Healthcare reform efforts must recognize and address the problem and significant avoidable cost of uncoordinated care if there are going to be “real” and “meaningful” changes to the healthcare delivery and payment systems. Public and private health plans can reduce unnecessary expenditures attributable to uncoordinated care, preserving valuable resources without reducing appropriate access to care or needed services. These preserved resources can also be used for funding expansion programs for the uninsured and underinsured populations and improving the quality of health care for all citizens.
REFERENCES
American College of Physicians. 2007. Joint principles of the patient-centered Medical Home. http://www.acponline.org/running_practice/pcmh/demonstrations/jointprinc_05_17.pdf (accessed August 6, 2009).
American College of Radiology. n.d. Utilization of Imaging. http://www.acr.org/secondarymainmenucategories/socioeconomicresearch/utilization.aspx (accessed August 27, 2010).
Anderson, G. 2007. Chronic Conditions: Making the Case for Ongoing Care. Johns Hopkins Bloomberg School of Public Health.
Billings, J. 2000. Emergency Department use: The New York story. The Commonwealth Fund Issue Brief.
Bohmer, R. M. J., and E. M. Ferlins. 2005. Harvard Business School Case 606-044.2005. Virginia Mason Medical Center.
Bush, R. W. 2007. Reducing waste in U.S. health care systems. Journal of the American Medical Association 297(8):871-874.
The Commonwealth Fund. 2009. The path to a high performance U.S. health system: A 2020 vision and the policies to pave the way. http://www.commonwealthfund.org/Content/Publications/Fund-Reports/2009/Feb/The-Path-to-a-High-Performance-US-Health-System.aspx (accessed August 26, 2009).
Fuhrmans, V. 2007. A novel plan helps hospitals wean itself off pricey tests. Wall Street Journal, January 12, 2007, A1.
IOM (Institute of Medicine). 2000. To Err Is Human. Washington, DC: National Academy Press.
Jha, A. K., D. C. Chan, A. B. Ridgway, C. Franz, and D. W. Bates. 2009. Improving safety and eliminating redundant tests: Cutting costs in U.S. Hospitals. Health Affairs (Millwood) 28(5):1475-1484.
Kott, A. 2009. 2009 Almanac of Chronic Disease. Washington, DC: Partnership to Fight Chronic Disease.
Martini, E. M., N. Garrett, T. Lindquist, and G. J. Isham. 2007. The boomers are coming: A total cost of care model of the impact of population aging on health care costs in the United States by major practice category. Health Services Research 42(1 Pt 1):201-218.
Meara, E., C. White, and D. M. Cutler. 2004. Trends in medical spending by age, 1963-2000. Health Affairs (Millwood) 23(4):176-183.
Mecklenburg, R., and G. Kaplan. 2008. The Marketplace Collaborative Project. Center for Health Solutions at Virginia Mason.
MedPAC (Medicare Payment Advisory Commission). 2009. Report to Congress. http://www.medpac.gov/documents/Mar09_EntireReport.pdf (accessed September 2009).
MGMA (Medical Group Management Association. 2008a). Cost Survey for Multispecialty Practices: 2008 Report Based on 2007 Data. Englewood: Medical Group Management Association.
——. 2008b. Cost Survey for Single specialty Practices: 2008 Report Based on 2007 Data. Medical Group Management Association.
Mehrotra, A., A. M. Zaslavsky, and J. Z. Ayanian. 2007. Preventive health examinations and preventive gynecological examinations in the United States. Archives of Internal Medicine 167(17):1876-1883.
Obama, B. 2009. Text: Obama’s speech on health care reform. New York Times, June 15, 2009.
Pear, R. 2009. Industry pledges to control health care costs. New York Times, May 10, 2009, A12.
Pham, H. H., P. B. Ginsburg, K. McKenzie, and A. Milstein. 2007. Redesigning care delivery in response to a high-performance network: The Virginia Mason Medical center. Health Affairs (Millwood) 26(4):w532-w544.
Romer, C. 2009. The Economic Case for Health Care Reform. Executive Office of the President Council of Economic Advisers.
Schappert, S. M., and E. A. Rechsteiner. 2008. Ambulatory medical care utilization estimates for 2006. National Health Statistics Reports 8:1–32.
UnitedHealth Group. 2009. Federal Health Care Cost Containment—How in Practice Can It Be Done? http://www.unitedhealthgroup.com/hrm/unh_workingpaper1.pdf (accessed October 19, 2010).
Washington State Department of Health. n.d. Financial statements.
Wolff, J. L., B. Starfield, and G. Anderson. 2002. Prevalence, expenditures, and complications of multiple chronic conditions in the elderly. Archives of Internal Medicine 162(20):2269-2276.
Zhan, C., and M. R. Miller. 2003. Excess length of stay, charges, and mortality attributable to medical injuries during hospitalization. Journal of the American Medical Association 290(14):1868-1874.


