
4
Excess Administrative Costs
INTRODUCTION
Administrative costs in the United States consumed an estimated $156 billion in 2007, with projections to reach $315 billion by 2018 (Collins et al., 2009). With the time, costs, and personnel necessary to process billing and insurance-related (BIR) activities from contracting to payment validation on the provider side and the needs of payers to process claims and credential providers, significant redundancy and inefficiency arises from healthcare administration. Adding to concerns is emerging evidence of an inverse relationship between administrative complexity and quality of care (Himmelstein and Woolhandler, 2002). The presenters in this session approach estimating excess administrative costs from a variety of macro-and microeconomic levels, all with the goal of identifying the portion of expenditures spent on administration that could be reduced by increasing the efficiency of the delivery system, which highlights the need for administrative simplification and harmonization.
James G. Kahn of the University of California-San Francisco discusses BIR costs at the provider level. He puts these costs in the context of a complex payment system, describing three main drivers of BIR costs: complexity, variability, and friction. Using available evidence, he estimates that up to $183 billion of expenditures on BIR activities in the United States may be due to inefficiency. However, he also encourages caution in interpreting the results, given the lack of adequate data on the BIR costs in several settings, such as in pharmacies and nursing homes. Lawrence P. Casalino of Weill Cornell Medical College builds on this presentation, citing evidence that
the average American physician spends 3.8 hours a week—the equivalent of more than 3 workweeks a year—on interactions with payers (Casalino et al., 2009). He estimates that Canada spends between $15 and $32 billion less on BIR activities compared to the United States because of greater administrative standardization.
James L. Heffernan from the Massachusetts General Physicians Organization highlights how other economic sectors, such as industrial manufacturers, commit significantly less resources to administration compared to the healthcare sector. Comparing the administrative costs of a single professional billing office to that of Medicare, he surmises that standardizing administrative complexity could save $26 billion for physician and clinical services’ billing operations along with 4 hours of professional time per physician per week and 5 hours of practice support staff time per week. He therefore concludes that a single, transparent set of payment rules in a multipayer healthcare system would potentially reduce the burden common in a provider’s billing office.
Concluding this session, Andrew L. Naugle of Milliman explores administrative costs for payers, focusing on the commercial market. He estimates that, if commercial insurers could all adopt the best-practice level of administrative expenses being no more than approximately 7.6 percent of fully insured commercial premiums, up to a $23 billion savings opportunity exists for the commercial market in total administrative expense reduction. As these estimates applied data across the entire commercial marketplace, Naugle cautions that variation in savings could occur across specific individual payers as they each will be variously impacted by their respective marketplace and organizational characteristics. Outlining opportunities to capitalize on these savings, he discusses possible policy options, including the elimination of manual transactions between payers and providers; simplifying the sales process; maximizing self-service capabilities and adoption; and standardizing payer and provider interaction processes and rules.
EXCESS BILLING AND INSURANCE-RELATED ADMINISTRATIVE COSTS
James G. Kahn, M.D., M.P.H.
University of California-San Francisco
There are very substantial administrative costs in the U.S. healthcare system, making up, by one estimate, nearly one-third of all spending (Woolhandler et al., 2003). A major portion of these costs are BIR activities undertaken to fulfill the requirements of getting paid, from contracting through collections. Most BIR activities occur at the provider level, with a smaller amount at the insurer level. BIR activities thus reflect the trans-
action cost of a complex payment system. As such, it largely constitutes inefficiency rather than added value. This economic loss can be mitigated if there are secondary benefits (e.g., enhanced quality or use management).
Three features of managing health insurance drive BIR costs at the provider level. The first is complexity. The insurance process has multiple steps, often demanding precise accuracy and attention to detail. BIR steps include contracting with insurers and subcontracted providers; maintaining benefits databases; determining patient insurance and cost sharing; collecting copayments, formulary, and prior authorization; coding of services delivered; checking and submitting claims; receiving and depositing payments; appealing denials and underpayments; collecting from patients; negotiating end-of-year resolution of unsettled claims; and paying subcontracted providers.
The second burdensome feature of managing insurance is variation. Due to consolidation of insurers in recent decades, a provider practice likely has fewer payers to deal with. However, each payer offers multiple products and often further customizes products to individual purchasers (such as a large employer). Each provider may have to deal with dozens to hundreds of different plans. Providers must track plan-specific benefits and reimbursement rules, maintain special databases and benefit experts, and conduct time-consuming checks of plan details prospectively and in response to claims denials. This situation is in stark contrast to privately administered plans in other developed countries, where there is typically a single primary benefits package.
The third feature is friction. Many BIR steps slow and complicate the process of getting paid. These include priority authorizations and formulary restrictions, high rates of nonpayment for initial submissions (10 to 15 percent), underpayments, and ultimate non- and underpayment (5 to 10 percent) (Gans, 2009). Providers express frustration and occasionally a suspicion that the process is kept complicated to lower ultimate payment levels.
This report estimates total U.S. BIR costs for providers, using available evidence on BIR rates applied to National Health Expenditures. For completeness, it includes a similar estimate of BIR costs for private payers. Finally, to facilitate synthesis, the report includes a tabular summary of the five administrative cost estimates presented at the IOM Roundtable on Value & Science-Driven Health Care’s workshop titled The Healthcare Imperative in May 2009.
Billing and Insurance-Related Administrative Costs
Existing estimates of the BIR component of administrative costs at providers fall into two broad categories: macroanalyses and microanalyses.
Using a macro approach, some studies have compared total administrative costs in U.S. settings to similar settings in Canada and mainly attributed the observed differences to demands of a multipayer system. More promising for this analysis, subsequent micro studies have described and inventoried BIR tasks and associated costs, in increasing detail over time.
The first study (Woolhandler et al., 2003) found a roughly threefold difference in total administrative spending per capita between the two countries in 1999. For physician practices, administrative spending was $107 (16 percent of revenue) per capita in Canada, and $324 (27 percent) in the United States. For hospitals, the amounts were $103 (13 percent) and $315 (24 percent), respectively. Thus, BIR costs were estimated indirectly (if imprecisely) as $217 and $212 per capita in 1999, in the two provider settings.
Later studies increasingly honed in on BIR tasks. Kahn and colleagues (2005) studied BIR costs in 2001 in California, finding that BIR administration represents 14 percent of physician revenue and 6.6 to 10.8 percent of hospital revenue. Sakowski and colleagues (2009) studied a large multispecialty group practice in California, finding that BIR activities represents 10 to 12 percent of revenue, with higher percentages related to the clinician time needed to code services for billing purposes. Casalino and colleagues (2009) found that the portion of BIR activities related to staff compensation in dealing with private payers is 6.9 percent of revenue. When adjusted to include public payers, overhead costs, and a portion of clinician coding of services, this translates to a total BIR cost equal to 13 percent of revenue.
Estimates of Billing and Insurance-Related Costs
This report derives estimates of total BIR costs in the United States, drawing on existing research and reference data to create as comprehensive a picture as possible. In addition, to foster a clear overview and synthesis of all administrative cost estimates presented in these proceedings, this report includes a table that systematically summarizes the estimates, identifies and reconciles differences in scope and method, and presents a best estimate for each component of BIR costs.
Total BIR costs in each healthcare system setting (e.g., physician practices) was calculated as the product of two factors: BIR cost as a percent of revenue (from published studies) and National Health Expenditures (CMS, 2007).
This analysis defined BIR-specific activities as potential excess, as compared with a system that greatly simplifies BIR requirements. An attempt to formally benchmark using the Canada vs. United States macrocomparison described above failed—observed differences in administrative costs slightly exceed the BIR costs calculated directly at U.S. providers. That is, BIR costs
are greater when calculated with the macro approach than with the micro approach. This suggests that either the cross-national macrocomparison overestimates BIR costs or the U.S. ground-up (micro) measurement underestimates BIR costs. Thus the estimates of excess BIR costs presented here are upper bounds; we attempt to correct for benchmarking in the summary table.
We also considered comparing different U.S. providers to identify best practices (lowest BIR cost) and thus the excess BIR expenditure attributable to less efficient providers would be highlighted by examining statistical distributions across practices. This is analogous to the approach used for differences in clinical services use and cost presented in other sections of these proceedings. In this method, we would examine statistical distributions across practices. However, there are serious technical impediments. Crude statistical distributions may obscure real explanatory differences (e.g., greater administrative burden or lower practice income). For example, an HMO with high-market power may negotiate high-payment rates, with no added administrative burden, leading to an artificially deflated BIR burden. Or, a practice may operate in an especially complex payer environment, driving up BIR costs. Further, this approach might be taken to imply that there are only minimal savings to be obtained at all providers from simplified BIR demands (e.g., standard billing forms or benefit plans). In this way, reducing BIR costs differs from efforts to reduce the well-understood variation in clinical practices. That is, the largest savings in administrative costs may derive from lowering everyone’s costs by simplifying the system, whereas the largest savings in clinical practice may stem from emulating current best practices.
Savings Opportunities
For physician care, annual expenditures from National Health Expenditures (NHE) projections for 2009 are $539 billion (CMS, 2007). The BIR portion of physician revenue is estimated at 13 percent, based on data from three studies (Casalino et al., 2009; Kahn et al., 2005; Sakowski et al., 2009). The result is an estimated $70 billion per year in BIR expenditures, representing an upper bound on “excess” due to the lack of an adequate benchmark (Table 4-1). For hospital care, the $789 billion in annual spending is multiplied by the midpoint of 8.5 percent from one study (Kahn et al., 2005), yielding an estimate of $67 billion. The total for physicians and hospitals is $137 billion per year. If a similar rate applies to other providers (e.g., pharmacies and nursing homes), the total for BIR costs at all providers is $254 billion.
We also present an estimate of BIR costs at private insurers. Private insurers have an estimated $854 billion in annual revenue in 2009 (CMS,
TABLE 4-1 Estimate of Billing and Insurance-Related (BIR) Costs in the U.S. Healthcare System in 2009
|
|
Annual NHE (in billions) |
Percentage for BIR Costs |
Annual BIR Costs (in billions) |
|
Physician care |
$539 |
13 |
$70 |
|
Hospital |
$789 |
8.5 |
$67 |
|
Subtotal |
|
|
$137 |
|
Other providers |
$771 |
10 |
$77 |
|
Cumulative subtotal |
|
|
$214 |
|
Private insurers |
$854 |
12.3 |
$105 |
|
Public programs |
$1,191 |
3.5 |
$42 |
|
Cumulative total |
|
|
$361 |
|
NOTE: NHE = national health expenditure. SOURCE: CMS, 2007. |
|||
2007). They have an overhead (administration and profits) of 12.3 percent (CMS, 2007). Thus, by multiplying total annual revenues by the percentage consumed by overhead, the total BIR cost is estimated at $105 billion. This is consistent with reporting for 2007 of $94.6 billion for the administration and net cost of private health insurance (CMS, 2007).
An appropriate benchmark is the overhead for public programs, which is 2 percent and 4 to 5 percent for Medicare and Medicaid, respectively (CMS, 2007); this is incorporated in the summary table for all the administrative cost estimates presented in this session.
Adding each of the individual BIR estimates together, the total upper bound for BIR costs is estimated at $361 billion in 2009. Adjustment for estimated benchmarks decreases this amount by about one-third (Table 4-1).
Primary Assumptions and Caveats
This analysis assumes that it is possible to distinguish BIR costs from other administrative functions. The triangulated, mutually consistent data using varied methods suggests that this is true, to reasonable precision. Consistency with qualitative data (e.g., physician description of a major BIR burden) is also encouraging (Casalino et al., 2009; Sakowski et al., 2009).
Second, we assume that BIR costs are not dropping since these data were collected. The recent findings of Casalino and colleagues (2009) are comparable to Kahn and colleagues (2005), with data that are 5 years
apart. Further, the majority of physician groups believe that the effort needed to deal with plans is increasing (Casalino et al., 2009).
Third, there is uncertainty in the BIR estimates. Our knowledge of BIR costs is perhaps best for physician offices, with much more limited data for hospitals, and almost none for other providers (e.g., nursing homes, labs, and pharmacies). Even in physician practices, there is uncertainty: clinician coding of services provided (about 2 percent of revenue) is necessary for billing but may also provide useful information for outcomes measurement and quality improvement. Hospital administrative reporting includes a “general administration” category that comprises 4 percent of revenue, with insufficient information to apportion to BIR activities and other administration. Notably, the BIR cost at other providers (e.g., pharmacies) is a major unknown (the analysis assumed 10 percent, based on informal observations and discussions about pharmacy operations and anecdotal reports on pharmacy benefit management procedures and fees). For public programs, there are multiple and potentially inconsistent sources of BIR burden; we rely on estimates from the Centers for Medicare & Medicaid Services (CMS), which are lower than aggregate values in NHE.
This analysis could identify no definitive benchmarks. In the summary table (Table 4-2), we incorporate benchmarks used by others, leading to a drop in the estimate of “excess” BIR costs.
Finally, the BIR costs reported here may overlap with excess clinical services. That is, if expensive clinical services are reduced 5 percent through more proactive, patient-centered care, there will also be a drop in BIR costs. However, this drop may be less than proportional, for two reasons. First, some BIR costs are a function of the number of patients or plans, not the number of services. Second, the services targeted for reduction are more expensive (e.g., MRIs cost more than office visits), so that relatively fixed BIR costs per service will represent a smaller portion of the reduced rather than of the retained services.
Next Steps
There would be value in broadened and improved BIR research. Better BIR studies are very much needed for hospitals, due to the presence of only one study, and hampered by a large undefined administrative cost category. The need for BIR research for other providers is even more acute. For physician groups, it could be useful to conduct more in-depth studies (i.e., the depth of Sakowski et al., 2009, with the sample of Casalino et al., 2009).
Intervention studies are a critical next phase. Policy makers will need to know how much BIR cost will be reduced with changes in procedures that are small (e.g., single billing form), medium (e.g., standard core benefits
TABLE 4-2 Synthesis of Estimates from Presentations on Excessa Administrative Costs
|
Setting |
Roundtable Presenter |
Billing and Insurance-Related Administrative Costs |
Method |
|||
|
Total |
Excess* |
Data Source(s) |
Types of Costs Included |
Basis for Estimating Excess |
||
|
Private Insurers |
Jensen |
n/a |
$63 billion |
OECD |
All administration & profits |
Comparison U.S vs. other OECD, adjusted for wealth |
|
|
Kahn |
$105 billion |
$75 billion |
U.S. national health expenditures |
All administration & profits |
Difference in overhead for private vs. public payers |
|
|
Synthesis |
$105 billion |
$63-75 billion |
See above |
All administration & profits |
Range from above |
|
Physicians |
Casalino |
$65 billion |
$32 billion |
U.S. representative survey, applied to NHE |
6 major activities. No service coding. |
Ratio based on Canadian survey (preliminary, potentially conservative) |
|
|
Kahn |
$70 billion |
n.s. |
Two California studies, applied to NHE |
All BIR tasks (with half of service coding), all payers & cost |
None available |
|
|
Heffernan |
n.s. |
$26 billion |
Mass. General Phys. Org, applied to NHE |
All BIR tasks, for private payers only, for 2009 |
Micro-costing of current private payers vs. Medicare |
|
|
Synthesis |
$65-70 billion |
$32-35 billion |
As above |
Similar to Kahn: all payers and BIR tasks |
Use of Casalino preliminary ratio for physician practices |
|
Setting |
Roundtable Presenter |
Billing and Insurance-Related Administrative Costs |
Method |
|||
|
Total |
Excess* |
Data Source(s) |
Types of Costs Included |
Basis for Estimating Excess |
||
|
Hospitals |
Kahn |
$67 billion |
n.s. |
One California study, applied to NHE |
All BIR activities |
None available |
|
|
Synthesis |
$67 billion |
$34 billion |
As above |
As above |
Use of Casalino preliminary ratio for physician practices |
|
Other providers |
Kahn |
$77 billion |
n.s. |
NHE, with assumed BIR |
Assumed 10% BIR, based on physicians and hospital data |
None available |
|
|
Synthesis |
$77 billion |
$39 billion |
As above |
As above |
Use of Casalino preliminary ratio for physician practices |
|
TOTALb |
|
|
$168-183 billion |
|
|
|
|
NOTE: BIR = billing-and-insurance related; n/a = not applicable; NHE = national health expenditures; n.s. = not significant; OECD = Organisation for Economic Co-operation and Development. a By “excess” we mean spending above the indicated benchmark comparison. We make no judgment on whether that excess spending brings value. b Estimates of provider BIR excess rely on the preliminary U.S.:Canada ratio used by Casalino for physicians. As this ratio is finalized, the estimates will evolve. |
||||||
package), or pervasive (e.g., single payer) in order to effectively minimize the waste associated with these costs in the U.S. healthcare system.
Synthesis of Presentations on Excess Administrative Costs
Two analyses of BIR costs among private insurers found very similar results. Eric Jensen estimated $63 billion in excess BIR costs at private insurers, as compared with OECD countries (which have a much lower private payer role). Kahn and colleagues estimated $105 billion in total BIR costs at private insurers, based on U.S. NHE data, and $75 billion in excess as compared with U.S. public payers (CMS, 2007). The synthesis range is $63-75 billion.
Three assessments of administrative costs in physician practices applied data from practices to the physician category in the National Health Expenditures. The analysis presented by Casalino and colleagues (2009) focused on staff costs in a national sample, for six major tasks required to deal with private health plans. For these written proceedings, Casalino and colleagues adjusted their analysis to include private and public payers, as well as nonstaff overhead, estimating $64.7 billion in BIR costs. As compared with costs for similar activities in Canada, the estimated annual excess in the United States is $32 billion. The analysis presented by Heffernan used data from the Massachusetts General Physician Organization, which has a relatively efficient billing operation as compared with national means. A microcosting of tasks to obtain private insurer payment versus Medicare (admittedly an imperfect payer itself) found a 10 percent excess burden. The analysis presented by Kahn and colleagues used data from two California studies that included a broader range of billing and insurance-related activities, including a portion of clinician coding of services provided. All payers and costs (e.g., overhead) are included, yielding an estimated $70 billion per year in total BIR costs.
The differences between these estimates can be explained as follows. The revised estimate by Casalino and colleagues is $5 billion less than the estimate from Kahn and colleagues, and probably reflects the different treatment of clinician service coding and imprecision.1 Heffernan used a method that includes all BIR tasks but estimates national burden based only on private payers (i.e., assuming no excess burden to providers from dealing with Medicaid or Medicare).
The synthesis estimate for excess BIR costs for physician practices is $32-35 billion. This includes all BIR activities, all payers, and all costs, with Canada preliminary analysis on staff time (Casalino et al., 2009) used to generate a benchmark ratio (i.e., excess = 50 percent total BIR).
For hospitals, Kahn presented the only estimate of $67 billion total BIR cost based on study of BIR percentages and NHE expenditures. Applying the United States vs. Canada preliminary benchmark ratio used by Casalino and colleagues for physician practices yields a net excess BIR estimate of $34 billion.
For other providers (e.g., labs, pharmacies, and nursing homes), an assumption of 10 percent BIR (between physician and hospital levels) yields an estimated $77 billion in total BIR costs. Again, applying the preliminary benchmark ratio used by Casalino and colleagues for physicians yields an estimated $39 billion in excess BIR costs for these providers.
The total excess BIR cost is estimated at $168-$183 billion per year, in 2009 dollars. This is the sum of values presented above. It relies heavily on the preliminary benchmark ratio used by Casalino and colleagues for physician practices. As this ratio is finalized, the BIR estimate using this method will evolve. This estimate is conservative in assuming no BIR excess for public programs, though some of these are more costly to administer than others, and no BIR outside of the health sector (e.g., at employers). As well, further research on BIR costs in specific sectors in the United States and Canada will lead to evolving estimates of BIR costs, total and excess. Nonetheless, we believe that this synthesis represents the best integration of existing data on BIR costs and the most accurate comprehensive estimate of current excess BIR costs—about 7 to 8 percent of U.S. spending on health care.
WHAT DOES IT COST PHYSICIAN PRACTICES TO INTERACT WITH PAYERS?
Lawrence P. Casalino, M.D., Ph.D., Weill Cornell Medical College; Sean Nicholson, Ph.D., Cornell University; David N. Gans, MSHA, and Terry Hammons, M.D., M.S., Medical Group Management Association; Dante Morra, M.D., M.B.A., and Wendy Levinson, M.D., University of Toronto
Physicians in the United States have multiple forms of interaction with different payers. Interactions with payers, such as private health insurance plans, Medicare, and Medicaid, include obtaining prior authorization, dealing with formularies, submitting claims and verifying the accuracy with which they are paid, submitting quality data and reviewing payer-generated quality performance reports, negotiating contracts, and having physicians credentialed by the payers.
Each of these interactions generates costs for both the physician practices and the payers. Some portion of those costs is waste, but the question is: How much waste, excess, and inefficiency is there? We discuss two broad categories of waste: unnecessary interactions and inefficient interactions. Unnecessary interactions might be performed efficiently but need not be done at all. Here, the interaction costs between a health plan and a physician practice exceed the benefits. Inefficient interactions are poorly structured or otherwise performed in ways that do not maximize the benefits and minimize the costs. Even though the interaction may be worth doing, waste is still generated from poor performance.
In this paper, we provide data on the cost to physician practices of time spent on interactions with health plans, wasteful and not. Even though we do discuss waste in the broad categories summarized here, we note that the adequate data necessary for fuller analysis are still lacking.
Costs to Physician Practices of Interacting with Payers
Based on a 2006 mail survey of U.S. physicians and medical practice administrators we conducted (Casalino et al., 2009), we estimate that each physician spends the equivalent of $72,036 (2009 dollars) of his or her time interacting with health plans (Table 4-3). When multiplied by the number of office-based physicians in the United States, we further estimate a total cost for all U.S. outpatient physicians of $33.2 billion. If median rather than mean estimates were used, our estimate is $53,856 per physician and $24.9 billion for office-based physicians nationally.
We also made “all payer” estimates by aggregating the above interaction costs with two others: (1) the cost to physician practices of time spent interacting with Medicare and Medicaid, and (2) the cost to physi-
TABLE 4-3 U.S. Physician Practices’ Costs of Interacting with Health Plans (2009 dollars)
|
|
Interacting with Health Plans |
Interacting with Health Plans, Billing Traditional Medicare/Medicaid and Obtaining Patient Appointments |
||
|
Costs per Physician |
National Costs (billions of dollars) |
Costs per Physician |
National Costs (billions of dollars) |
|
|
Mean |
$72,036 |
$33.2 |
$88,855 |
$40.8* |
|
Median |
$53,856 |
$24.9 |
$66,641 |
$30.6 |
|
*If overhead costs, costs for physicians and their staff not in office-based practice, and costs of the time spent by nurse practitioners and physician assistants are included; $23.9 billion would be added to this $40.8 billion, for a total cost of $64.7 billion. See Addendum. |
||||
cian practices of time spent intervening with specialists and imaging and surgical facilities to obtain more timely appointments for patients. (In the United States, obtaining such appointments is not a form of interacting with health plans, but we include this cost to facilitate comparison to the Canadian system, as discussed below.) The mean estimated cost in 2009 dollars of interacting with all payers in the United States is $88,855 per physician and $40.8 billion annually for office-based physicians (Table 4-3). If median estimates are used, our annual estimate is $66,641 per physician and $30.6 billion for all office-based physicians.
While these estimates do represent interaction costs related to payers, they do not represent total administrative costs for physician practices. They do not include:
-
The cost of overhead related to these interactions, such as office space or telephone, fax, and computer expenses;
-
Time spent by the one-third of U.S. physicians (and their staff) who are not in office-based practice; or
-
Time spent by nurse practitioners or physician assistants.
Furthermore, these estimates exclude the costs to payers of interacting with physician practices and the costs to hospitals or payers of interacting with each other.
Given these limitations, we can still use some conservative assumptions and “back of the envelope” calculations (see Addendum) to estimate the full interactions costs for physician practices. The excluded administrative costs mentioned above would increase the total interaction cost by approximately $23.9 billion to a total annual cost of $64.7 billion.
Looking beyond the dollars, we find that most physician time is spent on formularies and authorizations; most nursing staff time is spent on authorizations (Table 4-4). The average U.S. physician spends 3.8 hours a week—the equivalent of more than 3 workweeks a year—on interactions with payers. Primary care physicians and physicians working in small practices spend more time interacting with health plans than their counterparts in large practices. Regardless, the problem appears to be getting worse. Over three-quarters of survey respondents stated that the cost of interacting with health plans is increasing, with 41 percent stating that the cost is “increasing a lot.”
“Excess” Administrative Costs
As noted in the introduction, administrative costs can be excessive in three ways. First, administrative costs are excessive if they exceed the benefits they generate. For example, do the costs to physician practices and
TABLE 4-4 U.S. Hours per Physician per Week Interacting with Payers
health plans of prior authorization requirements exceed the benefits? We do not have data to address the cost–benefit questions that physician–payer interactions raise.
Second, administrative costs are excessive to the extent that physician practices and payers are inefficient in dealing even with well-structured interactions. For example, if payers provided well-designed electronic access for filing claims, requesting prior authorizations, and so on, but some physician practices do not use computers, or do not know how to use them well, this would generate excessive administrative costs.
Third, administrative costs are excessive if the interaction that generates them is structured inefficiently. For example, it may be inefficient for each health plan to do its own credentialing (requiring physicians to go through the credentialing process multiple times), rather than to use a single central credentialing source. More generally, the lack of standardization among payers for virtually every form of physician–payer interaction—for example, for Web access portals and for claim-editing processes—generates tremendous costs. One physician whom we interviewed while preparing the survey instrument explained this phenomenon vividly:
There is a lack of standardization in dealing with health plans. It’s like going to the gas station to gas up your car and having to change the nozzle on the gas pump because you have a Toyota and the pump was made to fit Fords.
While we lack the data to directly estimate the reduction in costs if physician–payer interactions were more standardized, we can use comparison with the Canadian system to provide some guidance. If standardization were very high, it might approach the degree of standardization in a single-payer system, such as the Canadian system. Preliminary analyses of our survey of Canadian physicians and administrators suggest that the time cost to Canadian physician practices of interacting with their single-payer system is considerably less than half the cost to U.S. practices. Extending that finding to the U.S. experience, standardization would reduce the annual time cost of these payer interactions from $40.8 billion to $20.4 billion—an annual saving of $20.4 billion (using means).2 If we use the $64.7 billion annual cost estimate that includes overhead expenses, physicians who are not office-based, and so on (discussed above), the annual saving would be $32.4 billion.
It is, however, important to note that these estimates do not take into account the benefits that might be lost—for example, the presumed benefits
of competition and innovation in a multipayer system—if the United States moved to a single-payer system or if multiple payers in the United States moved toward greater standardization.
The $15 billion to $32 billion estimate is a comparison with the Canadian single-payer system. It is not an estimate of the waste that could be eliminated if the U.S. multipayer system were made more efficient, such as through greater standardization. The amount of savings that such standardization would produce is not known, but interviews we conducted with 27 health plan executives and leaders of physician practices as part of our research suggest that it would yield at least 10 percent savings. If so, the annual savings would be $6.7 billion (10 percent of $64.7 billion).
Caveats and Assumptions
In addition to the caveats and assumptions noted throughout the discussion above, it is important to note that our data are based on physician and medical practice administrator responses to surveys. It is possible that the survey respondents were not representative of the population of physicians and practice administrators in the United States (or Canada). However, we surveyed stratified random samples of physicians and administrators and weighted respondents appropriately. We had a response rate of 58 percent (much higher in Canada). We were also able to check, to some extent, for nonresponse bias and found no evidence for such bias (Casalino et al., 2009).
It is also possible that respondents exaggerated the amount of time spent on interactions with payers. The amounts of time reported did vary considerably among respondents (in general, the standard deviations were approximately as large as the means). This could reflect inaccurate or exaggerated responses or true variation. As we discuss in our Health Affairs article (Casalino et al., 2009), some reassurance may be gained from the fact that three other studies, using different methodologies, made quite similar estimates of the time spent by physicians interacting with health plans. Additionally, the patterns of response across practice size, specialty type, and type of interaction in our study generally followed consistent patterns, which would be unlikely if inaccurate or exaggerated responses were common. Nevertheless, we cannot exclude the possibility that U.S. respondents consistently exaggerated the time spent, and that Canadian respondents did not.
Conclusion
In summary, our estimates, based on our U.S. analyses and on preliminary analyses of Canadian data, suggest that the multiple-payer system in the United States, as presently operated, generates $15 billion to $32 bil-
lion in excess annual administrative costs for physician practices, compared to the current Canadian single-payer system. The 27 physician group and health plan leaders whom we interviewed repeatedly emphasized that interactions between health plans and physician practices are performed much less efficiently than they could be.
ADDENDUM: “Back of the Envelope” Calculations of Additional Costs of Interacting with Payers
As noted in the text, our estimates of the cost to physician practices of interacting with payers do not include:
-
Time spent by the one-third of U.S. physicians (and their staff) who are not in office-based practice;
-
The cost of overhead related to interacting with payers, such as office space or telephone, fax, and computer expenses needed for these interactions; and
-
Time spent by nurse practitioners or physician assistants.
We estimated that including these costs would increase the national annual cost to physician practices of dealing with health plans by $17.4 billion, using the following conservative assumptions and calculations:
-
Assume that per physician cost of interacting with payers for non-office-based physicians is 65 percent lower than for office-based physicians. Given that one-third of practicing U.S. physicians are not in office-based practices (i.e., that there are half as many such physicians as office-based physicians), then the annual cost of interacting with payers for these physicians is (.35)(.50)($40.8 billion) = $7.1 billion.
-
Assume that overhead for interactions with health plans for office-based practices is 30 percent of the cost of physician and staff time spent on these interactions (Sakowski et al., 2009) (calculations provided in a personal communication with the Medical Group Management Association). Total cost of this overhead is then (.30)($40.8 billion) = $12.2 billion.
-
Assume that overhead for interactions with health plans for non-office-based practices is 10 percent of the cost of physician and staff time spent on these interactions.3 Total cost of this overhead is then (0.10)($7.1 billion) = $0.7 billion.
-
There are 125,000 nurse practitioners in the United States; assume that 90,000 work in outpatient practices and that they and the staff working with them spend 60 percent as much time as physicians interacting with payers.4 There are 68,000 physician assistants in the United States.5 Assume that 51,000 work in outpatient practice and that they and staff working with them spend 60 percent as much time as physicians interacting with payers.6 Assume no costs of interacting with payers for nurse practitioners and physician assistants not in office-based practice. Assume that nurse practitioners and physician assistants’ time, salary, and benefits are worth 40 percent of physician’s time (including specialists).7 Then a crude calculation of the cost of the time spent interacting with payers by nurse practitioners and physician assistants and staff working with them can be calculated as [the number of NPs + the number of PAs] multiplied by the ratio of time spent interacting with payers by NPs/PAs compared to physicians multiplied by the ratio of NP/PA income compared to physicians multiplied by the per physician annual cost of interacting with payers (from Table 4-1) = [90,000 + 51,000](0.6)(0.4) ($88,855) = $3 billion. Add overhead at 30 percent = an additional $0.9 billion, for a total of $3.9 billion as the cost of interacting with payers for nurse practitioners and physician assistants and staff working with them.
-
Total additional costs of interacting with payers for non-office-based physicians, nurse practitioners, and physician assistants, and overhead = $7.1 billion + $12.2 billion + $0.7 billion + $3.9 billion = $23.9 billion.
COST SAVINGS FROM SIMPLIFYING THE BILLING PROCESS
James L. Heffernan, M.B.A., Bonnie B. Blanchfield, C.P.A., Sc.D., Brad Osgood, Rosemary Sheehan, and Gregg S. Meyer, M.D., M.Sc. Massachusetts General Physicians Organization
The cost of administration in the healthcare revenue cycle is too high when compared to other industries (Credit Today, 2006). Comparison of staffing patterns of the credit and collection funding of various industries to some of the highest performing providers demonstrates that administrative costs are excessive (Credit Today, 2006). The experience with the Health Insurance Portability and Accountability Act (HIPAA) provides some insight to the approaches of administrative simplification. The providers and payers have met the standards of the legislation by using third parties to convert and transfer data from providers to meet the requirements of each payer. The use of third parties, system integrators, introduces an additional cost into the payment process in the effort to meet standardization requirements. Nevertheless, community efforts continue to seek savings by encouraging voluntary efforts.
Even though administrative processes are required to ensure fair payment for services and reduce fraud, excessive complexity in administrative processes engendered by numerous, opaque, changing, and convoluted payment rules come at significant cost. The Massachusetts General Physicians Organization studied the excessive administrative burden on physicians and modeled the costs of the current system versus a uniform and transparent set of payment rules similar to Medicare’s. The estimates of the administrative burden were found to be 11.9 percent of net patient service revenue. These results suggest standardizing administrative processes while preserving administrative controls can yield sizable financial return as a policy for incremental reform.
Administrative costs associated with receiving payment have been a well-recognized contributor to healthcare costs in the United States for decades (Woolhandler and Himmelstein, 1991), yet the complexity of administering our system of payments and its attendant costs have continued to grow. Using cross-national comparisons, aggregate costs of administration (including costs for documentation, coding, billing, etc.) now exceed 31 percent of U.S. healthcare expenditures, up from 22 percent in 1983 (Hellander et al., 1994). From 1969 to 1999, administrative personnel grew from 18.2 percent to 27.3 percent of the U.S. healthcare labor force, a rate that far outpaced that of Canada (Woolhandler et al., 2004). More recent studies have shown that the 2006-2007 growth in resources dedicated to administration (6.6 percent) has outpaced that of professional services and is comparable to the growth in hospital costs (7.5 percent) and prescription
drug spending (6.7 percent) (Keehan et al., 2008; CMS, 2007). Compounding concerns of growing healthcare administration costs is the evidence that administrative complexity has an adverse impact on quality of care (Himmelstein and Woolhandler, 2002), thus eroding the value equation for U.S. healthcare from both a cost and quality perspective.
Other economic sectors such as consumer product distribution, industrial manufacturer, and service providers commit substantially lower resources to the administration of payment for services. Non-healthcare sectors correct 3 percent of remittances for errors while the industry standard in health care is greater than three times higher (The Hackett Group, 2009). One approach to compare the relative resources required for the revenue cycle across industries is to look at the number of staff, measured in full-time equivalents (FTEs) required per dollar cost. Many non-healthcare sectors operate close to or below 100 FTEs per $1 billion collected compared with median staff levels of 810 FTEs per $1 billion collected for physician practices (Figure 4-1) (Credit Today, 2006). Although physician transactions and our payment systems are more complex than those comparator sectors, the greater than sevenfold increase in collection costs in health care begs the question of whether all of our current resources committed to these processes are being put to best use.
The impact of excessive administrative complexity on physicians can
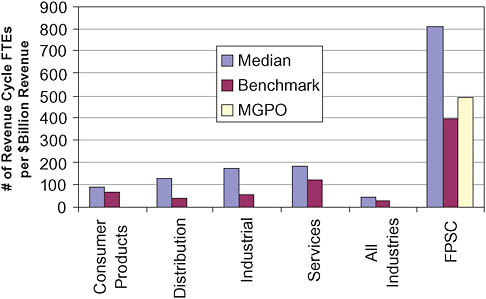
FIGURE 4-1 Physician billing staffing compared to other industries.
NOTE: FPSC = Faculty Practice Solution Center; FTE = full-time equivalent; MGPO = Massachusetts General Physicians Organization.
be particularly dramatic; in one study of a typical 10-physician practice, estimated excess administrative complexity cost over $250,000 per year (Pope, 2004). Another physician organization had a 32 percent growth to 250 FTEs, independent of programmatic growth, in the staffing of its professional billing office over a 6-year period to help deal with administrative complexity (Healy, 2003). The costs of compliance and adjudicating payment disputes are indirectly passed on to purchasers and patients and translate into significant resources that could be spent elsewhere in our healthcare system, yet there has been little concerted action to remedy this situation (Martin, 1999). There is also evidence that undue administrative burden extracts nonfinancial tolls as well. For example, a review of the significant contributors to a dramatic decline in physicians’ perception of their practice environment over the period from 1992 to 2006 singled out the costs of practice management in general, and excessive administrative complexity in particular, as major contributors (Massachusetts Medical Society, 2007). In spite of these many indications, stakeholders in the U.S. healthcare system, including patients, providers, payers, purchasers, and policy makers, have demonstrated little motivation to collaboratively confront excessive administrative complexity as a target for reform.
Cost Estimates
The excessive administrative complexity of the payment system was found to primarily encumber: (1) the processing and receipt of payments for physician services in the professional billing office (PBO), and (2) the administrative functions of physicians and their staff in the clinical practices. In addition, excessive administrative complexity generated costs related to successful appeals and unrealized revenue due to rejected claims that would have been paid under our alternative single transparent rule set and processing requirements. In fiscal year (FY) 2006, the cost of excessive administrative complexity, including both expense and lost revenue, was nearly $45 million, or 11.9 percent of net patient revenue (representing $8.43 of net patient revenue per dollar of burden spent or $50,250 in burden per physician). These costs primarily consist of labor costs with the exception of rejected claims and nonlabor PBO infrastructure costs that have been conservatively estimated at the department level (Table 4-5).
Thirteen percent, or $5.6 million, of the total estimated administrative complexity burden was due to excessive administrative complexity directly associated with the processing and billing of claims in the PBO. Table 4-6 lists the cost centers within the PBO related to excessive administrative complexity. These costs do not include the estimated 29 percent of staff time following up on claims that are initially rejected but later paid upon appeal.
TABLE 4-5 Financial Cost of Administrative Complexity in Case Study Physicians’ Organization
The largest portion of the administrative complexity burden, 74 percent, is attributed to the time costs of practicing physicians and their office staff preparing paperwork and contacting payers responding to questions concerning prescriptions, diagnoses, treatment plans, and referrals. Many of the subspecialty practices within the Massachusetts General Physicians Organization (MGPO) have full-time staff dedicated to referral processing. The physician time estimated at 4 hours per week accounts for $28.4 million of the estimated burden while the practices’ administrative staff and
TABLE 4-6 Administrative Complexity Burden in the PO’s Professional Billing Office
nursing time of 5 hours a week accounts for $4.9 million. Although these “costs” are best viewed as opportunity costs rather than true savings, the value of these practice-based savings could be realized through physician and staff work-life improvements, more time with patients, and/or increased productivity.
On the revenue side we found that for non-Medicare payers, 12.6 percent of charges that are billed are denied on the initial submission. After appeal, 81 percent of initial denials are eventually paid (10.2 percent of charges). The level of denials that are not collected from non-Medicare payers remains 2.4 percent greater than Medicare. The loss of this revenue is attributed to lack of standards and communication of the rules across payers compared to the Medicare practice. The revenue lost is of a value of $6 million by the MGPO. In addition to the direct loss of revenue, 29 percent of the current PBO staff effort is committed to processing and appealing denials that are eventually paid.
There will always be some administrative tasks required to process claims for payments of services, to measure performance for improvement, and to ensure the payments are made for services performed; however, the U.S. healthcare system has generated Byzantine systems of rules and regulations surrounding payment for medical services and the result has been a growing and costly bureaucracy that in the end pulls resources from direct patient care. On a national scale, the MGPO estimates translate into approximately $26 billion of savings for physician and clinical services billing operations. This is the result of applying the ratio of the cost of administrative complexity for the MGPO of 11.9 percent to the value of private health insurance payments for physicians and clinical services of $221 billion, based on the 2006 National Health Expenditure Projections 2007-2017, Office of the Actuary in the Centers for Medicare & Medicaid Services (CMS, 2007).
Next Steps
A single transparent set of payment rules for a healthcare system with multiple payers would potentially reduce the stress and burden common in a billing office of a physicians’ organization. Some of the changes in tasks and functions performed by PBO staff that would be eliminated or take less time are listed in Table 4-7. Most changes would reduce appeals to payers, reworking of claims, repetitive tasks, resources necessary to keep systems current, and time spent reviewing changing payer guidelines.
Administrative simplification receives a lot of attention in local and national forums. In Massachusetts there was an effort led by the Massachusetts Medical Society and members of the state Healthcare Financial Management Association chapter called the Round Table. It identified a
TABLE 4-7 How Could Administrative Complexity Burden Be Reduced if a Single Set of Rules Were Used?
list of opportunities to pursue common policies and procedures leading to lower cost. Efforts continue to realize the savings, including working with the Council on Affordable Quality Healthcare to develop a more efficient process for large groups, in addition to the progress they have made for individual practitioners and small groups.
A new effort was launched in the last 3 months that brings together payers and providers with employers in an expanded effort. The program is called EACH, or Employer Action Coalition on Healthcare. It is a three-
pronged effort, with administrative simplification being one of the major goals. Providers and payers continue to take these voluntary actions in many communities. But, both payers and providers find it difficult to make the investment to change to a more efficient collaborative system when their own systems are working well for their purpose. Effectively these factors prevent the achievement of the important administrative simplification goals. Some commentators have concluded that this is evidence that we need a single national payer.
Consider as an alternative, that a common administrator might be a more effective solution. The analysis described in this paper used Medicare rules as a possible benchmark. In addition, CMS is moving toward using common Medicare contractors in each region. The contractors have launched the major effort to coordinate hospital and physician payments. These organizations will be in a position to compete to administer services consistently across payers in a region. The Medicare contractors are already required to meet performance requirements, maintain an extensive system of reporting, deliver provider education, and a track record of low cost.
The processes involved in the revenue cycle and therefore in the administrative simplification effort are not static. They change with the addition of new technology for both payers and providers. They are impacted by new developments in benefit management. They are potentially significantly impacted by the new payment models that may be anticipated with health reform. Administrative simplification requires a dynamic measurement process to allow for continuous improvement and adjustment as the performance changes. A few areas of the country have experience with provider and payer–provider performance reporting tools. These have the potential to transparently monitor the effectiveness of both payer and provider systems to improve both the effectiveness and efficiency of the revenue cycle.
Primary Caveats and Assumptions
We recognize that there are other important limitations to our study. First, our study was limited to just one PBO. Although there is some evidence to suggest that the operations of that PBO are relatively efficient (thus biasing our savings estimates toward being conservative) there may be significant variation in administrative costs between PBOs, which could be similar to that found among hospitals (McKay et al., 2008). For example, PBOs in less competitive markets with a single dominant commercial payer could have lower administrative costs due to a smaller number of billing rules and processes. Second, we focused on excessive administrative complexity in fee-for-service payments. We recognize that with undermanaged care the payment rules may be purposefully more restrictive so our results may not be directly generalized to capitated and other managed care arrangements.
We focused on a PBO perspective, recognizing that additional savings would also accrue to payers (who have corresponding costs associated with adjudicating claims and appeals) under our single payment rule scenario, but they could not be quantified here. In addition, there are emerging costs related to quality reporting, improvement, and pay-for-performance administration that are not included here because they could not be characterized as “non-value-added” activities. The incremental costs incurred by the PBO to meet different performance management measures have not been identified, yet contribute to the dynamic nature of the administrative simplification in light of the health reform debate.
Conclusion
An incremental move to one set of payment rules would yield significant dollar savings and work-life and productivity opportunities for physicians would be created. The savings from reducing administrative complexity would be translated into decreased costs in general and provide resources that could be passed on as savings to purchasers and patients or provide additional needed health services. Achieving these savings would not require restructuring the basic market system of our complex healthcare system through mandating a single payer. Rather, mandating a single set of rules, a single claim form, standard rules of submission, and transparent payment adjudication—with corresponding savings to both providers and payers—could provide systemwide savings that could translate into better care for Americans.
EXCESS HEALTH INSURANCE ADMINISTRATIVE EXPENSES
Andrew L. Naugle, M.B.A.
Milliman, Inc.
Within the context of the 2009 U.S. healthcare reform discussion, significant attention has been paid to identifying opportunities to reduce administrative expenses. Every stakeholder in the health insurance system incurs some administrative expense—payers, providers, purchasers, and even patients. Efforts to reduce these costs, especially those of payers and providers, have the potential to produce substantial financial savings, which could be used to fund additional care or be redirected for other purposes.
Our experience working with both payers and providers convinces us that there is widespread agreement that administrative expense reduction is both worthwhile and possible. In many cases, we believe that there is also agreement regarding viable high-level tactics for reducing administrative expenses. The points of contention and disagreement, which have precluded
significant administrative expense reduction in recent years, tend to involve funding of cost-reduction initiatives (who will pay for them?), avoidance of risk associated with changes to the status quo, and the potential for loss of payer competitiveness through product commoditization.
This paper quantifies the industry-wide administrative expense-reduction opportunity that the commercial payer community could achieve by transitioning from today’s average administrative expense level to a best-practice administrative expense level. In addition, the paper identifies some tactics that could be employed by the industry to achieve these potential cost reductions.
For the purposes of this analysis, we have defined administrative expense as all expenses incurred by payers for common administrative functions such as claim processing, customer service, underwriting, medical management, and sales and marketing, as well corporate overhead and external broker commissions. We have excluded premium taxes from the analysis.
It is important to note that this paper only focuses on the commercial market (e.g., not Medicare, Medicaid, or TRICARE) and excludes supplemental products (e.g., vision, dental, and hospital indemnity plans). It also ignores potential savings that could be realized by other stakeholders (specifically, providers and purchasers) through implementation of cost-reduction strategies by payers.
Quantifying the Expense Reduction Opportunity
We used the following methodological approach to quantify the magnitude of the administrative expense-reduction opportunity:
-
Estimated the total dollar value of commercial premiums for the entire U.S. health insurance marketplace;
-
Estimated the distribution of commercial premiums between self-insured and fully insured products;
-
Estimated total administrative expense associated with fully insured commercial products;
-
Estimated total administrative expense for fully insured commercial products assuming a shift from current expense levels to a best-practice level;
-
Calculated the savings opportunity for fully insured commercial products as the difference between the current administrative expense level and the estimated best-practice expense level;
-
Estimated the marginal expense reduction opportunity for self-insured business as a percentage of the marginal expense-reduction opportunity for fully insured business; and
-
Calculated the range of total possible savings as the sum of the value for fully insured commercial business and the range of possible savings for self-insured commercial business.
The methodology and data sources we used to develop these estimates are described below.
Value of Current Total Commercial Health Insurance Premiums
Our estimate of the total value of health insurance premiums for the commercial health insurance market is based on the Milliman Healthcare Reform Database. The Milliman database contains cost details for U.S. subpopulations (market segments), with the total reconciling National Health Expenditures data for 2008. According to this data source, 2008 U.S. health insurance commercial premiums, including premium equivalents for self-funded products, totaled approximately $700 billion.
Distribution of Commercial Health Insurance Premiums
There are two primary types of risk arrangements in the health insurance market: fully insured and self-insured (also known as “self-funded”). For fully insured products, the insurance company (the payer) takes the financial risk on the claims cost. For self-insured products, the purchaser (typically the employer) takes that financial risk. The self-insured market has grown substantially since implementation of the Employee Retirement Income Security Act of 1974 (ERISA), which recognized self-funded plans as a viable option and exempted them from most state-mandated benefits.
Self-funded products are most prevalent for group sizes greater than 500 covered lives, but are a viable option for much smaller groups. This approach is typically unadvisable for groups of less than 100 covered lives because of the risk exposure. Self-funding offers several characteristics that are desirable to purchasers, including benefit design flexibility, and lower cost owing to exemption from state premium taxes (which can add 2 percent to the cost of a fully insured product) and the insurer’s risk margin on the claims cost.
In our experience, fully insured products tend to generate a greater amount of administrative expense than self-insured products. This situation exists because of a variety of factors such as unbundling of administrative services, shifting of administrative responsibilities from the payer to the employer’s human resources department, and price pressure. For that reason, it was necessary to estimate the distribution of total commercial premiums between these two risk arrangements. The data sources we used to make this distribution were the Medical Expenditure Panel Survey from
the Agency for Healthcare Research and Quality (AHRQ), and proprietary Milliman data. Through the combination of these two data sources, we estimated that approximately $375 billion of premiums are associated with fully insured products and $325 billion of premium-equivalents with self-insured products.
Administrative Expense for Fully Insured Commercial Products
We estimated 2008 total administrative expense for fully insured commercial products using benchmarks developed from administrative expense data collected from more than 100 payers. According to these proprietary benchmarks, median payer administrative expense for fully insured commercial products, expressed as a percentage of fully insured commercial premiums, was 11.3 percent. Note that this definition of administrative expense is inclusive of external broker commissions, but excludes premium taxes.
Using the combination of the total fully insured premiums in the commercial market and the median administrative expense level (using the median to approximate the mean) we calculated an estimate of $42.4 billion ($375 billion × 11.3 percent) to represent total payer administrative expense for fully insured commercial products.
Administrative Expense for Fully Insured Commercial Products at Best Practice
Next, we developed an estimate of what total payer administrative expense for fully insured commercial products would have been in 2008 if administrative expense as a percentage of premiums was shifted from 11.3 percent to a level equivalent to that exhibited by best-practice organizations. Best-practice payers tend to exhibit certain characteristics that allow them to offer high-quality service in a very efficient manner. For example, they maximize use of electronic transactions, leverage information systems to achieve high levels of automation, minimize low-value administrative activities, and generally avoid unnecessary complexity.
In terms of administrative expense, we defined the best-practice level, based on our experience, to be approximately 7.6 percent of fully insured commercial premiums. Although it is possible for organizations to operate effectively at lower administrative expense ratios, we find it is more common for organizations with administrative costs below this level to exhibit characteristics of poor performance (e.g., high claims turnaround times, long customer service call hold times, inadequate or ineffective medical management programs) that are due to insufficient staffing.
Furthermore, it is important to consider that certain administrative
costs can have an offsetting impact on benefit cost. For example, some medical management programs can help to avoid unnecessary use. Administrative spending on these programs can be considered an investment, which can result in lower expenditures for healthcare services and therefore a lower total cost. Elimination of such “good” administrative expenses must be carefully considered to ensure that any administrative expense savings are not offset by increases in benefit costs.
Using the best-practice administrative expense level defined above and our estimate of total fully insured commercial premiums, we estimated that total payer administrative expense would be approximately $28.5 billion ($375 billion × 7.6 percent).
Administrative Expense Reduction Opportunity
Fully insured commercial business Using the administrative estimates developed in the two prior sections, we calculated the total administrative expense reduction opportunity for fully insured commercial products as the difference between the 2008 median and the best practice: $13.9 billion ($42.4 billion-$28.5 billion). This amount represents an estimate of the savings that could be achieved by shifting the industry median administrative cost level to a level representing current best practice.
Self-insured commercial business As previously stated, in our experience, self-insured products incur lower levels of administrative expense than do fully insured products. Therefore, we estimated the administrative expense reduction opportunity for these products by assuming the effect would be in the range between 50 and 75 percent of the marginal reduction for fully insured products.
Given that, we estimate that additional administrative expense savings for self-insured businesses could be in the range between $6.2 billion and $9.1 billion. We calculated these estimates as shown in Table 4-8.
Commercial Administrative Expense Reduction Opportunity
In summary, we estimate the total administrative expense-reduction opportunity for the commercial market as the sum of the estimate for the fully insured market ($13.9 billion) and the range of estimates for the self-insured market ($6.2 billion to $9.1 billion). The resulting range is $20.1 billion to $23.0 billion, or approximately 3 percent of total commercial premiums.
Within the context of healthcare reform, this may be a relatively conservative estimate. It assumes that the entire payer community achieves an administrative expense level consistent with current best practices. If the
TABLE 4-8 Estimates of Payer Administrative Expense-Reduction Opportunity for Self-Insured Business
definition of best practices changes due to significant changes to the administrative paradigm, then even greater administrative expense reductions may be possible. Furthermore, we caution users of this report to consider the caveats and assumptions described in the next section.
Caveats and Assumptions
Reviewers of this document should consider the following caveats and assumptions when evaluating the results:
-
The savings estimates provided herein are only for payers. Secondary savings would likely accrue to providers, purchasers, and potentially patients. Those savings are not estimated in this paper.
-
The savings estimates provided herein are only for commercial products. Additional savings may be achieved in noncommercial products (e.g., Medicare, Medicaid, TRICARE). Those savings are not estimated in this paper.
-
The calculation methodology applies data in a general manner across the entire marketplace. These estimates are not intended to represent what is possible for a specific plan or group of plans. It may not be possible for all payers, especially small payers, to achieve the best-practice benchmark because of a variety of circumstances, most notably the effects of economies of scale.
-
We do not guarantee an organization’s or the industry’s ability to achieve the savings estimates described herein, and Milliman disclaims any and all liability that may result from a third party’s use of this white paper.
-
The opinions expressed in this white paper represent those of the author and not the opinions of Milliman, Inc.
Next Steps
While the opportunity to reduce payer administrative expenses in the U.S. health insurance system is great, the realization of those savings presents many challenges. If the historical context is an indicator of the future, then the achievement of material administrative cost reductions will require concerted, collaborative expense-reduction efforts coordinated among all stakeholders.
We believe there are opportunities to reduce the complexity that drives inefficiency in the system. To that end, we have identified a few tactics targeting those functions that drive the majority of administrative expense, and therefore represent, in our opinion, high-priority areas of focus for administrative expense reduction efforts.
Eliminate Manual Transactions Between Payers and Providers
According to the U.S. Healthcare Efficiency Index (www.ushealthcareindex.com), the majority of common transactions between payers and providers are performed using labor-intensive, manual means. This is despite the fact that, in accordance with HIPAA, nearly every payer in the nation has the capability to accept electronic transactions, and significant financial benefits accrue to payers through their use. Eliminating manual transactions for claim submission, claim status inquiries, eligibility verification, claim payment, and remittance advices will substantially reduce both payer and provider administrative expenses.
Simplify the Sales Process
Today approximately 30 percent of payer administrative cost is driven by sales and marketing activities. Approximately one-half of that amount is driven by external broker fees. The process of purchasing group health insurance, and soliciting and evaluating proposals from multiple payers, is complicated and time consuming. Furthermore, most group insurance purchasers are not health insurance experts. These realities drive many purchasers to employ the services of a broker. Although the broker provides some valuable administrative services for less sophisticated purchasers, substantial reductions in sales and marketing expense could be achieved if purchasers could more easily compare products and prices, thus minimizing the broker’s role, and associated costs, in the sales process.
Maximize Self-Service Capabilities and Adoption
Although health insurers have made significant investments in self-service capabilities (online and telephonic), adoption rates for these services could improve significantly. The administrative expense associated with a self-service transaction is negligible when compared to the cost of handling a telephone call or processing written correspondence.
Standardize Payer–Provider Interaction Processes and Rules
A typical provider may have contracts with 10 or more insurers and interact with others as a nonnetwork provider. Every payer has different processes, policies, and rules. Standardization of processes for common types of interactions could reduce both provider and payer administrative expense.
Scrutinize Medical Management Programs for Effectiveness
Since the advent of managed care, payers have implemented many programs intended to manage use of healthcare services. The clinical personnel (e.g., physicians, nurses, and other clinicians) responsible for these programs are often among the most expensive administrative staff. Although some of these programs are effective in managing use and cost, others have dubious value, especially when compared to the administrative burden they impose on payers, providers, and patients. The elimination of medical management programs that do not demonstrate value could significantly reduce administrative cost.
Of course, this is not a complete list, and successful implementation of all of these tactics does not guarantee realization of the full savings opportunity. However, we believe it is possible to substantially reduce payer administrative expense to the benefit of the U.S. healthcare system. We also believe that material administrative expense reduction can be achieved without harming competition among insurers, and without reducing provider reimbursement levels or diminishing quality and service to purchasers and patients. Such initiatives will, however, require coordination among all stakeholders, and implementation of carefully considered strategies adopted by all payers, to reduce complexity and eliminate administrative variation.
REFERENCES
American Academy of Nurse Practitioners. Number of nurse practitioners. http://www.aanp.org/AANPCMS2 (accessed July 1, 2009).
American Academy of Physician Assistants. http://www.aapa.org/about-pas/faq-about-pas (accessed July 1, 2009).
Casalino, L. P., S. Nicholson, D. N. Gans, T. Hammons, D. Morra, T. Karrison, and W. Levinson. 2009. What does it cost physician practices to interact with health insurance plans? Health Affairs (Millwood) 28(4):w533-w543.
CMS (Centers for Medicare & Medicaid Services). 2007. National Health expenditure projections 2007-2017. http://www.cms.hhs.gov/NationalHealthExpendData/Downloads/proj2007.pdf (accessed July 1, 2009).
Collins, S. R., R. Nuzum, S. D. Rustgi, S. Mika, C. Schoen, and K. Davis. 2009. How health care reform can lower the costs of insurance administration. Issue Brief (Commonw Fund) 61:1-19.
Credit Today. 2006. MGPO Analysis Comparing Data from Credit Today 2005 Credit, Collection & A/R Staff Benchmarking Survey. Roanoke: Credit Today. Gans, D. 2009. Unpublished Data, June 21.
The Hackett Group. 2009. Hackett Certified Best Practices. http://www.thehackettgroup.com (accessed November 6, 2009).
Healy, B. 2003. Paperwork pileup. Boston Globe, April 21.
Hellander, I., D. U. Himmelstein, S. Woolhandler, and S. Wolfe. 1994. Health care paper chase, 1993: The cost to the nation, the states, and the District of Columbia. International Journal of Health Services 24(1):1-9.
Himmelstein, D. U., and S. Woolhandler. 2002. Taking care of business: HMOs that spend more on administration deliver lower-quality care. International Journal of Health Services 32(4):657-667.
Kahn, J. G., R. Kronick, M. Kreger, and D. N. Gans. 2005. The cost of health insurance administration in California: Estimates for insurers, physicians, and hospitals. Health Affairs (Millwood) 24(6):1629-1639.
Keehan, S., A. Sisko, C. Truffer, S. Smith, C. Cowan, J. Poisal, and M. K. Clemens. 2008. Health spending projections through 2017: The baby-boom generation is coming to Medicare. Health Affairs (Millwood) 27(2):w145-w155.
Martin, J. 1999. Two simple steps that would cut costs and broaden access to health care. Boston Globe, January 20.
Massachusetts Medical Society. 2007. MMS Index Report. Waltham: Massachusetts Medical Society.
McKay, N. L., C. H. Lemak, and A. Lovett. 2008. Variations in hospital administrative costs. Journal of Healthcare Management 53(3):153-166; discussion 166-157.
Pope, C. 2004. The cost of administrative complexity. Administrative intricacies add no value to health care—but the costs keep stacking up. MGMA Connexion 4(10):36-41.
Sakowski, J. A., J. G. Kahn, R. G. Kronick, J. M. Newman, and H. S. Luft. 2009. Peering into the black box: Billing and insurance activities in a medical group. Health Affairs (Millwood) 28(4):w544-w554.
Woolhandler, S., and D. U. Himmelstein. 1991. The deteriorating administrative efficiency of the U.S. health care system. New England Journal of Medicine 324(18):1253-1258.
Woolhandler, S., T. Campbell, and D. U. Himmelstein. 2003. Costs of health care administration in the United States and Canada. New England Journal of Medicine 349(8):768-775.
——. 2004. Health care administration in the United States and Canada: Micromanagement, macro costs. International Journal of Health Services 34(1):65-78.


