
5
Prices That Are Too High
INTRODUCTION
In a discussion about rapidly rising healthcare costs, inevitable attention turns to the pricing of medical services and products. While current prices may preserve incentives for innovation and reflect investments in research and development (Jayadev and Stiglitz, 2009), these prices may also reflect market asymmetries in information and monopoly power (Dafny, 2009; Pauly and Burns, 2008). The speakers in this session explore how current market practices result from perverse economic and practice incentives, and the opacity of cost, quality, and outcomes, yielding prices that may cost the nation billions of dollars in expenditures unnecessarily.
Basic economics teaches that monopolies create high prices and inefficiencies because of the stymied competition. Cory S. Capps of Bates White reasserts this basic economic principle when he examines the impact of hospital consolidations on prices. According to his research, mergers have resulted in higher costs and prices and static or worse patient outcomes. He describes how, until the 1990s, mergers had been blocked because of antitrust legislations. However, a policy change in 1993 has since allowed for the concentration of healthcare providers and relative increase of market inefficiencies. Estimating that current healthcare expenditures are about 0.4 to 0.5 percent higher than they would be absent price increases from hospital consolidations, Capps postulates that “unconcentrating” the market would yield between $10 billion and $12 billion in savings annually. However, he also explains that this analysis considers only broad averages and general trends, and does not indicate that any specific hospital consolidation will (or will not) result in higher or lower prices.
Jack Hoadley of Georgetown University discusses how pricing and markets work in relation to pharmaceuticals, explaining that pricing varies substantially by payer and by whether drugs are under patent protection. He also explores how government-sponsored programs, such as the Veterans Administration and Medicaid, price drugs differently than privately insured health plans (including those that deliver the Medicare drug benefit) or than pharmaceutical companies for uninsured purchasers. He additionally reviews research demonstrating that brand-name drugs are twice as expensive in the United States as in other countries while generic drugs are less expensive domestically. Hoadley ultimately concludes that, while a price reduction of even 5 percent in brand-name drug prices could save $9 billion a year, the potential is unclear, partially because pharmaceutical spending is driven not only by prices, but also by physicians’ prescribing decisions and patients’ decisions whether to comply with their prescriptions. While Hoadley cautions that this estimate is only illustrative, as no obvious standard for an optimal drug price is available, he also explains that additional consideration of the impact price alterations could have on research and development and innovation is necessary.
According to Thomas J. Hoerger of RTI (Research Triangle Institute) International and Mark E. Wynn of the Centers for Medicare & Medicaid Services, evidence from competitive bidding demonstration projects demonstrates that the market for durable medical equipment (DME) inflates prices by approximately 20 to 25 percent. Care as to the interpretation of the amount of savings achievable is suggested by Hoerger because, while his savings estimate is based on competitive bidding results from the 1999-2002 demonstration projects and the 2008 national program, Medicare fees for DME have since been reduced. Hoerger also discusses how generous insurance coverage and demand created by pressing medical needs can promote higher prices for DME in excess of those that would occur in a perfectively competitive market. Although Medicare has used administered fee schedules in an effort to control these excess prices, Hoerger argues that these schedules may not be responsive to the usual market forces of supply and demand, entry and exit, and technological change. Wynn suggests that well-defined products, such as durable medical equipment, are the best candidates for competitive bidding. Yet, despite the potential for competitive bidding to lower the prices for DME, he urges consideration of the political context, describing how Congress delayed a DME bidding program for 18 months given formidable political backlash.
Lastly, Jeffrey C. Lerner of ECRI Institute concludes this session discussing price-setting practices and market practices for medical devices. He examines some of the most common purchasing processes in hospitals and discusses how efficiency can be improved. Building on the premise that the large and artificial asymmetry between information and market power existing between buyers and sellers creates inefficiencies, he suggests that
better negotiating processes in hospitals could have yielded close to $5 billion in savings in 2008. He acknowledges that beyond hospitals, data from outpatient medical centers and physician groups would be needed for a more complete analysis.
PRICE IMPLICATIONS OF HOSPITAL CONSOLIDATION
Cory S. Capps, Ph.D.
Bates White, LLC
Because Medicare and Medicaid payments are largely determined by administrative fiat, only payments by private parties, primarily insurers, are subject to potential price increases resulting from hospital ownership consolidation. Since 2002, payments to hospitals by private payers have made up 13 to 14 percent of national healthcare expenditures.1 This implies, for example, that if hospital prices increase by 10 percent then total national healthcare expenditures would increase by 1.3 to 1.4 percent.
Hospital Consolidation and Spending Growth
In the late 1980s and early 1990s, hospital inpatient spending grew rapidly at rates of roughly 4 percent, and total hospital spending grew 8 to 10 percent per year (California HealthCare Foundation, 2009; Claxton et al., 2007; Ginsburg et al., 2006; Strunk et al., 2002) (Figure 5-1). Then, beginning in the early 1990s, two major structural changes in the healthcare industry gathered steam. The first was the dramatic increase in the penetration of managed care (Figure 5-2). The second was a reduction in the length of the average hospital stay and a concomitant increase in outpatient care.
In combination, these changes likely explain the marked reduction in the growth rate of spending on hospitals in the early and mid-1990s. Instead of growing at rates in excess of 8 percent, overall hospital expenditures increased 3 to 4 percent annually, while inpatient expenditures actu-
|
1 |
Spending on hospital care represents roughly 31 percent of total healthcare spending, and private-sector spending represents about 55 percent of total healthcare spending (2007 National Health Expenditures Tables, at http://www.cms.hhs.gov/NationalHealthExpend Data/02_NationalHealthAccountsHistorical.asp). Multiplying the hospital share by the private-sector share suggests that private-sector payments to hospitals are closer to 17 percent of national healthcare expenditures. NHE Table 4 reports by expenditures source of funds and type of expenditure from 2002-2007 and shows that private-sector payments to hospitals account for 13 to 14 percent of total healthcare expenditures. The discrepancy between the higher figure and the 13 to 14 percent figure is likely the result of lower acuity hospital visits among the privately insured population (i.e., while private-sector spending is 55 percent of total healthcare spending, the private sector accounts for a share of payments to hospitals that is below 55 percent). |
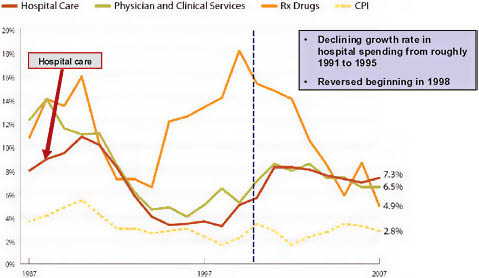
FIGURE 5-1 Components of national healthcare spending growth.
NOTE: CPI = consumer price index.
SOURCE: Reprinted with permission from the California HealthCare Foundation, 2010.
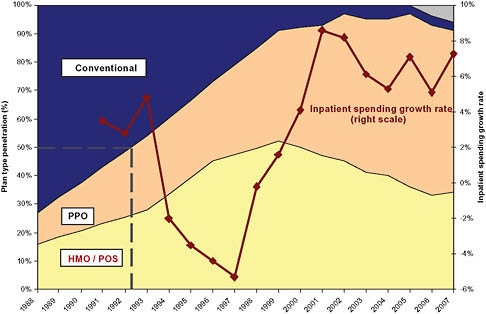
FIGURE 5-2 Managed care penetration and inpatient spending growth.
NOTE: HMO = health maintenance organization; PPO = preferred provider organization; POS = point of sale.
ally fell for several years. Then, around 1993, a wave of hospital mergers began (Figure 5-3). The peak occurred in 1996, when there were 108 consolidations among hospitals within metropolitan statistical areas (MSAs). Merger and acquisition activity remained high for several years thereafter (Town and Vistnes, 2001). Thereafter, in the late 1990s and 2000s, hospital spending returned to growth rates in excess of 6 percent overall and 6 to 8 percent for inpatient services only. In both periods of rapid spending growth—the late 1980s and late 1990s to 2007—the rate of increase of hospital spending outpaced the Consumer Price Index (CPI) by approximately 4 percent per year (Figure 5-2).
The peak of the 1990s hospital merger wave was followed by an increase in inpatient spending growth (Figure 5-3). Economic literature exploring the relationship between hospital mergers and hospital pricing suggests that a significant portion of the resurgence in hospital spending growth rates was caused by price increases resulting from hospital mergers.
Economic Research on Hospital Consolidation
This section builds on a comprehensive 2006 survey by health economists Robert Town and William Vogt that was commissioned by the Robert Wood Johnson Foundation (RWJF) (Vogt and Town, 2006). Town and Vogt reviewed 87 papers that analyzed the relationship between hospital
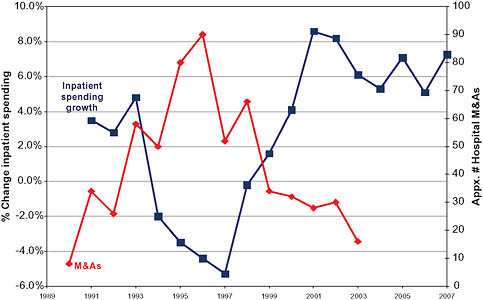
FIGURE 5-3 Inpatient spending growth and hospital merger and acquisition activity.
consolidation and concentration on the one hand and costs, quality, and pricing on the other.
Cost Effects
Most studies of the cost effects of hospital consolidation find small effects for most mergers and acquisitions. For example, Dranove and Lindrooth (2003) conclude that there are, at most, modest cost savings from system acquisitions in which hospitals simply combine ownership but do not combine licenses (Dranove and Lindrooth, 2003). They do, however, find that full mergers that involve combined licenses and service integration and consolidation can produce cost savings on the order of 14 percent. However, such full mergers are not the norm and can be difficult to successfully execute.2
Overall, Town and Vogt’s conclusion from their survey of the cost literature is as follows: “[t]he balance of the evidence indicates that hospital consolidation produces some cost savings and that these cost savings can be significant when hospitals consolidate their services more fully.”
Quality Effects
Hospital consolidation may also affect quality. The majority of studies to date, however, conclude that hospital mergers and acquisitions have either no effect or a modest negative effect on quality, with the former finding being the more common. Town and Vogt (2006) report that “[t]he findings from this literature [on quality effects] run the gamut of possible results. Of the 10 studies reviewed, five find that concentration reduces quality for at least some procedures, four papers find quality increases for at least some procedures, and three studies find no effect.”
Price Effects
Studies of pricing have yielded more definitive results. There is substantial evidence that hospitals compete within a fairly narrow geographic area, often smaller than a city or an MSA. Mergers within such a narrow area can lead to substantial price increases (Capps and Dranove, 2004; Capps,
Dranove, and Satterthwaite, 2003; Dafny, 2009; Dranove and Ludwick, 1999; Gaynor and Vogt, 2003; Keeler, Melnick, and Zwanziger, 1999; Town and Vistnes, 2001; Vogt and Town, 2006; Vita and Sacher, 2001). Increases are most likely if the consolidation combines hospitals that, from the perspectives of insurers assembling provider networks, are close substitutes.
A significant portion of the research focused on the connection between hospital concentration, typically measured by the Herfindahl-Hirschman Index (HHI), and hospital prices. The HHI is calculated by summing the squared market shares of the hospitals in a given market and multiplying the resulting figure by 10,000, with a value of 10,000 corresponding to perfect monopoly.3 Because the HHI is based on market shares, calculation of an HHI requires first defining the market within which to compute shares.
Defining the area within which to analyze concentration and compute HHIs has played a crucial role in litigated hospital merger cases. The Federal Trade Commission (FTC) or Department of Justice (DOJ) typically alleges a relatively narrow geographic market, which tends to indicate that market shares and the HHI are high. The merging hospitals typically contend that the relevant geographic market is large and includes many hospitals, yielding low market shares and low HHIs. During the 1990s, as described below, courts overwhelmingly sided with the merging hospitals.
Subsequent research has shown that hospitals generally compete locally and that hospital mergers—even those that have very small effects on MSA-level or multicounty HHIs—can lead to large price increases (Capps and Dranove, 2004; Dafny, 2009; FTC, 2005). This indicates that the MSA and other broad regions are unlikely to generally correspond to the relevant antitrust markets in which hospitals compete.
However, formal antitrust market definition is a lengthy and fact-intensive process that proceeds on a market-by-market basis. For the purpose of reviewing nationwide consolidation trends and estimating approximate effects on pricing, this is both impractical and unnecessary. Prior studies defining markets based on counties, healthcare referral regions, health service areas, or MSAs have shown the HHI to be a useful predictor of prices. Based on their review of such studies, Town and Vogt (2006) concluded that an 800-point increase in HHI within an MSA led to an aver-
age price increase of roughly 5 percent (Vogt and Town, 2006).4 To put it differently, each 160-point increase in the HHI leads, on average, to prices increases of about 1 percent. The analysis below follows this literature and analyzes hospital concentration at the MSA level.
Antitrust Enforcement and Hospital Mergers
Given this evidence of price effects resulting from hospital mergers, it is natural to inquire about antitrust policy and enforcement. During the 1980s and through 1993, the DOJ and FTC usually won when they went to court to block a hospital merger.5 That success, however, came to an end during the hospital consolidation wave of the 1990s (Table 5-1). From 1993 through 1998, the FTC and DOJ lost six consecutive hospital merger challenges; in 2001, the State of California lost a seventh. In the decade after the last of these losses, 1998 to 2008, neither the FTC nor DOJ challenged a prospective hospital merger in court.6 Over the 15 years spanning 1993-2008, antitrust policy likely had little restraining effect on hospital mergers over this period.
Hospital Consolidation and Likely Price Effects
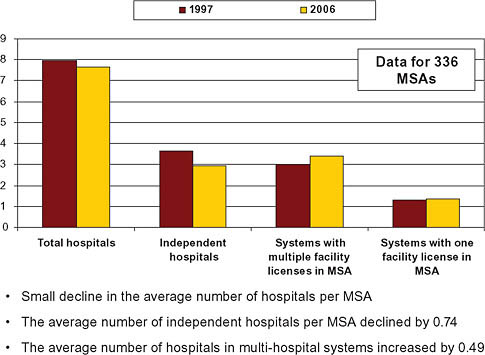
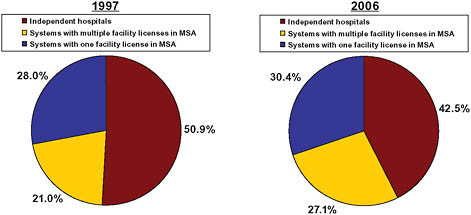
From 1997 to 2006, the average number of hospitals per MSA declined only slightly (American Hospital Association, 1997, 2006). The landscape of hospital ownership, however, changed significantly over this period as a result of consolidation. Primarily as a result of mergers and acquisitions, the average number of independent hospitals per MSA declined by 0.3 percent, from 7.95 to 7.65, while the number of hospitals in multihospital systems in the average MSA increased 0.4 percent, from 3 percent to 3.4 percent (American Hospital Association, 1997, 2006) (Figure 5-4).
In terms of capacity (hospital beds), the shift was more pronounced. The share of beds sited at independent hospitals declined from 51 percent to 42.5 percent (American Hospital Association, 1997, 2006) (Figure 5-5). The share of beds controlled by multihospital systems with multiple loca-
|
4 |
In a market in which five hospitals had equal shares, a merger between two of them increased the HHI by 800 points and resulted in a 5 percent price increase. An HHI of 2,000 corresponds to five firms with equal shares: HHI = 10,000*(.22 + .22 + .22 + .22 + .22) = 2,000. If two of these hospitals merge, resulting in one firm with 40% and three with 20 percent, then the HHI would increase to 2,800: HH I= 10,000*(.42 + 22 + .22 + .22) = 2,800. |
|
5 |
The DOJ lost one hospital merger case in the 1980s, in Roanoke, Virginia. |
|
6 |
In 2004, the FTC challenged a consummated merger between Evanston Northwestern Healthcare (ENH) and Highland Park Hospital, both located in a northern suburb of Chicago, Illinois. The administrative law judge in that case found for the Commission and ordered divestiture. On appeal, however, the Commission instead imposed a conduct remedy that required ENH and Highland Park to bargain separately with insurers. See http://www.ftc.gov/os/adjpro/d9315/index.shtm. |
TABLE 5-1 Hospital Merger Casesa
|
Year |
Merging Party |
Location |
Merger Blocked? |
|
1989 |
Rockford Memorial Hospital |
Rockford, IL |
Yes |
|
1994 |
Ukiah Adventist Hospital |
Ukiah, CA |
No |
|
1995 |
Freeman Hospital |
Joplin, MO |
No |
|
1995 |
Mercy Health Services |
Dubuque, IA |
No |
|
1996 |
Butterworth Health Corp. |
Grand Rapids, MI |
No |
|
1997 |
Long Island Jewish Medical Center |
New Hyde Park, NY |
No |
|
1998 |
Tenet Healthcare Corp. |
Poplar Bluff, MO |
No |
|
2000 |
Sutter Health System |
Oakland, CA |
No |
|
2004 |
Evanston Northwestern Healthcare |
Evanston, IL |
N/A |
|
2008 |
Inova Health System |
Manassas, VA |
Yes |
|
aUnited States v. Rockford Mem. Hosp., 717 F.Supp. 1251 (N.D. Ill. 1989), aff’d, 898 F.2d 1278 (7th Cir.), cert. denied, 498 US 920 (1990); Ukiah Adventist Hospital v. FTC, No. 93-70387 (9th Cir. May 18, 1994); FTC v. Freeman Hospital, 911 F.Supp. 1213 (W.D. MO. 1995), aff’d 69 F.3d 260 (8th Cir. 1995); United States v. Mercy Health Services, 902 F.Supp. 968 (N.D. Iowa 1995), vacated as moot, 107 F.3d 632 (8th Cir. 1997); FTC v. Butterworth Health Corp., 946 F.Supp. 1285 (W.D. Mich. 1996), aff’d per curiam, No. 96-2440 (6th Cir. July 8, 1997) (unpublished); United States v Long Island Jewish Medical Center, 983 F.Supp. 121 (E.D.N.Y. 1997); FTC v. Tenet Healthcare Corp., 17 F.Supp. 2d 937, 943 (E.D. Mo. 1998), rev’d 186 F.3d 1045 (8th Cir. 1999); California v. Sutter Health Sys., 84 F. Supp. 2d 1057 (N.D. Cal.), aff’d mem., 2000-1 Trade Cas. (CCH) U 87,665 (9th Cir. 2000), revised, 130 F. Supp. 2d 1109 (N.D. Cal. 2001); Final Order, In re Evanston Northwestern Healthcare Corp., No. 9315 (Federal Trade Commission Apr. 24, 2008), http://ftc.gov/os/adjpro/d9315/080424finalorder.pdf; and Complaint, In re Inova Health Sys. Found., No. 9326 (Federal Trade Commission May 8, 2008), http://www.ftc.gov/os/adjpro/d9326/080509admincomplaint.pdf. |
|||
tions within an MSA increased from 21 percent to 27 percent of beds (American Hospital Association, 1997, 2006).
By the standards outlined by the DOJ and FTC in the Horizontal Merger Guidelines, most MSAs were already highly concentrated by 1997, when the simple average HHI within an MSA was over 4,000.7 By 2006, the average HHI rose an additional 299 points. Weighting MSAs by admissions, the average 1997 HHI was still over 2,000 and rose by 253 points by 2006 (Figure 5-6).
Based on the Town and Vogt (2006) conclusion that prices increase by 1 percent per 160-point increase in HHI, hospital consolidation between 1997 and 2006 likely resulted in a 1.9 percent increase in hospital prices across MSAs and an average 1.6 percent price increase across patients.8
|
7 |
The antitrust agencies define markets with HHIs above 1,800 as “highly concentrated.” U.S. Department of Justice and Federal Trade Commission, Horizontal Merger Guidelines, http://www.usdoj.gov/atr/public/guidelines/horiz_book/15.html. |
|
8 |
An increase in concentration in a larger MSA will affect more patients than a similar increase in a smaller MSA. The effect for the average patient, across MSAs, is computed by |
That estimate accounts only for price changes driven by merger activity from 1997-2006, and thus does not capture the effects of the pre-1997 hospital mergers. A simple counterfactual scenario provides a conservative estimate of the approximate magnitude of the cumulative effects of hospital consolidation on prices. In particular, suppose that all MSAs that could be “unconcentrated” in 2006 were in fact unconcentrated.9 This exercise effectively “unconsolidates” the MSAs that saw substantial consolidation and then estimates the resulting change in price.10
This counterfactual scenario indicates that, in an unconsolidated world, hospital prices (to private payers) would be about 8 percent lower on average in these MSAs. The hospital prices faced by the average patient, computed by weighting by MSA admissions, would be about 6 percent lower.
Hospital Consolidation and Healthcare Expenditures
Within the set of 94 MSAs for which (1) hospital ownership is concentrated, and (2) the population is large enough to support multiple independent hospitals (i.e., the MSA could in principle be unconcentrated), privately insured patients and their insurers pay about 6 percent more than they otherwise would. These 94 concentrated MSAs account for 60 percent of admissions among all MSAs, and about 85 percent of all admissions are to hospitals in an MSA. Thus, roughly half (0.85*0.60) of privately insured patients are paying 6 percent more than they would absent hospital consolidation. This indicates that nationwide payments to hospitals on behalf of the privately insured are about 3 percent higher than they would be absent hospital consolidation. Payments to hospitals by private insurers represent about 13 to 14 percent of total U.S. expenditures on health care.
In combination, these statistics indicate that total national healthcare expenditures are roughly 0.4 to 0.5 percent higher ($10 billion to $12 billion in annual expenditures) than they would be absent the price increases resulting from hospital consolidation.
|
taking the admission-weighted average of HHIs. That the weighted average change is smaller than the unweighted average change indicates that concentration increased somewhat more in smaller MSAs. |
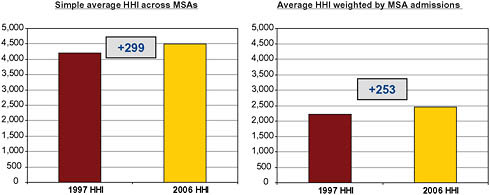
FIGURE 5-6 Metropolitan Statistical Area (MSA)-Level Herfindahl-Hirschman Indices (HHI), 1997 and 2006.
Caveats and Limitations
This is a rough but reasonable approximation that is consistent with other research. For example, Town and colleagues (2006) found that “the aggregate magnitude of the impact of hospital mergers [from 1990 to 2003] is modest but not trivial. In 2001, average health maintenance organizations’ (HMOs’) premiums are estimated to be 3.2 percent higher than they would have been absent any hospital merger activity during the 1990s.”
Another noteworthy fact is that the degree of hospital ownership consolidation, and thus the likely average price effect, is not evenly distributed across the country. The data show a mix of highly concentrated MSAs and unconcentrated MSAs, and a correspondingly high variation in price effects is likely.
One significant caveat is that the analysis above assumes that inpatient and outpatient hospital prices move together, even though competitive conditions in the outpatient market may differ as a result of the presence of additional competitors, such as ambulatory surgery centers, that are not readily observable in public data sources.
Additionally, this analysis identifies only the direct price effect of hospital consolidation, and there may be other significant effects. For example, consolidation may enable hospitals to resist tiering, steering, and use management, thereby increasing expenditures by increasing use (this would magnify the effects of price increases). Reduced hospital competition may weaken incentives to operate efficiently, and this would increase expenditures by all payers, including Medicare and Medicaid. Moreover, this analysis makes no effort to estimate the effects on national health expenditures of any costs related to reduced insurance uptake as a result of higher hospital prices.
Physician practices also consolidated during the 1990s and 2000s, but detailed data on this subject are not readily available. Physician and clinic expenditures are approximately 70 percent of hospital expenditures, so this consolidation could affect another 9 percent to 10 percent of total healthcare spending. If the relationship between price and concentration in physician practices parallels the one for hospitals (see Figure 5-2, which shows that physician and hospital price growth track reasonably closely over time), then physician practice consolidation could account for an additional 0.25 percent to 0.40 percent increase in U.S. healthcare expenditures, but this estimate is highly speculative.
Finally, and importantly, this analysis speaks only to broad averages and general trends and does not indicate that any specific hospital consolidation is (or is not) likely to result in higher or lower prices.
PRESCRIPTION DRUG PRICES
Jack Hoadley, Ph.D.
Georgetown University
Addressing cost savings that might be achieved from lower drug prices is challenging in a marketplace where pricing varies substantially by payer and by whether drugs are under patent protection. Recent price trends have been substantially influenced by the market entry of new generic competition. The global nature of the prescription drug marketplace also differentiates it from other healthcare sectors; despite that, U.S. drug prices vary widely from those in other countries. The impact of efforts to lower prices must be measured against the potential impact on research and development.
Pricing Across the Prescription Drug Marketplace
In the United States, prescription drugs are priced differently for different pharmaceutical market segments and different payers. First, drugs that are under patent protection with only a single manufacturer (i.e., single-source drugs) are priced differently than those without patent protection where two or more manufacturers compete. Second, pricing operates differently within the U.S. market among private health plans (including those that deliver the Medicare Part D drug benefit), state Medicaid programs, federal programs (such as the Department of Veterans Affairs), and the cash retail market for consumers without insurance coverage. Finally, drugs that are administered by a physician (such as by injection or infusion) or provided in an institution (hospital or nursing home) are handled differently by most payers than outpatient prescription drugs obtained by the patient from a retail or mail-order pharmacy.
Pricing for Private Health Plans
By 2006, 89 percent of retail prescription drug purchases in the United States involved third-party payment by private payers (including Medicare drug plans) at the point of sale; about 1 percent of transactions were handled by Medicaid programs (Figure 5-7) (IMS Health, 2006). The remaining 10 percent of purchases were made by cash customers, mostly individuals without any insurance coverage for their drugs. Notably, as recently as 1990, the cash market had been dominant. Drug coverage was less common, and many with coverage bought drugs at full retail prices and then filed receipts for reimbursement.
Single-source brand-name drugs Typically drug purchases for those with private insurance are managed by a pharmacy benefit manager (PBM) under contract to health plans or private insurers. Two factors have a significant influence over the pricing of single-source brand-name drugs under private drug coverage. First, most drugs require a prescription from a physician who often does not take into account the drug’s cost or its status on a health plan’s formulary (list of covered drugs). Second, U.S. pharmacists generally lack the legal authority to change a prescription in order to dispense
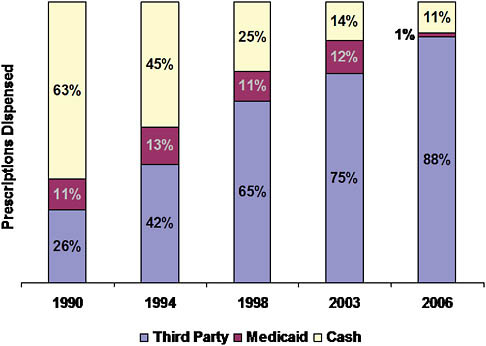
FIGURE 5-7 Shift of drugs to third-party payment, 1990-2006.
a therapeutically similar product, although they typically can substitute a therapeutically equivalent generic drug.
The combination of physician control of prescribing with claim adjudication by PBMs at the point of sale has implications for price setting. Drug price negotiations are based primarily on shifts in market share among competing medications in a particular class of drugs. The PBM uses a variety of tools to move market share in negotiating lower prices. The most common tools are formularies combined with tiered cost sharing and use management measures such as prior authorization.
The actual mechanics of pricing are complex (Figure 5-8) (CBO, 2007). Because the PBM does not take possession of the drug in most cases (mail order being the primary exception), negotiated discounts that result from formulary placement are not reflected in the price paid at the retail pharmacy. Instead, the PBM negotiates both a payment to the pharmacy and a rebate payment from the manufacturer. The PBM normally establishes the retail pharmacy price as a formula that combines a measure of the ingredient cost with a dispensing fee. The ingredient cost is typically based on the list price minus a certain percentage (such as 15 percent). The dispensing fee
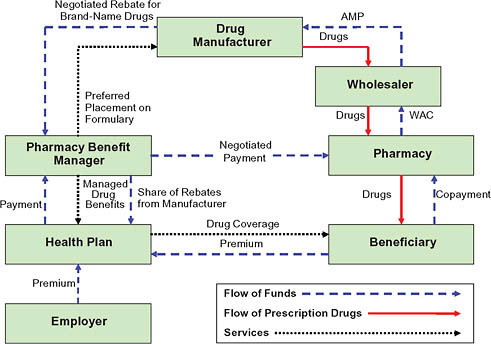
FIGURE 5-8 Flow of funds for a brand-name drug.
NOTES: AMP = average manufacturer price; WAC = wholesale acquisition cost.
SOURCE: CBO, 2007.
covers some of the fixed costs involved in filling a prescription and may be negotiated differently across pharmacies. In negotiating the manufacturer rebate, the PBM uses its size and its tools to shift use toward a particular drug to obtain a favorable price. The rebate provides the mechanism for lowering the effective price in a system where the PBM never owns the product. Rebate amounts are viewed as proprietary, but estimates generally place average rebates for individual drugs around 8 percent, ranging from nothing to 35 percent depending on the individual drug (Figure 5-9).
Multiple-source drugs Negotiating leverage for multiple-source drugs (usually generics) is substantially different than for single-source drugs, because the pharmacy can switch from one manufacturer’s version of the drug to another without getting a new prescription from the physician. The pharmacy’s leverage also stems from the large number of manufacturers that often sell therapeutically equivalent versions of a given drug. By
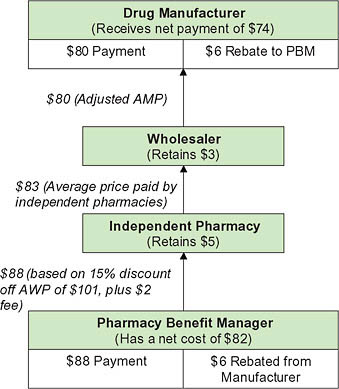
FIGURE 5-9 Pricing for a brand-name drug.
NOTE: AMP = average manufacturer price; AWP = average wholesale price; PBM= pharmacy benefit manager.
SOURCE: CBO, 2007.
contrast, PBMs have no ability to specify which version of a drug they pay for (except when using mail order), because it does not actually purchase the drugs. As a result, only pharmacies (or wholesalers) can negotiate with manufacturers on generic pricing.
Pricing for Medicaid Programs
As in the private sector, Medicaid prices have two components. One is the payment to the retail pharmacy that actually provides the drug to the beneficiary; it includes both an acquisition cost and a dispensing fee. The other is a rebate set in federal law and collected from drug manufacturers on each drug purchase (CBO, 2004).
According to federal law, the first component is based on the state’s estimate of the pharmacy’s cost of acquiring a drug from the manufacturer. For single-source drugs (brand-name drugs without generic equivalents), this estimate is typically based on 85 to 90 percent of the average wholesale price. For multiple-source drugs (with generic competitors), the state payment is based on the federal upper limit, calculated as 250 percent of the lowest average manufacturer price.11 A dispensing fee, typically between $3 and $5, is added to these amounts.
For drugs sold by the original manufacturer, the rebate must equal the difference between the average manufacturer price—the average paid by wholesalers—and the manufacturer’s “best price” offered to any purchaser, excluding federal and certain other purchasers. The minimum basic rebate is 15.1 percent of the average manufacturer price. For noninnovator multiple-source drugs, the rebate is 11 percent of the average manufacturer price; the best price concept does not apply. Manufacturers pay an additional rebate for innovator drugs when the price rises more rapidly than inflation. According to the Congressional Budget Office (CBO), the average Medicaid rebate for brand-name drugs in 2003 was about 35 percent of the average manufacturer price (CBO, 2005). About 35 states negotiate with manufacturers for additional discounts, or supplemental rebates, based on the placement of drugs on a preferred drug list.
Pricing for Federal Programs
The federal government directly purchases drugs for health benefits provided by the Departments of Veterans Affairs (VA) and Defense (DoD) and for various facilities operated by the Department of Health and Human
Services (HHS). HHS also makes a discounted price available to certain safety net healthcare providers. Together, drugs purchased through these programs represent between 4 percent and 5 percent of all drug purchases in the United States (Hoadley, 2007).
All federal agencies can use the federal supply schedule prices on pharmaceutical products; in addition, manufacturers must also sell covered drugs to the “Big Four” agencies (VA, DoD, the Public Health Service, and the Coast Guard) at no more than 76 percent of the price paid by drug wholesalers. Some agencies also use negotiations and competitive bidding to obtain additional discounts. For example, the VA lists certain drugs on its national formulary and commits to their use throughout its system. Drugs acquired through a national contract may be 10 to 60 percent cheaper than the federal supply schedule price. Analysis by the CBO shows that prices obtained by the agencies are between 65 percent and 84 percent of the best private-sector prices, as measured by prices reported to the government for use in Medicaid rebate calculations (Table 5-2) (CBO, 2005).
Pricing for Specialty Drugs
Specialty drugs include biological agents, injectable drugs (whether or not they require physician administration), or other expensive drugs used for specific therapeutic purposes such as treating cancer, HIV, or kidney failure. According to one private pharmacy benefit manager, specialty drugs accounted for about 13 percent of total pharmacy spending in 2008 (MedCo Health, 2009). These drugs are often dispensed by specialty pharmacies that may negotiate directly with manufacturers and may administer specialty programs to manage their use. Frequently, they are purchased by physicians
TABLE 5-2 Relative Prices for Federal Purchasers
and reimbursed through medical insurance rather than through a prescription drug benefit. As a result, factors influencing pricing are substantially different than for drugs purchased directly by patients.
Trends in Drug Spending and Prices
According to government estimates, drug spending growth in the United States in 2007 achieved a 45-year low at 4.9 percent (Hartman et al., 2009). Annual growth rates earlier in the decade were in double digits (Figure 5-10). A key factor is lower price growth, only 1.4 percent in 2007 compared to 3.5 percent in the 2 previous years. The price slowdown in turn has been influenced by higher rates of dispensing generic drugs. Other factors include growing consumer safety concerns and effects of the recession, both of which lead some to stop taking certain drugs or switch to cheaper alternatives. Government actuaries expect a rebound over the next several years especially as the economy improves.
The overall price trend masks significant differences for brands, generics, and specialty drugs. According to one recent study, overall prices rose 4.5 percent in 2008, but prices for single-source brand-name drugs and specialty drugs rose much faster (8.7 percent and 9.3 percent, respectively). At the same time, generic drug prices fell by 10.6 percent (MedCo Health, 2009; Purvis, 2009).
Overall, 67 percent of all prescriptions were dispensed as generics in 2007, up from 60 percent in 2005. Although use of stronger incentives from insurers probably influenced this shift, the major reason was the market entry of generic versions of many popular drugs—a trend that will
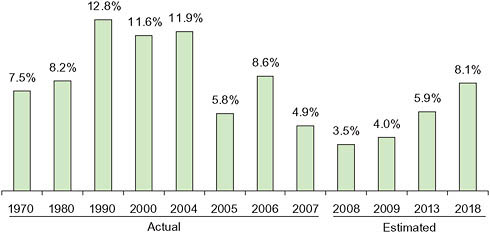
FIGURE 5-10 Average annual growth rates, prescription drug spending.
continue for several years. Nearly all the most popular brands from the middle of this decade have already lost patent protection or will do so in the next 5 years. At the same time, most new brand-name drugs have been for medical conditions with relatively low prevalence and thus add little to spending growth. Future trends in drug spending and prices will be heavily influenced by the pharmaceutical pipeline. Should important new drugs for common health conditions be approved, both prices and spending will rise accordingly. If growth in market approval and prescribing for specialty drugs continues high, these expensive drugs will be a key driver of future growth of overall drug spending.
A comparison with other nations reinforces popular perceptions that brand-name drugs are more expensive in the United States. U.S. prices are roughly double of those in Australia, Canada, France, and the United Kingdom. The United States fares far better in generic drug pricing, however, with prices 10 percent to 65 percent below those in the same four countries (Paris and Docteur, 2006). Factors explaining these wide price ranges include considerable differences in the role of government; the mechanics of prescribing, dispensing, and insuring drugs; and variations in physician prescribing practices.
Are Drug Prices Too High?
Potential for Price Reduction Is Unclear
Pharmaceutical spending is driven not only by prices, but also by physicians’ prescribing decisions and patients’ decisions whether to comply with their prescriptions. While physician prescribing varies as do other healthcare services, patients have unusual control since they must decide to fill each prescription, usually on an ongoing basis. Furthermore, there is considerable literature suggesting that coverage and cost sharing policies by health plans influence both compliance and decisions on whether to use a generic drug or a drug that is preferred on the formulary (Joyce et al., 2002). Furthermore, as discussed here, pharmaceutical pricing is complicated by unclear pathways between manufacturer and consumer and the segmentation of the market into numerous private and public purchasers.
Drug prices are a key contributor to spending levels and vary widely across different sectors and payers. For most drugs, the manufacturing cost may be small (although higher for many specialty drugs), but they must capture the costs of research and development and moving the drug through the approval process (including costs for unsuccessful products). Research costs are mostly recouped during a medication’s period of patent protection, after which generic market entry lowers prices substantially. In addition, more so than other health services, drugs operate in a global
market with multinational firms selling all over the world. As noted above, prices vary widely across countries with some ability for cost shifting across borders.
There is no simple answer to whether drug prices are too high or whether any pharmaceutical market sectors come close to achieving optimal prices. U.S. prices for brand-name drugs are much higher than in other countries. Launch prices for new drugs appear high and often unrelated to the effectiveness of the new drug compared to others on the market. And again, the complex and often nontransparent relationship between manufacturer and purchaser further suggests some room for price reduction. At the same time, U.S. generic drug prices are lower than in other countries and have not been rising rapidly (even falling by some calculations). Determining the “right” price is difficult, especially since it is so unclear what is needed to support continuing research into new drugs.
Even So, Price Reductions May Yield Billions in Savings per Year
Taking the indications that there are windows of opportunity for cost savings, estimates of the potential savings from lower drug prices can be addressed in two ways.
Reduce pricing of single-source drugs First, what if prices for brand-name drugs that are still patent protected could be reduced? The CBO has estimated that reducing the price of brand-name drugs for the Medicare Part D by requiring manufacturers to pay a minimum 15 percent rebate (comparable to that used in Medicaid) would yield $110 billion (about $10 billion annually once implemented) in savings over 10 years (2010-2019) (CBO, 2009). Because this policy option excludes the Medicaid provision increasing rebates when private-sector purchasers obtain a better price, CBO argues this change would have minimal effect on private-sector prices. In looking at systemwide savings from lower prices, a ballpark estimate suggests that a 5 percent reduction in the price of brand-name drugs across all payers except those government payers already obtaining deep discounts would yield about $9 billion in annual savings. A 20 percent reduction would yield about $36 billion annually.
Shift to more use of generic drugs Second, the effective average price for drugs overall is reduced to the extent the market shifts from brand drugs to generics when popular drugs lose patent protection. Due to lower prices, incentives imposed by payers, and rules allowing automatic substitution of a therapeutically equivalent generic at the pharmacy, about 90 percent of a drug’s use is switched to the generic version within about 6 months of market approval. But that switching rate may fail if manufacturers succeed
in shifting market share to a related medication in the same drug class. Furthermore, market entry of a new generic often has only a modest impact on the price and market share of other products in the same drug class. According to an industry estimate, a 3 percent increase in generic substitution would yield $10.5 billion in annual savings.12 This type of increase could presumably be accomplished by policies to shift use in drug classes where available generics were viewed as equally effective alternatives to competitors still having patent protection (CBO, 2009).
A related source of savings would be to increase the availability of generics for specialty drugs (sometimes called follow-on biologics). Doing so would require legislation to create a new approval pathway for the Food and Drug Administration, as well as payment policy changes to encourage Medicare or Medicaid savings from adoption of newly approved products (and presumably parallel policy changes by private payers). These policy changes would have to be accompanied by acceptance of new products by both physicians and patients before widespread use—and thus savings—could occur. The CBO has suggested that these policy changes could generate $13 billion in federal savings over 10 years. Similar savings might be possible in the private sector (CBO, 2009; MedPAC, 2009).
Caveats and Assumptions
Several caveats and assumptions are important to note. First, no obvious standard for an optimal price is available. The savings estimates presented here are illustrative of the savings that might be possible if lower prices for brand-name drugs were achieved for the largest segment of the U.S. market: those with private drug coverage, including those enrolled in Medicare drug plans. System savings will not be achieved, however, if lower prices in one market segment lead to higher prices elsewhere. Second, no attempt has been made in this essay to assess the impact of lower prices on new drug research and development or the impact of lower U.S. prices on prices charged to consumers in other countries by multinational manufacturers. Third, studies are not available to estimate the share of drug use in various drug classes that might be switched to competing generics, and thus the estimate here is also illustrative. As they become available, comparative effectiveness studies will offer better information on which drug substitutions are clinically appropriate.
DURABLE MEDICAL EQUIPMENT PRICES
Thomas J. Hoerger, Ph.D.
RTI International
Durable medical equipment (DME) is defined in the National Health Expenditures Accounts as “retail sales of items such as contact lenses, eyeglasses, and other ophthalmic products; surgical and orthopedic products; hearing aids; wheelchairs; and medical equipment rentals” (CMS, 2009a). Overall, this category accounted for about $24.5 billion in expenditures in 2007, or 1.1 percent of national health expenditures (CMS, 2009c).
For the purpose of this article, eye care and hearing aids—products with relatively little insurance coverage that are purchased in reasonably competitive markets—are considered to be separate from the remaining DME products that have more extensive insurance coverage. This article focuses on the latter group—which includes oxygen equipment, wheelchairs, diabetes test strips, and hospital beds used in the home—because these products are likely to have prices that are too high. This group of products is also representative of similar products in other expenditure categories that have a large physical component and share the following characteristics: rapidly evolving technology, important health benefits when used appropriately, a bundled labor component for delivery and servicing, and rising expenditures.
Conceptually, DME prices are likely to be too high—relative to the prices that would occur in a perfectly competitive market—for two reasons. First, patients are relatively insensitive to price because they have insurance and pay only a portion of the price of an item. In addition, patients often have pressing medical needs for the equipment. For example, in order to be discharged from the hospital, patients may need to have oxygen equipment or wheelchairs at home. In this situation, patients may not worry much about the price of the equipment, particularly if Medicare or an insurer is paying for most of the cost.
Second, Medicare uses an administered fee schedule to determine the prices it pays for DME. The fee schedule is based on prices that were in effect in 1986, with periodic updates for inflation and occasional ad hoc reductions in prices for items that were deemed overpriced. Although an administered fee schedule solves the problem of how much to pay for insured goods and services, it may not be very responsive to the usual market dynamics of technological change and entry and exit. In a competitive market, technological improvements that lower production costs lead to lower prices. With an administered fee schedule, there is no automatic signal that production costs have fallen, and the fee schedule will adjust slowly, if at all. In a competitive market, if prices are high enough to lead to economic
profits, more firms enter the market, driving prices down. High prices and profits will also attract entry under an administered fee schedule, but the entry will have no effect on prices. As a result, excessive entry may occur until no firms earn profits.
Evidence of Excessive Costs
Two major sources of evidence indicate that Medicare does pay too much for DME: (1) price studies by the HHS Office of Inspector General (OIG) and the Government Accountability Office (GAO), and (2) the results from Medicare’s experience with competitive bidding.
Price Studies
Because of concerns that Medicare’s fee schedule leads to prices that are too high, the OIG and the GAO periodically conduct studies comparing Medicare fees to the prices for DME charged to other healthcare providers. Past studies focused on oxygen equipment, manual and power wheelchairs, inhalation drugs, hospital beds, and diabetes testing equipment, among other DME. Most of these studies concluded that Medicare pays more than it should. However, comparisons between Medicare fees and other prices are not always straightforward because suppliers are reluctant to divulge price information, list prices may conceal discounts and rebates, and Medicare fees may cover services and administrative costs that are not included in prices to other payers. Consequently, supplier groups have typically criticized the OIG and GAO findings.
Two relatively recent OIG studies address some of the suppliers’ concerns and take advantage of the growing availability of price information on the Internet. In a 2004 study of power wheelchairs, OIG compared the 2003 Medicare fee with the median prices offered to patients on supplier Web sites (Figure 5-11) (Department of Health and Human Services, 2004a). The study also collected more limited data on wholesale prices for the equipment and the negotiated prices actually paid by suppliers to manufacturers after accounting for discounts and rebates. The Medicare fee exceeded supplier Web site prices by 37 percent and was more than double the wholesaler and negotiated supplier prices.
In a 2006 study, OIG compared Medicare monthly payments for oxygen concentrators—a 50-pound piece of equipment that concentrates oxygen from the air in a room in the home—with suppliers’ costs of acquiring concentrators (Department of Health and Human Services, 2006). Medicare allowed charges for concentrators accounted for $2.3 billion in 2004—more than Medicare paid for any other DME item. Currently, Medicare pays a monthly rental rate for providing oxygen equipment, with rental
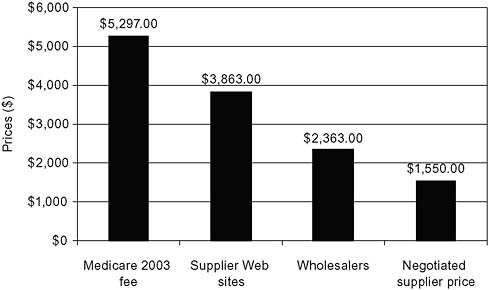
FIGURE 5-11 Excess costs: Power wheelchairs.
SOURCE: Department of Health and Human Services, 2004a.
payments limited (effective in 2006) to 36 months. In 2006, the median monthly reimbursement rate was $200.41. The OIG found that suppliers paid, on average, $587 to purchase a concentrator, a total that does not include supplier costs of servicing beneficiaries. However, the OIG examined service costs and concluded that minimal servicing and maintenance are required for concentrators and portable oxygen equipment. For those beneficiaries who received concentrators for a full 36 months, the OIG noted that Medicare would pay $7,215 for concentrators that cost suppliers $587. The OIG recommended that Congress should further reduce the rental period for concentrators.
Medicare’s Experience with Competitive Bidding
Medicare’s experience with competitive bidding suggests that Medicare fees for DME may be 20 percent too high (Table 5-3). In an effort to bring DME prices more in line with the “true” market price, Medicare conducted two demonstration projects to test whether competitive bidding could reduce program expenditures while maintaining quality and access to services. Products covered included oxygen equipment, hospital beds, enteral nutrition, urological supplies, surgical dressings, manual wheelchairs, general orthotics, and nebulizer inhalation drugs. Suppliers submitted bids on all of the items in a product category and provided quality and
TABLE 5-3 Scale of Excess Costs, Evidence from Medicare Competitive Bidding
|
Site |
Description |
Savings |
|
Polk County, FL |
Demonstration, 1999-2002 |
17.9% |
|
San Antonio, TX |
Demonstration, 2001-2002 |
20.5% |
|
10 metropolitan areas |
Round 1 of national program, 2008 (postponed by Congress) |
26.0% (projected) |
|
SOURCE: CMS, 2009b. |
||
capacity information. Bids were arrayed from lowest to highest, and CMS selected enough quality suppliers to serve the demonstration area. Competitive bidding led to lower prices for most but not all of the items. In these demonstrations, expenditures fell by an estimated 17.9 percent in Polk County, Florida, and by an estimated 20.5 percent in San Antonio, Texas (Hoerger et al., 2003). The evaluation of these projects concluded that the demonstrations had relatively little effect on beneficiary access, quality, and product selection.
Partly as a result of the demonstration projects, Congress mandated a national competitive bidding program for DME as part of the Medicare Modernization Act of 2003. Between 2007 and 2008, bidding was conducted for 10 products in 10 metropolitan areas, winning suppliers were selected, and the new, lower prices based on bidding were scheduled to go into effect on July 1, 2008. Based on these lower prices, CMS projected that the bidding program would lower Medicare spending by 26 percent for the covered goods in the bidding areas (CMS, 2009b). However, just after the prices went into effect and before reimbursement could be made, Congress delayed implementation of the bidding program by 1.5 years as part of the Medicare Improvements for Patients and Providers Act of 2008. The act instead imposed a nationwide 9.5 percent reduction in fees for the products that would have been covered by the program.
Waste and Fraud in DME
Most DME suppliers are honest and provide quality equipment and services. However, the overall sector has seen a number of fraudulent practices; and in some areas, such as South Florida, fraud has been more prevalent. CMS estimates that Medicare overpayments, which do not perfectly correspond to fraudulent payments, were about 10 percent of total payments to DME suppliers in 2006 (CMS, 2007). Fraud would likely occur even in the absence of excessive Medicare fees, but higher fees make fraud more lucrative.
Potential Savings
To estimate the potential savings from DME, the following assumptions were made. First, the base for potential savings is $10.1 billion, the amount Medicare spent on DME and related items in 2007 (the Medicare reimbursement amount in Table IV.B6 of the boards of trustees report [Geithner et al., 2009] adjusted to incorporate beneficiary copayments). Spending on eyeglasses and hearing aids by all payers is excluded because these products are purchased in reasonably competitive markets, and other DME paid for by non-Medicare payers is excluded because data on excess payments and fraud are sparser for these payers. Second, Medicare fees for DME are 20 percent too high, based on Medicare’s experience in receiving fee reductions of 20 percent with competitive bidding. Third, fraudulent payments account for 10 percent of Medicare payments for DME. This assumption is based on the CMS estimate for overpayments and assumes that fraudulent payments are roughly equivalent to estimated overpayments. To avoid double-counting, total payments are first reduced to account for excess fees and then the fraudulent payment rate is applied. Thus,
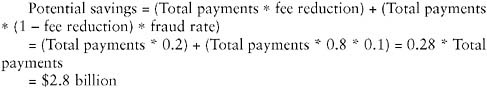
The potential savings of $2.8 billion equals 28 percent of current Medicare payments for DME and converts to 11.5 percent of the $24.5 billion total expenditures on DME and 0.12 percent of the $2,241.2 billion in total national health expenditures in 2007.
Caveats
These estimates carry with them several caveats. First, the assumption of a 20 percent reduction in fees is based on competitive bidding results from the 1999-2002 demonstration projects and the 2008 national program. Such savings may no longer be available because fees were reduced in 2005, subsequent to the demonstration projects, and in July 2008, subsequent to the bidding in the national program. On the other hand, the reduction from the demonstration projects occurred despite a preceding large reduction in the fee schedule in 1998, and the national program reduction occurred despite the preceding general fee reduction in 2005 (Department of Health and Human Services, 2006). Second, the estimates only include potential savings from Medicare. However, this may not be a
major limitation because Medicare is the dominant payer for DME other than eyewear or hearing aids. Third, fee reductions may have relatively little effect on DME use, which has been the primary driver of increased DME expenditures. Fourth, although the estimate suggests that there are substantial potential savings from reducing Medicare fees for DME and eliminating fraud, this does not mean that it will be easy to obtain these savings in practice. Suppliers generally oppose initiatives to reduce Medicare fees, citing potential threats to quality and beneficiary access, and these arguments have sometimes proven persuasive to beneficiaries and legislators. In the case of the national competitive bidding program, suppliers also raised concerns about the bidding process and appeared to prefer a 9.5 percent nationwide fee reduction to the 26 percent reduction in the 10 bidding areas (U.S. Congress, 2008). In addition, mechanisms to reduce fees, such as competitive bidding, may lead to increased administrative costs that partially offset any resulting fee reductions. Efforts to reduce DME fraud may also require greater administrative costs, as current regulations have not been able to stem fraudulent practices.
Conclusion
Evidence from price studies and competitive bidding suggests that Medicare fees for DME may be 20 percent too high. In addition, fraud is relatively common in the DME market. The potential savings from eliminating high prices and fraud represent approximately 28 percent of Medicare payments for DME, 11.5 percent of total DME expenditures, and 0.12 percent of national health expenditures. These percentages provide a useful target for healthcare reform; however, there is no guarantee that the savings can be obtained easily.
MARKET PRICING AND THE MEDICARE PROGRAM
Mark E. Wynn, Ph.D.
Centers for Medicare & Medicaid Services
The series of attempts by the Medicare program to obtain market prices for durable medical equipment over the past several years are instructive about the difficulties of reducing payments in a program operated by the federal government and affecting thousands of suppliers and millions of beneficiaries. In this paper, we will describe attempts to operate bidding programs for Medicare, describe the use of demonstration programs to test public policy innovations, and suggest some alternative methods of obtaining market prices for durable medical equipment.
A Target for Cost Savings
The category of durable medical equipment consists of medical equipment for use in the beneficiary’s home with a useful life of 3 or more years. Examples include wheelchairs, hospital beds, and oxygen concentrator machines. Medicare classifies durable medical equipment with prosthetics, orthotics, and supplies into an overall category with the ungainly acronym of DMEPOS, and generally pays for 80 percent of these items, with the remaining 20 percent copayment the responsibility of the beneficiary or his or her “Medigap” insurer. Medicare pays approximately $10 billion a year for DMEPOS items, about 2 percent of total Medicare spending. If Medicare overpays for DMEPOS by 20 percent to 25 percent, any overpayments would amount to $2 billion or more, but would still be less than 1 percent of Medicare spending or of national healthcare costs. DMEPOS payments may be less important than spending on other types of services, but these overpayments are real money, and there are some important and salient issues in this category of spending since there have been several attempts by Medicare to discover and pay market prices for DMEPOS by using competitive bidding.
Scope of Overpayment
Overpayments for DMEPOS items clearly happen. Places where overpayment takes place are easily determined because of the price transparency available from Internet sales and catalog prices. Also, there have been a series of reports showing excessive Medicare payments for items of DMEPOS, which were written by the HHS OIG. Examples of these reports include
-
A report that Medicare pays about 45 percent more for electric wheelchairs than the prices available on the Internet (Department of Health and Human Services, 2004a).
-
A report showing that Medicare pays about $17,000 for a negative pressure wound therapy pump, which is available to suppliers for $3,600 (Department of Health and Human Services, 2009).
-
A report that Medicare paid 10 percent to 20 percent more than insurers in the Federal Employee Health Benefit Plan for oxygen equipment (Department of Health and Human Services, 2004b).
Sources of Overpayment
Medicare pays these inflated prices using cumbersome and outdated administrative payment schedules required by law. The DMEPOS fee schedules
are based on average payments for these items determined to be reasonable costs in 1986-1987 and updated for inflation using a yearly update factor defined by Congress. New items are frequently added to the fee schedule and paid by using “gap filling” methods to pay reasonable amounts in comparison with other established items. This method to determine the payment amounts is outdated and does not account for the many changes in production methods, product innovations, and market changes in the past two decades. In addition to finding that overall DMEPOS payments are too high, the relative payments for various items are out of relative proportion to the market. Thus, Medicare may be paying market prices for surgical dressings, while greatly overpaying for electric wheelchairs.
A Successful Solution
Faced with these issues, congressional committee staff searched for methods to determine and pay market-based prices. The Balanced Budget Act of 1997 required Medicare to operate a demonstration on competitive bidding for DMEPOS. The Medicare Program has operated a series of demonstrations of program innovations since they were authorized in 1967. Since that time, the program has operated demonstrations to test and evaluate the effects of potential payment and program changes. Examples include the development and implementation of prospective payment systems for hospitals and for skilled nursing facilities, trials of “pay for performance” at hospitals and physician practices, and paying global amounts for acute episodes of hospital care. At any given time, the Medicare Program operates or has in development about 30 demonstrations, most of them required by law.
In the DMEPOS Competitive Bidding Demonstration, Medicare obtained bids in two medium-sized metropolitan statistical areas (MSAs): Polk County, Florida, and San Antonio, Texas. These sites were chosen for their relatively high per capita expenditures, for having a large number of suppliers, and for an MSA size that was regarded as large enough to operate the program but not so large that it would be overwhelming to operate. The product categories that were selected for bidding were oxygen equipment and supplies, hospital beds, surgical dressings, urological supplies, enteral nutrition, manual wheelchairs, nebulizer drugs, and simple orthotics.
Medicare announced five objectives for the DMEPOS bidding demonstration:
-
To use bidding to determine market prices of DMEPOS items;
-
To reduce the amounts paid by Medicare for DMEPOS items, and to reduce the copayment amounts paid by beneficiaries;
-
To assure continued beneficiary access to high-quality DMEPOS items;
-
To test bidding policies and operations in the context of the Medicare program; and
-
To reject suppliers who engage in fraudulent activities.
To support these goals, bid rules were designed to be accessible to smaller suppliers, which make up a large portion of the industry. For example, Medicare chose multiple winners in each product category, thus making it possible to choose smaller suppliers rather than only selecting suppliers that were large enough to service the entire geographic area by themselves. As a result of this and other bidding policies, about 75 percent of the suppliers selected in the demonstration were small businesses, as defined by the Small Business Administration.
A benefit of choosing multiple suppliers is that the firms would continue to compete with each other on the basis of quality. Suppliers with good reputations for quality products and services would be recommended by social workers, hospital discharge planners, and others who make supplier recommendations to beneficiaries and their families, while poor quality suppliers would lose business to firms with better reputations.
According to an independent evaluation by Research Triangle Institute (RTI), the demonstration was a success, with continued beneficiary access to high-quality DMEPOS items. As a result of the competitive bidding process, Medicare achieved savings of 19.1 percent as compared with the normal fee schedule over the three bids (Hoerger et al., 2003). Also, the operating costs of the demonstration were much lower than payment reductions, thus yielding net savings to the Medicare program (Hoerger et al., 2003).
Replicating the Successful Demonstration
Based on the positive results of the bidding demonstration, Congress passed a bill establishing a national program of competitive bidding for DMEPOS items. The law required CMS to implement bidding in 10 large metropolitan areas in 2008, and then implement bidding in 70 more MSAs 2 years later. Implementing these requirements, CMS selected and held bids in Cincinnati, Cleveland, Charlotte (North Carolina), Dallas-Fort Worth, Kansas City (Missouri and Kansas), Miami-Fort Lauderdale, Orlando, Pittsburgh, Riverside (California), and Puerto Rico. The items that were chosen for bidding included many of the same items that were selected for the demonstration plus some others: oxygen supplies and equipment, standard power wheelchairs, complex rehabilitative power wheelchairs, diabetic supplies, enteral nutrients, hospital beds, walkers, mattress support surfaces, and continuous positive airway pressure (CPAP) machines for sleep apnea. The bidding was again successful, with price reductions of 26 percent compared with the fee schedules, and CMS selected a total of 329 bidders across the bidding sites. However, the bidding was controver-
sial, and Congress agreed with supplier industry groups to delay the bid program for 18 months, and to require rebids (CMS, 2008).
Lessons Learned
Based on experiences of the bidding demonstrations and projects, items and services with the following types of characteristics appear best suited for bidding:
-
Items and products with lower levels of professional services. Thus, hospital beds appear well suited, while professional services such as evaluation and management visits by physicians are not as well suited.
-
Well-defined physical products, including most DMEPOS items.
-
Items and products with surplus capacity in the marketplace, or with easy entry into the marketplace, which would include most DMEPOS items.
-
Items with a large number of potential bidders.
-
Items that have excessive payment amounts, showing evidence that savings can readily be obtained. As noted above, there are many reports showing that Medicare is paying too much for DMEPOS items.
Even with these “lessons learned” in mind, there may be even broader opportunities for competitive bidding given the right structures. CMS has engaged in seeking bids for hospital acute care services in the Acute Care Episode (ACE) Demonstration, and sought bids for managed care in a few separate demonstrations. Although these bids entailed highly professional and skilled services, the bidding was made possible by bidding for Diagnosis Related Groups (DRGs), or for an adjusted per member per month (PMPM) amount, thus reducing the thousands of possible diagnoses and treatments into a manageable and well-defined number of products for bidding.
Great Solution, Even Greater Challenges
The Medicare program has had a difficult history of operating bidding demonstrations. For example, as noted above, the DMEPOS bidding program was delayed for 18 months.
With the DMEPOS bidding program, Congress also required CMS to operate a demonstration of bidding for clinical laboratory services. This demonstration was implemented in San Diego, California, and bidding was held in 2008. The demonstration met with vociferous opposition from
the clinical laboratory services industry, which filed a lawsuit in federal court alleging procedural defects of the demonstration, and also lobbied Congress to repeal the authorization for the demonstration. The industry was successful in obtaining a federal court injunction against the demonstration, and Congress did pass a repeal of the provision authorizing the demonstration.
For managed care services, CMS has operated a series of demonstrations of competitive bidding for Medicare beneficiaries in particular geographic areas. From 1996 to 1999, bids were requested for managed care contracts in Baltimore, Denver, Kansas City (both Missouri and Kansas), and Phoenix. In every one of these cases, Congress stopped the bidding process. Thus, CMS has had limited success in fully implementing bidding demonstrations or programs.
Alternative Strategies
In the absence of much success in operating bidding demonstrations, are there alternate methods of obtaining information on market prices that could be used by Medicare or other payers to determine payment amounts? While the planned competitive bidding project in 80 metropolitan areas is best able to capture market prices, it suffers from continued political opposition and significant administrative time and costs required to operate the projects. Alternative methods of obtaining market prices and making the existing fee schedule more accurate include:
-
Operating a competitive bidding program in test markets, and applying the results of these bids on a national basis. A variant of this would use the results of the bids already obtained by CMS in 10 market areas for DMEPOS and apply these results nationally.
-
Obtaining market prices from other purchasers such as health plans in the Federal Employees’ Health Benefit Plan or Medicare Advantage plans and apply these prices nationally.
-
Requiring a report on market prices from an independent organization such as the GAO, Medicare Payment Advisory Commission, or another organization that is regarded as a fair and objective judge, with recommendations on pricing that Congress could apply by law.
Considering the Trade-Offs
There are several trade-offs of the various strategies that should be considered as policy makers determine the best approach to use. First, there is a trade-off between the costs and administrative burden of operating bidding
projects compared with the often nonmarket and excessive payments made under administrative pricing schedules. Second, policy makers must decide whether to allow for multiple bidding winners, thus facilitating participation by smaller suppliers, versus the lower prices and ease of administration if only a single or small number of suppliers is chosen. Choosing multiple winners also allows for competition between suppliers on the basis of quality, thus providing the consumers with greater ability to obtain high-quality goods and services. Third, the bidding process requires years of elapsed time in a public program that must publish formal regulations on the processes and policies to be used for the bidding program. Administrative pricing may be operated more quickly, depending on the process chosen to determine the amounts to be paid by Medicare. Finally, the choice must be made between the relatively “pure” market price discovery that is possible using bidding in each market, versus proxies of the market through other methods of determining prices to be paid, even those that are based on attempts to obtain market prices through other means.
The Negative Consequences
There are several caveats that should be noted if Medicare started reducing payments for DMEPOS to market prices, no matter what the process. Any significant reduction in payments would affect suppliers, reducing profit margins, and potentially leading to consolidation in the industry. Also, in a competitive bidding environment, nonselected suppliers would lose their Medicare business, at least for those categories of supplies that they were not chosen to provide, which would lead to a large reduction in business since Medicare makes up roughly half of the business of many suppliers. Suppliers will be quick to note that Medicare imposes costs that are not reflected in Internet prices, including requirements for beneficiary education, billing, maintenance, and new requirements for accreditation and surety bonds.
Conclusion
The narrative of difficulties in applying competitive bidding to purchase DMEPOS and other items and services in the Medicare program is instructive about the difficulty of achieving healthcare payment reform in general. In this case, it appeared that all of the stars were aligned for payment reform. Medicare transparently pays more than market prices for DMEPOS items. The DMEPOS bidding demonstration showed an ability to reduce payment levels while maintaining access for high-quality items. The initial stage of the Medicare DMEPOS bidding program in 10 geographic areas yielded average reductions in payments of 26 percent. Even so, the politi-
cal backlash proved a formidable challenge to the widespread adoption of competitive bidding as a price-stabilizing option. While well organized, the DMEPOS industry has far less political influence than many other health industry members such as physicians and hospitals. Echoing some problems in the bidding that were cited by industry representatives, Congress subsequently delayed the DMEPOS bidding program for 18 months. Larger-scale reforms, even with an adapted version of competitive bidding, will face difficult political obstacles, and those costs must be evaluated in addition to the administrative and other considerations of these efforts.
MEDICAL DEVICE PRICES
Jeffrey C. Lerner, Ph.D.
ECRI Institute
The market for medical devices (including capital equipment and supplies) in the United States in 2008 was approximately $153 billion.13 In this paper, we estimate that hospitals, the primary purchasers of devices, would have saved approximately 3.1 percent or $4.73 billion in 2008 had they negotiated with manufacturers to achieve average savings for every device they bought.
Financial waste in the medical device market is likely driven by both pricing practices and overutilization. While reducing overutilization might produce much greater savings, it would be complicated and uncertain. Therefore, this paper does not take clinical appropriateness into account. In this paper, we concentrate on medical device prices alone, looking at how prices are set and how market practices could be improved.
The Medical Device Market
Let us step back to examine some characteristics of the medical device market, aspects of it that function differently and therefore affect the means for reducing costs, and the changing dynamics that threaten the savings that are now achievable. First, we must acknowledge that data for the medical device industry is extremely difficult to gather in meaningful ways. Information on the categories of medical devices we wish to examine is not gathered or compiled consistently. Furthermore, this market has not been
|
13 |
This calculation was arrived at by taking a figure for 2006 of $131.6 billion and inflating it by 7.7 percent annually over the next 2 years (Donahoe and King, 2009). “Estimates of Medical Device Spending in the United States.” Retrieved June 17, 2009, from http://74.125.47.132/search?q=cache:Gxmo1jaF4qQJ:www.amsa.org/business/King%2520Paper%2520Medical%2520Device%2520Spending.pdf+Donahoe+G,+King+G.+Estimates+of+medical+device+spending+in+the+United+States.&cd=1&hl=en&ct=clnk&gl=us. |
subject to a great deal of study, despite its size and importance in modern medicine.14 Exacerbating these limitations, few purchasers pay list prices in this market. The price of a device is often bundled with a range of services, and providing rebates is common. The size and characteristics of the market for medical devices are further complicated by the sheer number of products and the rates at which manufacturers introduce technical changes in their products. For example, ECRI Institute categorizes a half-million supply items bought by hospitals into 2,278 categories in the Institute’s Universal Medical Device Nomenclature System (UMDNS). ECRI Institute currently captures information on 4,983 models of capital equipment, classified into 962 UMDNS technology categories in 2009. Each type of supply and capital equipment that hospitals buy is purchased differently, and within each type or category, the processes vary. It is important to understand this because our premise for this paper is that “financial waste” is the amount of money paid by U.S. hospitals above the average amount for the same equipment.
Focusing on Medical Supplies
The best data we have found on prices paid is for medical devices that are classified as supplies. We categorize supplies into two types. First, there are medical/surgical supplies, such as syringes, catheters, tongue depressors, etc. According to a study published in April 2009 (Schneller, 2009), hospitals in a large survey purchased 72.8 percent of their goods through group purchasing organizations (GPOs) and had average savings of about 18.7 percent. Most of these goods are medical/surgical supplies. Since hospitals are already achieving these savings, they are not included in our estimate of the additional 3.1 percent.
The category of supplies also includes sophisticated devices, such as hip and knee replacements, implantable defibrillators and pacemakers, artificial spinal discs, and a range of other implants, collectively known as physician preference items (PPIs). Despite some variation in what some parties consider PPIs (e.g., surgical thread may or may not be defined as a PPI), the costs of these supplies are significant. This, along with many other factors, complicates the categories we are discussing. Just how much of the category of supplies are PPIs varies among hospitals, and it is consequential for the arguments made in this paper. In letters sent to Senators Grassley and Specter in 2007, one large hospital system stated “medical and implantable devices make up 40 percent to 55 percent of a hospital’s total supply
expense; in our case, implantable devices cost approximately $65 million annually” (Siegfried, 2007). A much smaller rural regional medical center reported that “medical device spending [i.e., PPI] here comprises approximately 40 percent of our total medical supply expense and is nearly $3 million annually” (Nelson, 2007).
Complications to Market Pricing for Physician Preference Items
Looking at how PPIs are bought and sold sheds light on some of the market fragmentation that may be driving significant excess costs to hospitals. Some manufacturers of PPIs insert “confidentiality clauses” into their contracts and other purchase documents with hospitals that prohibit these hospitals from disclosing prices paid to third parties. This practice can derail the negotiation of fair prices by precluding the hospital from disclosing prices to implanting physicians, other hospitals, consultants who help them purchase equipment, benchmarking pricing services, patients, and insurers. Some manufacturers have aggressively sought to reinforce and spread the use of these price-secrecy clauses, including the claim that prices are protected as “trade secrets.” These arguments have been the subject of recent articles, most notably in the health policy journal Health Affairs and in legal writings (Bridy, 2009; Lerner et al., 2008). Physicians have long been insensitive to the prices their hospitals pay. A PPI, as the name indicates, is specified by physicians, but it is the hospital that purchases the supplies. One explanation for the perpetuation of this divide between the decision makers and purchasers is that hospital administrators are reluctant to disrupt the relationships with manufacturers of products preferred by their major revenue-generating physicians.
However, reform may come. Senators Grassley and Specter have introduced the Transparency in Medical Device Pricing Act of 2007 (S. 2221), which would require manufacturers to report their median and mean prices for PPIs quarterly to the Centers for Medicare & Medicaid Services. Other options to keep manufacturers from making prices opaque, such as banning the signing of secrecy clauses by hospitals doing business with the Medicare program, have also been proposed. With some 60 percent of the expenditures on medical devices potentially subject to secrecy clauses, this issue looms large in the ability to achieve the 3.1 percent average savings upon which we based our estimate of waste (Lerner et al., 2008).15
|
15 |
Senator Specter said, in introducing his legislation, S. 2221 Specter, A. (2007, October 23, 2007). “Arlen Specter Speaks on the Senate Floor Regarding the Transparency in Medical Devices Act.” Retrieved June 26, 2009, from http://specter.senate.gov/public/index.cfm?FuseAction=NewsRoom.ArlenSpecterSpeaks&ContentRecord_id=cf655dfb-1321-0e36-bab2-05c5b6002908. |
The Cost Savings Opportunity
Data kept by government agencies and, to our knowledge, the private sector, fail to segregate the supplies market into medical/surgical supplies and PPIs in ways that are useful for calculating waste. Even so, cost savings can be estimated if both supply types are combined. For the purpose of this paper, ECRI Institute evaluated datasets of supplies from 123 hospitals that provided their complete “item masters” of purchases recorded from January 1, 2009 to May 1, 2009. Table 5-4 illustrates the findings from an analysis of actual prices paid, demonstrating that these hospitals collectively could achieve an average 3.1 percent savings if they negotiate to the average price paid for every supply item.16
We derive our estimate of total potential national savings in 2008 by multiplying the size of the market for medical devices, $152.65 billion, by 3.1 percent to arrive at $4.73 billion. We use supplies from this study, most of which are medical devices, as a surrogate for all medical devices.
In Table 5-4, the sample of data from the 123 hospitals is arrayed so that the three hospitals with the largest total amounts spent on supplies are at the top and the three with the lowest are at the bottom. It indicates that even hospitals that negotiate well can still capture additional savings. Hospital #1 could achieve 1.72 percent in additional savings (or $2.85 million) if it negotiated to the average price paid for every item.
This table also illustrates that were Hospital #1 able to negotiate the lowest prices from among the 123 hospitals, it would achieve an 8.13 percent savings. However, for the purpose of our calculation of 3.1 percent in “financial waste,” we assume that only the current average matters, even though it may be very possible to develop strategies that would create greater average savings among all hospitals. In fact, policy makers are considering options such as bundling payments to physicians and hospitals, which they believe will create greater incentives for these parties to work together to lower prices. Were this to happen and were secrecy clauses limited or banned, it would be possible to imagine savings in excess of 3.1 percent.17
To illustrate this possibility, we summarized the prices hospitals paid for a small sample of PPIs (Table 5-5). Different-sized hospitals buying
TABLE 5-4 Medical/Surgical Supplies and Implants: Total Spending and Potential Savings from a Sampling of Hospitals
|
Facility |
Total Spending |
Potential Savings If Lowest Price Achieved |
Percentage Savings If Lowest Price Achieved |
Potential Savings If Average Price Achieved |
Percentage Savings If Average Price Achieved |
|
Hospital #1 |
$165,287,541 |
$13,452,180 |
8.1 |
$2,854,653 |
1.7 |
|
Hospital #2 |
$132,869,401 |
$13,380,529 |
10.1 |
$2,467,469 |
1.9 |
|
Hospital #3 |
$128,241,519 |
$16,382,166 |
12.8 |
$4,310,728 |
3.4 |
|
. |
. |
. |
. |
. |
. |
|
. |
. |
. |
. |
. |
. |
|
. |
. |
. |
. |
. |
. |
|
Hospital #121 |
$1,213,521 |
$152,161 |
12.5 |
$50,228 |
4.1 |
|
Hospital #122 |
$1,179,089 |
$28,629 |
2.4 |
$6,594 |
0.6 |
|
Hospital #123 |
$1,112,824 |
$67,479 |
6.1 |
$13,997 |
1.3 |
|
Average |
|
|
12.3 |
|
3.1 |
|
SOURCE: Reprinted with permission from ECRI Institute. |
|||||
different volumes of the same brand and model of pacemaker paid different prices. While that might seem intuitive, the pattern illustrated is not. Essentially, there is no pattern. For example, a 1,900-bed hospital/health system buying 25 pacemakers paid $287 more per pacemaker than a 200-bed hospital buying only 9 pacemakers. Because hospitals are ignorant of the prices they pay relative to other consumers, they may simply accept statements by manufacturer sales representatives that the hospital is getting the best price. Manufacturers have a great deal more aggregated information on prices offered to customers than do individual hospital customers. Enhancing the transparency in the market allows the purchaser to verify claims and to negotiate prices more effectively.
TABLE 5-5 Volume and Price Paid per Unit for the Same Brand of Model of Pacemakers by a Variety of Hospitals
|
Number of Beds* |
Volume Purchased |
Price Paid per Unit |
|
600 |
6 |
$4,400 |
|
1,100 |
17 |
$4,500 |
|
200 |
9 |
$4,513 |
|
600 |
33 |
$4,650 |
|
300 |
15 |
$4,700 |
|
1,900 |
25 |
$4,800 |
|
500 |
20 |
$4,837 |
|
100 |
38 |
$5,000 |
|
*Number of beds rounded to the nearest 100 beds. SOURCE: Reprinted with permission from ECRI Institute. |
||
An analysis of a subset of data consisting only of PPIs from the 123 hospitals studied showed an average potential savings of 27 percent as opposed to 3.1 percent for all technologies combined.
Capital Equipment Purchases
The final category of medical devices we need to consider is capital equipment (e.g., computed tomography scanners, anesthesia units, linear accelerators, electric beds, laboratory analyzers). These technologies are purchased less frequently than supplies, but they represent very large expenditures. Unfortunately, we do not have a satisfying estimate of the proportion of the $153 billion device market is made up of capital equipment purchases (Burns, 2002).18 We do, however, have evidence of great variation in prices offered to hospitals. Table 5-6 shows data from 1,500 hospitals and health systems and prices for five types of capital equipment studied between May 1, 2008, and May 1, 2009.
This table indicates that hospitals are quoted prices that are on average 29.6 percent lower than the list price. Hospitals in this study did not report the actual prices paid after their negotiations. In this way, it is different from the price-paid supplies data that was cited previously. Consequently, we assumed only that an additional 3.1 percent of the capital portion of the expenditure could be saved (i.e., the same percentage we used for the supplies).
Notably, as with PPI purchases, small hospitals buying the exact same equipment may pay less for it than large hospitals. For example, based on ECRI Institute study data, ACME Imaging offered a community hospital a cardiac ultrasound system at a 43.7 percent discount while offering only a 33 percent discount on the same brand and model system to a larger hospital. It might come as something of a shock to the executive teams in large hospitals that, despite their beliefs, they are not always offered the best discounts.
Conclusion
The above analysis shows substantial savings but perhaps less than some policy makers might believe possible. These policy makers might note that the United States spends far more per capita on medical devices than the second largest purchaser of medical devices in the world, Japan, or the third largest purchaser, Germany (Table 5-7).
Analyses conducted by the McKinsey Global Institute that were discussed as part of this workshop demonstrate that the United States spent
TABLE 5-6 Prices and Discounts Obtained for Capital Equipment
|
Device |
Average Percentage Discount, % (Range) |
Average List Price |
Number of Hospitals Reporting Data |
|
Scanning systems, computed tomography |
35.8 (12.0-58.1) |
$1,582,591 |
76 |
|
Anesthesia units |
24.2 (10.0-45.8) |
$59,378 |
171 |
|
Radiotherapy systems, linear accelerator |
46.6 (13.5-66.2) |
$4,467,482 |
34 |
|
Beds, electric |
30.1 (7.2-45.0) |
$16,658 |
162 |
|
Analyzers, laboratory, hematology, cell counting, automated |
35.1 (1.0-72.0) |
$157,138 |
93 |
|
SOURCE: Reprinted with permission from ECRI Institute. |
|||
TABLE 5-7 Comparison of Medical Device Expenditures Across Countries
|
|
MD Expenditures as a Percentage of THE |
THE as a Percentage of GDP |
MD Expenditure per Capita (€)* |
|
United States |
5.1 |
13.9 |
278 |
|
Japan |
5.1 |
7.6 |
158 |
|
Germany |
8.6 |
10.7 |
230 |
|
France |
5.8 |
8.6 |
107 |
|
United Kingdom |
4.8 |
7.6 |
97 |
|
NOTE: GDP = gross domestic product; MD = medical devices; THE = total health expenditures. *Prices are expressed in Euros. SOURCE: Adapted from CERM, 2005. |
|||
$18 billion above the Estimated Spending According to Wealth (ESAW) on medical devices. “The U.S. spends 54 percent above its ESAW on the top 5 inpatient devices—defibrillators, pacemakers, coronary stents, hip implants, and knee implants—when compared with Europe and Japan” (Angrisano et al., 2007). The report goes on to say that the wealth-adjusted cost of a knee implant is 32 percent higher and hip implants 60 percent higher than the average of those in France, Germany, Italy, and the United Kingdom (Angrisano et al., 2007).
Whether due to the higher prices, greater utilization, or additional factors such as “upselling,” it is complex to alter the current organizational structure and condition of health care in the United States.19
Even when we restrict our analysis of financial waste to prices alone, there are many caveats. In addition to those we have already mentioned,
our reliance on information for supplies as a proxy for all U.S. device expenditures and potential savings is a limitation. Hospitals are the major purchasers of medical devices, but they are not the only purchasers. Outpatient clinics and physician groups buy devices, but we were not able to study the prices they pay. The figure of $152.65 billion dollars in 2008 also includes, for example, durable medical equipment bought by home health agencies and patients. But since no figures are available to perform a reliable analysis, we have based our analysis on what we do know.
In summary, we believe that close to $5 billion (3.1 percent of total national expenditures for medical equipment) could have been saved in 2008, and similar savings would accrue in the future, if better negotiating processes were deployed in hospitals. The latter includes using benchmarking data to the fullest extent possible to achieve average prices. Even current savings will decline if aggressive efforts to make prices opaque are not remediated.
REFERENCES
American Hospital Association. 1997. AHA Annual Survey Database. Chicago: American Hospital Association.
American Hospital Association. 2006. AHA Annual Survey Database. Chicago: American Hospital Association.
Angrisano, C., D. Farrell, B. Kocher, M. Laboissier, and S. Parker. 2007. Accounting for the Cost of Health Care in the United States. Washington, DC: McKinsey Global Institute.
Bridy, A. 2009. Trade secret prices and high-tech devices: How medical device manufacturers are seeking to sustain profits by propertizing prices. Texas Intellectual Property Law Journal Winter 17(2):187-222.
Burns, L. R. 2002. The health care value chain: Producers, purchasers, and providers. San Francisco: Jossey-Bass.
California HealthCare Foundation. 2009. Health Care Costs 101. http://www.chcf.org/topics/healthinsurance/index.cfm?itemID=133630 (accessed April, 2009).
Capps, C., and D. Dranove. 2004. Hospital consolidation and negotiated PPO prices. Health Affairs (Millwood) 23(2):175-181.
Capps, C., D. Dranove, and M. Satterthwaite. 2003. Competition and market power in option demand markets. RAND Journal of Economics 34(4):737-763.
CMS (Centers for Medicare & Medicaid Services). 2007. Improper Medicare fee-for-service payments report-May 2007 report. http://www.cms.hhs.gov/apps/er_report/preview_er_report.asp?from=public&which=long&reportID=6 (accessed June 12, 2009).
——. 2008. Medicare to save average of 26% for some durable medical equipment, prosthetics, orthotics, and supplies in selected areas; beneficiaries to join in savings. http://www.cms.hhs.gov/apps/media/press/release.asp?Counter=2996&intNumPerPage=10&checkDate=&checkKey=&srchType=1&numDays=0&srchOpt=0&srchData=&keywordType=All&chkNewsType=1%2C+2%2C+3%2C+4%2C+5&intPage=&showAll=1&pYear=1&year=2008&desc=false&cboOrder=date (accessed June 2009).
——. 2009a. Category definitions: National health expenditures. http://www.cms.hhs.gov/NationalHealthExpendData/downloads/quickref.pdf (accessed June 11, 2009).
——. 2009b. Medicare begins supplier education for the competitive bidding program for certain medical equipment and supplies. http://www.cms.hhs.gov/apps/media/press/release.asp?Counter=3455&intNumPerPage=10&checkDate=&checkKey=&srchType=1&numDays=3500&srchOpt=0&srchData=&keywordType=All&chkNewsType=1%2C+2%2C+3%2C+4%2C+5&intPage=&showAll=&pYear=&year=&desc=&cboOrder=date (accessed June 12, 2009).
——. 2009c. National health expenditure projections 2008-2018. http://www.cms.hhs.gov/NationalHealthExpendData/downloads/proj2008.pdf (accessed June 11, 2009).
Claxton, G., J. Gabel, B. DiJulio, J. Pickreign, H. Whitmore, B. Finder, P. Jacobs, and S. Hawkins. 2007. Health benefits in 2007: Premium increases fall to an eight-year low, while offer rates and enrollment remain stable. Health Affairs (Millwood) 26(5):1407-1416.
CBO (Congressional Budget Office). 2004. Medicaid’s reimbursement to pharmacies for Prescription Drugs.
——. 2005. Prices for brand-name drugs under selected federal programs. Washington, DC: Congressional Budget Office.
——. 2007. Prescription drug pricing in the private sector. Washington, DC: Congressional Budget Office.
——. 2009. Budget Options. www.cbo.gov/ftpdocs/99xx/doc9925/12-18-HealthOptions.pdf (accessed August 2009).
CERM (Competitiveness, Markets and Regulation). 2005. Medical devices competitiveness and impact on public health expenditure. Directorate Enterprise of the European Commission: p. 22.
Dafny, L. 2009. Estimation and identification of merger effects: An application to hospital mergers. Journal of Law and Economics 52.
Department of Health and Human Services. 2004a. A comparison of prices for power wheelchairs in the Medicare program. http://www.oig.hhs.gov/oei/reports/oei-03-03-00460.pdf (accessed April 2009).
——. 2004b. Medicare payment rates for home oxygen equipment. Department of Health and Human Services, Office of the Inspetor General.
——. 2006. Medicare home oxygen equipment: Cost and servicing. http://www.oig.hhs.gov/oei/reports/oei-09-04-00420.pdf (accessed June 11, 2009).
——. 2009. Comparison of prices for negative pressure wound therapy pumps. Department of Health and Human Services, Office of the Inspector General.
Donahoe, G., and G. King. 2009. Estimates of Medical Device Spending in the United States. http://74.125.47.132/search?q=cache:Gxmo1jaF4qQJ:www.amsa.org/business/King%2520Paper%2520Medical%2520Device%2520Spending.pdf+Donahoe+G,+King+G.+Estimates+of+medical+device+spending+in+the+United+States.&cd=1&hl=en&ct=clnk&gl=us (accessed June 17, 2009).
Dranove, D., and R. Lindrooth. 2003. Hospital consolidation and costs: Another look at the evidence. Journal of Health Economics 22(6):983-997.
Dranove, D., and R. Ludwick. 1999. Competition and pricing by nonprofit hospitals: A reassessment of lynk’s analysis. Journal of Health Economics 18(1):87-98.
FTC (Federal Trade Commission). 2005. FTC vs. Evanston Northwester Healthcare Corporation. Docket no. 9315. http://ftc.gov/os/adjpro/d9315/051021idtextversion.pdf (accessed August 27, 2010).
Gaynor, M., and W. B. Vogt. 2003. Competition among hospitals. RAND Journal of Economics 34(4):764-785.
Geithner, T., H. Solis, K. Sebelius, M. Astrue, and C. Frizzera. 2009. 2009 Annual report of the boards of trustees of the federal hospital insurance and federal supplementary medical insurance trust funds. http://www.cms.hhs.gov/ReportsTrustFunds/downloads/tr2009.pdf.
Ginsburg, P. B., B. C. Strunk, M. I. Banker, and J. P. Cookson. 2006. Tracking health care costs: Continued stability but at high rates in 2005. Health Affairs (Millwood) 25(6): w486-w495.
Hartman, M., A. Martin, P. McDonnell, and A. Catlin. 2009. National health spending in 2007: Slower drug spending contributes to lowest rate of overall growth since 1998. Health Affairs (Millwood) 28(1):246-261.
Hoadley, J. 2007. The Prescription drug safety net: Access to pharmaceuticals for the uninsured. National Health Policy Forum, May 9, Washington, DC.
Hoerger, T., S. Karon, S. Bernard, K. Tate, R. Lindrooth, T. Waters, and K. Jewell. 2003. Evaluation of Medicare’s competitive bidding demonstration for DMEPOS: Final evaluation report. Research Triangle Park, NC: RTI International.
IMS Health. 2006. Method of Payment Report. Norwalk: IMS Health.
Jayadev, R., and J. Stiglitz. 2009. Two ideas to increase innovation and reduce pharmaceutical costs and prices. Health Affairs (Millwood) 28(1):w165-w168.
Joyce, G. F., J. J. Escarce, M. D. Solomon, and D. P. Goldman. 2002. Employer drug benefit plans and spending on prescription drugs. Journal of the American Medical Association 288(14):1733-1739.
Keeler, E. B., G. Melnick, and J. Zwanziger. 1999. The changing effects of competition on non-profit and for-profit hospital pricing behavior. Journal of Health Economics 18(1):69-86.
Lerner, J. C., D. M. Fox, J. Reiss, and T. Nelson. 2008. Perspective: The consequences of secret prices: The politics of physician preference items. Health Affairs (Millwood) 27(6):1560-1565.
MedCo Health. 2009. Drug Trend Report 2009. Chicago: MedCo Health.
MedPAC. 2009. Report to the Congress: Improving Incentives in the Medicare Program. Washington, DC.
Nelson, T. 2007. Personal communication with Timothy B. Strachan. Grinnell, May 25, 2009.
Paris, V., and E. Docteur. 2006. Pharmaceutical pricing and reimbursement policies in Canada. Paris: Organisation for Economic Co-operation and Development.
Pauly, M. V., and L. R. Burns. 2008. Price transparency for medical devices. Health Affairs (Millwood) 27(6):1544-1553.
Purvis, L. 2009. Rx Watchdog Report: Trends in manufacturer prices of prescription drugs used by medicare beneficiaries: 2008 Year-end update. Washington, DC: AARP Public Policy Institute.
Schneller, E. S. 2009. The value of group purchasing-2009: Meeting the needs for strategic savings. http://www.gpossavemoney.org/ValueofGPO-2009.pdf (accessed April 26, 2009).
Siegfried, R. 2007. Personal conversation with Timothy B. Strachan. Newark, May.
Strunk, B. C., P. B. Ginsburg, and J. R. Gabel. 2002. Tracking health care costs: Growth accelerates again in 2001. Health Affairs (Millwood) Suppl Web Exclusives:w299-w310.
Town, R., and G. Vistnes. 2001. Hospital competition in HMO networks. Journal of Health Economics 20(5):733-753.
Town, R., D. Wholey, R. Feldman, and L. Burns. 2006. The welfare consequences of hospital mergers. Cambridge: National Bureau or Economic Research.
U.S. Congress. 2009. Medicare’s DMEPOS competitive bidding program. Washington, DC: Subcommittee on Health of the Committee on Ways and Means. http://waysandmeans.house.gov/hearings.asp?formmode=view&id=7569 (accessed June 12, 2009).
Vita, M., and S. Sacher. 2001. The competitive effects of not-for-profit hospital mergers: A case study. Journal of Industrial Economics 49(1).
Vogt, W., and R. Town. 2006. How Has Hospital Consolidation Affected the Price and Quality of Hospital Care? Princeton: Robert Wood Johnson Foundation.


