
4
Assessing Outcomes
Analyzing costs accurately is complex, although the established procedures for doing so apply relatively easily to the early childhood context. To assess the outcomes of early childhood interventions, however, requires careful thought about ways of measuring indirect and long-term effects. Policy makers want to base decisions about investments in early childhood programs on analysis of what can be expected in return for this investment. Advocates of these investments look for ways to demonstrate their enduring value. Ideally, accurate assessments of the potential benefits of early childhood programs would rest on common definitions of outcomes and programs and common approaches to measuring both short- and long-term outcomes. But these tools are not yet firmly in place, and researchers have been exploring a range of approaches; presenters explored their strengths and limitations and pointed to promising directions for future research.
RESEARCH QUESTIONS AND METHODS
Many studies have examined both the outcomes that are evident during or shortly after an intervention as well as the duration of these effects. W. Steven Barnett and Jeanne Brooks-Gunn described the results of several studies.
Lessons from Three Studies
Barnett described benefit-cost analyses of three of the best known early childhood programs: (1) the Perry Preschool Project, (2) the Carolina Abecedarian Project, and (3) the Chicago Child Parent Center (see Box 4-1). All three programs have been extensively studied, and Barnett presented some results from the most recent economic analyses, shown in Table 4-1, with a focus on the ways in which they approached benefit-cost analysis, their comparability, and factors that might explain their disparate results. For his summary he drew on Belfield, Nores, Barnett, and Schweinhart (2006); Barnett and Masse (2007); and Temple and Reynolds (2007). He characterized the benefit-cost ratio estimates in general terms to reflect the degree of confidence he had in them.
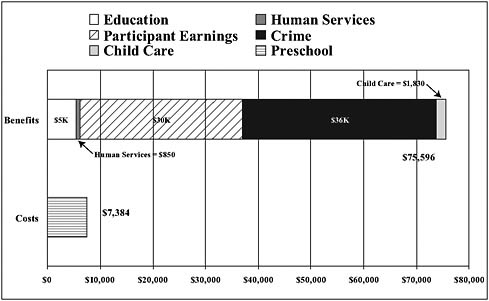
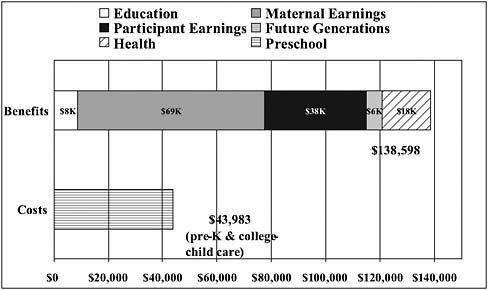
Barnett provided a breakdown of the value, in 2002 dollars, of the different beneficial outcomes for each of the programs, as shown in Figures 4-1, 4-2, and 4-3, and called attention to fairly large differences across the three programs. For example, the benefits in crime reduction are very large for the Perry Preschool Project; such benefits are not evident for the Carolina Abecedarian Project.
The differences in the benefit profiles reflect differences among the programs, the settings in which they operated (e.g., the baseline crime rates in the cities where the programs were located), and the populations they have served, Barnett noted. They also reflect differences in the goals of the programs, the sorts of data that were available, and the ways potential benefits were measured. Barnett suggested that researchers have made significant progress since the early 1960s, when the earliest of these
|
BOX 4-1 The Chicago Child Parent Center Since 1967 the city of Chicago has provided preschool and associated support services to children and families who live in low-income neighborhoods. Eligible children ages 3-5 may participate for two years prior to entering kindergarten and may attend for half days or full days. The program addresses basic academic skills, growth and development, parenting skills, health, safety, and nutrition—parent participation in classroom activities is required. The program, which is administered by the Chicago public schools, is supported with federal funds. A federally funded longitudinal study of the program was begun in 1986. SOURCES: For information on the longitudinal study, see Chicago Longitudinal Study (2004); for the Chicago Child Parent Center, see Chicago Public Schools (2009). |
TABLE 4-1 Benefit-Cost Analyses of Three Early Childhood Interventions
|
|
Carolina Abecedarian Project |
Chicago Child Parent Center |
Perry Preschool Project |
|
Year begun |
1972 |
1985 |
1962 |
|
Location |
Chapel Hill, NC |
Chicago, IL |
Ypsilanti, MI |
|
Sample size of study |
111 |
1,539 |
123 |
|
Design |
Randomly controlled trial |
Matched neighborhood |
Randomly controlled trial |
|
Ages |
6 weeks–5 years |
Ages 3-4 |
Ages 3-4 |
|
Program schedule |
Full day, year round |
Half day, school year |
Half day, school year |
|
Cost |
$70,697 |
$8,224 |
$17,599 |
|
Benefits |
$176,284 |
$83,511 |
$284,086 |
|
Benefit/cost ratio |
> 1 |
Big |
Big |
|
SOURCE: Barnett (2009). |
|||
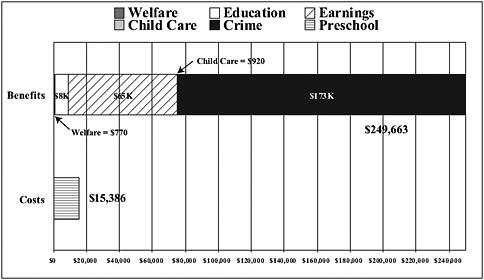
FIGURE 4-1 Perry Preschool Project: Economic return (in 2002 dollars).
SOURCE: Barnett (2009).
sorts of studies began, and that if they could be done over again, much more information could be gleaned.
Initial data collection for the Perry Preschool Project focused on IQ, for example, but the researchers had limited means of examining social and emotional effects (e.g., motivation, classroom behavior). They had teacher reports for the treatment group, but at the time (early 1960s) children in the control group were not enrolled in a preschool program, so no comparable reports were available for them. Similar data constraints limited the team’s ability to examine many areas in which the researchers hoped to find benefits as the longitudinal investigation continued. They used proxies that seem crude today, such as using special education and grade retention costs to predict educational attainment. However, by the time the original program participants reached ages 19-40, researchers could sufficiently quantify benefits in many areas (e.g., crime reduction, welfare, educational attainment) to demonstrate a clear economic benefit. Many additional possible benefits—-such as effects on siblings or peers or improvements in family formation—could not easily be quantified.
Looking at the data for the Carolina Abecedarian Project, he noted that the initial data collection was designed by psychologists, who collected data on employment and earnings in ways that differed from economic methods. Thus, the initial data do not support analysis of the impact on maternal earnings, for example, even though the program provided fullday, year-round child care. Similarly, more could be concluded about the program’s impacts on health “if we had a combination of better data and better estimates of some of the health outcomes,” Barnett noted.
Looking across the three programs, Barnett had several observations. He suggested that multidisciplinary research teams—representing, for example, economics, psychology, education, and health—can ensure that the study design captures the most important information. All of the studies have very small samples, so only effects that are quite large will show up as significant, he suggested, adding that “a lot of things that are valuable get lost because of that.” None of the studies looked for effects on siblings, and the measures of effects on parents are limited—again, the sample sizes are too small to support strong findings of second-order effects, but it is still possible that these are real benefits. Moreover, some direct benefits—such as increased academic success or reductions in special education referrals—are not included except indirectly, in terms of effects on earnings and reduced costs to taxpayers.
Thus, off-the-shelf estimates of value for benefits that are more difficult to quantify would make it easier to include these plug-in numbers in small-scale studies. At the same time, as programs are scaled up and large-scale analyses are feasible, it may be possible to identify small but important effects on children who are not the direct recipients of the pro-
gram (e.g., siblings, primary school classmates) and macro-scale impacts on classroom and school environments (e.g., school safety), economic growth, productivity, and so forth. A number of states are moving beyond disadvantaged children and offering programs to all children for one or two years before they enter kindergarten. These programs may have effects on the teacher labor market; working conditions; school safety, security, and maintenance costs; or even property values. In short, current arguments in favor of investments in early childhood could be made much stronger.
Focus on Improving School Readiness
Jeanne Brooks-Gunn suggested that early childhood education is important because it offers a strategy to improve outcomes for disadvantaged children. Since large numbers of disadvantaged 3- and 4-year-olds are not served by any preschool program (see Table 4-2), she said that it is important to compare outcomes for children who do or do not have access to any sort of center-based care. The biggest differences she identified were between children cared for at home and children enrolled in some kind of program. But that does not mean that quality is not important. Thus, for Brooks-Gunn, making preschool programs accessible to low-income children and ensuring their quality are the two primary goals for early childhood policy. She reviewed a range of research on outcomes that relate to school readiness to demonstrate this point, using them to highlight methodological points to consider for future research.
The effects of missing out on quality care at this age can be large, as she and colleagues found in a 2009 study in which they compared the
TABLE 4-2 State Pre-K and Head Start Enrollment as a Percentage of the Total 3- and 4-Year-Old Population
|
Program |
3-Year-Olds |
4-Year-Olds |
|
Prekindergarten |
2.7 |
17.3 |
|
Head Start |
7.3 |
11.3 |
|
Special education |
3.9 |
6.2 |
|
Other |
24.8 |
33.6 |
|
None |
61.3 |
31.6 |
|
SOURCE: National Institute for Early Education Research (2006). |
||
school readiness of children in 18 cities who had been in Head Start with results for their peers who had other care arrangements (Zhai, Brooks-Gunn, and Waldfogel, 2009). The researchers used measures of attention, social competence, vocabulary, and letter-word identification, and found that children who had been enrolled in Head Start programs performed significantly better on all four measures than those in parent care or in noncenter care. Children in other pre-K programs scored as well as Head Start children on the two cognitive measures but not on the measures of attention and social competence.
Looking across several randomized trials, Brooks-Gunn has found that small-scale experiments show large effects of high-quality preschool education on school readiness (results for federally sponsored programs are somewhat smaller). The effects are evident for the children of mothers with a high school education or less but not for those whose mothers have a college degree. The effects can be larger for black children than for white or Hispanic children. Specifically, she found that if all children whose families were in poverty were in a preschool, test gaps would shrink by 2 to 12 percent for black children and by 4 to 16 percent for Hispanic children.
She also described results from the Infant Health and Development Program (IHDP), a study of interventions with low-birthweight babies that was based on the Abecedarian model. The study, which included approximately 1,000 children in 8 sites, offered children in the treatment group full-day, year-round care as well as free medical surveillance for 2 years (ages 13-36 months). Home visits and transportation were also part of the program. The study design included randomization that was stratified by birthweight, so that the researchers could compare results for children under 2,000 grams at birth and those who were heavier (but still low). Table 4-3 shows the results for both IQ and the Peabody Picture Vocabulary Test (PPVT) for the heavier children. Brooks-Gunn explained that, although the children improved in these two areas, they fared more or less like normal-weight babies in terms of health. She noted that they also saw sustained effects in mathematics achievement, reduction in aggression, and maternal employment—overall results that are greater than those for the Abecedarian and Perry Preschool projects, for example, although IHDP was only a two-year program.
Brooks-Gunn highlighted the key strengths of the study, which included faithful implementation of a tested curriculum, the collection of data on attendance (a key factor in impact), and the content of home visits. Tested curricula that are clear about the goals and activities planned and also allow for clear documentation of how they are implemented support strong analysis of effects, she explained. She noted that an independent group had developed the study design, including the randomization, the
TABLE 4-3 Infant Health and Development Program: Impacts for Children Over 2,000 Grams at Birth from Age 3 to Age 18
assessments, and the analyses, which she believes is critical to their strong findings. For example, she noted that the statistical team was firm in limiting the analysis to outcomes that were identified from the beginning of the program design.
Among the elements she would include if she were to repeat the study are measures of the quality of the care received by the children in the control groups; measures of the quality of care the treatment children received after the intervention ended, as well as the quality of their elementary education; more follow-up data (at additional developmental stages up to age 22); and data for a normal birthweight comparison group. These are needed because the outcomes depend on these factors as well as the intervention, so they should be controlled for in the analysis.
She also described some results from a study of Early Head Start that showed positive effects for children and their parents two years after the intervention ended (Chazan et al., 2007). Children showed decreased behavior problems and more positive approaches to learning, for example. Their parents showed positive effects, such as increases in reading to their children daily and use of teaching strategies, and decreases in maternal depression. Brooks-Gunn noted examples of useful data collected by the study, including detailed measures of vocabulary development, attention, and the home environment, as well as videotapes of the children interacting with their parents. She had several ideas for additional elements that would have been useful, including attendance data and more information about the curriculum.
Brooks-Gunn used these examples to highlight some of the questions the next generation of research could address:
-
What differences can be attributed to differences in the setting or site in which the intervention is delivered versus differences in the population served?
-
What effect does the timing or duration of the intervention have on outcomes—i.e., what is the optimal or minimal necessary amount of exposure?
-
What is the optimal age to begin an intervention?
-
Why are programs apparently less successful with Hispanic children and the children of immigrants?
-
What elements of curriculum are important to outcomes?
-
What more could be learned from studies that incorporate planned variations, in which different educational models are pursued simultaneously with comparable groups and in comparable settings, so that outcomes can be compared?1
ASSESSING LONG-TERM OUTCOMES
A challenge that cuts across studies and domains is identifying and measuring outcomes that persist or show up long after the intervention is completed. Katherine Magnuson and Janet Currie discussed two approaches to capturing this information.
Projecting (or Guesstimating) Long-Term Outcomes
Without a doubt, the best way to understand the long-term effects of early childhood interventions is to collect real data—that is, to follow children over time and find out what happens to them using empirical methods, Magnuson observed. But doing so takes time and money; therefore, it is useful to explore other ways of estimating long-run outcomes. Complex procedures are involved in developing such estimates for complicated production functions. Inputs at different ages, and of different sorts and magnitudes, may have differential effects on health, cognition, language, and behavior. Most early interventions explicitly or implicitly target more than one domain, or they might be expected to have effects that spill over from one domain to another. For example, in an effort to improve cognitive functioning and academic achievement, a program might teach children to focus and concentrate, which would be likely to produce other benefits as well.
Several methods exist to resolve this complexity, and all yield at best rough approximations. One approach, used by Krueger (2003), attempted to estimate the later earnings benefits of reducing class size. Krueger
looked at studies that linked early achievement to later earnings and applied the percentage (8 percent) to data from the Tennessee STAR (Student Teacher Achievement Ratio) experiment on class size. This approach could be adapted to produce rough estimates for other predictors and outcomes, Magnuson explained, but there are a few complications in applying it to early childhood interventions.
One question is whether outcomes for an intervention in early childhood are different from the outcomes of the same intervention with older children. For example, the behavior issues of 2- or 3-year-olds, 4- or 5-year-olds, or 8-year-olds are likely to be different and to decrease over time. Thus, it is important to consider children’s developmental progressions in measuring effects on behavior. A more fundamental problem with this approach is the lack of sources of nationally representative, high-quality data on early childhood achievement, behavior, attention skills, and other elements, together with wage data for later years, which are needed for this type of analysis.
Adapting this approach in a two-step analysis could provide an answer to some of these concerns, Magnuson suggested. Here, one would first link an early childhood outcome, such as achievement at age 5, to a more proximate outcome, such as adolescent achievement or high school graduation. The latter outcome could then be linked to an outcome of interest, such as adult earnings.
The advantage of this approach is that more data are available to establish the magnitude of the two links, although Magnuson acknowledged that a variety of measurement issues contribute uncertainty at each step of the process. For example, which measures and samples provide the most accurate results was unclear and open to discussion. Another point that needs consideration is which research designs best approximate the causal effects, because arriving at good estimates depends on accurately identifying the magnitude of causal links. Put another way, the results are only as good as the studies from which the data are drawn. Finally, the model can map only effect pathways that have already been measured—overlooking other possible pathways that link early childhood experiences to later outcomes. Nevertheless, the two-step method is flexible enough to be adapted to examine a variety of outcomes, and it provides a transparent logic model for explaining how the effects work.
Another way to develop estimates is to leverage experimental evaluations from studies of other programs that have examined long-term outcomes. Magnuson used data for the Perry Preschool Project to illustrate how this can be done. The operating assumption is that the effects are likely to be proportional. So, using data on the Perry Preschool’s effects on measures of early achievement of language and on later earnings, one can calculate the probable effects of other programs for which only early
data are available. The Perry Preschool’s effect on the PPVT was .91 standard deviation and on lifetime earnings was $59,000 (in 2006 dollars); one can use program impacts on the PPVT from another program and calculate a probable (proportional) effect on earnings. This model, Magnuson explained, has the advantage of not requiring that all mediating pathways to the long-run outcome be modeled, so it doesn’t require assumptions about which pathways explain the effects. However, the validity of proportional relationships has not been empirically tested, so it is a large assumption to make. Moreover, the ways in which the benchmark program results in long-run outcomes, and the population for which it was studied, may have unique characteristics that account for its effects.
Table 4-4 shows the results Magnuson calculated using each of these methods, including the two-step version using two different intermediary measures—adolescent achievement skills and high school completion. She suggested that all are reasonable methods for obtaining a rough esti-
TABLE 4-4 Comparing Approaches
|
Program Impact in Early Years |
A11 (Krueger) |
A22 (2-step Ach) |
A33 (2-step HS) |
A44 (Prop. to Perry) |
|
|
PV Earnings in 2006 Dollars |
|||
|
1 SD reading |
$40,330 |
$20,160 |
$9,720 |
$64,835 |
|
.5 SD reading |
$20,160 |
$10,080 |
$4,862 |
$32,417 |
|
.2 SD reading |
$8,070 |
$4,030 |
$1,945 |
$12,967 |
|
|
Fraction of PV of Lifetime Earnings |
|||
|
1 SD reading |
.08 |
.04 |
.02 |
.09 |
|
.5 SD reading |
.04 |
.02 |
.01 |
.04 |
|
.2 SD reading |
.02 |
.008 |
.004 |
.02 |
|
NOTES: Present value of lifetime earnings ($508,104) is calculated for a sample that is 50 percent high school graduates and 50 percent high school dropouts. All columns present 2006 dollars with 3 percent discounting to age 5; columns 1-3 assume 1 percent wage growth. PV = present value, SD = standard deviation. 1A1 represents a variation on Kreuger’s (2003) method. 2A2 uses a two-step approach with adolescent achievement skills as the intermediary outcome. 3A3 uses a two-step approach with high school completion as the intermediary outcome. 4A4 assumes that effects will be proportional to those found in Perry Preschool. SOURCE: Magnuson (2009). |
||||
mate, although each has strengths and limitations. They yield different results because each entails making a variety of assumptions and thus reflects the pathways the analyst views as important and outcomes he or she expects to see.
Leveraging Administrative Data
Janet Currie also addressed the problems resulting from the lack of longitudinal data: that they are expensive to collect, that attrition of participants over the years can be a serious problem, and that, by definition, the data produce answers only years after the intervention begins. She offered three approaches to make better use of existing data: (1) posing new questions that can be answered using existing data, (2) merging new information into existing data sets, and (3) merging several existing data sets. She noted that in the United States it can be difficult to obtain the relevant administrative data for these kinds of analyses, but that these approaches have become increasingly common in other countries—particularly Canada and the Scandinavian countries.
Using two studies as examples, Currie discussed the pros and cons of the first approach. Garces, Thomas, and Currie (2002) asked whether a group of adults for whom they had data from the Panel Study of Income Dynamics (PSID) had ever been enrolled in a Head Start program or had attended another preschool, while Smith (2007) compared their health status in earlier years. The PSID was useful for this purpose because it is a long-running study that provides rich information, including a large sample and data from siblings. Currie also observed that retrospective data may contain errors, but that there are strategies to address that problem. For example, one can compare reported participation rates or distributions of characteristics to available confirmed records. She also noted that it is possible to examine only outcomes that are already reported—that is, one cannot go back and examine some other factor, such as family life, for which no data had been collected.
Another study demonstrates the potential of merging new data with existing data sets, which is typically done by geographic area. As discussed in Chapter 2, Ludwig and Miller (2007) used data from the National Education Longitudinal Study of 1988 (NELS) to study the effects of Head Start. The 300 poorest counties in the nation received assistance in applying for Head Start funds when the program was initially rolled out, so they were more likely to have Head Start programs than were slightly richer counties. By drawing on vital statistics and census data, the researchers were able to establish that counties with Head Start programs had lower childhood mortality rates and higher education levels than did poor counties without the program.
The third approach—merging administrative databases—requires the use of confidential information (data with personal identifiers). If this obstacle can be overcome, this approach can provide valuable information. Currie and colleagues (2008) merged data from Canadian public health insurance records with data from the welfare and education systems to examine possible links between health problems in early childhood and future welfare use or lower educational attainment. They found that major health problems at ages 0-3 are predictive of both poorer educational attainment and welfare use, primarily because poor health at early ages is predictive of poor health in the later years. They also found that mental health problems were much more predictive of future welfare use and lower educational attainments than physical health problems.
This approach allowed the researchers to work with a large sample and to create objective indicators—the data were recorded by medical providers. The approach allows sibling comparisons and long followup periods. However, these data sets do not provide much background information. The health measures were dependent on whether or not individuals sought care for a particular problem, although, in this Canadian sample, virtually all children received health care. And, of course, this approach can be used only if administrative data can be accessed by researchers.2
Currie pointed out that privacy concerns are making it more difficult to obtain administrative data, just as methods for using them for new purposes are becoming more feasible. For example, natality data used to include county of birth, but since 2005, this has not been the case. She suggested that creators of large data sets should be sensitive to the fact that their data may well be used to answer questions that have not yet been considered. Thus, they should retain information that can make linkage after the fact easier. For example, geographic identifiers (census tract or zip code) should be retained. Participants could be asked to sign informed consent forms even if they are not immediately needed, since they generally cannot be obtained retrospectively. She also advocated further research on methods for making sensitive data available without compromising people’s privacy. Data in small cells—perhaps for rare outcomes—could be suppressed, for example, or a small amount of statistical “noise” could be added to public-use files to obscure identifications. Data use agreements, such as those used in the National Longitudinal Survey of Youth (NLSY) or NELS, can allow researchers access as long as they agree to various restrictions, such as signing data use agreements, or using only a standalone computer (not a network) for the analysis. Data
swapping—in which those who hold confidential data run a specific analysis for other researchers and then strip out identifying information—is another approach.
In Currie’s view, a great deal of valuable information is locked up in administrative data sets that are not currently accessible—and making use of them could be a cost-effective way to answer important questions. Many participants supported the idea, noting, for example, that “we are not going to be reproducing the Perry Preschool study any time soon, and we don’t want to wait around for 40 years [but] we are going to be implementing these programs.”
Looking at the back-of-the-envelope estimates Magnuson had described as well as Currie’s linkage approach, a participant noted that they are “useful—if you know what the cost is. If even a rough estimate that you think is an underestimate is still higher than the cost of the program that you are thinking about,” you have enough information to go forward. Moreover, these kinds of approaches make it possible to look at far larger samples: “We can break it down for different types of children so we can look at whether there are differences in these patterns by children with different backgrounds or different ethnicities—true data may be best, but we are never going to have large enough samples given the cost of collecting it.”


