
6
Infrastructure and Security
INTRODUCTION
The energy system depends on a massive infrastructure to produce and distribute energy to households and businesses. Table 6-1 gives a rough idea of the amount of fixed assets related to energy production. The infrastructure related to energy production amounted to nearly $2.9 trillion in 2007, or 12% of the value of the net stock of nonresidential fixed assets in that year.1 The bulk of energy-related assets are structures—electricity-generation facilities and mining exploration, shafts, and wells.
In this chapter, the committee considers a variety of externalities that are associated with the energy infrastructure. In particular, we consider disruption externalities in the electricity-transmission grid, the vulnerability of energy facilities to accidents and possible attack, the external costs of oil consumption, supply security considerations, and national security externalities. Where possible, we quantify the externalities that we identify.
DISRUPTION EXTERNALITIES IN THE ELECTRICITY-TRANSMISSION GRID
In the interconnected electric-power system, “reliability” is the degree to which the system delivers power to consumers within accepted standards
TABLE 6-1 Net Stock of Energy-Related Fixed Assets in 2007 ($Billions)
|
Private Fixed Assets |
|
|
|
Equipment and Software |
|
523.9 |
|
Engines and turbines |
83.5 |
|
|
Electrical transmission, distribution, and industrial apparatus |
358.4 |
|
|
Mining and oilfield machinery |
49.5 |
|
|
Electrical equipment, not elsewhere classified |
32.5 |
|
|
Structures |
|
2,120.4 |
|
Power |
1,230.6 |
|
|
Mining exploration, shafts, and wells |
889.8 |
|
|
Government Fixed Assets |
|
241.5 |
|
Power |
241.5 |
|
|
TOTAL |
|
2,885.8 |
|
SOURCE: BEA 2009. |
||
and in the amount desired (Abel 2006). Typically, reliability is good—the nation’s electric-power grid delivers power when needed and within an acceptable quality range.
Occasionally, however, electric outages occur when the demand for electricity exceeds the supply. There are various causes of outages, including equipment failure, extreme weather events, such as ice storms and hurricanes; trees or animals physically damaging parts of the electric system; accidents that damage parts of the system; equipment failure; and operator error. Outages solely from overloads are rare. However, other things being equal, a greater load increases the likelihood of transmission congestion and of decreased reliability. Consequently, there are externalities associated with the consumption of electricity in the sense that when an electricity consumer draws from the grid, this increases the probability that demand will exceed supply and that an outage will occur.
In addition to outages or interruptions in electricity service, voltage sags, harmonic distortions, and other power-quality events occur. Although each event generally causes little damage, except for customers whose commercial activities depend on very-high-quality power, these events occur much more frequently and result in significant annual damage.
The possible externality that an individual consumer imposes when using additional electricity is the expected damage to all other users of the grid from an outage or power-quality event (the damages of an event weighted by the increased risk of an outage from the marginal consumer’s use). The optimal price to internalize this externality would include this marginal damage (unless the costs of implementing such a pricing scheme exceed the benefits). This externality has long been recognized, and as we discuss later, various means of internalizing this externality are in place to varying degrees.
To the extent transmission externalities exist, they apply to all of the electricity-generation options, such as coal, natural gas, oil, wind, and hydropower. However, intermittency in generation has the potential to affect the frequency of outage events, as well as power quality.
The Magnitude of the Electricity-Disruption Externality
To calculate the magnitude of this externality, one needs an estimate of the damages from outages and power-quality events and an estimate of the increased probability of these events occurring because of the consumption of additional electricity. The nature and severity of the impacts of an outage or power-quality disturbance vary and depend on the affected sector (manufacturing, commercial, or residential) and on the specific functions affected, as well as the availability of backup power, the duration of the outage, the time of the year, the time of day, the geographic region, and the extent to which customers are notified prior to the outage.
A number of empirical studies estimating the damages from outages and power-quality disturbances have been undertaken. Some are based on estimates of lost output and damage from actual outages; others value the prevention of an outage. Previous estimates are typically of the total annual cost, cost per kilowatt hour, value of lost load, or damage divided by total kilowatt hour (Primen 2001; Overdomain 2002; Lawton et al. 2003; LaCommare and Eto 2004; Layton and Moeltner 2005; van der Welle and van der Zwaan 2007; Mount et al. 2008). None of these estimates measures marginal damages per se. Table 6-2 provides estimates of average damages for different sectors.
In viewing the estimates in Table 6-2, it is important to note that SAIFI and SAIDI2 estimates were unavailable for the different sectors, so the same overall averages were used for the residential, commercial, and industrial sectors. Anecdotal evidence strongly indicates, however, that commercial and industrial establishments are likely to have backup power and thus less frequent loss of power (lower SAIFI values). Thus, the estimates in Table 6-2 of the average damage per kWh for the commercial and industrial sectors have probably been significantly over-estimated.
The most striking observation from Table 6-2 is that smaller commercial businesses are most vulnerable to outages and power-quality disturbances, especially the latter. Assuming for the purpose of discussion that the estimates of average damage per kWh consumed are over-estimates of these damages in the commercial and industrial sectors by, say, an order of
TABLE 6-2 Estimates of the Average Cost of Outagesa,b
|
Source |
Estimate of Cost of Outages per kWh |
Method Used for Estimate |
|
Lawton et al. 2003 |
Averages over all U.S. regions (costs vary by region) for studies done in 2001 and 2002 |
Meta-analysis—Reviewed previous studies over the past 15 years ending in 2002. Studies were of outage costs conducted by seven electric utilities in 20 studies. Authors also provided ranges, regional breakdown, and duration. |
|
|
Large commercial and industrial—Outages All durations: $0.0038 1-h duration: $0.0029 |
|
|
|
Small-medium commercial and industrial—Outages All durations: $0.015 1-h duration: $0.0083 |
magnitude, they are nevertheless sizeable compared with the average U.S. retail commercial electricity price of $0.094/kWh in January 2008 (EIA 2009k, Table 5.6a).
Although an outage, if it were to occur, would cause greater damage to industrial firms, there are far fewer of them compared with commercial establishments, and industrial firms use much more electric power than commercial establishments. The upshot of these differences is that average damage per kWh consumed in the industrial sector is almost an order of magnitude less than that in the commercial sector. Average damage per kWh consumed in the residential sector is, in turn, about an order of magnitude less than that in the industrial sector. As previously noted, these numbers measure average damages per kWh consumed rather than marginal damages. Not all damages are congestion-related network-disruption damages. It is not possible to disentangle the marginal effect of network congestion’s contribution to outages, apart from other factors. Thus, the numbers in Table 6-1 are upper bounds on (and are probably significantly higher than) the marginal damages from outages and power-quality events due to congestion.
Differences in the Effects of Alternative Electricity-Generation Technology and Fuel Options on Grid Reliability
The effects of renewable energy sources—especially wind and solar—on the reliability of the electric-power grid might be different from those of conventional sources. The timing and duration of wind and sunshine cannot be controlled. Because wind velocities and sun intensity determine power output, it is variable and not entirely predictable. Electricity generally cannot be stored, and transmission is costly. Although reserves and transmission must be provided with any type of electricity-generation technology, the issues are more prominent with some of the renewable energy resources.
There are concerns that, if interconnected to the grid, wind and solar facilities might reduce grid reliability or power quality. More backup sources and power-quality control devices, as well as additional wind or solar capacity to account for their lower capacity factors, might be needed. Transmission lines would be needed to carry power from more remote areas, where some of these facilities would be located, to where power is needed. These measures are costly but could be internalized in market transactions.3
Extent to Which Grid Externalities Are Internalized
The degree to which externalities are internalized is difficult to determine, as there are several ways in which internalization could occur. First, distinguish between the local distribution network and the regional transmission grids. For the former, some of the externalities are probably internalized through pricing by the local distribution companies. Electricity pricing can take many forms (see Borenstein [2005] for a description of different forms of peak-load pricing). For example, it can be implemented through differing block prices for peak and off-peak periods. If these periods and tariffs are pre-established, then this is a form of time-of-use pricing and is common for commercial and industrial customers. Dynamic pricing, which itself has several forms, varies the price dynamically, depending on the load at different times of the day each day. As of 2004, over 70 utilities have experimented with dynamic pricing systems (see Barbose et al. 2004).
For the bulk-level transmission grid, the rule making, standards, and regulations set forth by the Federal Energy Regulatory Commission (FERC) and the North American Electric Reliability Corporation (NERC) help increase reliability and act to internalize some of the externalities. Utilities have long been required to have operating reserve margins. More recently, the Energy Policy Act of 2005 empowered FERC to enforce mandatory reliability standards, set by NERC, which apply to all participants in the bulk power system. In 2007, monetary penalties of up to $1 million per day were established for noncompliance with these standards. Performance-based incentives that allow increased rates of returns on transmission projects intended to reduce transmission congestion costs or increase reliability are another recent development. Regulators may also use performance-based rates that reward utilities for good reliability and penalize them for poor reliability.
Electricity markets are still in their infancy in providing incentives for socially efficient investment in grid infrastructure, especially transmission (Hogan 2008). Transmission-system operators responsible for providing transmission services have an incentive to reduce their private (as opposed to social) costs.4 The transition toward more competitive power markets has resulted in declining reserve capacity because producers are striving to minimize their costs; this situation reflects the lack of adequate incentives to improve power reliability.5
Reserve capacity also has public-good attributes. For technical and economic reasons, it is not possible to prevent customers from benefiting from it, even when they are not paying for the power delivered by that reserve capacity (van der Welle and van der Zwaan 2007).
Reserve requirements, the possibility of fines for noncompliance with NERC reliability standards, and performance-based incentives internalize some of the externalities. However, the extent to which these standards, associated fines, and incentives ensure a certain level of reliability—as measured by frequency and duration of outages—is uncertain. Compliance with many of the standards relies on self-certification, and penalties levied by FERC may be negotiated, possibly with economically inefficient agreements.
Many of the problems with the transmission grid are due to the age of the infrastructure.6 Investing in a modern, “smart grid” will alleviate many of the problems that were noted above. New capital investment also will probably reduce risks associated with intermittent renewable electricity sources. This is an example where technological innovation can reduce or eliminate externalities.
FACILITY VULNERABILITY TO ACCIDENTS AND ATTACKS
The United States has over 1.5 million miles of oil and gas pipelines, 104 operating nuclear plants, 9 liquefied natural gas (LNG) import facilities, 100 LNG peaking facilities, and over 17,000 non-nuclear electricity generators in the United States. The domestic infrastructure to deliver energy is complex and critical to the smooth functioning of the economy. The committee focuses in this section on the following questions:
-
To what extent is the U.S. energy infrastructure vulnerable to accidents and terrorist attacks?
-
To what extent should infrastructure vulnerability be regarded as an externality?
The following subsections explore these questions in the context of four infrastructure areas. Liquefied natural gas is a growing source of natural gas in the United States. LNG facilities are large and complex and have been the source of some community concern over safety. Oil transportation and storage are vulnerable to accidents and spills. The oil and gas pipeline network is extensive and critical to the flow of gas and oil around the United States. Finally nuclear power accidents continue to be of concern to the public.
Analyzing these forms of energy infrastructure sheds light on the nature of externalities associated with our production and consumption of energy.
LNG Infrastructure and Hazards
The infrastructure associated with LNG distribution in the United States includes tankers used to transport the gas from foreign ports, import terminals which are dedicated to LNG, and inland storage facilities. There are nine operating terminals within the United States (Parfomak 2008). The most significant hazards associated with LNG infrastructure include a pool fire, which occurs if there is a spill that is ignited, or flammable vapor clouds, which occur if there is a spill that is not immediately ignited. In this case, the evaporating natural gas can travel some distance and during that time is at risk of ignition. Other safety hazards include LNG spilled on water that may be able to regasify and cold LNG that can injure people and damage physical structures. Because LNG dissipates with no residue, the only environmental damages that might occur would be linked to fire or cold damage. Finally, terrorism hazards that are directed at ships carrying LNG and at land facilities are also a risk.
These damages can be associated with damage to a tanker, terminal, or inland storage facility. The most dangerous possibilities include a spill on water because such a spill could spread the farthest and, if ignited, seriously harm people and property at some distance. The safety record of tankers carrying LNG is quite good; since international shipping started in 1959, no spills have occurred, although a few groundings and collisions have occurred (Parfomak 2008). Tankers are double-hulled and engage GPS, radar, and other safety systems to reduce the risk of accidents and grounding.
In contrast to tanker safety, a number of incidents at terminals and onshore storage facilities have occurred. Worldwide, there are over 40 terminals and 150 onshore storage facilities, and there are 13 known accidents at those sites reported since 1944. These data are summarized in Table 6-3. No LNG tankers fly under the U.S. flag, so only a worldwide number is reported for number of tankers.
The number of serious accidents has been quite small, only 13 since 1959, with 29 fatalities and 74 injuries. With such a small number of incidents, it would be difficult to extrapolate from the historical data to estimate expected damages in the future. On average, over 260,000 million cubic feet of LNG has been imported or exported by the United States annually since 1985 (EIA 2009l). In this context, the apparent risk of accidental injury, death, or property damage is small.
A number of studies have quantitatively evaluated the hazards and risk of accidents or terrorist attacks, largely on a facility by facility basis. Parfomak and Vann (2008) summarized recent and most cited studies in
TABLE 6-3 LNG Infrastructure and Safety Recorda
|
Infrastructure Type |
Worldwide Numbers |
U.S. Numbers |
Expected Growth |
Serious Incidents Since 1959 |
Fatalities |
Injuries |
|
Tanker Ships |
200 |
Not relevant |
200 more worldwide by 2013 |
0 |
0 |
0 |
|
Terminalsd |
40 |
10 |
21b |
13c |
29 |
74 |
|
Storage Facilities |
>150 |
103 |
Not available |
|
|
|
|
aThe data in this table are taken from Parfomak and Vann (2008). bSix terminals have been approved and are under construction in the United States; another 15 have been approved, but construction has not yet begun. cData on accidents, fatalities, and injuries are not separately reported for terminals and storage facilities. These numbers represent the worldwide sum since records are available. dThese numbers reflect import and export terminals. |
||||||
their Table 6-2. A report prepared for the U.S. Department of Energy by Sandia National Laboratories summarizes and assesses four of those studies to develop estimates of the damages of a large pool spill from a tanker over water. The report does not monetize damages but provides estimates of numerous end points of damage (for example, asphyxiation, cryogenic burns, and structural damage).
Based on its review, the Sandia report provides estimates of the effects of various small- and large-scale accidents and intentional damage. For example, the report provides estimates of the size of a pool fire from different sizes of holes of a tanker breach, the size of the pool, the distance of thermal hazards, and the burn time. This information could be combined with data on population density and on monetary damages of death, injury, and property loss to quantify this externality at least for specific locations. However, the committee did not attempt such quantification. Further, the small risk of these incidents suggested by the historical record implies that the magnitude of this externality relative to other energy-based externalities is likely to be small.
The LNG industry faces unlimited liability for damages from accidents. In fact, fines have been large in the case of a pipeline fire in Bellingham, Washington, in 1999 and in training violations at the Everett, Massachusetts, LNG terminal. These facts suggest that the risk of accidents and spills is internalized in the LNG industry. In addition, private insurance held by facility owners contributes to internalization of the externality.
Finally, LNG tankers and facilities face considerable regulatory oversight. The Coast Guard has responsibility (and bears the cost) for shipping
and terminal security, the Office of Pipeline Safety and the Transportation Security Administration have security authority for LNG storage plants and terminals, and the Federal Energy Regulatory Commission approves facility siting in conjunction with the other three agencies.
The Coast Guard estimated that it incurs about $62,000 to accompany a tanker through Boston harbor to the Everett facility. This figure, combined with estimates of policy, fire, and security costs incurred by the cities of Boston and Chelsea and the state of Massachusetts, suggests that these “shepherding” costs run to about $100,000 per tanker. Although public costs of providing safe passage to tankers or of assessing health and safety standards are not externalities (they represent the costs of mitigating the externalities), these costs will not be represented in the market price of energy unless there are requirements that industry pay some of the costs. This provides another example of a situation in which private costs do not reflect social costs in ways that are unrelated to externalities. Here, the divergence arises from the government provision of services that are not priced in the fuel.
Oil Spills from Ships and Facilities
Oil is transported by tankers, barges, and other vessels where oil can be accidentally spilled during its transfer between vessels or where an accident can occur on a vessel itself. Oil is stored in a variety of facilities where spills are possible. A number of highly publicized oil spills have occurred in the previous two decades that have increased the public’s awareness of the ecological harm and other damages that such spills can cause. Seabirds, marine mammals, a variety of reptiles and amphibians, fish, and invertebrates are all at risk of death or injury when they come into contact with oil. In addition, many coastal and wetland habitats can be significantly altered by the presence of large quantities of spilled oil, and oil spills deleteriously affect human use of the environment when recreational sites are damaged and when commercial activities are harmed (such as fishing or shrimping). Important cultural sites can also be damaged by these spills (Ramseur 2008).
Data on the prevalence and size of oil spills that occur on U.S. soil are collected and maintained by the U.S. Coast Guard. Table 6-4 reports the average number of spills in the United States between 1990 and 1998 as well as the average amount of oil spilled (in gallons).7
A number of studies of the damages caused by oil spills have been com-
|
7 |
More detailed information on the source and type of spills can be obtained in Table 2-2 from Oil in the Sea III: Inputs, Fates, and Effects (NRC 2003c). The report also contains detailed estimates of spills worldwide. |
TABLE 6-4 Average Number and Volume of Oil Spills on U.S. Soil, 1990-1998a
|
|
|
Annual Number per Year |
Volume per Year (gallons) |
|
Total |
|
8,831 |
2,645,247 |
|
Spills by size |
<100,000 gal |
8,828 |
1,163,484 |
|
|
>100,000 gal |
3 |
1,481,763 |
|
Spills by source |
Tanks and barges |
506 |
1,273,950 |
|
|
Other vessels |
4,214 |
344,621 |
|
|
Facilities and unknownb |
4,055 |
776,263 |
|
aData from the U.S. Census 2006. bData exclude spills from pipelines—information on pipeline spills is contained in the following section of the report. |
|||
pleted (for example, Cohen 1995; Garza-Gil et al. 2006). Talley (1999) estimated the property damage costs from tanker accidents but did not attempt to consider environmental damages. Overall, little research is available to estimate the expected damages from spills that could be appropriately attributed on a per gallon transported basis. One exception is the study by Cohen (1986) in which estimates of the per gallon benefits of avoiding oil spills are given. On the basis of the compensation payments from 11 spills and in-depth environmental damage studies from four large spills, Cohen estimated a $6.08/gallon benefit of avoided spillage for reduced environmental damages, $1.72/gallon benefit for avoided loss of oil, and $6.93/gallon for avoided cleanup costs (values converted to 2007 dollars). The first of these categories clearly represents an externality of interest to this committee, and the second is a private cost and therefore not relevant for this study. The third component is also not an externality—it represents the costs of cleaning up an externality once it has occurred. However, if the optimal level of cleanup is chosen, then the marginal damages averted through cleanup would equal the marginal costs of cleanup and we could use this third component as a proxy for the damages averted through cleanup, giving aggregate marginal damages of $13.01 per gallon spilled.8
We need to convert from damages per gallon spilled to damages per gallon produced or consumed. According to data reported in Huijer (2005, Table 2),9 tanker spills worldwide averaged 115,810 barrels between 2000
|
8 |
To be clear, Cohen (1986) estimated average damages but assumed they were a proxy for marginal damages. A convex damage function using average damages underestimates marginal damages. |
|
9 |
Paper cited at http://www.itopf.com/information-services/data-and-statistics/statistics/#quantities. |
and 2004. Average global oil-trade movements over that period were 16.7 billion barrels per year (BP 2008, p. 20). Not all of these trade movements were over water. Casual inspection of the inter-area trade in oil suggests that nearly 80% of oil trade is by ship. To be conservative, assume that one-half of oil trade occurs by ship. Then the ratio of oil spilled to oil shipped is 115,810/(0.5 × 16.7 billion) = 0.0000139, or one barrel spilled for every 72,000 barrels shipped. Applying this percentage to the marginal damages per gallon spilled and converting gallons to barrels gives marginal damages of $0.0076 per barrel shipped.10
In 1990, the Oil Pollution Act was passed by Congress; it imposed comprehensive liability for spills. The U.S. Coast Guard promulgated a number of regulations as part of the act that included the requirement that all tanker ships have double hulls by 2015. There is also evidence that these requirements and negative publicity have resulted in the improved safety records of the industry. Etkin (2001) and Homan and Steiner (2008) reported data from the U.S. Coast Guard showing a general decline in ship and barge spills during the 1990s. Homan and Steiner’s analysis of the data supports the interpretation that this decline is attributable to the requirements that came after the passage of the act. However, a GAO report (2007, p. 28) notes that limits to liability to the responsible parties exist, and although these limits have recently been increased, they may still not be high enough to cover all potential damages. For a complete description of the various federal and international laws and liability rules, see Ramseur (2008). On the basis of the above information, there has been at least partial internalization of the externalities from oil spills.
Oil and Natural Gas Pipelines
The United States depends on a large network of pipelines to move natural gas and oil around the country. A National Research Council report (TRB 2004) notes that nearly all natural gas and roughly two-thirds of petroleum are moved through transmission pipelines in the United States. Transmission pipelines are only one part of the national pipeline network that includes gathering, transmission, and distribution pipelines.
Table 6-5 provides information on significant pipeline incidents in the United States on an annual basis for the period 2002 through 2006. A significant incident is an incident in which at least one of the following
TABLE 6-5 Annual Averages for Significant Pipeline Incidents, 2002-2006
conditions occurs: (1) fatality or injury requiring inpatient hospitalization, (2) $50,000 or more in total costs, (3) highly volatile liquid releases of five barrels or more or other liquid releases of 50 barrels or more, or (4) liquid releases resulting in an unintentional fire or explosion (BTS 2009).
The table provides information on hazardous liquid pipelines. Hazardous liquids are defined by the Office of Pipeline Safety (OPS) as petroleum, petroleum products, and anhydrous ammonia. Most hazardous liquids moving through the pipeline are petroleum or petroleum products. Nearly half of the incidents reported to OPS are associated with hazardous liquids and are triggered by releases of 50 barrels of oil or more.
The table shows that the distribution of natural gas is responsible for the bulk of fatalities and injuries and over half of the property damage arising from significant incidents. Nearly 80% of natural gas pipeline stock in 2006 was distribution pipelines, transmission making up most of the rest (BTS 2009, Table1-10).
Table 6-6 provides information on incidents per mile of transit averaged over the 2002-2006 period. Scaling by the amount of gas traveling through pipelines indicates that the incidences of fatalities, injuries, and property damage are highest in the gathering pipelines.
An alternative way to scale the damages is to report fatalities, injuries, and property damage per unit of oil or natural gas consumed in the United States. Using the average fatalities, injuries, and damages from Table 6-5 over 2002 through 2006 and average consumption of oil and gas over that same period, we measure 0.29 fatalities and 0.90 injuries per billion barrels of oil that is delivered to refineries in the United States and $18 of
TABLE 6-6 Annual Averages for Pipelines per Ton Miles, 2002-2006
property damage per thousand barrels of oil. For natural gas, the numbers are 0.72 fatalities and 2.30 injuries per trillion cubic feet of natural gas consumed and $12 of property damage per million cubic feet of natural gas consumed. The property damage and injuries are modest and probably internalized to a great extent. These damages are not considered in the subsequent analysis.
Nuclear Power Accidents
In addition to potential damages associated with generation of electricity through nuclear technologies (see Chapter 2), there are several potential external costs associated with the potential for a nuclear accident. Unlike the situation with other potential damages associated with nuclear technologies, these possibilities are distinctive in that two well-studied accidents have already occurred (Three Mile Island and Chernobyl), providing the basis for widespread public concern about the issue. Specifically, the following considerations have been raised:
-
To what extent does the existing technology alter the probability and damage functions associated with an accident for the existing facilities or those under design.
-
To the extent that the above can be quantified, to what extent have they been internalized by existing regulations, insurance requirements (including liability costs required by regulations) or other market mechanisms.
Unlike the speculation surrounding nuclear-waste issues, the experience at Chernobyl highlighted both the extent of potential local damages and the spread of damages over a wide region, having health and other impacts demonstrated thousands of miles away. For example, Almond et al. (2007) found that Swedish children who were in utero during the Chernobyl accident had worse school outcomes than adjacent birth cohorts. Moreover, in the absence of technological change, it seems reasonable to assume that risks will increase in proportion to the expansion of nuclear power; that is, each new facility engenders an additional, theoretically calculable risk. These risks vary, depending on geography and population distribution but may affect large regions.
That recognized, there are abundant data to suggest that the risk going forward, at least in the United States, will be dramatically lower than it has been in the past based on advances in the technology and regulations, including most recently the Energy Policy Act of 2005. There appear to be no comprehensive direct estimates on which to base a numerical cost estimate.
The magnitude of the externality depends in large part on the extent to which insurance accounts for these costs. If the industry were fully insured against all risks from accidents, then there would be no external damages not reflected in market prices. The Price-Anderson Act regulates and establishes insurance pools and limits liability for the nuclear industry. The act, enacted in 1957 and revised in the Energy Policy Act of 2005, requires all commercial nuclear power plants to carry liability insurance in the amount of $300 million.11 In the event of an accident that creates losses in excess of $300 million, each commercially active reactor is to be assessed an amount up to $95.8 million (payable over several years with annual payments capped at $15 million) for a total pool of approximately $10 billion. The industry is exempt from any liability in excess of this amount. Insurance covers “bodily injury, sickness, disease, or resulting death, property damage, and loss as well as reasonable living expenses for individuals evacuated.” (U.S. NRC 2008d). Over its history, a total of $150 million has been paid in claims under the Price-Anderson Act, the accident at Three Mile Island in 1979 accounting for nearly half. As of 1997, over $70 million had been paid out in indemnity settlements and expenses from this accident (ANS 2005). Claims have been paid through the primary insurance held by each plant; the supplemental assessments have never been required.
The appropriate measure of any uninternalized externality arising from insufficient insurance depends critically on the distribution of damages from potential nuclear reactor accidents in excess of the supplemental assessment (approximately $10 billion). Estimation of these low-probability and high-
consequence events is difficult, in part because the events are sufficiently rare (fortunately) that empirical data are lacking.12 Jones et al. (2001) suggested that uncertainty about key factors associated with population dose and human fatality risk in the event of a release of radioactivity is such that the true value could be 10 times larger or smaller than the central estimate. Because estimates of the consequences of low-probability events are calculated by multiplying several of those factors together, the resulting estimates could be wrong by several orders of magnitude.
The component of the externality that is internalized includes the primary insurance required of each operating unit plus the risk of the supplemental assessment that might be required in the event of an accident causing damages in excess of $300 million. The probability that this supplemental assessment will be levied is again difficult to estimate; to date, it has never been required. The component associated with primary insurance that covers the first $300 million of damages might be estimated from the premium paid—approximately $400,000 per reactor-year (U.S. NRC 2008d), roughly $0.50 per MWh of electricity production. (The 104 operating units produced an average of 80 GWh in 2007.) This quantity overestimates the expected value of the first $300 million of losses (because it includes insurers’ administrative costs) but is likely to underestimate the total externality, as it excludes the expected value of damages exceeding $300 million per incident.
EXTERNAL COSTS OF OIL CONSUMPTION
The United States is a large consumer of oil. In 2007, it consumed over 20 million barrels of oil a day, representing one-quarter of world oil supply (see Table 6-7). Imports as a share of domestic consumption have steadily risen over time to their current level of nearly 60% and are not projected to decline greatly over the next 20 years. Meanwhile, OPEC (Organization of Petroleum Exporting Countries) continues to be an important source of world oil supply with its share projected to rise to nearly 50% by 2030. While U.S. consumption continues to grow, the importance of oil in the
TABLE 6-7 U.S. Oil Dependence
|
|
1990 |
2000 |
2007 |
2030 |
|
Net oil imports as percentage of total U.S. Supply |
42.2 |
52.9 |
58.2 |
55.5 |
|
World oil price (2007 $/BBL) |
38 |
35 |
72 |
60 |
|
World crude production (million BBD) |
65.5 |
74.9 |
81.5 |
102.9 |
|
OPEC share (percentage) |
38.3 |
42.9 |
43.2 |
46.4 |
|
U.S. petroleum consumption (million BBD) |
17 |
19.7 |
20.7 |
22.8 |
|
U.S. share of world production (percentage) |
26.0 |
26.3 |
25.4 |
22.2 |
|
Oil intensity (1,000 Btu/GDP) $2000 |
4.7 |
3.9 |
3.4 |
2.2 |
|
Oil intensity (value of oil as a percentage of GDP) |
2.6 |
2.0 |
3.6 |
1.9 |
|
ABBREVIATIONS: BBL = billion barrels, BBD = barrels per day, Btu = British thermal units; GDP = gross domestic product. SOURCES: BP 2008; EIA 2008a,b,g. |
||||
economy continues to decline. Oil intensity (measured as 1,000 British thermal units of oil consumption per dollar of gross domestic product [GDP]) has fallen by over one-quarter since 1990 and is projected to fall an additional one-third by 2030. Rising oil prices, however, offset the declining physical intensity; thus, the value of oil consumption in GDP is projected to remain at about 2% (although down from its anomalous level of 3.6% in 2007 and the sharp run-up in prices that year).
The importance of oil in the U.S. economy has given rise to a large amount of literature measuring the external costs of oil consumption.13 Parry and Darmstadter (2003), for example, attempt to quantify the marginal external cost of petroleum consumption, defined as “the difference between the costs to the U.S. economy as a whole and that to individuals or firms from additional oil consumption. Marginal external costs, expressed in $/BBL [barrels], are referred to as the oil premium” (p. 11).
In this section, we consider three questions:
-
What is the oil premium?
-
Is the oil premium an externality?
-
How does the oil premium relate to the optimal tax on oil consumption or imports?
What Is the Oil Premium?
As the quotation from Parry and Darmstadter (2003) above indicates, the oil premium is a measure of the difference between the private and so-
cial costs of petroleum consumption measured in dollars per barrel. The literature identifies two major quantifiable sources of the discrepancy between private and social costs—U.S. monopsony power and economic disruptions arising from unanticipated price shocks. We discuss these in turn.
The literature on monopsony power takes as its point of departure the observation that the United States is a large consumer of oil. As such, any policy to reduce domestic oil demand reduces the world oil price and benefits the United States through lower prices on the remaining oil it imports. The oil premium arising from monopsony power reflects the lack of recognition by individual consumers to the buying power that the nation has if it acts in a coordinated fashion.
Figure 6-1 illustrates the idea of monopsony power. On the basis of individual demands for oil, aggregate demand is given by the downward sloping curve marked D. With an upward sloping supply curve for oil, the market equilibrium occurs at point e where Q0 barrels of oil are consumed at price per barrel P0. If the U.S. government takes some action to reduce oil demand from D to D′, the world oil price falls from P0 to P1. The gain to consumers from the fall in oil price is the rectangle P0P1fg. This is offset
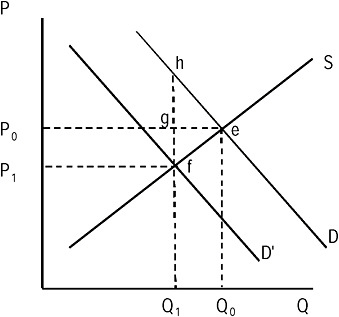
FIGURE 6-1 Illustration of monopsony. D = aggregate demand; e = market equilibrium Qo consumption and P0 price; f = market equilibrium for Q1 consumption and P1 price; P= price per barrel of oil; Q = barrels of oil consumed.
by losses to producers in oil revenue (equal to the same rectangle).14 If all supply comes from domestic production, there is no gain to the United States. The gain to producers is exactly offset by the loss to U.S. producers. If all supply comes from non-U.S. producers, the gain to U.S. consumers is financed by a transfer from other oil-producing countries. This gain is the monopsony benefit identified in the literature. The marginal oil premium is the incremental income transfer to U.S. consumers from foreign producers from a small reduction in demand for oil arising from a U.S. policy. One policy that would give rise to this income transfer is a tax on oil consumption. In Figure 6-1, an excise tax of fh per barrel would shift demand from D to D’ and lower demand from Q0 to Q1. Because the tax (ignoring the efficiency costs of taxation for the moment) is simply a transfer within the United States, the result follows.
The literature on oil consumption correctly notes that private markets in the United States do not account for the potential market power that U.S. consumers could wield in world oil markets. The literature also generally recognizes that any policy to take advantage of consumer purchasing power affects a transfer from foreign oil producing nations to the United States. Such a “beggar thy neighbor” policy has been justified on the grounds that OPEC is artificially inflating world oil prices at the expense of consuming nations and that the exercise of monopsony power is a countervailing policy.
Disruption costs have also been identified as a cost that is not incorporated into the price of oil. Leiby (2007) identifies two components of a disruption premium. First, a cost increase increases transfers of U.S. wealth from domestic consumers to foreign producers. The magnitude of this transfer depends on the price increase and the amount of oil imported into the United States. Second, cost increases induce shocks to the economy, resulting in losses in economic output, income, and jobs.
Is the Oil Premium an Externality?
The committee considers the two components of the oil premium in turn. With respect to the issue of monopsony power, it is unquestionable that domestic policy can reduce aggregate demand and lead to a reduction in the world price of oil. Such a policy would generate a transfer in wealth from foreign oil producing nations to the United States.15 However, the ability to exercise monopsony power is not the same as an externality.
Externalities create a market failure. Exercising monopsony power creates a market failure where one did not exist before. In Figure 6-1, the exercise of market power creates deadweight loss equal to the triangle efh.16 In fact, this market failure is designed purely to transfer income from another country to the United States.
Bohi and Toman (1995) noted that the exercise of monopsony power is an example of a pecuniary externality designed to shift wealth from one nation to another.17 They pointed out that the existence of market power on the part of energy producers complicates the analysis slightly. For one thing, market power leads to the creation of rents that transfer wealth from energy-consuming to energy-producing countries. The exercise of monopsony power can then perhaps be justified as a countervailing policy to prevent the excessive transfer of wealth from consuming to producing countries. Although this justification might provide a legitimate political reason to undertake such an action, we should stress that no externality in the sense considered in this report exists for this policy.18 That the ability of the United States to exercise monopsony power is not an externality is recognized by Leiby (2007) and Greene (2009) among others. Green noted that the “costs of oil dependence are not external costs and neither a tax on oil nor a tax on imported oil is an adequate solution to the problem,” although Green argued that either of these taxes can ameliorate the problem (see pp. 10-11 in Green 2009).
Turning to disruption costs, we consider the following questions. First, is macroeconomic disruption an externality? Second, if it is an externality, is the cost substantive and quantifiable? On the first question, most economists that have studied this issue would agree that abrupt increases in oil prices adversely impact the economy. Differences arise over the magnitude
|
16 |
If OPEC is exercising cartel output restricting power, then the exercise of monopsony power adds to a pre-existing distortion, and the deadweight loss is slightly more complicated than suggested by the triangle in Figure 6-1. |
|
17 |
A pecuniary externality is not an externality in the sense defined in Chapter 1. Rather it is a transfer of income or wealth arising from some action or policy that is transmitted through the marketplace. Unlike standard externalities, pecuniary externalities do not involve any loss of efficiency. |
|
18 |
The use of monopsony power to extract rents from an energy cartel raises the question of the response by the cartel to the use of this power. An optimizing cartel will wish to raise the price to offset the exercise of monopsony power. However, it will be unable to recover all of the rents extracted by the use of monopsony power. A clumsy cartel (viz. Adelman [1980]) may be able to retaliate in a way that raises their profits. Such retaliation would simply reflect their previously nonoptimizing behavior. The analysis in Figure 6-1 assumes a competitive market supplying the product. How a cartel responds affects the welfare transfer to the United States. Alhajji and Huettner (2000) statistically rejected the hypothesis that OPEC acts as a cartel. They could not reject the hypothesis that Saudi Arabia acts as a dominant firm. In this view, Saudi Arabia can influence world oil prices but not OPEC member production decisions. |
of the impact and the extent to which other events and actions play a role in magnifying the impacts.19 The most recent run-up in oil prices in 2007 and 2008 was in large part a demand shock coupled with stagnation in supply, according to Hamilton (2009). Hamilton argued that the onset of the current recession would have been delayed from the fourth quarter of 2007 to the third quarter of 2008 in the absence of the price run-up (Hamilton 2009).
That there are links between oil shocks and economic performance is uncontroversial. Leiby (2007) estimated the macroeconomic disruption and adjustment costs for 2006 market conditions. Leiby reported a mean estimate of $5.14 per barrel (2007 dollars) and a range from $2.39 to $8.57 per barrel.20 Does this imply an externality associated with oil consumption? The literature on the oil premium and the oil disruption component focuses on measuring the relationship between incremental oil consumption and its effect on disruptions to economic activity. We believe that oil disruption costs are not an externality. That said, it is certainly the case that policies that result in a reduction in oil consumption in the United States will most assuredly reduce vulnerability to future oil shocks.
In summary, quantifying this possible externality is a challenge. The cost depends importantly on the type of shock and policy response. Changes over time in economic institutions also pose a challenge to measuring the size of this externality. Given the conceptual difficulties in identifying the basis for and size of the externality, we do not think that it makes sense to include a disruption cost as a component in the list of externalities associated with the production or consumption of energy. We do recommend that further research be carried out to better understand this issue.
SECURITY OF ENERGY SUPPLY
Concerns about the security of the energy supply (as distinct from national security as discussed in the next subsection) arise from the possibility that resources may become unavailable. Security concerns may pertain to energy sources (for example, oil, natural gas, and uranium) or materials that are critical for energy production, distribution, or consumption (for example, lithium for lithium-ion batteries). Risk of disruption exists when supply is dominated by one or a few countries (or facilities) that are unreliable (for example, unstable in ways that may disrupt operations, as from
civil strife within the country) or that may choose to restrict supply for political or other objectives (for example, the OPEC oil price shocks).
We argue that these sources of insecurity are not an externality. They are supply conditions that are presumably incorporated in market outcomes. For example, buyers of a resource that is subject to risk of supply interruption will seek ways to reduce the risk of disruption, or the harm if disruption occurs, through reducing reliance on the resource, seeking alternative suppliers, maintaining a stockpile, having financial insurance, and other measures. The expectation that demand for the resource would increase if its supply were more secure provides an incentive for suppliers to develop methods for enhancing security.
NATIONAL SECURITY EXTERNALITIES
Energy is inextricably linked with national security. The U.S. demand for oil contributes to high oil prices that provide support for hostile foreign regimes with large reserves of oil. Second, dependence on foreign energy sources creates dependencies that may constrain foreign policy. Third, some have argued that the oil price paid by U.S. consumers does not reflect the true cost of oil, in particular the cost of U.S. military presence in the Middle East or of maintaining military readiness to protect oil supply lines. The committee discusses these issues in this section.
Energy and Foreign Policy Considerations
High oil prices provide a source of revenue for countries with foreign policies at odds with the United States (for example, Iran and Venezuela). One could make the argument that U.S. consumers do not take into account that their oil consumption contributes to actions by foreign countries that negatively impact the United States.
A simple analogy illustrates the problem with viewing that situation as an externality. Let us assume that my neighbor burns trash in his backyard that causes pollution that adversely affects my household. This is a clear externality. Further assume that I purchase commodities in a store owned by my neighbor. My consumption thus provides income for my neighbor that leads him to purchase more commodities and produce more trash to be burned. My purchase of goods from my neighbor’s store is not an externality. Rather, the neighbor’s burning of trash is the externality. Restricting (or taxing) my purchases indirectly reduces the externality, but it does so in a highly inefficient manner. It would be more efficient to address the externality directly.
In a similar vein, U.S. oil consumption that enriches countries with which the United States has differences is not an externality. Rather, U.S.
consumption makes inimical actions possible. In the absence of any ability to address the foreign policy problem directly, it may be desirable to reduce oil consumption to lower world prices. However, such an effort would be an imperfect proxy for better targeted instruments and would hurt oil-producing friends and foe alike.21
In addition to funding activities that are inimical to U.S. interests, rising oil prices may weaken the instruments of economic statecraft. One could argue, for example, that high oil prices through the latter half of 2008 rendered economic sanctions on Iran for its nuclear activities ineffective.22
Dependence on foreign energy sources may constrain U.S. foreign policy. For example, the Bush administration’s goal of furthering the spread of democracy in the world was constrained by U.S. ties to major oil-producing states with autocratic regimes in control. The 2006 report by the Council on Foreign Relations on U.S. oil dependency noted that oil dependence can cause “political realignments that constrain the ability of the United States to form partnerships to achieve common objectives. Perhaps the most pervasive effect arises as countries dependent on imports subtly modify their policies to be more congenial to suppliers. For example, China is aligning its relationships in the Middle East (e.g., Iran and Saudi Arabia) and Africa (e.g., Nigeria and Sudan) because of its desire to secure oil supplies” (Deutch and Schlesinger 2006, pp. 26-27).
Deutch and Schlesinger also noted that oil revenues can undermine efforts to support good governance. This is another example of the way in which oil revenues can undermine the tools of economic statecraft. Russia, for example, is less responsive to efforts to promote democracy when it has ample oil and gas revenues that reduce its reliance on Western economic assistance.
Having constraints placed on foreign policy goals because of oil dependency is arguably an externality that is not recognized in the price of oil, but consider two points. First, it is not clear what the incremental reduction in these costs would be were the United States to reduce its oil consumption by a modest amount (say, 10%). Second, it is not clear that this cost could be monetized even if the marginal cost were positive. Therefore, the committee notes the possibility of dependence on imported oil being an externality and recommends further research on this topic to better understand these important issues.
Energy and Military Considerations
The argument has been made that the true cost of oil does not reflect the cost of maintaining a military presence in the Middle East or of maintaining a military preparedness. Parry and Darmstadter (2003) reported that analysts generally do not include this cost in any exercise to measure an oil premium for two reasons. First, it is difficult to disentangle military spending for such political goals as reducing terrorism or providing support for Israel from spending to protect oil supply routes. It is also unlikely that whatever spending is specific to securing the supply routes would change appreciably for a moderate reduction in oil flowing from that region to the United States. In other words, the marginal cost is essentially zero. This view is held by a number of other researchers in the area, including Bohi and Toman (1995). The committee adopts this position. We note, however, that military expenditures could be affected by a large drop in oil consumption—for example, a reduction in oil consumption to zero. Measuring the impacts on military spending (or for that matter on a host of economic and political responses) from a large change in oil consumption would require extrapolating existing statistical evidence well out of a sample. To do so would give rise to—at best—speculative estimates. We would go further and argue that military spending—to the extent it occurs to safeguard oil-production sites and transportation lanes—is a government subsidy to production. It replaces the need for private security expenditures that would otherwise have to be incurred to provide equivalent protection for oil production and transport.
Nuclear Waste and Security
In addition to the potential health and environmental damages associated with generation of electricity through nuclear technologies (see Chapter 2), several potential external costs are associated with nuclear security. Specifically, the following considerations have been raised:
-
To what extent does the transportation and deposition of fissionable material post-use represent an increased opportunity for terrorists or other parties interested in unlawful use of the material?
-
To what extent does the long-term deposition of fissionable material create risk of catastrophic accidents above and beyond the theoretical risk of nuclear accidents at the sites?
-
To the extent that either of the above costs can be quantified, to what extent have they been internalized by existing regulations, insurance requirements (including liability costs required by regulations), or other market mechanisms?
Concerns about the environmental hazard of nuclear waste, which may continue to emit radioactive particles for thousands to millions of years, has been the subject of national debate as an environmental question for decades and came to a head after the incident at Three Mile Island. At that juncture, congressional legislation created an affirmative obligation of the federal government to provide long-term storage in the future, although this was not accomplished by 1998, and the U.S. government has been paying liability payments of approximately 0.5 billion dollars per year to the operators of the existing 104 nuclear power facilities for this failure. The facilities remain under private control but are regulated tightly by the U.S. Nuclear Regulatory Commission.
During the cold war, the Nuclear Regulatory Commission developed plans to protect sites from “enemies of the United States” based on “design-based threat” scenarios contained in a series of classified documents, but not until after 9/11 did the reference point change to consider nuclear waste as potential materials for harm—probably one of the reasons for legislative progress since that time, most notably the Energy Policy Act of 2005 (EPACT), which by all accounts has led to substantial upgrades in security procedures and oversight by the Nuclear Regulatory Commission (NRC 2005, GAO 2006). However, the NRC report in 2005 concluded that, despite progress, there remained at least some finite risk of security breaches at existing or planned sites and made a series of recommendations to further enhance security. However, neither the probability of such a breach nor the damages that might ensue, either locally or in the aggregate, have been estimated in quantitative terms.
Specific to the waste storage issue, DOE finally submitted to the Nuclear Regulatory Commission in 2008 the formal license application to operate a national waste-material repository at Yucca Mountain, Nevada, and provided extensive estimates of the cost in the range of $100 billion through 2030. Almost as quickly, the new administration announced its intent to abandon this project, but the future strategy for waste disposal remains open. The case for a deep central repository such as the one proposed, in addition to the potential economic efficiency and compliance with earlier legislation, is that security would be more readily achieved at a single site than at many, an argument that has not won favor among some near the site. As with the broader security issues at the nuclear facilities, probabilities of an adverse event involving waste storage, under the current (disseminated) or envisioned (single-site) schemes have not been quantified, nor have the potential damages under any scenario.
A further level of complexity relates to emerging technologies to modify the life cycle of nuclear fuels at the back end to reduce the long-term storage need. Simplifying the principle, reprocessing of spent fuel could, based on current knowledge, result in reuse of the material to extract almost all of
its radioactivity; this approach is also being taken to achieve sustainability in all materials cycles. Although this may in the future displace in part or whole the security risks associated with storage, the technology itself, including the new facilities created and the likelihood that the reprocessed materials would need at various phases to be transported, creates new risks, for which neither the costs of appropriate controls nor any estimate of risk of breach has been calculated.23
Finally, it must be mentioned that there is also some potential in the security arena for external benefit from expanding the American nuclear energy capability, namely, the likelihood that the United States and its government could be proportionately more influential in global nuclear negotiations. Based on current developments, it is a certainty that many countries will turn to nuclear energy as the best solution to their energy needs, including many that are politically unstable or hostile to the United States; the potential that the United States could be a leader, both technologically but also politically, hinges, in the views of some (NEAC 2008), on the degree to which the United States also follows this energy pathway.
Taking the available information, the committee concludes as follows:
-
The direct cost of nuclear storage under present and envisioned scenarios is high, but the potential for damages from security breaches not incorporated in these costs cannot be quantified. Even if the probability of such an event or its damages could be quantified, it would still be impossible to calculate the marginal cost—that is, the risk of an additional facility to a world still populated with nuclear warheads and with many foreign countries already committing to a nuclear energy future.
-
As with other damage possibilities associated with the generation of electricity, the distribution of potential damages is certain to be unevenly shared. The move to Yucca Mountain or another centralized storage site, if approved, would probably reduce aggregate risk but obviously increase local and regional risk; conversely, a centralized site would reduce local and regional risks at the 100-plus sites where waste is currently disposed at U.S. government cost and at all future locations.
-
It is also difficult to assess the extent to which the potential damage from security risk has already been internalized. Certainly, the net upgrade of security requirements brought about by EPACT and other post-9/11 Nuclear Regulatory Commission changes has internalized some of the costs. However, because taxpayers presumably bear some of the costs in the event of a high-cost security incident (through an implicit commitment to compensate victims of the event through government relief), the degree
-
to which the market has internalized these risks is difficult if not impossible to measure.
CONCLUSION
In conclusion, the committee finds the following:
-
The nation’s electricity-transmission grid is vulnerable to failure at times because of transmission congestion and the lack of adequate reserve capacity. Electricity consumption generates an externality because individual consumers do not take into account the impact their consumption has on aggregate load. Damages from consumption could be significant, and it underscores the importance of investing in a modernized grid that takes advantage of new smart technology and that is better able to handle intermittent renewable power sources.
-
Externalities from accidents at facilities are largely internalized and—in the case of the oil and gas transmission network—of negligible magnitude per barrel of oil or thousand cubic feet of gas trans-shipped. We find that the monopsony component of the oil consumption premium is not an externality.
-
Although government policy may be desirable to serve as a countervailing force to monopoly or cartel producer power, it is a separate issue from the focus of this report.
-
We find that macroeconomic disruptions from oil supply shocks are not an externality. We also find that sharp and unexpected increases in oil prices adversely affect the U.S. economy. Estimates in the literature of the macroeconomic costs of disruption and adjustment range from $2 to $8 per barrel in 2007 dollars.
-
Dependence on imported oil has implications for foreign policy, and we find that some of the effects can be viewed as an externality. We find, however, that it is impossible to quantify these externalities. The role of the military in safeguarding foreign supplies of oil is often identified as a potential externality. We find it difficult if not impossible to disentangle nonenergy-related reasons for a military presence in certain regions of the world from energy-related reasons. Moreover much of the military cost is likely to be fixed in nature. A 20% reduction in oil consumption, for example, would probably have little impact on the strategic positioning of military forces in the world.
-
Nuclear waste and proliferation raise important issues and pose difficult policy challenges. The extent to which uninternalized externalities exist is difficult to measure. Moreover, it is very difficult to quantify them. Thus, we do not report numerical values in this report but recognize the importance of studying this issue further.


