
Summary
Modern civilization is heavily dependent on energy from sources such as coal, petroleum, and natural gas. Yet, despite energy’s many benefits, most of which are reflected in energy market prices, the production, distribution, and use of energy also cause negative effects. Beneficial or negative effects that are not reflected in energy market prices are termed “external effects” by economists. In the absence of government intervention, external effects associated with energy production and use are generally not taken into account in decision making.
When prices do not adequately reflect them, the monetary value assigned to benefits or adverse effects (referred to as damages) are “hidden” in the sense that government and other decision makers, such as electric utility managers, may not recognize the full costs of their actions. When market failures like this occur, there may be a case for government interventions in the form of regulations, taxes, fees, tradable permits, or other instruments that will motivate such recognition.
Recognizing the significance of the external effects of energy, Congress requested this study in the Energy Policy Act of 2005 and later directed the Department of the Treasury to fund it under the Consolidated Appropriations Act of 2008. The National Research Council committee formed to carry out the study was asked to define and evaluate key external costs and benefits—related to health, environment, security, and infrastructure—that are associated with the production, distribution, and use of energy but not reflected in market prices or fully addressed by current government policy. The committee was not asked, however, to recommend specific strategies for addressing such costs because policy judgments that transcend scientific
and technological considerations—and exceed the committee’s mandate—would necessarily be involved.
The committee studied energy technologies that constitute the largest portion of the U.S. energy system or that represent energy sources showing substantial increases (>20%) in consumption over the past several years. We evaluated each of these technologies over their entire life cycles—from fuel extraction to energy production, distribution, and use to disposal of waste products—and considered the external effects at each stage.
Estimating the damages associated with external effects was a multistep process, with most steps entailing assumptions and their associated uncertainties. Our method, based on the “damage function approach,” started with estimates of burdens (such as air-pollutant emissions and water-pollutant discharges). Using mathematical models, we then estimated these burdens’ resultant ambient concentrations as well the ensuing exposures. The exposures were then associated with consequent effects, to which we attached monetary values in order to produce damage estimates. One of the ways economists assign monetary values to energy-related adverse effects is to study people’s preferences for reducing those effects. The process of placing monetary values on these impacts is analogous to determining the price people are willing to pay for commercial products. We applied these methods to a year close to the present (2005) for which data were available and also to a future year (2030) to gauge the impacts of possible changes in technology.
A key requisite to applying our methods was determining which policy-relevant effects are truly external, as defined by economists. For example, increased food prices caused by the conversion of agricultural land from food to biofuel production, are not considered to represent an external cost, as they result from (presumably properly functioning) markets. Higher food prices may of course raise important social concerns and may thus be an issue for policy makers, but because they do not constitute an external cost they were not included in the study.
Based on the results of external-cost studies published in the 1990s, we focused especially on air pollution. In particular, we evaluated effects related to emissions of particulate matter (PM), sulfur dioxide (SO2), and oxides of nitrogen (NOx), which form criteria air pollutants.1 We monetized effects of those pollutants on human health, grain crop and timber yields, building materials, recreation, and visibility of outdoor vistas. Health damages, which include premature mortality and morbidity (such as chronic bronchi-
tis and asthma), constituted the vast majority of monetized damages, with premature mortality being the single largest health-damage category.
Some external effects could only be discussed in qualitative terms in this report. Although we were able to quantify and then monetize a wide range of burdens and damages, many other external effects could not ultimately be monetized because of insufficient data or other reasons. In particular, the committee did not monetize impacts of criteria air pollutants on ecosystem services or nongrain agricultural crops, or effects attributable to emissions of hazardous air pollutants.2 In any case, it is important to keep in mind that the individual estimates presented in this report, even when quantifiable, can have large uncertainties.
In addition to its external effects in the present, the use of fossil fuels for energy creates external effects in the future through its emissions of atmospheric greenhouse gases (GHGs)3 that cause climate change, subsequently resulting in damages to ecosystems and society. This report estimates GHG emissions from a variety of energy uses, and then, based on previous studies, provides ranges of potential damages. The committee determined that attempting to estimate a single value for climate-change damages would have been inconsistent with the dynamic and unfolding insights into climate change itself and with the extremely large uncertainties associated with effects and range of damages. Because of these uncertainties and the long time frame for climate change, our report discusses climate-change damages separately from damages not related to climate change.
OVERALL CONCLUSIONS AND IMPLICATIONS
Electricity
Although the committee considered electricity produced from coal, natural gas, nuclear power, wind, solar energy, and biomass, it focused mainly on coal and natural gas—which together account for nearly 70% of the nation’s electricity—and on monetizing effects related to the air pollution from these sources. From previous studies, it appeared that the electricity-generation activities accounted for the majority of such external effects, with other activities in the electricity cycle, such as mining and drilling, playing a lesser role.
Coal
Coal, a nonrenewable fossil fuel, accounts for nearly half of all electricity produced in the United States. We monetized effects associated with emissions from 406 coal-fired power plants, excluding Alaska and Hawaii, during 2005. These facilities represented 95% of the country’s electricity from coal. Although coal-fired electricity generation from the 406 sources resulted in large amounts of pollution overall, a plant-by-plant breakdown showed that the bulk of the damages were from a relatively small number of them. In other words, specific comparisons showed that the source-and-effect landscape was more complicated than the averages would suggest.
Damages Unrelated to Climate Change The aggregate damages associated with emissions of SO2, NOx, and PM from these coal-fired facilities in 2005 were approximately $62 billion, or $156 million on average per plant.4 However, the differences among plants were wide—the 5th and 95th percentiles of the distribution were $8.7 million and $575 million, respectively. After ranking all the plants according to their damages, we found that the 50% of plants with the lowest damages together produced 25% of the net generation of electricity but accounted for only 12% of the damages. On the other hand, the 10% of plants with the highest damages, which also produced 25% of net generation, accounted for 43% of the damages. Figure S-1 shows the distribution of damages among coal-fired plants.
Some of the variation in damages among plants occurred because those that generated more electricity tended to produce greater damages; hence, we also reported damages per kilowatt hour (kWh) of electricity produced. If plants are weighted by the amount of electricity they generate, the mean damage is 3.2 cents per kWh. For the plants examined, variation in damages per kWh is primarily due to variation in pollution intensity (emissions per kWh) among plants, rather than variation in damages per ton of pollutant. Variations in emissions per kWh mainly reflected the sulfur content of the coal burned; the adoption, or not, of control technologies (such as scrubbers); and the vintage of the plant—newer plants were subject to more stringent pollution-control requirements. As a result, the distribution of damages per kWh was highly skewed: There were many coal-fired power plants with modest damages per kWh as well as a small number of plants with large damages. The 5th percentile of damages per kWh is less than half a cent, and the 95th percentile of damages is over 12 cents.5
The estimated air-pollution damages associated with electricity generation from coal in 2030 will depend on many factors. For example, damages

FIGURE S-1 Distribution of aggregate damages among the 406 coal-fired power plants analyzed in this study. In computing this chart, plants were sorted from smallest to largest based on damages associated with each plant. The lowest decile (10% increment) represents the 40 plants with the smallest damages per plant (far left). The decile of plants that produced the most damages is on the far right. The figure on the top of each bar is the average damage across all plants of damages associated with sulfur dioxide, oxides of nitrogen, and particulate matter. Damages related to climate-change effects are not included.
per kWh are a function of the emissions intensity of electricity generation from coal (for example, pounds [lb] of SO2 per megawatt hour [MWh]), which in turn depends on future regulation of power-plant emissions. Based on government estimates, net power generation from coal in 2030 is expected to be 20% higher on average than in 2005. Despite projected increases in damages per ton of pollutant resulting mainly from population and income growth—average damages per kWh from coal plants (weighted by electricity generation) are estimated to be 1.7 cents per kWh in 2030 as compared with 3.2 cents per kWh in 2005. This decrease derives from the assumption that SO2 emissions per MWh will fall by 64% and that NOx and PM emissions per MWh will each fall by approximately 50%.
Natural Gas
An approach similar to that used for coal allowed the committee to estimate criteria-pollutant-related damages for 498 facilities in 2005 that generated electricity from natural gas in the contiguous 48 states. These facilities represented 71% of the country’s electricity from natural gas. Again, as with coal, the overall averages masked some major differences among plants, which varied widely in terms of pollution generation.
Damages Unrelated to Climate Change Damages from gas-fueled plants tend to be much lower than those from coal plants. The sample of 498 gas facilities produced $740 million in aggregate damages from emissions of SO2, NOx, and PM. Average annual damages per plant were $1.49 million, which reflected not only lower damages per kWh at gas plants but smaller plant sizes as well; net generation at the median coal plant was more than six times larger than that of the median gas facility. After sorting the gas plants according to damages, we found that the 50% with the lowest damages accounted for only 4% of aggregate damages. By contrast, the 10% of plants with the largest damages produced 65% of the air-pollution damages from all 498 plants (see Figure S-2). Each group of plants accounted for approximately one-quarter of the sample’s net generation of electricity.
Mean damages per kWh were 0.16 cents when natural-gas-fired plants were weighted by the amount of electricity they generated. However, the distribution of damages per kWh had a large variance and was highly skewed. The 5th percentile of damages per kWh is less than 5/100 of a cent, and the 95th percentile of damages is about 1 cent.6
Although overall electricity production from natural gas in 2030 is predicted to increase by 9% from 2005 levels, the average pollution intensity for natural-gas facilities is expected to decrease, though not as dramatically as for coal plants. Pounds of NOx emitted per MWh are estimated to fall, on average, by 19%, and emissions of PM per MWh are estimated to fall by about 32%. The expected net effect of these changes is a decrease in the aggregate damages related to the 498 gas facilities from $740 million in 2005 to $650 million in 2030. Their average damage per kWh is expected to fall from 0.16 cents to 0.11 cents over that same period.
Nuclear
The 104 U.S. nuclear reactors currently account for almost 20% of the nation’s electrical generation. Overall, other studies have found that
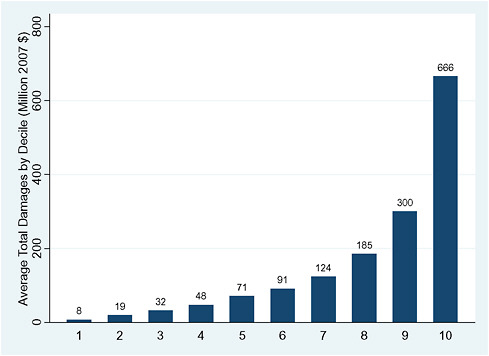
FIGURE S-2 Distribution of aggregate damages among the 498 natural-gas-fired power plants analyzed in this study. In computing this chart, plants were sorted from smallest to largest based on damages associated with each plant. The lowest decile (10% increment) represents the 50 plants with the smallest damages per plant (far left). The decile of plants that produced the most damages is on the far right. The figure on the top of each bar is the average damage across all plants of damages associated with sulfur dioxide, oxides of nitrogen, and particulate matter. Damages related to climate-change effects are not included.
damages associated with the normal operation of nuclear power plants (excluding the possibility of damages in the remote future from the disposal of spent fuel) are quite low compared with those of fossil-fuel-based power plants.7
However, the life cycle of nuclear power does pose some risks. If uranium mining activities contaminate ground or surface water, people could potentially be exposed to radon or other radionuclides through ingestion.
Because the United States mines only about 5% of the world’s uranium supply, such risks are mostly experienced in other countries.
Low-level nuclear waste is stored until it decays to background levels and currently does not pose an immediate environmental, health, or safety hazard. However, regarding spent nuclear fuel, development of full-cycle, closed-fuel processes that recycle waste and enhance security could further lower risks.
A permanent repository for spent fuel and other high-level nuclear wastes is perhaps the most contentious nuclear-energy issue, and considerably more study of the external cost of such a repository is warranted.
Renewable Energy Sources
Wind power currently provides just over 1% of U.S. electricity, but it has large growth potential. Because no fuel is involved in electricity generation, neither gases nor other contaminants are released during the operation of a wind turbine. Its effects do include potentially adverse visual and noise effects, and the killing of birds and bats. In most cases, wind-energy plants currently do not kill enough birds to cause population-level problems, except perhaps locally and mainly with respect to raptors. The tallies of bats killed and the population consequences of those deaths have not been quantified but could be significant. If the number of wind-energy facilities continues to grow as fast as it has recently, bat and perhaps bird deaths could become more significant.
Although the committee did not evaluate in detail the effects of solar and biomass generation of electricity, it has seen no evidence that they currently produce adverse effects comparable in aggregate to those of larger sources of electricity. However, as technology improves and penetration into the U.S. energy market grows, the external costs of these sources will need to be reevaluated.
Greenhouse Gas Emissions and Electricity Generation
Emissions of carbon dioxide (CO2) from coal-fired power plants are the largest single source of GHGs in the United States. CO2 emissions vary; their average is about 1 ton of CO2 per MWh generated, having a 5th-to-95th-percentile range of 0.95-1.5 tons. The main factors affecting these differences are the technology used to generate the power and the age of the plant. Emissions of CO2 from gas-fired power plants also are significant, having an average of about 0.5 ton of CO2 per MWh generated and a 5th-to-95th-percentile range of 0.3-1.1 tons. Life-cycle CO2 emissions from nuclear, wind, biomass, and solar appear so small as to be negligible compared with those from fossil fuels.
Heating
The production of heat as an end use accounts for about 30% of U.S. primary energy demand, the vast majority of which derives from the combustion of natural gas or the application of electricity. External effects associated with heat production come from all sectors of the economy, including residential and commercial (largely for the heating of living or work spaces) and industrial (for manufacturing processes).
Damages Unrelated to Climate Change
As with its combustion for electricity, combustion of natural gas for heat results in lower emissions than from coal, which is the main energy source for electricity generation. Therefore health and environmental damages related to obtaining heat directly from natural-gas combustion are much less than damages from the use of electricity for heat. Aggregate damages from the combustion of natural gas for direct heat are estimated to be about $1.4 billion per year, assuming that the magnitude of external effects resulting from heat production for industrial activities is comparable to that of residential and commercial uses.8 The median estimated damages attributable to natural-gas combustion for heat in residential and commercial buildings are approximately 11 cents per thousand cubic feet. These damages do not vary much across regions when considered on a per-unit basis, although some counties have considerably higher external costs than others. In 2007, natural-gas use for heating in the industrial sector, excluding its employment as a process feedstock, was about 25% less than natural-gas use in the residential and commercial building sectors.
Damages associated with energy for heat in 2030 are likely to be about the same as those that exist today, assuming that the effects of additional sources to meet demand are offset by lower-emitting sources. Reduction in damages would only result from more significant changes—largely in the electricity-generating sector, as emissions from natural gas are relatively small and well controlled. However, the greatest potential for reducing damages associated with the use of energy for heat lies in greater attention to improving efficiency. Results from the recent National Research Council report America’s Energy Future: Technology and Transformation suggest a possible improvement of energy efficiency in the buildings and industrial sectors by 25% or more between now and 2030. Increased damages would also be possible, however, if new domestic energy development resulted in higher emissions or if additional imports of liquefied natural gas, which
would increase emissions from the production and international transport of the fuel, were needed.
Greenhouse Gas Emissions
The combustion of a thousand cubic feet of gas generates about 120 lb (0.06 tons) of CO2. Methane, the major component of natural gas, is a GHG itself and has a global-warming potential about 25 times that of CO2. Methane enters the atmosphere through leakage, but the U.S. Energy Information Administration estimates that such leakage amounted to less than 3% of total U.S. CO2-equivalent (CO2-eq) emissions9 (excluding water vapor) in 2007. Thus, in the near term, where domestic natural gas remains the dominant source for heating, the average emissions factor is likely to be about 140 lb CO2-eq per thousand cubic feet (including upstream methane emissions); in the longer term—assuming increased levels of liquefied natural gas or shale gas as part of the mix—the emissions factor could be 150 lb CO2-eq per thousand cubic feet.
Transportation
Transportation, which today is almost completely reliant on petroleum, accounts for nearly 30% of U.S. energy consumption. The majority of transportation-related emissions come from fossil-fuel combustion—whether from petroleum consumed during conventional-vehicle operation, coal or natural gas used to produce electricity to power electric or hybrid vehicles, petroleum or natural gas consumed in cultivating biomass fields for ethanol, or electricity used during vehicle manufacture.
The committee focused on both the nonclimate-change damages and the GHG emissions associated with light-duty and heavy-duty on-road vehicles, as they account for more than 75% of transportation energy consumption in the United States. Although damages from nonroad vehicles (for example, aircraft, locomotives, and ships) are not insignificant, the committee emphasized the much larger highway component.
Damages Unrelated to Climate Change
In 2005, the vehicle sector produced $56 billion in health and other nonclimate-change damages, with $36 billion from light-duty vehicles and $20 billion from heavy-duty vehicles. Across the range of light-duty technology and fuel combinations considered, damages expressed per vehicle
miles traveled (VMT) ranged from 1.2 cents to 1.7 cents (with a few combinations having higher damage estimates).10
The committee evaluated motor-vehicle damages over four life-cycle stages: (1) vehicle operation, which results in tailpipe emissions and evaporative emissions; (2) production of feedstock, including the extraction of the resource (oil for gasoline, biomass for ethanol, or fossil fuels for electricity) and its transportation to the refinery; (3) refining or conversion of the feedstock into usable fuel and its transportation to the dispenser; and (4) manufacturing and production of the vehicle. It is important that, in most cases, vehicle operation accounted for less than one-third of total damages; other components of the life cycle contributed the rest. Life-cycle stages 1, 2, and 3 were somewhat proportional to actual fuel use, while stage 4 (which is a significant source of life-cycle emissions that form criteria pollutants) was not.
The estimates of damage per VMT among different combinations of fuels and vehicle technologies were remarkably similar (see Figure S-3). Because these assessments were so close, it is essential to be cautious when interpreting small differences between combinations. The damage estimates for 2005 and 2030 also were very close, despite an expected rise in population. This result is attributable to the expected national implementation of the recently revised “corporate average fuel economy” (CAFE) standards, which require the new light-duty fleet to have an average fuel economy of 35.5 miles per gallon by 2016 (although an increase in VMT could offset this improvement somewhat).
Despite the general overall similarity, some fuel and technology combinations were associated with greater nonclimate damages than others. For example, corn ethanol, when used in E85 (fuel that is 85% ethanol and 15% gasoline), showed estimated damages per VMT similar to or slightly higher than those of gasoline, both for 2005 and 2030, because of the energy required to produce the biofuel feedstock and convert it to fuel. Yet cellulosic (nonfood biomass) ethanol made from herbaceous plants or corn stover had lower damages than most other options when used in E85. The reason for this contrast is that the feedstock chosen and growing practices used influence the overall damages from biomass-based fuels. We did not quantify water use and indirect land use for biofuels.11
Electric vehicles and grid-dependent hybrid vehicles showed somewhat
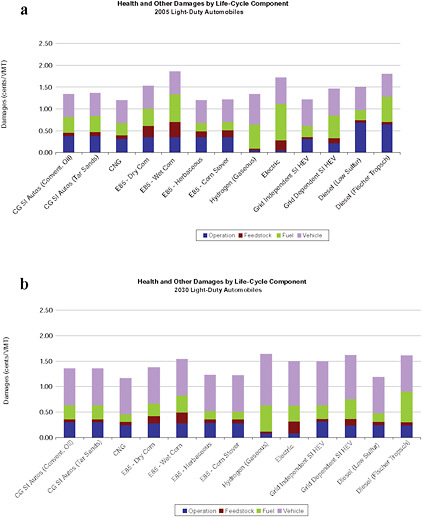
FIGURE S-3 Health effects and other nonclimate damages are presented by lifecycle component for different combinations of fuels and light-duty automobiles in 2005 (a) and 2030 (b). Damages are expressed in cents per VMT (2007 U.S. dollars). Going from bottom to top of each bar, damages are shown for life-cycle stages as follows: vehicle operation, feedstock production, fuel refining or conversion, and vehicle manufacturing. Damages related to climate change are not included. ABBREVIATIONS: VMT, vehicle miles traveled; CG SI, conventional gasoline spark ignition; CNG, compressed natural gas; E85, 85% ethanol fuel; HEV, hybrid electric vehicle.
higher damages than many other technologies for both 2005 and 2030. Although operation of the vehicles produces few or no emissions, electricity production at present relies mainly on fossil fuels and, based on current emission control requirements, emissions from this stage of the life cycle are expected to still rely primarily on those fuels by 2030, albeit at
significantly lower emission rates. In addition, battery and electric motor production—being energy- and material-intensive—added up to 20% to the damages from manufacturing.
Compressed natural gas had lower damages than other options, as the technology’s operation and fuel produce very few emissions.
Although diesel had some of the highest damages in 2005, it is expected to have some of the lowest in 2030, assuming full implementation of the Tier 2 vehicle emission standards of the U.S. Environmental Protection Agency (EPA). This regulation, which requires the use of low-sulfur diesel, is expected to significantly reduce PM and NOx emissions as well. Heavy-duty vehicles have much higher damages per VMT than light-duty vehicles because they carry more cargo or people and, therefore, have lower fuel economies. However, between 2005 and 2030, these damages are expected to drop significantly, assuming the full implementation of the EPA Heavy-Duty Highway Vehicle Rule.
Greenhouse Gas Emissions
Most vehicle and fuel combinations had similar levels of GHG emissions in 2005 (see Figure S-4). Because vehicle operation is a substantial source of life-cycle GHGs, enforcement of the new CAFE standards will have a greater impact on lowering GHG emissions than on lowering lifecycle emissions of other pollutants. By 2030, with improvements among virtually all light-duty-vehicle types, the committee estimates that there will be even fewer differences in the GHG emissions of the various technologies than there were in 2005. However, in the absence of additional fuel-efficiency requirements, heavy-duty vehicle GHG emissions are expected to change little between 2005 and 2030, except from a slight increase in fuel economy in response to market conditions.
For both 2005 and 2030, vehicles using gasoline made from petroleum extracted from tar sands and diesel derived from Fischer-Tropsch fuels12 have the highest life-cycle GHG emissions among all fuel and vehicle combinations considered. Vehicles using celluosic E85 from herbaceous feedstock or corn stover have some of the lowest GHG emissions because of the feedstock’s ability to store CO2 in the soil. Those using compressed natural gas also had comparatively low GHG emissions.
Future Reductions
Substantially reducing nonclimate damages related to transportation would require major technical breakthroughs, such as cost-effective con-
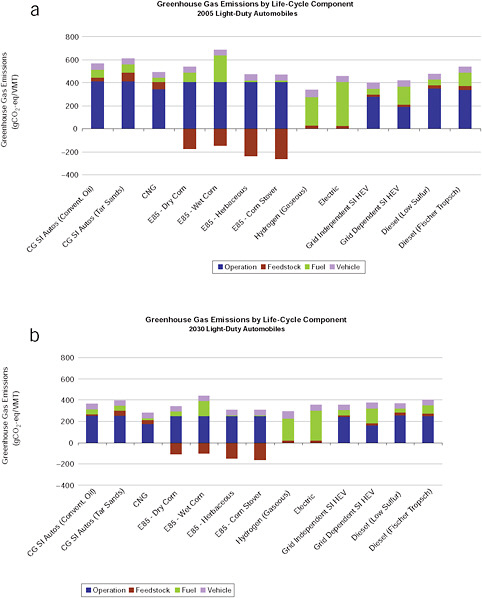
FIGURE S-4 Greenhouse gas emissions (grams CO2-eq)/VMT by life-cycle component for different combinations of fuels and light-duty automobiles in 2005 (a) and 2030 (b). Going from bottom to top of each bar, damages are shown for life-cycle stages as follows: vehicle operation, feedstock production, fuel refining or conversion, and vehicle manufacturing. One exception is ethanol fuels for which feedstock production exhibits negative values because of CO2 uptake. The amount of CO2 consumed should be subtracted from the positive value to arrive at a net value. ABBREVIATIONS: g CO2-eq, grams CO2-equivalent; VMT, vehicle mile traveled; CG SI, conventional gasoline spark ignition; CNG, compressed natural gas; E85, 85% ethanol fuel; HEV, hybrid electric vehicle.
version of cellulosic biofuels, cost-effective carbon capture, and storage for coal-fired power plants, or a vast increase in renewable energy capacity or other forms of electricity generation with lower emissions.13 Further enhancements in fuel economy will also help, especially for emissions from vehicle operations, although they are only about one-third of the total life-cycle picture and two other components are proportional to fuel use. In any case, better understanding of potential external costs at the earliest stage of vehicle research should help developers minimize those costs as the technology evolves.
Estimating Climate-Change Damages
Energy production and use continue to be major sources of GHG emissions, principally CO2 and methane. Damages from these emissions will result as their increased atmospheric concentrations affect climate, which in turn will affect such things as weather, freshwater supply, sea level, biodiversity, and human society and health.14
Estimating these damages is another matter, as the prediction of climate-change effects, which necessarily involves detailed modeling and analysis, is an intricate and uncertain process. It requires aggregation of potential effects and damages that could occur at different times (extending centuries into the future) and among different populations across the globe. Thus, rather than attempt such an undertaking itself, especially given the constraints on its time and resources, the committee focused its efforts on a review of existing integrated assessment models (IAMs) and the associated climate-change literature.
We reviewed IAMs in particular, which combine simplified global-climate models with economic models that are used to (1) estimate the economic impacts of climate change, and (2) identify emissions regimes that balance the economic impacts with the costs of reducing GHG emissions. Because IAM simulations usually report their results in terms of mean values, this approach does not adequately capture some possibilities of catastrophic outcomes. Although a number of the possible outcomes have been studied—such as release of methane from permafrost that could rapidly accelerate warming and collapse of the West Antarctic or Greenland ice sheets, which could raise sea level by several meters—the damages associated with these events and their probabilities are very poorly understood.
Some analysts nevertheless believe that the expected value of total damages may be more sensitive to the possibility of low-probability catastrophic events than to the most likely or best-estimate values.
In any case, IAMs are the best tools currently available. An important factor in using them (or virtually any other model that accounts for monetary impacts over time) is the “discount rate,” which converts costs and benefits projected to occur in the future into amounts (“present values”) that are compatible with present-day costs and benefits. Because the choice of a discount rate for the long periods associated with climate change is not well-established, the committee did not choose a particular discount rate for assessing the value of climate change’s effects; instead, we considered a range of discount-rate values.
Under current best practice, estimates of global damages associated with a particular climate-change scenario at a particular future time are translated by researchers into an estimate of damages per ton of emissions (referred to as marginal damages) by evaluating the linkage between current GHG emissions and future climate-change effects. Marginal damages are usually expressed as the net present value of the damages expected to occur over many future years as the result of an additional ton of CO2-eq emitted into the atmosphere. Estimating these marginal damages depends on the temperature increase in response to a unit increase in CO2-eq emissions, the additional climate-related effects that result, the values of these future damages relative to the present, and how far into the future one looks. Because of uncertainties at each step of the analysis, a given set of possible future conditions may yield widely differing estimates of marginal damages.
Given the preliminary nature of the climate-damage literature, the committee found that only rough order-of-magnitude estimates of marginal damages were possible at this time. Depending on the extent of projected future damages and the discount rate used for weighting them, the range of estimates of marginal damages spanned two orders of magnitude, from about $1 to $100 per ton of CO2-eq, based on current emissions. Approximately one order of magnitude in difference was attributed to discount-rate assumptions and another order of magnitude to assumptions about future damages from emissions used in the various IAMs. The damage estimates at the higher end of the range were associated only with emission paths without significant GHG controls. Estimates of the damages specifically to the United States would be a fraction of the levels in the range of estimates, because this country represents only about one-quarter of the world’s economy, and the proportionate impacts it would suffer are generally thought to be lower than for the world as a whole.
Comparing Climate and Nonclimate Damage Estimates
Comparing nonclimate damages to climate-related damages is extremely difficult. The two measures differ significantly in their time dimensions, spatial scales, varieties of impacts, and degrees of confidence with which they can be estimated. For 2005, determining which type of external effect caused higher damages depended on the energy technology being considered and the marginal damage value selected from the range of $1 to $100 per ton of CO2-eq emitted. For example, coal-fired electricity plants were estimated to emit an average of about 1 ton of CO2 per MWh (or 2 lb/kWh). When multiplying that emission rate by an assumed marginal damage value of $30/ton CO2-eq, climate-related damages equal 3 cents/kWh, comparable to the 3.2 cents/kWh estimated for nonclimate damages. It is important to keep in mind that the value of $30/ton CO2-eq is provided for illustrative purposes and is not a recommendation of the committee.
Natural Gas: The climate-related damages were higher than the nonclimate damages from natural-gas-fired power plants, as well as from combustion of natural gas for producing heat, regardless of the marginal damage estimate. Because natural gas is characterized by low emissions that form criteria pollutants, the nonclimate damages were about an order of magnitude lower than the climate damages estimated by the models, if the marginal climate damage were assumed to be $30/ton CO2-eq.
Coal: The climate-related damages from coal-fired power plants were estimated to be higher than the nonclimate damages when the assumed marginal climate damage was greater than $30/ton CO2-eq. If the marginal climate damage was less than $30/ton CO2-eq, the climate-related damages were lower than the nonclimate damages.
Transportation: As with coal, the transportation sector’s climate-change damages were higher than the nonclimate damages only if the marginal damage for climate was higher than $30/ton CO2-eq.
Overall: All of the model results available to the committee estimated that the climate-related damages per ton of CO2-eq would be 50-80% worse in 2030 than in 2005. Even if annual GHG emissions were to remain steady between now and 2030, the damages per ton of CO2-eq emissions would be substantially higher in 2030 than at present. As a result, the climate-related damages in that year from coal-fired power plants and transportation are likely to be greater than their nonclimate damages.
Infrastructure Risks and Security
The committee also considered external effects and costs associated with disruptions in the electricity-transmission grid, energy facilities’ vul-
nerability to accidents and possible attack, oil-supply disruptions, and other national security issues. We concluded as follows:
-
The nation’s electric grid is subject to periodic failures because of transmission congestion and the lack of adequate reserve capacity. These failures are considered an external effect, as individual consumers of electricity do not take into account the impact of their consumption on aggregate load. The associated and possibly significant damages of grid failure underscore the importance of carefully analyzing the costs and benefits of investing in a modernized grid—one that takes advantage of new smart technology and that is better able to handle intermittent renewable-power sources.
-
The external costs of accidents at energy facilities are largely taken into account by their owners and, at least in the case of our nation’s oil and gas transmission networks, are of negligible magnitude per barrel of oil or thousand cubic feet of gas shipped.
-
Because the United States is such a large consumer of oil, policies to reduce domestic demand can also reduce the world oil price, thereby benefiting the nation through lower prices on the remaining oil it imports. Government action may thus be a desirable countervailing force to monopoly or cartel-producer power. However, the committee does not consider this influence of a large single buyer (known as monopsony power) to be a benefit that is external to the market price of oil. It was therefore deemed to be outside the scope of this report.
-
Although sharp and unexpected increases in oil prices adversely affect the U.S. economy, the macroeconomic disruptions they cause do not fall into the category of external effects and damages. Estimates in the literature of the macroeconomic costs of disruptions and adjustments range from $2 to $8 per barrel.
-
Dependence on imported oil has well-recognized implications for foreign policy, and although we find that some of the effects can be viewed as external costs, it is currently impossible to quantify them. For example, the role of the military in safeguarding foreign supplies of oil is often identified as a relevant factor. However, the energy-related reasons for a military presence in certain areas of the world cannot readily be disentangled from the nonenergy-related reasons. Moreover, much of the military cost is likely to be fixed in nature. For example, even a 20% reduction in oil consumption, we believe, would probably have little impact on the strategic positioning of U.S. military forces throughout the world.
-
Nuclear waste raises important security issues and poses tough policy challenges. The extent to which associated external effects exist is hard to assess, and even when identified they are very difficult to quantify. Thus, although we do not present numerical values in this report, we recognize the importance of studying these issues further.
Conclusion
In aggregate, the damage estimates presented in this report for various external effects are substantial. Just the damages from external effects the committee was able to quantify add up to more than $120 billion for the year 2005.15 Although large uncertainties are associated with the committee’s estimates, there is little doubt that this aggregate total substantially underestimates the damages, because it does not include many other kinds of damages that could not be quantified for reasons explained in the report, such as damages related to some pollutants, climate change, ecosystems, infrastructure, and security. In many cases, we have identified those omissions, within the chapters of this report, with the hope that they will be evaluated in future studies.
Even if complete, our various damage estimates would not automatically offer a guide to policy. From the perspective of economic efficiency, theory suggests that damages should not be reduced to zero but only to the point where the cost of reducing another ton of emissions (or other type of burden) equals the marginal damages avoided—that is, the degree to which a burden should be reduced depends on its current level and the cost of lowering it. The solution cannot be determined from the amount of damage alone. Economic efficiency, however, is only one of several potentially valid policy goals that need to be considered in managing pollutant emissions and other burdens. For example, even within the same location, there is compelling evidence that some members of the population are more vulnerable than others to a particular external effect.
Although not a comprehensive guide to policy, our analysis does indicate that regulatory actions can significantly affect energy-related damages. For example, the full implementation of the federal diesel-emission rules would result in a sizeable decrease in nonclimate damages from diesel vehicles between 2005 and 2030. Similarly, major initiatives to further reduce other emissions, improve energy efficiency, or shift to a cleaner electricity-generating mix (for example, renewables, natural gas, and nuclear) could substantially reduce the damages of external effects, including those from grid-dependent hybrid and electric vehicles.
It is thus our hope that this information will be useful to government policy makers, even in the earliest stages of research and development on energy technologies, as an understanding of their external effects and damages could help to minimize the technologies’ adverse consequences.


