
H
Model-Based Design
KEY ELEMENTS OF MODEL-BASED DESIGN
Model-based design (MBD) is a mathematical and visual method of addressing the problems associated with designing complex control systems and is being used successfully in many motion control, industrial equipment, aerospace, and automotive applications. It provides an efficient approach for the four key elements of the development process cycle: modeling a plant (system identification), analyzing and synthesizing a controller for the plant, simulating the plant and controller, and deploying the controller—thus integrating all of these multiple phases and providing a common framework for communication throughout the entire design process.
This MBD paradigm is significantly different from the traditional design methodology. Rather than using complex structures and extensive software code, designers can now define advanced functional characteristics using continuous-time and discrete-time building blocks. These built models along with some simulation tools can lead to rapid prototyping, virtual functional verification, software testing, and validation. MBD is a process that enables faster, more cost-effective development of dynamic systems, including control systems, signal processing, and communications systems. In MBD, a system model is at the center of the development process, from requirements development, through design, implementation, and testing. The control algorithm model is an executable specification that is continually refined throughout the development process.
MBD allows efficiency to be improved by:
-
Using a common design environment across project teams
-
Linking designs directly to requirements
-
Integrating testing with design to continuously identify and correct errors
-
Refining algorithms through multidomain simulation
-
Automatically generating embedded software code
-
Developing and reusing test suites
-
Automatically generating documentation
-
Reusing designs to deploy systems across multiple processors and hardware targets
The different phases of MBD are indicated in Figure H-1. Throughout the different phases of MBD, several levels of modeling are required, both from the plant and the control points of view, in order for the functional behavior of the model to match that of the generated code. Figure H-2 shows an example of different levels used for different applications.
METHODOLOGY
This section explains different processes used as part of the MBD approach.
The first step is the simulation (Figure H-3), where neither the controller nor the plant operates in real time. This step, usually used toward the beginning of the process, allows engineers to study the performance of the system and design the control algorithm(s) in a virtual environment, by running computer simulations of the complete system, or subsystem.
Rapid control prototyping (RCP) is a process that lets the engineer quickly test and iterate control strategies on a real-time computer with real input/output devices RCP (see Figure H-4) differs from (HIL) hardware-in-the-loop in that the control strategy is simulated in realtime and the “plant,” or system under control, is real. RCP is now the typical method used by engineers to develop and test their control strategies. It was first used to develop power train control strategies. The simple reason is that the control software, which is in the engine and transmission control units, is difficult and time consuming to modify. It has since been adopted industry wide in applications such as antilock braking, antiroll, vehicle stability, active cruise control, and torque distribution.
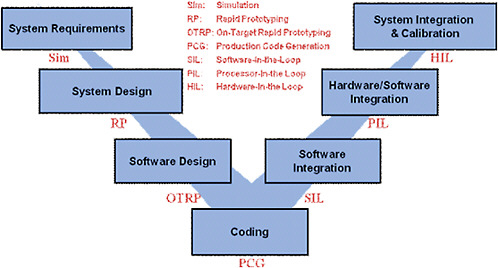
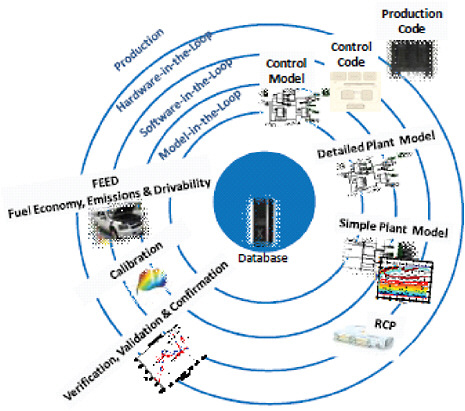
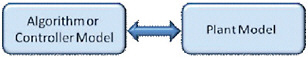
FIGURE H-3 Simulation.
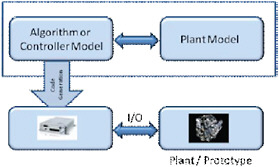
FIGURE H-4 Rapid control prototyping
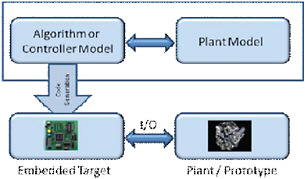
FIGURE H-5 On-target rapid prototyping.
For the on-target rapid prototyping case (see Figure H-5), new or modified functionality is added to the production code in the controller-embedded target processor to verify the additions/changes.
Once all the functions have been developed and tested, the production code is finally implemented (see Figure H-6).
In the software-in-the-loop (SIL) phase (see Figure H-7), the actual production software code is incorporated into the mathematical simulation that contains the models of the physical system. This is done to permit inclusion of software functionality for which no model(s) exists or to enable faster simulation runs.
During the processor-in-the-loop phase (see Figure H-8), the control is compiled and downloaded into an embedded target processor and communicates directly with the plant model via standard communications such as Ether
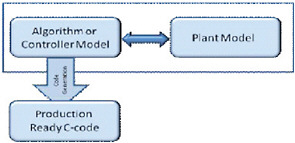
FIGURE H-6 Production code generation.
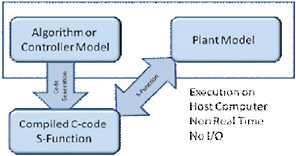
FIGURE H-7 Software-in-the-loop.
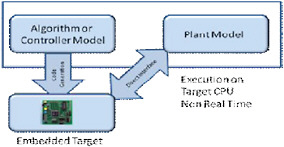
FIGURE H-8 Processor-in-the-loop
net. In this case, no input/output devices are used for the communication.
HIL (see Figure H-9) is a technique for combining a mathematical simulation model of a system with actual physical hardware, such that the hardware performs as though it were integrated into the real system. For testing and development of embedded electronic controllers, the hardware controller and associated software are connected to a mathematical simulation of the system plant, which is executed on a computer in real time. To connect the real-time model to the hardware controller, the real-time computer receives electrical signals from the controller as actuator commands
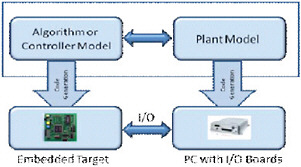
FIGURE H-9 Hardware-in-the-loop.
to drive the plant and converts these signals into the physical variables connected to the plant model. The plant model calculates the physical variables that represent the outputs of the plant, which are converted into electrical signals that represent the voltages produced by the sensors that feed the controller.
Another option to evaluate fuel consumption is component-in-the-loop (CIL), a combination of HIL and RCP. In CIL, an entire system is connected to a source emulating the rest of the vehicle. For example, Figure H-10 shows an engine and its controller connected to an AC dynamometer that would be controlled to represent the rest of the vehicle losses.
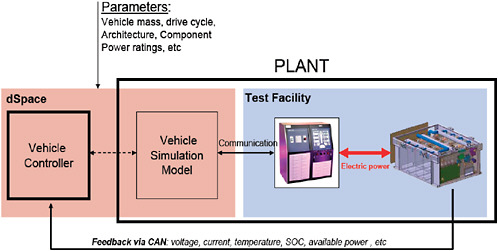
Figure H-11 shows a similar approach using a battery and a DC supply source emulating the remainder of the vehicle. In both cases the hardware component will be the one that (1) represents the new technology or (2) has not been properly validated yet or (3) cannot be accurately modeled (e.g., due to transients or thermal issues).
It should also be noted that more than one component can be hardware while some of them are still emulated. For example, both an engine and a battery could be hardware while the rest of the power train and the vehicle are emulated. One of the issues in using that approach, however, is the potential for communication-related delays since some of the signal transfer most likely has to go through the Internet.
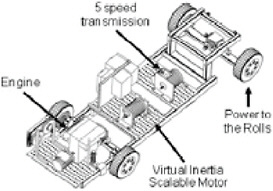
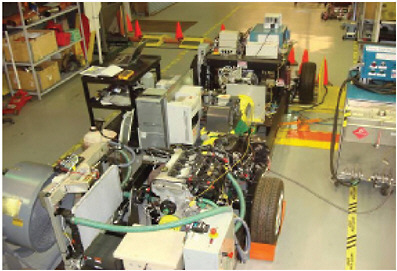
An approach to characterize a system using several hardware components without building the entire vehicle is shown in Figures H-12 and H-13. The Modular Automotive Technology Testbed (MATT) has been developed to easily replace components by switching different plates. In the example below, a pretransmission parallel hybrid is shown. This concept allows the entire power train (or most of it) on a rolling chassis dynamometer in a controlled environment. However, like most approaches, it also shows some limitations, including lack of under-hood thermal management or the presence of a T-shaped reduction box to connect the wheels.
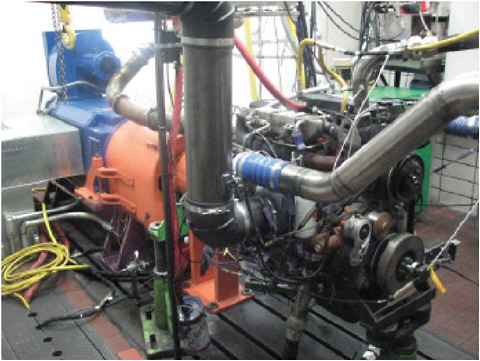
FIGURE: H-10 Engine on dynamometer. SOURCE: Courtesy of Cummins.
PROCESS SELECTION
Different processes can be used to provide inputs for regulation depending on the technology considered and the degree of validation of the models. Ideally, if all the models have been thoroughly validated, one would like to only perform simulations to provide regulatory inputs. Realistically, since the state-of-the-art models do not yet fulfill all engineering expectations (e.g., engine emissions or cold start), a combination of hardware and software will most certainly have to be used for the foreseeable future. A couple of examples highlighting the potential use of each process are given in Figure H-14.
UNDERSTANDING UNCERTAINTIES
To select a process to properly characterize a particular technology, it is compulsory to understand and quantify the uncertainties associated with each process. Examples of questions that need to be addressed within each process and in between processes are given below.
Process Uncertainty
Uncertainty resides within each process and should be properly quantified. The following provides some examples for different processes.
-
Test facility to test facility variability. A 2002 report from the Automotive Testing Laboratory [source CRC E-55-1 Inter-laboratory Crosscheck of Heavy-Duty Vehicle D.PDF] highlights the discrepancies between several vehicle testing facilities. Figure H-15 shows significant differences among the six laboratories. The main difference (Lab C) is mainly due to high-altitude impact, while the smaller discrepancies among the other laboratories are related to a series of reasons ranging from testing process to road load curve to driver technique. However, it should be noted that for the truck employed, particulate matter (PM) was a species that is far more sensitive to test conditions than fuel use.
-
Test-to-test variability. While the testing conditions (e.g., temperature, humidity) are maintained constant during testing, several other factors affect dynamometer test results. One of the main factors is due to the driver, whether related to gear selection or engine on/off for hybrid vehicles. It is important to note that the driver model chosen in simulations will also affect results and is more repeatable than a human driver but must be chosen to be representative of a human driver.
While the impact can be important for conventional vehicles, especially when using manual transmissions, it is even more so for hybrid electric vehicles, due to
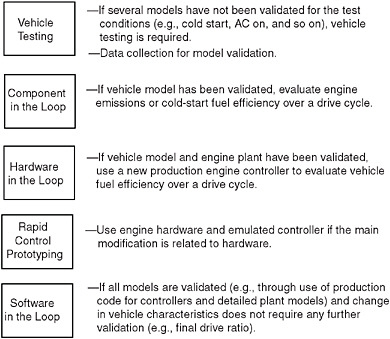
FIGURE H-14 Example of potential process use.
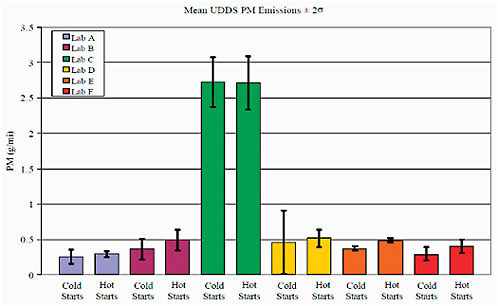
FIGURE H-15 Mean particulate matter results with two standard deviation error bars. SOURCE: Argonne National Laboratory.
-
the sensitivity of the engine on/off related to the pedal position.
-
Delay impact. For several processes that include a mix of hardware and software, including CIL, SIL, or HIL, delays introduced by some hardware on the command and feedback can significantly affect the results. Dynamometer slew rate and command methodology (e.g., analog, digital, CAN) are some of the examples to be addressed. Such delays over an entire drive cycle could lead to several percentage point differences in energy, which would impact the results for both fuel efficiency and emissions. As a result, levels of acceptable delays should be defined for each process and potentially each technology to provide a low level of uncertainties.
-
Appropriate selection of level of modeling. To simulate specific phenomena properly, an appropriate level of modeling must be selected. As such, engineers do not use the same models at the beginning of a project to compare different power train configurations as toward the end of a project when the focus is on drive quality and emissions. For regulatory purposes, the approach might be similar. The committee recommends that a study should be conducted to assess the uncertainty between different levels of modeling for specific components.
-
Data collection for model instantiation. For the models to represent technologies properly, it is necessary to populate them with accurate sets of parameters. The conditions at which these parameters are measured along with the instrumentation will influence the uncertainty of the final simulations. As such, characterization of the parameters for several systems should be clearly defined. This would include rigorous evaluation protocols for the evaluation of coefficients for tire rolling resistance and aerodynamic drag to ensure consistency and minimize uncertainty.
In addition, even if using more detailed models (e.g., zero-dimensional engine model rather than steady state) can lead to better representation of the transients, such models do require significantly more testing and data collection to properly represent the system. As such, a trade-off analysis should be performed to evaluate the additional testing required to populate the detailed models compared to the added accuracy they provide. This accuracy evaluation may be dependent on the evolutionary stage of the technology and cannot be considered static.
In-between Processes
When selecting a process, it is important to understand the uncertainties introduced by the methodology employed. For example, using an engine on the dynamometer (CIL) versus testing the entire vehicle will lead to differences in results as they each have different uncertainty sources. While the driver will have the largest impact on the results during chassis dynamometer testing, the driver is not a factor anymore during
the CIL process, where delays and model uncertainties account for most of the uncertainties. As a result, it is important to quantify each process, as one might not necessarily lead to greater uncertainties than another one.
Need for Process Standardization
As shown in Figure H-16, each process should be standardized, from data gathering to model validation and reporting of results.
-
Hardware set-up process. For any process involving hardware, from HIL to RCP or vehicle testing, detailed test procedures should be developed to ensure consistency across organizations. While some work has been performed for vehicle testing, little to no work has been done for HIL and RCP, and more work is required to validate or improve vehicle test protocols.
-
Validation process. From a modeling point of view, a critical need is to define what validation means and how it should or could be quantified. While all engineers claim their models are validated, the assumptions behind each one can vary significantly.
A detailed process should be developed, describing what tests should be performed to validate specific subsystems, systems, or vehicles. A report should be provided to the regulatory agency demonstrating the process and the results of the validation. This report could be generic and automatically developed based on the list of required parameters or comparisons for the regulation.
-
Appropriate modeling level. Using wrong assumptions can lead to erroneous conclusions; errors can come from modeling assumptions or from data. To answer the right questions, users need to have the right modeling tools. For instance, one common mistake is to study engine emissions by using a steady state model or to study component transient behavior by using a backward model. A study providing general guidance would accelerate development of the required models.
-
Regulatory report. Since the results must be approved for regulatory purposes, a generic report should be defined so that every original equipment manufacturer provides the same information. This report or set of reports would include not only the results but also the assumptions and details of the simulations or tests for selected critical parameters to ensure validity and consistency of the results.
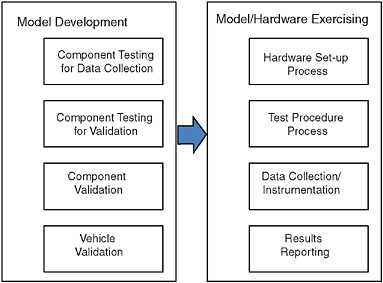
FIGURE H-16 Main phases requiring standardized processes.


