
3
Review of Current Regulatory Approaches for Trucks and Cars
The industry built around the use, servicing, and manufacture of medium- and heavy-duty vehicles is large and diverse. Manufacturers, for example, produce many customer-specific configurations assembled with components from multiple suppliers. To aid consideration of what part of the industry should be regulated and how regulations could be implemented, this chapter reviews current regulations and certification protocols as they might apply to medium-and heavy-duty truck fuel consumption. Regulations for medium- and heavy-duty truck fuel economy already exist in Japan and are under development in the European Union (EU). In the United States, California has promulgated rules for heavy-duty truck fuel economy based on the SmartWay voluntary program of the U.S. Environmental Protection Agency (EPA). Regulation of the fuel economy of passenger vehicles began in the United States in 1975, building on the emissions certification procedures already in place since the 1960s. Emissions regulations for heavy-duty trucks have been in force since the early 1970s. Because the test procedures and standards have been revised several times, regulators have repeatedly been faced with the challenge of regulating an extremely diverse industry. In addition, regulation of safety cuts across component suppliers and truck assemblers. Other regulations of interest govern truck size and weight, which are covered in Chapter 7.
EUROPEAN APPROACH
In June 2007 the European Commission (EC) began a study to explore test procedures and metrics for measuring fuel consumption and carbon dioxide (CO2) emissions. The study initially focused only on the engine and on efficiencies that could be gained through technologies related to the engine. Through active collaboration with heavy-duty truck manufacturers, the EC began to define a variety of duty cycles for the various vocational uses of such trucks. As a result of the collaborative work, in June 2008 the scope of the study and test procedure was expanded to include the whole vehicle and was planned to include alternative driveline concepts such as hybrids, as well as the aerodynamics of both tractor and trailer, gross combination vehicle weight, loading capacity, rolling resistance, and all other technologies that could be applied to reduce fuel consumption.
The absence of a uniform vehicle size and configuration and the existence of myriad possible duty cycles, however, contribute to an enormous degree of complexity in defining a regulation that can be applied. The result is that a simple “one size fits all” approach to measuring CO2 emissions or fuel efficiency is not feasible. Further, full-vehicle testing of even a fraction of the possible combinations of vehicles and duty cycles would be prohibitively costly.
The absence of uniform vehicles and duty cycles also led the EC to conclude that any metric used should include some indication of the work done as well as the fuel used (e.g., liters of fuel per ton-kilometer).
As a result of the study, the European Automobile Manufacturers Association and the European Council for Automotive R&D have proposed a project to develop a methodology to evaluate the fuel efficiency of heavy-duty vehicles using computer simulation. This will provide a common tool for determining the fuel efficiency and CO2 generation of heavy-duty vehicles, buses, and coaches over a wide range of duty cycles, taking into account the many possible configurations and mission profiles. Figure 3-1 provides an overview of the proposed approach and simulation tool. The program began in 2009 with a projected 4-year timeline, resulting in a fuel economy regulation for the European Union in 2013-2014. It is expected that the truck manufacturer will be the regulated entity, given the widespread integration of truck and engine manufacturers. As is evident in Figure 3-1, the EC is considering a work-based metric of fuel consumed per payload mass, payload volume, or number of passengers carried per distance traveled.
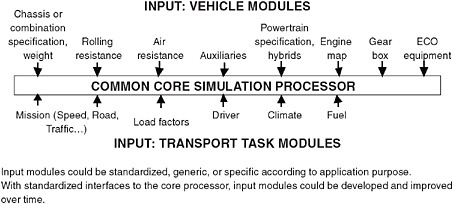
FIGURE 3-1 Overview of simulation tool and methodology proposed for use in the European Union. Both inputs and results are declared transparently. SOURCE: Stefan Larsson, European Auto Manufacturers, presentation to the committee.
JAPANESE APPROACH
Regulation of fuel consumption in Japan is directly linked to Japan’s commitment under the Kyoto Protocol to reduce greenhouse gases.1 In Japan, heavy-duty trucks account for 25 percent of the greenhouse gases generated by automotive sources. The “Top-Runner Standard” for measuring fuel consumption was started for heavy-duty trucks in 2006, with a target implementation date of 2015. The vehicle manufacturer is the regulated entity. In Japan the engine and heavy-duty vehicle manufacturers are integrated and few in number, so the point of regulation is more obvious than in the United States.
As in Europe, the process began with collaborative meetings with the heavy-duty truck manufacturers to collect data on vehicles and technologies that could improve fuel consumption. However, unlike in Europe, the primary focus in Japan is on improvements due to changes in engine technology only, rather than to the whole vehicle, and the metric used is “kilometers/liter,” with differing standards for different weight classes (Figure 3-2).
Fuel consumption is evaluated through computer simulation based on a combination of an urban duty cycle defined in JE005, used for emissions testing, and an interurban cycle developed for fuel economy testing. The simulation tool, which is available online for manufacturers to use, requires vehicle specifications and engine fuel maps as input data. An overview of the simulation methodology is given in Figures 3-3 and 3-4.
The vehicle simulation tools used by Japan’s Ministry of Land, Infrastructure, Transport, and Tourism evaluate the fuel consumption and performance of conventional vehicles. The software, available in both FORTRAN and C++, allows users to modify the transmission ratio, the final drive ratio, the wheel radius, and the main engine characteristics (including wide-open-throttle and closed-throttle torque curves as well as fuel rate map). However, it forces most of the remaining parameters to remain constant. As such the vehicle characteristics (weight, frontal area, drag coefficient) or component losses (efficiencies) cannot be modified. Moreover, advanced shifting control algorithms that might be available cannot be implemented. The impact of active regeneration of diesel particle filters is handled by calculating the ratio of vehicles with this feature to those without it (Sato, 2007). Overall, the tool allows evaluation of new engine technologies while keeping the rest of the power train and vehicle unchanged. Finally, only two drive cycles can currently be selected.
Because the Japanese program focuses on engines, new methodologies for measurement must be developed as new technologies are introduced to account for their contribution to improving fuel consumption. There is currently no provision in the simulations to take these contributions into account.
Because of the large reductions in fuel consumption achievable with hybrid electric trucks, a measurement method for this technology was included in the Japanese regulation. To measure the contribution of hybrid technology, the Japanese developed hardware-in-the-loop simulation (HILS) testing (Figure 3-5; see also Appendix H) and used it for measuring emissions, as well as calculating fuel consumption. HILS substitutes for the conversion program (see Figure 3-4) used in the process for nonhybrid vehicles (Morita et al., 2008). Details of the method and validation are available in Morita et al. (2008). The HILS approach was recently recommended for further study and potentially wider implementation (in Europe and beyond) for hybrid vehicles by an international committee of engine and vehicle manufacturers.
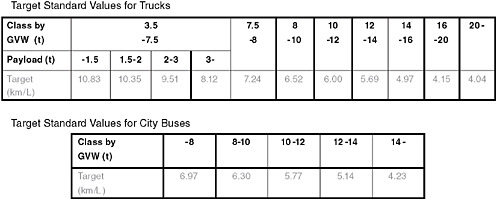
FIGURE 3-2 Japanese fuel economy targets for heavy-duty vehicles by weight class. The target is for fiscal year 2015. SOURCE: Presentation to the committee by Akihiko Hoshi, Ministry of Land, Infrastructure, Transport, and Tourism, Japan.
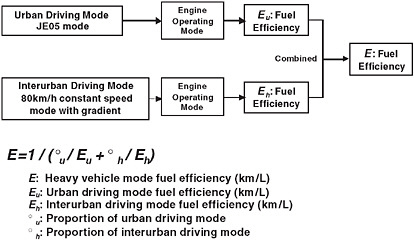
FIGURE 3-3 Japanese simulation method incorporating urban and interurban driving modes. SOURCE: Presentation to the committee by Akihiko Hoshi, Ministry of Land, Infrastructure, Transport, and Tourism, Japan.
U.S. APPROACH: EPA SMARTWAY VOLUNTARY CERTIFICATION PROGRAM
In 2004 the EPA began development and implementation of SmartWay, an organized effort to specify a collection of current and emerging technologies for creating efficient tractor-trailer combinations with the best environmental performance in terms of both air pollution and emission of greenhouse gases. The certification program uses existing (2007) EPA test methods, supplemented by additional testing, available industry test data, and ongoing research. SmartWay designations are limited to new passenger vehicles (cars, light trucks, sport utility vehicles, vans), new Class 8 sleeper trucks, new 53-ft dry van trailers, and retrofit 53-ft dry van trailers but will include other truck types in the future. The partnership program under SmartWay includes other types of trucks above 8,500 gross vehicle weight rating, in that some participants include their medium-duty trucks in the partnership. Certification allows carriers, manufacturers, and shippers to apply the SmartWay logo (Figure 3-6) to their products as a signal to consumers and the community that they are taking actions to limit the negative environmental impacts of their business operations.
To attain SmartWay certification, tractors must have an aerodynamic profile that includes a high roof sleeper, integrated roof fairings, cab side extenders, fuel tank side fairings, and aerodynamic bumpers and mirrors (Figure 3-7). They must be powered by a 2007 or newer engine, with a SmartWay-approved option for idle reduction. The tires must be SmartWay-approved, low-rolling-resistance tires; the use of aluminum wheels for weight reduction is an option. The tractor specification is a design attribute only. EPA sets no vehicle-level performance targets in SmartWay and requires
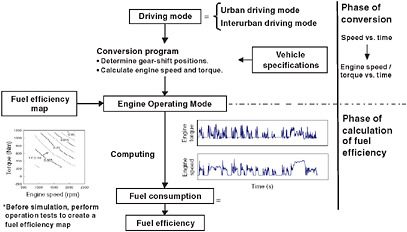
FIGURE 3-4 Japanese simulation method overview. SOURCE: Presentation to the committee by Akihiko Hoshi, Ministry of Land, Infrastructure, Transport, and Tourism, Japan.
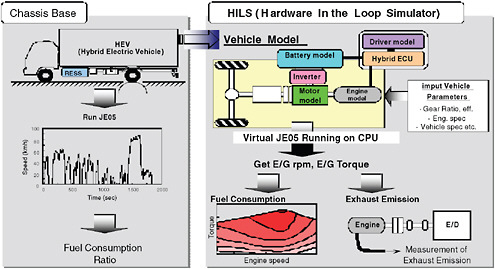
FIGURE 3-5 Japanese hardware-in-the-loop simulation (HILS) testing of hybrid vehicles. SOURCE: Presentation to the committee by Akihiko Hoshi, Ministry of Land, Infrastructure, Transport, and Tourism, Japan.
no technical validation (although in the case of tires, for example, data proving low rolling resistance must be supplied for the designation). All six major U.S. truck manufacturers have one or more complying tractors. Manufacturer compliance with the SmartWay specification is completely voluntary.
SmartWay certification applies to 53-ft or longer dry box van trailers as well. To attain certification, these trailers must have side skirt fairings, a front gap or rear fairing, and SmartWay-approved low-rolling-resistance tires and can have aluminum wheels. The fairings, tires, and wheels can be either provided by the original equipment manufacturer (OEM) on new trailers or retrofitted to older trailers. Several OEMs currently offer at least one SmartWay trailer model, and several manufacturers have developed aerodynamic components that can be retrofitted. EPA has validated trailer side skirts, trailer boat tails, and trailer gap reducers.
As an alternative to the aerodynamic specification for the trailer, the EPA will grant certification upon review of demonstrated equivalent environmental performance for the aerodynamic specification, defined as 5 percent or greater fuel savings using an SAE J13212 test track procedure as modified by EPA.

FIGURE 3-6 EPA’s SmartWay logos. SOURCE: “External SmartWay Marks: SmartWay Tractors and Trailers,” available at http://www.epa.gov/otaq/smartway/transport/what-smartway/tractor-trailer-markuse.htm.
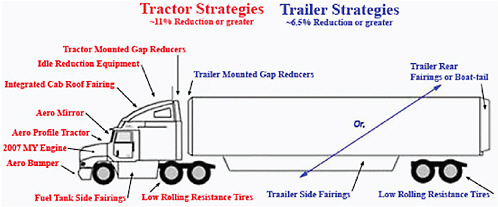
FIGURE 3-7 Some of the aerodynamic technologies included in the SmartWay certification program. SOURCE: Mitch Greenberg, EPA, “SmartWay Voluntary Certification Program,” presentation to the committee.
CALIFORNIA REGULATION BASED ON EPA SMARTWAY PROGRAM
One of the most significant consequences of the SmartWay certification program is action taken by the California Air Resources Board. With the intention to reduce the state’s greenhouse gas emissions to 80 percent of 1990 levels by 2020, in 2006 the California legislature approved the Global Warming Solutions Act. A resulting action in December 2008 was the adoption of a measure that defines a schedule by which all tractor-trailer combinations that operate in California will be required to implement SmartWay technologies.
Beginning in January 2010, with the 2011 model year, all sleeper cab tractors that pull 53-ft or longer box van trailers must be SmartWay certified. Day cab tractors must have SmartWay-approved low-rolling-resistance tires. At the same time, in model year 2011 and beyond, all 53-ft or longer van trailers must also be SmartWay certified, based on either OEM equipment or retrofits. The legislation also calls for retrofitting older trailers with SmartWay-approved technologies, providing a phase-in period for larger fleets from 2010 to 2015 and for smaller fleets from 2013 to 2016.
LIGHT-DUTY-VEHICLE FUEL ECONOMY STANDARDS
The development of fuel consumption standards for passenger vehicles provides useful lessons for consideration in trucks and buses. In 1975, Congress enacted the Energy Policy and Conservation Act (EPCA, P.L. 94-163), with the goal of reducing the nation’s dependence on foreign oil by a number of measures, including doubling the fuel economy of passenger vehicles. The statute established a Corporate Average Fuel Economy (CAFE) program, which requires automobile manufacturers to increase the sales-weighted average fuel economy of their passenger car and light-truck fleets sold in the United States. The metric chosen by Congress for expressing the standard was fuel economy expressed in miles per gallon (mpg).
Measurement
Passenger vehicle fuel economy is determined by testing a vehicle on a chassis dynamometer. In the laboratory the vehicle’s drive wheels are placed on two 48-in.-diameter metal rollers—the dynamometer—that simulate the loads experienced by the vehicle in the real world. The energy required to move the rollers is adjusted to account for the vehicle’s weight and wind resistance and for the tire rolling resistance of the two undriven wheels. The laboratory testing is very repeatable and precise, allowing consistent results across the vehicle fleet.
The levels of hydrocarbons (HCs), carbon monoxide (CO), carbon dioxide (CO2), and nitrous oxides (NOx) in the exhaust are measured using a constant-volume sampling system. Fuel consumption is determined by summing all the carbon in the exhaust and converting this to gallons using the amount of carbon per gallon, although direct measurement of fuel consumed is greatly improved and is now routinely used in parallel.
Manufacturers test their own vehicles and report the results to EPA. EPA reviews the results and confirms them by testing 10 to 15 percent of the certified models at its own laboratory. About 1,250 vehicle models are certified annually (EPA, 2006a). EPA is empowered to audit production-line vehicles for compliance. For post-production vehicles in use, EPA conducts tests of vehicles from customers in real service and gathers data from onboard diagnostics records and manufacturer in-use verification testing. EPA is empowered to require a recall of vehicles to correct defects in emission control systems.
Test Cycles
A test cycle is a series of driving routines that specify the vehicle speed for each second during a particular test. Two test cycles were originally used for determining compliance with CAFE standards: (1) a city cycle originally developed in the mid-1960s to represent home-to-work, urban commuting, commonly referred to as the FTP (federal test procedure), and (2) a highway test cycle that represents a mix of rural and interstate highway driving.
The FTP was developed for emission control purposes, not fuel economy, and the highway test reflects the 55-mph speed limit that was in effect when the cycle was created. The EPA quickly realized that these factors caused the tests to overstate the average in-use fuel economy. EPA spent several years analyzing the average offset and in 1984 issued adjustments for the fuel economy label values that had been required on window stickers for all new cars since 1978. For the labels the city test results were discounted by 10 percent and the highway test results were discounted by 22 percent. However, the unadjusted values continued to be used for CAFE purposes, as the EPCA specified that the test procedures in place in 1975 must continue to be used for calculating CAFE values.
In 2006, EPA reevaluated the difference between the test results and the fuel economy experienced by the average consumer. It found that the gap had widened since the early 1980s, in part because the underlying test procedures did not fully represent real-world driving conditions. Thus, three additional tests have been added to the original city and highway estimates to adjust for higher speeds, air-conditioning use, and colder temperatures. These tests, applied beginning in 2008, were developed in two previous rulemakings for the purpose of controlling emissions under conditions not included in the original FTP test. For the revised fuel economy labels, rather than basing the city mpg estimate solely on the adjusted FTP test result, and the highway mpg estimate solely on the adjusted highway fuel economy test (HFET) result, each estimate will be based on a multiequation “composite” calculation of all five tests, weighting each appropriately to arrive at new city and highway mpg estimates. The new city and highway estimates will each be calculated according to separate city and highway “five-cycle” formulas based on fuel economy results over these five tests. A simplified approach, called the mpg-based method, will be an interim option in the first 3 years of the program and an available option under certain circumstances in subsequent years. It relies on data from the FTP and HFET cycles (EPA, 2006b).
Table 3-1 lists the key parameters of the five tests used to determine the fuel economy (of passenger vehicles) that is listed on the familiar window stickers.
In summary, light-duty-vehicle emissions and fuel consumption regulations exemplify the compromises necessary due to the diversity of vehicle types and uses. One set of drive cycles is applied to about 1,200 vehicle models, over a wide range of weights, with the heaviest about twice the weight of the lightest. Similarly, drive cycles cover a wide range of powers, with the highest about five times as powerful as the lowest. Light-duty fuel economy regulations adopted the same testing protocols used for emissions certification, and numerous adjustments and correction factors have been needed to bring reported fuel economy values closer to consumer (real-world) experience. Concepts and recommendations for CAFE predated the regulation by 1 to 2 years, and the regulation was not implemented until 1978. Hence, even though there was the foundation of the emissions regulations, the time, and presumably effort, needed to implement CAFE and its test protocols were very substantial (Greene and DeCicco, 2000).
HEAVY-DUTY-ENGINE EMISSIONS REGULATIONS
Background, Test Methods, and Cycles
Pollutant emissions from heavy-duty vehicles are regulated in terms of emissions from their engines. Faced with how to regulate emissions given the great diversity of heavy-
TABLE 3-1 Fuel Economy Vehicle Testing
|
Driving Schedule Attributes |
Original Test Cycles |
New Test Cycles |
|||
|
City |
Highway |
High Speed (US06) |
Air-Conditioning (AC) (SC03) |
Cold Temperature |
|
|
Trip type |
Low and moderate speeds in urban traffic |
Free-flow traffic at highway speeds |
Higher speeds; harder acceleration and braking |
AC use under hot ambient conditions and full sun load |
City test w/cold outside temperature |
|
Top speed |
56 mph |
60 mph |
80 mph |
54.8 mph |
56 mph |
|
Average speed |
21.2 mph |
48.3 mph |
48.4 mph |
21.2 mph |
21.2 mph |
|
Maximum acceleration |
3.3 mph/sec |
3.2 mph/sec |
8.46 mph/sec |
5.1 mph/sec |
3.3 mph/sec |
|
Simulated distance |
11 miles |
10.3 miles |
8 miles |
3.6 miles |
11 miles |
|
Time |
31.2 min. |
12.75 min. |
9.9 min. |
9.9 min. |
31.2 min. |
|
Stops |
23 |
None |
4 |
5 |
23 |
|
Idling time |
18% of time |
None |
7% of time |
19% of time |
18% of time |
|
Engine startupa |
Cold |
Warm |
Warm |
Warm |
Cold |
|
Lab temperature |
68°-86°F |
|
|
95°F |
20°F |
|
Vehicle air conditioning |
Off |
Off |
Off |
On |
Off |
|
aA vehicle’s engine does not reach maximum fuel efficiency until it is warm. SOURCE: Department of Energy. |
|||||
duty vehicles, EPA chose many years ago to regulate the engine manufacturers. A number of reasons can be cited: in many cases the engine and chassis are produced by different manufacturers; it is more efficient to hold a single entity responsible; and testing an engine cell is more accurate and repeatable than testing a whole vehicle. About 275 engine models are certified for heavy trucks each year, considerably fewer than the number of passenger vehicles that are certified.
Emissions standards for heavy-duty engines are expressed in terms of mass (grams) per unit of energy output. Energy output is expressed in horsepower-hours (hp-hr) or kilowatt-hours (kWh), so the standards are expressed as g/hp-hr or g/kWh. The Code of Federal Regulations (40 CFR Part 86) requires that the engine be connected to a dynamometer in a test cell and be exercised through a transient test procedure (the FTP). The FTP was created from data logged from trucks and buses operating in Los Angeles and New York as part of the CAPE-21 Coordinating Research Council (CRC) program of 1973 to 1977 (CRC, 1973, 1974, 1977). Speed data were converted to percentage values with idle speed set at zero percent and rated speed set at 100 percent; torque data were converted to a zero to 100 percent torque referenced to zero torque and maximum engine torque at each speed. The FTP was created using a Monte Carlo simulation based on percent speed and percent torque probabilities. The diesel engine procedure consists of a time sequence of rotational speed and torque set points determined from a table of dimensionless speeds and torques and a full-power map of the engine (Figure 3-8). Torque and speed regression criteria are available to determine whether the engine has been properly loaded during the test. A separate FTP schedule exists for heavy-duty gasoline engines.
The whole engine exhaust is fed to a full-flow dilution tunnel and is mixed with dilution air to produce a constant-volume flow. Gaseous concentrations are measured at a sampling point downstream in the dilution tunnel and are integrated with respect to the flow to yield a total mass for the cycle. A background correction is applied to remove the mass of pollutant that may be in the dilution air. The net mass is divided by the energy out of the engine over the cycle to yield brake-specific emissions. Particulate matter (PM) is measured by filtering a slipstream of dilute exhaust, weighing the filter, and projecting the total PM mass from the ratio of total flow to slipstream flow. Although NOx, CO, and HCs are the regulated emissions, CO2 is also measured in most test cells, and this measurement may be used to project the engine brake-specific fuel consumption. Fuel mass or volume flow is also measured in many test cells, providing a separate check. During the testing, certain loads, such as water pump and oil pump demands, are met by the engine, but engine coolant heat exchange and intercooler heat removal are supplied by the test cell.
The practice of testing and certifying only the engine (across selected cycles), and not the entire vehicle, was an accepted compromise for pollutant emissions. Even with this simplified engine-only approach, the FTP transient test procedures were under development at EPA for 5 years, and several years more were needed for the industry to employ electric dynamometers, constant-volume samplers, dilution systems, and new measurement systems for PM (Merrion, 2002).
How representative of on-road emissions are the current engine dynamometer procedures? John Wall presented an analysis to the committee comparing CO2 emissions from the certification test process to over-the-road vehicle fuel consumption data.3 For line-haul truck duty cycles, CO2 emissions from vehicle field data were within 3.7 percent of the CO2 emissions predicted from the Supplementary
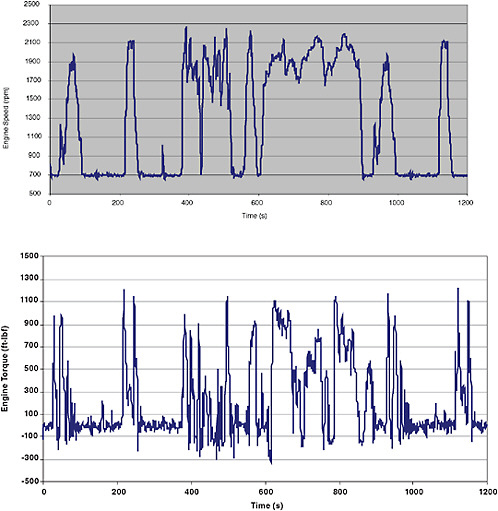
FIGURE 3-8 FTP speed (top) and torque (bottom) from a specific engine following the transient FTP on a dynamometer. SOURCE: Based on data from West Virginia University.
Emission Test (SET) 13 mode engine data. For a set of field-monitored vocational trucks, the FTP transient engine test data predicted CO2 emissions to within 4.0 percent of the on-road results. Further analysis would be needed to determine the breadth of vehicles and duty cycles that an engine-only test could accurately cover, and this correlation would not be expected to hold true for hybrid vehicles.
Certification and Enforcement
The emissions certification process begins with a meeting with EPA to review the manufacturer’s product line and to describe the emission control systems. Agreement is reached on engine families that have similar displacements, number of cylinders, fuel injection systems, turbocharging systems, and after-treatment systems. Several ratings of horsepower, torque, and rpm can be included in one family. Emissions testing then follows, conducted by the engine manufacturer. This testing involves one “data engine” and a durability/deterioration factor (DF) engine for each family. The data engine is run for 125 hours and emissions measured on the FTP and on the ramp modal cycle (RMC). The RMC replaced the SET but is still a 13-mode steady-state test with emissions also measured during the ramp between modes. The DF engine is run for a period of time that is representative of 35 percent of the engine’s useful life, such as 1,000 hours at full load,
to demonstrate the durability of the emissions control system and to establish the emissions deterioration. Emissions are measured at three points during the DF test (125 hours, midpoint, and end of test) on the FTP and RMC. Following testing, all data are submitted to EPA as part of the application for certification.
Following certification and production, an enforcement process is in effect. EPA can come into the production facility and perform a Selective Enforcement Audit. It can sequester 25 to 30 engines and start an audit process under which five of these engines must be under the emission standards as measured on the FTP and RMC after a 125-hour conditioning period. If failures occur, a statistical process is used that may require all (25 to 30) engines to be tested. EPA can also do in-use emissions testing on vehicles in regular service. This testing is done using a Portable Emission Measurement System either over-the-road or on a chassis dynamometer. Emissions are measured over a 30-minute period (constantly updating) and a determination is made as to whether emissions are exceeding the not-to-exceed values (usually either 125 or 150 percent of the regulated values depending on the engine family).
Compliance flexibility is provided with averaging, banking, and trading, which can take place among engine families or with other manufacturers. Also, a provision to pay non-compliance penalties is available if the manufacturer wants to certify to an emissions level higher than the standard.
Chassis Testing for Certain Heavy Vehicle Classes
A chassis cycle or schedule may be used for the emissions certification of certain Class 2B vehicles as an alternative to the heavy-duty engine dynamometer procedure. Historically, the Class 2B vehicle manufacturer was also the manufacturer of the engine, because Class 2B vehicles were gasoline powered and usually produced by a light-duty-vehicle manufacturer. EPA Tier 2 light-duty emissions requirements were extended to include medium-duty passenger vehicles, which are between 8,501 and 10,000 lb gross vehicle weight (GVW) and may include diesel-powered vehicles. The EPA’s 2006 regulatory announcement (EPA, 2006b) explains that larger sport utility vehicles and vans (8,501- to 10,000-lb GVW) will require light-duty-style fuel economy measurements from 2011. California’s Low Emission Vehicle (LEV II) regulations cover emissions from vehicles in the 8,501- to 14,000-lb range through chassis testing. A federal option also exists for chassis testing of vehicles up to 14,000 lb GVW.
Nonroad Engines
EPA began regulation of nonroad engines in the mid-1990s, with regulations now covering the immense range from handheld spark ignition engines (such as leaf blowers) to locomotive engines. Stated by EPA as being one of the most complex sets of emissions regulations undertaken, the certification process focuses again on the engine only, tested over prescribed cycles or steady-state modes. The engines are divided into many classes depending on the size and type of use, and test cycles are prescribed for each class.
REGULATORY EXAMPLE FROM TRUCK SAFETY BRAKE TEST AND EQUIPMENT
Heavy-duty vehicle regulations can be complex; however, there are examples of compliance mechanisms that provide flexibility and minimize the burden on industry. An illustrative example is performance-based Federal Motor Vehicle Safety Standard (FMVSS) 121, which requires that a vehicle stop within a certain distance from an initial speed when loaded to the GVW rating (Table 3-2). The stopping distance is dependent on vehicle type. For example, from an initial speed of 60 mph, truck tractors must stop within 355 ft, single-unit trucks within 310 ft, and buses within 280 ft (NHTSA, 2004). This example illustrates clearly that regulatory requirements can differ for the various vehicle types within the general class of heavy-duty vehicles.
The brake performance evaluation of trailers is carried out differently than for trucks and buses in that, because they are not self-powered, trailers have a dynamometer requirement rather than a test track requirement (NHTSA, 1990). This illustrates that the test methods for a given heavy-duty vehicle regulation can vary significantly depending on the vehicle unit (e.g., truck-tractors or trailers).
Because the heavy-duty truck market is so complex, and many of the vehicles are custom-built (as discussed in Chapter 2), regulations applied at the final stage of manufacture can pose a heavy burden on the manufacturer. However, this burden can be lessened by “type approval” at the component level. For example, in the case of brake regulations, truck axle manufactures supply brakes with the axle assemblies properly sized and rated for the load that the axle is designed to carry. By using these axles the final-stage manufacturer can assure compliance with the brake regulations without
TABLE 3-2 Stopping Distances Required by FMCSS 121 Regulation
|
Vehicle Speed (mph) |
Service Brake Stopping Distance (ft) |
|||
|
Loaded and Unloaded Buses |
Loaded Single-Unit Trucks |
Unloaded Truck Tractors and Single-Unit Trucks |
Loaded Truck Tractors |
|
|
20 |
32 |
35 |
38 |
40 |
|
25 |
49 |
54 |
59 |
62 |
|
30 |
70 |
78 |
84 |
89 |
|
35 |
96 |
106 |
114 |
121 |
|
40 |
125 |
138 |
149 |
158 |
|
45 |
158 |
175 |
189 |
200 |
|
50 |
195 |
216 |
233 |
247 |
|
55 |
236 |
261 |
281 |
299 |
|
60 |
280 |
310 |
335 |
355 |
|
SOURCE: Adapted from NHTSA (2004). |
||||
having to test each vehicle. In effect the regulatory effort has cascaded down to the component manufacturer, providing much-needed design flexibility to the final-stage manufacturer (which would not have to test every vehicle design variation). Aspects of this regulatory model may prove useful in the development of regulatory instruments for governing heavy-duty truck fuel consumption.
FINDINGS
Finding 3-1. Regulators have dealt effectively with the diversity and complexity of the vehicle industry for current laws on fuel consumption and emissions for light-duty vehicles. Engine-based certification procedures have been applied to address emissions from heavy-duty vehicles and the myriad of nontransportation engines. Regulators and industry have reached consensus in these cases, but years of development of procedures and equipment for certification, compliance, and the defining the standards themselves have been required. Standardized drive or operating cycles are utilized in all emissions and fuel consumption regulations to represent actual use of the vehicle or engine.
Finding 3-2. The heavy-duty-truck fuel consumption regulations in Japan, and those under consideration and study by the European Commission (EC), provide valuable input and experience to the U.S. plans. In Japan the complexity of medium- and heavy-duty vehicle configurations and duty cycles was determined to lend itself to the use of computer simulation as a cost-effective means to calculate fuel efficiency. The EC studies thus far indicate plans to develop and use simulations in the expected European regulatory system. Japan is not using extensive full-vehicle testing in the certification process, despite the fact that its heavy-duty-vehicle manufacturing diversity is less than in the United States, with relatively few heavy-duty-vehicle manufacturers and no independent engine companies.
Finding 3-3. The existing regulations pertaining to medium- and heavy-duty vehicle safety and emissions provide examples indicating that the industry’s diversity is addressed by requiring compliance, or at least conformity, at the component level, reducing the regulatory burden on the final-stage manufacturer and thus preserving the flexibility of assembly to meet customer demands.
Finding 3-4. The legislation passed by California requiring tractor-trailer combinations to be SmartWay certified will have a significant impact on the number of vehicles in the United States that are specified with fuel-efficient technologies beginning in 2010.
REFERENCES
CRC (Coordinating Research Council). 1973. Heavy-Duty Vehicle Driving Pattern and Use Survey. Columbia, S.C.: Wilbur Smith and Associates. May.
CRC. 1974. Heavy-Duty Vehicle Driving Pattern and Use Survey: Part II—Los Angeles Basin. Columbia, S.C.: Wilbur Smith and Associates. February.
CRC. 1977. Truck Driving Pattern and Use Survey—Phase II. Columbia, S.C.: Wilbur Smith and Associates. June.
EPA (U.S. Environmental Protection Agency). 2006a. Fuel Economy Labeling of Motor Vehicles: Revisions to Improve Calculation of Fuel Economy Estimates, Final technical support document. 40 CFR Parts 86 and 600 [EPA-HQ-OAR-2005-0169; FRL-8257-5]. Federal Register: Dec. 27, 2006 (Vol. 71, No. 248): Rules and Regulations: Pp. 77871-77969.
EPA. 2006b. Regulatory Announcement: EPA Issues New Test Methods for Fuel Economy Window Stickers. EPA fact sheet, document number EPA420-F-06-069. Available at http://www.epa.gov/fueleconomy/420f06069.htm.
Greene, D., and J. DeCicco. 2000. Engineering and economic analyses of automotive fuel economy potential in the United States. Annual Review of Energy and the Environment. Vol. 25, pp. 477-535. November.
Merrion, D. 2002. Heavy Duty Diesel Emissions, Fifty Years, 1960-2010. Proceedings of the 2002 Fall Technical Conference of the ASME Internal Combustion Engine Division, New Orleans, La., Sept. 8-11. New York: American Society of Mechanical Engineers.
Morita, K., K. Shimamura, S. Yamaguchi, K. Furumachi, N. Osaki, S. Nakamura, K. Narusawa, K-J. Myong, and T. Kawai. 2008. Development of a fuel economy and exhaust emissions test method with HILS for heavy-duty HEVs. SAE Paper 2008-01-1318. Also in SAE International Journal of Engines.
NHTSA (National Highway Traffic Safety Administration, U.S. Department of Transportation). 1990. Laboratory Test Procedure for Federal Motor Vehicle Safety Standards and Regulations No. 121D, Air Brake Systems—Dynamometer, TP-121D-01. May. Available at http://www.nhtsa.dot.gov/cars/rules/import/fmvss/index.html#SN121.
NHTSA. 2004. Laboratory Test Procedure for FMVSS, No. 121, Air Brake Systems, TP-121V-05. March 12.
Sato, S. 2007. Fuel Economy Test Procedure for Heavy Duty Vehicles, Japanese Test Procedures, Presented at the IEA/International Transport Forum Workshop on Standards and Other Policy Instruments on Fuel Efficiency for HDVs, Paris France, June 21-22.


