
6
Costs and Benefits of Integrating Fuel Consumption Reduction Technologies into Medium- and Heavy-Duty Vehicles
The costs and benefits of particular measures to reduce fuel consumption can be estimated with some degree of precision. Before manufacturers or users invest in a particular technology, they must have an idea of the likely payoff, in terms of cost, reliability, performance, and fuel consumption. In addition to the direct costs and benefits discussed here, there are a number of indirect costs, indirect benefits, and unintended consequences related to the implementation of energy-efficient technologies in commercial vehicles.
In this chapter the committee further discusses the fuel consumption technologies identified in Chapters 4 and 5 with regard to their performance in different vehicle classes, which will largely determine what technologies will be used in various vehicles. The committee also discusses the costs of these technologies and their cost-benefit ratio. Operating and maintenance (O&M) costs are discussed as well as indirect effects.
The committee evaluated a wide range of fuel-saving technologies for medium- and heavy-duty vehicles. Some technologies, such as certain aerodynamic features, automated manual transmissions, and wide-base single low-rolling-resistance tires, are already available in production. Some of the technologies are in varying stages of development, while others exist only in the form of simulation models. Reliable, peer-reviewed data on fuel-saving performance are available only for a few technologies in a few applications. As a result, the committee had to rely on information from a wide range of sources, (e.g., information gathered from vehicle manufacturers, component suppliers, research labs, and major fleets during site visits by the committee), including many results that have not been duplicated by other researchers or verified over a range of duty cycles.
There is a tendency among researchers to evaluate technologies under conditions that are best suited to that specific technology. This can be a serious issue in situations where performance is strongly dependent on duty cycle, as is the case for many of the technologies evaluated in this report. One result is that the reported performance of a specific technology may be better than what would be achieved by the overall vehicle fleet in actual operation. Another issue with technologies that are not fully developed is a tendency to underestimate the problems that could emerge as the technology matures to commercial application. These issues often result in implementation delays as well as a loss of performance compared to initial projections. As a result of these issues, some of the technologies evaluated in this report may be available later than expected, or at a lower level of performance than expected. Extensive additional research would be needed to quantify these issues, and regulators will need to allow for the fact that some technologies may not mature as expected.
The fuel-saving technologies that are already available on the market generally result in increased vehicle cost, and purchasers must weigh the additional cost against the fuel savings that will accrue. In most cases, market penetration is low at this time. Most fuel-saving technologies that are under development will also result in increased vehicle cost, and in some cases, the cost increases will be substantial. As a result, many technologies may struggle to achieve market acceptance, despite the sometimes substantial fuel savings, unless driven by regulation or by higher fuel prices. Power train technologies (for diesel engines, gasoline engines, transmissions, and hybrids) as well as vehicle technologies (for aerodynamics, rolling resistance, mass/weight reduction, idle reduction, and intelligent vehicles) are analyzed in Chapters 4 and 5. Figure 6-1 provides estimates for potential fuel consumption reductions for typical new vehicles in the 2015 to 2020 time frame, compared to a 2008 baseline.
The technologies were grouped into time periods based on the committee’s estimate of when the technologies would be proven and available. In practice, timing of introduction will vary by manufacturer, based in large part on individual company product development cycles. In order to manage product development costs, manufacturers must consider the overall product life cycle and the timing of new product introductions. As a result, widespread availability of some technologies may not occur in the time frames shown.
The percent fuel consumption reduction (% FCR) num-
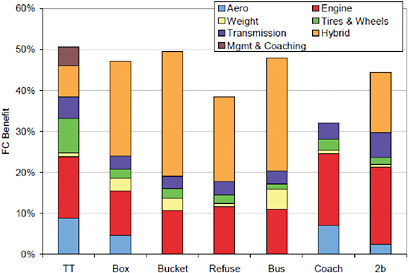
FIGURE 6-1 Comparison of 2015-2020 new-vehicle potential fuel-saving technologies for seven vehicle types: tractor trailer (TT), Class 3-6 box (box), Class 3-6 bucket (bucket), Class 8 refuse (refuse), transit bus (bus), motor coach (coach), and Class 2b pickups and vans (2b).
NOTE: TIAX (2009) only evaluated the potential benefits of driver management and coaching for the tractor-trailer class of vehicles. It is clear to the committee that other vehicle classes would also benefit from driver management and coaching, but studies showing the benefits for specific vehicle classes are not available. For more information, see the subsection “Driver Training and Behavior” in Chapter 7. Also, potential fuel reductions are not additive. For each vehicle class, the fuel consumption benefit of the combined technology packages is calculated as follows: [% FCRpackage = 100 [1 − (1 − {% FCRtech1/100}) (1 − {% FCRtech2/100)} … (1 − {% FCRtechN/100})]. Values shown are for one set of input assumptions. Results will vary depending on these assumptions. SOURCE: TIAX (2009).
bers shown for individual technologies and other options are not additive. For each vehicle class, the % FCR associated with combined options is as follows:
where % FCRtechx is the percent benefit of an individual technology.
DIRECT COSTS AND BENEFITS
Technology Applications to Specific Vehicle Classes
The technologies discussed in Chapters 4 and 5 can be consolidated into 12 categories and then a judgment made regarding the benefits by broad vehicle class. Table 6-1 shows the applications in which these technologies will be effective. Some technologies are broad enough to be applied to all classes: tires and wheels, weight reduction, transmission and driveline, engine efficiency, and hybridization. Others are more specific to the class of vehicle, such as replacing gasoline engines with diesel engines (dieselization), which is applicable only to Class 2 to 7 vehicles, where gasoline engines are offered today.
Fuel Consumption Reductions
The fuel consumption reductions identified in Chapters 4 and 5 can be summarized in a broad matrix of vehicle applications versus technology, for the years 2015 to 2020, as shown in Table 6-2 and Figure 6-1. The most effective
TABLE 6-1 Technologies and Vehicle Classes Likely to See Benefits
|
Technologies |
Tractor Trailer |
Urban Bus |
Motor Coach |
Class 3-7 |
Class 2b |
Refuse Truck |
|
Trailer aerodynamics |
X |
|
|
|
|
|
|
Cab aerodynamics |
X |
|
X |
X |
X |
|
|
Tires and wheels |
X |
X |
X |
X |
X |
X |
|
Weight reduction |
X |
X |
X |
X |
X |
X |
|
Transmission and driveline |
X |
X |
X |
X |
X |
X |
|
Accessory electrification |
X |
X |
X |
X |
X |
|
|
Overnight idle reduction |
X |
|
|
|
|
|
|
Idle reduction |
X |
X |
X |
X |
|
|
|
Engine efficiency |
X |
X |
X |
X |
X |
X |
|
Waste heat recapture |
X |
|
X |
|
|
|
|
Hybridization |
X |
X |
X |
X |
X |
X |
|
Dieselization |
|
|
|
X |
X |
|
TABLE 6-2 Fuel Consumption Reduction (percentage) by Application and Vehicle Type
|
Application |
Engine |
Aerodynamics |
Rolling Resistance |
Transmission and Driveline |
Hybrids |
Weight |
|
Tractor trailer |
20 |
11.5 |
11 |
7 |
10 |
1.25 |
|
Straight truck box |
14 |
6 |
3 |
4 |
30 |
4 |
|
Straight truck bucket |
11.2 |
0 |
2.4 |
3.2 |
40 |
3.2 |
|
Pickup truck (gasoline) |
20a |
3 |
2 |
7.5 |
18 |
1.75 |
|
Pickup truck (diesel) |
23b |
3 |
2 |
7.5 |
18 |
1.75 |
|
Refuse truck |
14 |
0 |
1.5 |
4 |
35 |
1 |
|
Transit bus |
14 |
0 |
1.5 |
4 |
35 |
1.25 |
|
Motor coach |
20 |
8 |
3 |
4.5 |
NA |
1.05 |
|
aCompared to a baseline gasoline engine. bCompared to baseline diesel engine. SOURCE: Adapted from TIAX (2009). |
||||||
technologies in terms of fuel consumption reduction are as follows:
-
Hybridization
-
Replacement of gasoline engines with diesel engines
-
Improvement in diesel engine thermal efficiency
-
Improvement in gasoline engine thermal efficiency
-
Aerodynamics, especially on tractor-trailer applications
-
Reduced rolling resistance
-
Weight reduction
Costs, Cost-Benefit, and Implementation of These Technologies
The committee determined the direct costs of the technologies in several ways:
-
Estimates of presenters and manufacturers for the retail price equivalent (RPE), for the components and/or package.
-
Dealer’s data book list prices multiplied by 0.6 to estimate RPE.1
-
Complete vehicle cost premiums from various publications, such as for a hybrid bus.
In the following discussion and tables, the committee presents fuel consumption, in percent reduction, as a range or as one number representing its best estimate.2 Similarly, the capital costs are presented as a range or as one number representing the committee’s best estimate. The number for costs is then divided by the number for fuel consumption reduction (dollar cost/% fuel consumption reduction, $/%), and the result is called capital cost per percent reduction (CCPPR). Most of the focus is on the 2015 to 2020 time frame, but data are also presented for the 2013 to 2015 time frame. The applications discussed are tractor trailer, straight truck, pickup truck and van, refuse truck, transit bus, and motor coach. After considering these vehicle applications, alternative metrics for cost-benefit ratio are presented.
Tractor Trailer
This category of vehicles includes Class 8 tractors equipped with so-called fifth wheels for hitching to one or more trailers. The baseline vehicle for fuel consumption estimates is an older-generation aerodynamic tractor (drag coefficient, Cd = 0.63 to 0.64) with a sloped hood, roof fairings, aero bumpers, standard dual tires (coefficient of rolling resistance, Crr = 0.0068), standard 53-ft box van trailer, a diesel engine with peak thermal efficiency of 41 to 42 percent, and cycle thermal efficiency of 37 to 39 percent on a long-haul cycle with long periods of constant speed operation, camshaft-driven unit injection at 2,000 bar, variable geometry turbocharger, cooled exhaust gas recirculation (EGR), a diesel particulate filter (DPF) for particulate matter (PM) control, a cylinder pressure limit of 200 bar, and a 10-speed manual transmission with overdrive.
Engine (2015 to 2020). Improved thermal efficiency from 42 percent peak to 52.9 percent peak efficiency compared to the 2008 baseline, which represents a 20 percent reduction in fuel consumption. The baseline 2010 technology includes a DPF at a cost of $7,000 and a selective catalytic reduction (SCR) catalyst at a cost of $9,600. The 2015-2020 technology includes SCR with improved nitrogen oxides (NOx) conversion efficiency, a U.S. Environmental Protection Agency (EPA) required onboard diagnostic (OBD) system with closed loop controls, a high-pressure common rail fuel system with higher injection pressure of about 3,000 bar, piezo-electronic fuel injectors, increased cylinder pressure capability to 250 bar, and a bottoming cycle. The incremental cost is in the range of $23,000 in addition to the cost of 2010 emissions aftertreatment hardware. Besides the increase in
up-front capital cost, O&M costs will increase due to the increased complexity of the engine system. The combined total cost must be taken into account in any analysis, and the cost may make the advanced technologies unattractive for many applications, particularly low-mileage applications.
Aerodynamics. In the 2015-2020 time frame, the committee projects that a tractor-trailer combination Cd of about 0.45 should be feasible.3 This requires developments going beyond the existing EPA SmartWay specification, which results in drag coefficients in the 0.50 to 0.55 range. To achieve this improvement, changes in vehicle operations and infrastructure (such as loading docks) are likely to be necessary. Costs are estimated for one tractor and three trailers, since this is the typical ratio of tractors to trailers in the field. An improvement in Cd from 0.63 to 0.45 will result in a fuel savings of 11.5 percent on a high-speed, long-haul duty cycle and 15 percent at 65 mph. This savings is very dependent on the actual vehicle duty cycle. High average speeds will result in achieving the projected savings, while applications in more congested areas with lower average speeds will achieve a smaller benefit. The cost of this package for the tractor is in the range of $2,700 to $3,500 (TIAX, 2009, Table 5-1). The trailer aerodynamics cost $3,000 per trailer. The overall cost of aerodynamic features for a tractor and three trailers is estimated at $12,000. Aerodynamic features also bring with them O&M costs that need to be considered. The primary cost is repair or replacement due to damage encountered in operation. For example, many fleets today avoid the use of fuel-tank skirts on tractors, because these can have a very short life in the field in some applications. Trailer skirts are also known to be damage prone. Future aerodynamic improvements may impose additional costs due to changes in vehicle operation, infrastructure, or capability, and these costs must be taken into account.
Rolling Resistance. Widespread implementation of widebase single tires with low rolling resistance is expected to be feasible in 2015 to 2020 for both tractors and trailers. Using rolling resistance values projected by Michelin and the EPA, the NESCCAF/ICCT (2009, p. 51) report projects a benefit of 11 percent compared to standard dual tires. The cost of applying wide-base singles to one tractor and the accompanying three trailers is projected by NESCCAF to be $4,480 (NESCCAF/ICCT, 2009, p. 95) and by TIAX (2009, p. 5-2) to be $3,600.
Transmission and Driveline. The manual 10-speed transmission, with overdrive, is considered the baseline transmission, along with a tandem rear axle with various ratios that can be specified when the vehicle is purchased. An alternate technology that is already available on the market is the automated manual transmission (AMT). With an AMT the clutch is only used to launch the vehicle and then the transmission shifts automatically. The AMT does not have the powershift capability of a fully automatic transmission and thus does not have the productivity improvement of an automatic. The power interruption during an AMT shift is very similar to that of a manual transmission, but use of the controller to determine shift points tends to remove some of the driver effect on fuel consumption variability. In addition, low-viscosity synthetic lubricants can be used in the transmission (manual or AMT) and throughout the driveline. This combination of AMT and synthetic lubricants can reduce fuel consumption by 2 to 8 percent and has a projected cost of $5,800. Fully automatic transmissions do not offer significant productivity (trip time) or fuel savings in long-haul operations. Therefore, fully automatic technology is not expected to gain significant share in the long-haul market. However, in urban and suburban driving, a switch to fully automatic transmissions can result in significant fuel savings (up to 5 percent) and significant productivity improvements at a cost of about $15,000. Another driveline option that is feasible for 2015 and beyond is the 6 × 2 tractor layout. Most tractors have two drive axles in a configuration referred to as 6 × 4 (six wheels, with four of them driven). A 6 × 2 tractor has only one drive axle, and the second rear axle only carries the weight of the truck. The use of a single drive axle saves about 1 percent of fuel consumption, at the expense of lost traction. This option may not be feasible for applications in areas with significant snow or for vehicles that must also operate off highway. Truck purchasers may be worried about loss of resale value if they purchase 6 × 2 tractors, since the resale market places a premium on tractors that can be used in a wide variety of applications.
Hybrid Tractor Power Trains. The use of hybrid power trains in Class 8 tractor trailers has been assigned a low priority in the long-haul market, by manufacturers, due to the typical duty cycle of mainly constant speed long-haul operation, which provides little opportunity for battery or hydraulics to store and release energy. As it turns out, the highway tractor trailer spends a significant amount of time on arterial highways, on grades that provide regenerative braking opportunities, and idling. NESCCAF/ICCT (2009, p. 54) showed fuel consumption reduction of 5.5 to 6 percent on one sample long-haul duty cycle including some suburban segments and some grades. For those trucks that idle overnight to support the “hotel load” of the sleeper, NESCCAF/ICCT showed an additional benefit of about 4 percent, for a total benefit of 10 percent. TIAX estimates the cost of the parallel hybrid modeled in the NESCCAF report at $25,000 in the 2015 to 2020 time frame, which assumes that significant volumes will be reached by 2015. Note that there is little actual field data available on the application of hybrids to Class 8 tractor trailers, so only simulation data were used to estimate fuel
savings. O&M costs will also be a critical factor in hybrid applications. Insufficient data are available today to project the life of batteries, which will be a major cost borne in most cases by the second or third owner of the vehicle. In many cases, later owners may elect not to repair a failed hybrid system (because of the high cost) as long as the vehicle is able to operate without using the hybrid system.
Idle Reduction. Several idle reduction technologies were discussed in Chapter 5 and are summarized in Table 6-3. Note that the benefit of an idle timer is not additive with APU or other hotel load systems, since the benefits claimed by these systems already include idle elimination. The idle timer cannot be effective if the engine is used to support hotel loads, but it can reduce idling at loading docks and other times where the hotel load is not required. If a hybrid system is used, idle reduction comes at no extra cost.
The CCPPR ratios of technologies, expressed in dollars per percent fuel consumption reduction, are summarized in Table 6-4 for Class 8 tractor trailers in the 2015 to 2020 time frame. Table 6-5 presents the same information as Table 6-4 in a slightly modified format, and includes the total potential benefit that can be achieved for Class 8 tractor trailers in the 2015 to 2020 time frame. Note that the total percentage benefit is not simply a sum of the individual benefits. As incremental improvements are added, each percentage benefit applies to an already reduced fuel consumption, not to the baseline fuel consumption. As a result, the total benefit Poverall is calculated as follows:
TABLE 6-3 Idle-Reduction Packages
|
Technology |
Fuel Consumption Savings (%) |
Cost ($), Retail Price Equivalent |
|
Engine electronic control unit acts as an idle timer (programmable) |
2-3 |
0 |
|
Direct-fired heater |
1-3 |
1,000-3,000 |
|
Small auxiliary power unit or battery system |
4-6.5 |
5,000-8,000 |
|
Large auxiliary power unit |
5-8 |
8,000-12,000 |
|
Hybrid system used for idle elimination |
4-6.5 |
(cost covered by hybrid) |
Using this formula, the total overall benefit available is 50.5 percent, whereas a simple summation of the benefits would suggest a 65 percent overall benefit.
Tractor-Trailer Summary
All the technologies listed in Table 6-5 may be implemented in production in the 2015 to 2010 time frame, taking into account the comments made in the following subsections.
TABLE 6-4 Technology for Class 8 Tractor Trailers in the 2015-2020 Time Frame
|
Technology |
Capital Cost ($) |
Mean Improvement in Fuel Consumption (%) |
CCPPR ($/%) |
|
Diesel engine |
23,000a |
20 |
1,150 |
|
Aerodynamics (tractor trailer) |
12,000 |
11.5 |
1,043 |
|
Rolling resistance |
3,600 |
11 |
327 |
|
Transmission and driveline |
5,800 |
4 |
1,450 |
|
Hybrid (includes idle reduction) |
25,000 |
10 |
2,500 |
|
Weight reduction |
13,500 |
1.25 |
10,800 |
|
NOTE: CCPPR, capital cost per percent reduction. aNot including $9,000 selective catalytic reduction. |
|||
TABLE 6-5 Tractor Trailers Benefit from Advances in Every Technology Category
Diesel Engines. Diesel engines used in Class 8 tractors are expected to begin improving their thermal efficiency as emissions regulations stabilize after 2010. A peak thermal efficiency of 53 percent may be achievable in the 2015-2020 time frame (a 20 percent improvement over current engines). Given the cost of some of the technologies required to achieve this improvement, it is likely that this level of improvement will only be achieved with the use of incentives or regulation. Because of the high cost and difficult packaging of some advanced technologies, some of these technologies will probably be restricted to certain high-mileage applications.
Aerodynamics. The current average drag coefficient is about 0.63, and the best currently available is 0.50 to 0.55 (SmartWay-certified tractors and trailers). In the 2015 to 2020 time frame, drag coefficients around 0.45 should be feasible. Some of these changes may require changes in the way vehicles operate, including infrastructure changes, such as loading dock height change. Changing a fundamental parameter such as loading dock height would require a huge investment that will not occur without regulatory stimulus. The cost and fragility of drag reduction features need to be dealt with in order to make them more attractive from a cost-benefit standpoint. Aerodynamic improvements for other trailer configurations (bulk hauler, flatbed, tanker, etc.) are not well understood and require further research.
Rolling Resistance. Widespread implementation of widebase single tires should be possible in the 2015 to 2020 time frame. These tires have an attractive CCPPR ratio and thus may achieve broad application without incentives or regulation.
Transmission and Driveline. For tractor-trailer combination vehicles, automated manual transmissions combined with low-friction driveline components and lubricants should be widely implemented in the 2015 to 2020 time frame. Other transmission concepts may become feasible in that time frame, but the technology is not far enough along to make any reliable forecasts. The widespread implementation of the 6 × 2 tractor configuration is very uncertain, given concerns about limited usefulness of the vehicle to subsequent owners.
Hybrid Tractor Power Trains. Hybrid power trains for tractor-trailer vehicles are technically feasible for the 2015 to 2020 time frame. The question will be whether the high cost and added weight are justified by the potential fuel savings of around 6 percent for tractors that do not include sleeper operation and 10 percent for sleepers. Widespread application of hybrids in tractor-trailer applications is very unlikely without substantial incentives or regulation.
Idle Reduction. Several forms of idle reduction technology are already available, including both onboard systems (APUs, diesel-fired heaters, etc.) and remote systems such as truck stop heating, ventilation, and air conditioning (HVAC) systems. If hybrid systems are adopted for tractor-trailer trucks, they will provide a built-in idle reduction capability. It is not clear which of the existing technologies will come to dominate the idle reduction market or if some future technology will dominate. It is possible that no one idle reduction technology will become dominant.
Straight Truck
This category of vehicle is very broad, including Class 3 to 8 straight (i.e., nontrailer) trucks, so it includes cut-away vans, parcel delivery vehicles, beverage delivery vehicles, shuttle buses, cab over engine cabs, conventional cabs, both gasoline and diesel engines, and various forms of work trucks described in Chapters 1 and 3. The baseline vehicle, for fuel consumption estimates, is a pickup and delivery Class 6 regional haul, traveling about 150 miles per day at an average speed of 30 mph. The 2007 certification, 6-9L diesel engine, has a cycle thermal efficiency of 31 to 35 percent and a peak thermal efficiency of 40 to 41 percent (TIAX, 2009, Table 4-5). The engine has high-pressure common rail fuel injection (1,800 bar), is equipped with a turbocharger, cooled EGR, a DPF, and about 175 bar cylinder pressure. The vehicle has no aerodynamic treatment and standard tires with steel wheels. The transmission is a six-speed automatic with no anti-idle technologies.
Engine. The diesel engine is considered baseline in this application, but the gasoline engine penetration was 42 percent in 2008 and has been increasing in the past few years. The increase in gasoline engine penetration is due to the recent cost increase of diesel engines, especially from addition of the DPF in 2007. Furthermore, the prospect of SCR or advanced EGR in 2010 is expected to serve as an additional sales deterrent for those classes whose duty cycles are more urban and have relatively low annual vehicle miles traveled (VMT). Dieselization of this class provides a large fuel consumption reduction (about 30 percent), but the incremental cost of the diesel engine beyond 2015 will be high due to further emissions compliance modifications and implementation of EPA-required OBD systems with closed loop controls.
Also problematic to diesel sales is that the diesel fuel consumption cost benefit was nearly wiped out in mid-2008 when the diesel fuel price per gallon increment was about $0.80 (20 percent) above gasoline (itself at $4.00). While in October 2009 this differential was only 5 percent,4 it may shrink when product demand rises with an improving economy. In addition to the 2010 emissions, the advancing diesel technology beyond 2015 will likely include 42 percent cycle
|
4 |
See http://tonto.eia.doe.gov/oog/info/gdu/gasdiesel.asp; accessed October 6, 2009. |
thermal efficiency and 45 percent peak thermal efficiency, facilitated by increased injection pressure (2,000 to 2,400 bar), improved SCR conversion efficiency, and some engines equipped with multistage turbochargers and accompanying increased cylinder pressure (about 200 bar), plus reduced parasitic losses. These improvements result in a 13 to 16 percent reduction in fuel consumption, but principally only for those applications where heavier loaded duty cycles are the norm. The cost premium is $11,000 to $14,000, largely for SCR or advanced EGR and OBD (TIAX, 2009, Table 3-8).
Selection of a diesel or gasoline engine from the developing engine technologies will consider cost benefits associated with widely varying duty cycle and durability needs.
Diesel engine technology continues to be strongly developed mainly for Class 8 tractor-trailer duty, and the smaller Class 3 through 7 diesel engines benefit from this development. Gasoline engine technology is also developing (as discussed in Chapter 4 and the Class 2b pickup section of Chapter 5) and may capture an increasing proportion of medium-duty trucks in the sector (i.e., Classes 3 to 7 and perhaps even some of the lighter duty vehicles of Class 8). These are straight trucks with relatively low VMT or with both lighter average loads and lower average speeds. Bucket trucks and most service trucks are among the best examples. Diesel engines in this sector will best serve those operations that require higher loads, higher annual VMTs, higher average speed applications, and longer durability.
Aerodynamics. The aerodynamic packages for medium-duty trucks are not part of the OEM/dealer standard options like they are on tractor trailers. Aerodynamic features (roof deflectors, fuel tank fairings, box skirts, mirrors, etc.) are available (four of the six identified features) as options and are dealer installed (except cab streamlining). Table 6-6 identifies the aero opportunities for this style of truck.
A 1.5 percent fuel savings reflects the base truck’s 30 mph average duty-cycle speed. Larger benefits can be achieved for those trucks that operate at higher average speeds, but these higher speeds are not typical of a pickup and delivery duty cycle described. The package cost is more than $3,000, which provides an extremely poor value for a truck averaging 30 mph.
Rolling Resistance. Currently available low-rolling-resistance SmartWay dual tires can give a fuel consumption reduction of 1 to 2 percent at a cost of $120 per rear axle. The reduced Crr duals provide a simple payback in 4 months for the assumed baseline truck. Current wide base single (WBS) tires can give a fuel consumption reduction of 2 to 4 percent at a cost of $450 per rear axle (TIAX, 2009). The WBS tires require about 8 months for payback, but early evaluations have shown poor tread wear in tighter turning conditions of urban operation. Yet the WBS tires could be used in this sector where the duty cycle is mainly arterial and interstate. As SmartWay has helped provide the greatest incentive for low-Crr tires, nearly all of that program has been tractor trailer focused, and the Class 3 to 7 sector has not had much attention toward this feature.
It is expected that the next-generation low-rolling-resistance duals in circa 2013 will reduce fuel consumption from the 2007 base by 2.8 to 3.5 percent, also at a cost of $120 per axle (TIAX, 2009, Table 3-8). Applications are likely that cannot use low-rolling-resistance tires because of traction issues. Examples include dump trucks, cement mixers, and service trucks that must occasionally operate off road.
Transmission and Driveline. The six-speed fully automatic transmission (AT) is considered baseline in this sector, especially for pickup and delivery operation in urban and suburban areas. In those cases fuel consumption favors the AT, as does improved productivity (in terms of trip speed; Allison Transmission). Further, the AT is used by many operators for safety reasons (two hands on the wheel) and for reduced driver training needs. Manual transmissions and, increasingly, automated manual transmissions (AMTs) will be favored for higher annual VMTs in arterial and interstate routes, as they will result in fuel consumption improvements.
TABLE 6-6 Straight Box Truck Aerodynamic Technologies
|
Technology |
FC Benefita (%) |
CD Improvement (%) |
Capital Cost ($) |
Status |
|
Aerodynamic Devices |
|
|
|
|
|
Roof deflector |
2-3 |
7-7.5 |
500-800 |
Available |
|
Chassis fairings |
0.5-1 |
2.5-3 |
400-500 |
Not available |
|
Box skirts |
2-3 |
4.5-5 |
500-1,000 |
Demos |
|
Box fairing |
0.5-1 |
2.4-2.7 |
500-650 |
Available |
|
Cab streamlining |
1-2 |
5-6 |
750 |
Available |
|
Aft box taper |
1.5-3 |
7.6-8 |
1,000 |
Not available |
|
Aerodynamic Packages |
|
|
|
|
|
Combination of straight truck aerodynamics |
5-8b |
20 |
3,000-3,500 |
Not available |
|
aFuel consumption (FC) benefit is critically dependent on duty-cycle average speed. bAbout 1.5 percent for the baseline average speed of 30 mph. SOURCE: TIAX (2009), Table 3-8. |
||||
For these conditions a reduction of 4 percent may be achieved (TIAX, 2009, p. 4-70). These sorts of evolutions will occur slowly as particular operations experiment with different transmission solutions for small fuel consumption reductions or productivity improvements. Altogether, it is not likely a major shift will occur.
Hybrid Power Trains. This vehicle sector has received the most attention for hybridization, after passenger cars and urban buses. Electric systems are in early production, and both advanced electric and hydraulic systems are in development and/or demonstration. The fuel consumption reduction for an Eaton electric system in a Navistar or Kenworth truck currently is 20 to 30 percent with a cost in 2014 of $20,000. The cost will be driven by incorporation of higher volume Li-ion batteries. This cost is nearly half that of the low-volume (batches of hundreds at a time) units offered in fall 2009, which use nickel metal-hydride batteries. The same system with an electric power takeoff, appropriate for a bucket truck, will reduce fuel consumption by 30 to 40 percent with a 2014 cost of $30,000.
Many companies, original equipment manufacturers and suppliers, are focused on this segment for electric and hydraulic hybrids. Some companies are in production, such as Freightliner M2 Business Class, Navistar Durastar, ISE, Azure, Kenworth, Peterbilt, and Workhorse Custom Chassis. A Duke University study5 estimates that 4,850 hybrids will be produced by 2010; 29,000 by 2015; and 60,000 by 2020. This early penetration will be helped by EPA grants6 of $50 million for deploying hybrids, which provide federal tax credits for incremental costs as follows: 20 percent tax credit for 30 to 40 percent fuel reduction, 30 percent tax credit for 40 to 50 percent fuel reduction, and 40 percent tax credit for more than 50 percent fuel reduction. (Note that these credits have caps of $7,500, $15,000 and $30,000 for vehicles weighing 8,501 to 14,000 lb, 14,001 to 26,000 lb, and more than 26,000 lb, respectively.)
Cost-Benefit. The CCPPR of technology expressed in dollars per percent fuel consumption reduction is summarized in Table 6-7 for Class 6 straight trucks in the 2015 to 2020 time frame. A 1 percent fuel savings equals about $225 per year (at $3.00 per gallon fuel price).
Class 3 to 6 bucket trucks are also prevalent in this sector, and by virtue of the hybrid electrical system will substantially benefit from electrification of the vehicle’s power takeoff (PTO) unit (see Table 6-8). One troublesome factor for bucket trucks in this sector is their average annual mileage of 13,300 miles as found by one study of 31 utilities.7 Such mileage will greatly limit the potential payback of a hybrid system, and is likely to lead utilities to consider converting to gasoline to reduce cost.
Summary: Box and Bucket Class 6 Straight Trucks
Diesel engines may continue to dominate this sector, especially for the medium- and heavy-duty applications with higher annual vehicle miles traveled. Gasoline engines should capture increasing market share because of both technology improvements and the increasing diesel price differential due to emission control systems. Hybrid solutions may further incentivize gasoline engines, since with a hybrid the total power demand on the engine shrinks by 25 to 40 percent.
Hybridization in this sector will be the strongest contributor to reduced fuel consumption due to both percentage of power supplied by the hybrid and the expected cost benefit in the period beyond 2015 with the takeover by Li-ion battery solutions as forecast by most observers (Research and Markets, 2009). Simple payback for the baseline straight box truck in this section is about three years. However, the substantially low VMTs of the bucket truck application put simple payback at eight years, even considering that idle fuel consumption (20 percent of the total) will be replaced by the battery (TIAX, 2009, p. 2-5). These estimates are with $3.00 per gallon fuel.
Both hybrid system and engine efficiency developments have been government incentivized as these have the highest development costs and incur the greatest price increases and with lack of success would impose the greatest loss of fuel consumption reduction opportunity for this sector. The EPA hybrid grant program described previously is an example of such an incentive. Nevertheless, the industry today is remarkably immature, and low-volume high incremental price hybrid offerings could use some incentives to “get ready” for the 2015 marketplace.
Pickup Truck and Van (Class 2b)
Class 2b includes vehicles of 8,500 lb to 10,000 lb gross vehicle weight (GVW). For EPA and California Air Resources Board emission certification purposes, the classes are as follows:
-
8,500 to 19,500 lb light to heavy duty EPA8
-
8,500 to 10,000 lb California MDV4
-
10,000 to 14,000 lb California MDV5
The baseline vehicle is a pickup truck or van with a 6- to 8-liter gasoline engine, naturally aspirated, port fuel injected, and a four-speed automatic transmission.
TABLE 6-7 Class 3 to Class 6 Straight Box Truck with 2015-2020 Technology Package
Fuel consumption can be reduced through vehicle modifications and systematic incorporation of advanced technologies into the power train. Engine fuel consumption can be reduced by either applying advanced technologies to the spark ignition engine or substituting a diesel engine for the spark ignition engine. Typical applications for a Class 2b vehicle would be as an urban delivery vehicle or a work vehicle for a small contractor. For this application the average speed would not be high and there would be frequent stops. As such, the highest potential for reducing fuel consumption will reside with engine improvements, hybridization, and transmission improvement. Average vehicle miles traveled are also typically fairly low, which limits the payback of fuel-saving technologies.
Aerodynamics. The extent to which aerodynamic treatment of the vehicle will be a cost-effective approach to reducing fuel consumption will be highly dependent on the application of the vehicle. If this class of vehicle is used primarily by contractors or local delivery services, the benefit of adding aerodynamic treatments would be minimal. The report by TIAX estimates a potential fuel consumption reduction of 3 percent with an incremental cost of $100 from aerodynamic treatments (TIAX, 2009).
Rolling Resistance. Like aerodynamic improvement, the potential for fuel consumption reduction through low rolling resistance tires will be heavily dependent on the application. Again, assuming that the likely use for these vehicles will be local contractor-type work or urban delivery, the benefit from low rolling resistance tires will most likely be small: 2 percent at an incremental cost of approximately $10 (TIAX, 2009).
TABLE 6-8 Class 3 to 6 Bucket Truck with 2015-2020 Technology Package
Transmission. Incorporating a six- or eight-speed automatic transmission with reduced driveline friction that incorporates a shift logic aimed at minimizing fuel consumption could potentially reduce fuel consumption by approximately 7 percent with an incremental cost on the order of $1,000 (TIAX, 2009).
Power Train. Hybridizing the vehicle power train would have high potential for reducing fuel consumption for the application assumed to be typical for this vehicle class. The load-leveling, accessory electrification and electric launch capability of the hybrid power train could reduce fuel consumption on the order of 18 percent for this application. The incremental cost would be approximately $9,000 (TIAX, 2009).
Engine. Starting from a base engine that is gasoline fueled, spark ignited, naturally aspirated, and port fuel injected, many technologies could be introduced to reduce fuel consumption. Variable valve actuation (variable valve timing—VVT, or variable valve lift—VVL) could reduce fuel consumption by 1 to 3 percent at incremental costs of $120 to $750. Cylinder deactivation could reduce fuel consumption by 2 to 3 percent at an incremental cost of around $75.9 Implementing direct injection while still operating at stoichiometric could reduce fuel consumption by 2 to 3 percent at an incremental cost in the range of $550 to $950. Turbocharging and downsizing the direct-injected stoichiometric engine could reduce fuel consumption an additional 2 percent at an incremental cost of approximately $1,200. Further improvements could be made by invoking lean burn operation to the stoichiometric direct injection turbocharged engine. A reduction in fuel consumption of 10 to 14 percent might be achieved by doing this. The incremental cost of lean burn over the direct-injected turbocharged stoichiometric engine is approximately $750. This incremental cost is the estimate for the exhaust aftertreatment system required for the lean burn engine. Finally, if homogeneous charge compression ignition (HCCI)-like combustion can be implemented, a reduction in fuel consumption of 10 to 12 percent could be achieved relative to a stoichiometric direct injection engine. The incremental cost for HCCI would be around $685.
It is important to realize that there can be redundancy as well as synergy in applying these technologies. To get a more reliable estimate of the reduction in fuel consumption expected, the application of these technologies as packages in a simulation applied to the application of the engine in question should be evaluated.
Diesel Engine. If a diesel engine were used instead of a spark ignition engine, fuel consumption could be reduced about 19 to 24 percent over the base engine at a cost of approximately $8,000 to $9,000.
As one of the tasks in the committee’s contract with TIAX, a projection of fuel consumption reduction achievable for Class 2b pickups and vans was done for a selected technology package. For this package aerodynamic improvements were assumed. Low rolling resistance tires, an eight-speed transmission coupled to a parallel hybrid system, and minor light weighting were also included. The package also included an advanced turbocharged downsized stoichiometric direct-injected gasoline engine. The improvements were projected relative to the current baseline engine described above. This package results in projected fuel savings of 44.5 percent at a cost of $14,710, with no increase in vehicle weight. The time frame in which it is likely that these technologies would be incorporated in a vehicle at significant market penetration is 2015 to 2020. A breakdown of the impact and incremental cost of the technologies in the package is shown in Table 6-9. The committee also concluded that similar fuel consumption benefits can be achieved with an advanced diesel engine in place of a baseline gasoline engine.
Refuse Truck (Refuse Packer)
This vehicle class is distinguished by its unique duty cycle, its weight (Class 8 vehicle), and its excellent potential for hybridization. The packer cab design is often a low cab-over-engine (LCOE) to aid ingress and egress by the operators. Its diesel engine is typically 9 to 11 liters in size with 280 to 325 horsepower and drives through an automatic transmission.
For comparison of fuel consumption estimates, the baseline truck has an urban duty cycle of about 700 load stops over 25 pickup miles a day, plus two round trips to a landfill for 50 additional miles. The truck has no aerodynamic devices and has a standard tandem axle with dual tires on steel wheels and a six-speed automatic transmission. The engine is a diesel of 11 liters displacement with peak thermal efficiency of 41 to 42 percent and cycle thermal efficiencies of 34 to 37 percent, cam actuated electronic unit injection (2,300 bar), variable-geometry turbocharger, and cooled EGR, plus DPF and 200-bar cylinder pressure. The packer PTO hydraulic pump is engine driven.
Engine. The current engine is forecast to be substantially evolved to an improved thermal efficiency of 49 percent (peak) which will provide a 14 percent reduction in fuel consumption, from a 2008 baseline. The 2020 technology includes optimized SCR with improved NOx conversion efficiency, OBD with closed loop controls, higher injection pressure, increased cylinder pressure, and turbocompounding. The incremental cost is in the range of $14,000 to $16,000, which is a 2010 engine with SCR plus $3,000 to
TABLE 6-9 Class 2b Pickups and Vans with 2015-2020 Technology Package
$4,000 (TIAX, 2009). The automatic transmission will then use eight gears.
Rolling Resistance. The use of low rolling resistance tires has some application in refuse packers, but their low vehicle speed profile and the need for good traction makes the application questionable.
Hybridization. Several hybrid concepts are being applied to refuse packers, including starter alternator motor, electric hybrid, and hydraulic hybrid. Demonstration systems are as follows:
-
Crane Carrier Company (electric and hydraulic) for the City of New York Department of Sanitation (CNY-DOS; expected 30 to 50 percent reduction in fuel use; Calstart, 2008),
-
Mack Trucks Inc. 120-kW integrated starter alternator motor, parallel hybrid electric operating with a 600-V Li-ion battery pack (expected 30 percent fuel consumption reduction), also for the CNY-DOS (Walsh, 2009, p. 1),
-
Crane Carrier and Bosch Rexroth Corp. (parallel hydraulic hybrid) and Crane Carrier and ISE Corporation (series electric hybrid; Calstart, 2008).
It is too early to know which of the several hybrid variants offer the best combination of cost and performance in the refuse packer. But a hydraulic hybrid may perform well in such applications where hundreds of launch/stop cycles characterize the longest portion of the operation day. It is noted that high-density residential packers using an automated side loader arm will achieve up to 1,200 launch/stops in a 10-hour day. This orientation for a hydraulic hybrid is a consequence of both energy recovery efficiency during heavy braking and incremental cost.
The Eaton parallel electric system is being applied to the Class 6 and 7 Navistar Durastar, Kenworth T270/T370, and Perterbilt 300 Series, which claim a 20 to 30 percent fuel consumption advantage at a cost of $38,000 to $40,000.10 The Mack system is integrated in Mack’s own Class 8 LCOE Terra-Pro refuse chassis and is equipped with a Mack 11-liter engine certified for EPA 2010 with an SCR NOx aftertreatment system. Interestingly, Mack has captured about 50 percent of the LCOE Class 8 refuse sales for decades.
Idle Reduction. Idle timers and stop-start systems are ideal for refuse packer cycles except when the engine power takeoff is needed. The engine pump for packing demands high horsepower during the packing cycle, and the recovered braking energy stored by the hybrid system is reserved for vehicle launch assist.
Summary. Table 6-10 captures a likely solution package for the refuse packer that is expected to be offered beyond 2015.
Refuse Truck Summary
The above technologies for diesel engines and hybrids will be production implemented by 2020. Refuse truck fuel consumption reduction will most substantially result from improvements and innovations in the power train system, which then becomes increasingly complex. Other technologies will be applied as spinoffs from Class 8 tractor-trailer applications (e.g., reduced transmission and driveline friction, accessory electrification, weight reduction, lower rolling resistance tires).
This sector is one of relatively low annual mileage (about 20,000 miles), but the current average fuel consumption is quite high (33 to 40 gallons/100 miles), owing to the intensity
TABLE 6-10 Class 8 Refuse Packer with a Hydraulic Hybrid System, 2015-2020
of their launch/stop duty. The industry today is remarkably immature, and low-volume, high-incremental price hybrid offerings could use some incentives to “get ready” for the 2015 and later marketplace.
Transit Bus
This category can also be called urban or city bus. The baseline is a 40-ft bus weighing about 40,000 GVW with an 8- to 9-liter diesel engine. The 2008 baseline engine has a thermal efficiency of 40 to 41 percent (peak) with high-pressure common rail or unit fuel injection (1,600 to 2,000 bar), variable geometry turbocharging, cooled EGR, active DPF, and 170- to 180-bar cylinder pressure. It is assumed to have no aero shaping and standard dual tires, steel wheels, six-speed automatic transmission, low-speed idle, but no idle reduction technology. The driving cycle is urban, low speed (12 mph average), 150 to 250 miles per day, high air conditioning and alternator load on the engine (30 to 40 kW). Transit buses have an average VMT of 35,167 and an average fuel consumption of 31 gallons per 100 miles (TRB, 2009, Table 5.14).
Engine. Improved thermal efficiency of 49 percent (peak), which is a 16.4 percent reduction in fuel consumption, will be available in the 2015 to 2020 time frame (TIAX, 2009). This reduction includes OBD with closed loop controls, improved NOx conversion in the SCR system, higher fuel injection pressure (3,000 bar using common rail injection and multiple injections per cycle), increased cylinder pressure (220 to 230 bar), advanced EGR, dual-stage turbocharging, and electrically powered accessories. The incremental cost is in the range of $12,200 to $13,700, which is a 2010 engine with SCR plus $2,000 to $4,000.
Aerodynamics. No improvement anticipated.
Rolling Resistance. Transit buses gain only minor benefit from low rolling resistance tires Table 6-11), and they are unlikely to adopt wide-based singles. Benefits are estimated on the basis of the Class 8 tractor trailer and are scaled using a factor of 0.4 to account for the differences in vehicle duty cycle.
Transmission and Driveline. Transit buses use fully automatic transmissions, allowing the driver to keep both hands on the wheel and have uninterrupted shifts (which gives increased vehicle drivability and productivity). Opportunities for reducing fuel consumption include friction reduction, reducing transmission parasitic losses, using more aggressive shift logic, and increasing the number of transmission gears (see Table 6-12).
Weight. Given their low speed, stop-and-go duty cycle, transit buses can benefit greatly from weight reduction. TIAX (2009) used data from various sources and developed Table 6-13 to represent the summary.
Hybridization (Hybrid Power Trains). Urban transit buses have been undergoing hybridization since the early 2000s, and many reports are available regarding fuel consumption, capital costs, operating costs, and life-cycle costs. It is estimated that hybrid power trains constituted 25 to 30 percent of the market in 2009 (TIAX, 2009). Most systems on the road use parallel diesel configuration, although diesel series hybrids and gasoline series hybrids are also offered. The fuel consumption improvement varies from city to city, manufacturer to manufacturer, and month to month; Tables 6-14 to 6-16 give examples from various sources.
It should be noted the transit bus market is small, on the order of 5,000 buses per year, and hybrids already have 25 percent market share, so production volumes will not increase much beyond present levels. At this point, the hybrid
TABLE 6-11 Transit Bus Tire and Wheel Technologies
|
System |
Capital Cost ($) |
Fuel Consumption Benefit (%) |
|
Low-rolling-resistance dual |
30 per tire |
0.8-1.2 |
|
Next-generation dual |
30 per tire |
1.6-2 |
|
Tire monitor |
900 |
0.25 |
|
SOURCE: TIAX (2009). |
||
TABLE 6-12 Driveline and Transmission Strategies for Transit Buses
|
Strategy |
Fuel Consumption Benefit (%) |
Cost ($) |
|
Appropriate specifications |
1-3 |
— |
|
Aggressive shift logic and early lockup |
0.5-1 |
100 |
|
Reduced automatic transmission parasitics and friction reduction |
1 |
0-500 |
|
8-speed automatic transmission |
2-3 |
1,100-1,650 |
|
SOURCE: TIAX (2009). |
||
TABLE 6-13 Weight Reduction Cost and Benefit for Transit Buses
|
Weight Reduction (lb) |
Cost per Pound ($) |
Fuel Savings per 1,000 lb (%) |
|
0-800 |
2-4 |
2-3 |
|
800-1,600 |
4-8 |
2-3 |
|
1,600-2,800 |
8-10 |
2-3 |
|
SOURCE: TIAX (2009). |
||
bus market depends on very large government subsidies. Unless costs drop substantially, this is unlikely to change.
Transit Bus Summary
The most effective fuel consumption reduction technologies are improved diesel engines and hybridization. The most cost-effective technologies are the engine technologies and the hybrid when taking into account the 80 percent Federal Transit Administration support and the Clean Fuel Grant Program incremental hybrid cost credit. Note that in the current situation, cost effective for operators and cost effective for taxpayers are two different concepts.
Motor Coach
The American Bus Association (2006) states that there are more than 33,000 motor coaches operating in the United States. With an average fuel economy of 5.7 miles per gallon, a corresponding fuel consumption (FC) of 17.5 gallons/100 miles, and an annual average mileage per motor coach of 56,000,11 motor coaches in the United States consume nearly 330 million gallons of fuel annually. Motor coaches typically operate over the highway in high-mileage, high-speed duty cycles. Occasionally, they also operate in urban cycles. While motor coaches provide a high-efficiency means of travel on a passenger-mile/gallon basis, a significant amount of their duty cycle is spent idling to maintain a comfortable interior temperature and air brake pressure.
Motor coach results are shown in Table 6-17. Here, since these vehicles spend a good portion of their time on interstates, the committee has included improved aerodynamics, an advanced 11- to 15-liter diesel engine with bottoming cycle, low-rolling-resistance tires, eight-speed automatic transmission, and minor light-weighting. This package results in fuel savings of 32 percent at a cost of $36,350 and a reduction in vehicle weight of 400 lb.
Engine. Improved thermal efficiency from 41.5 to 53 percent peak efficiency from 2008 baseline, which is a 21.7 percent reduction in fuel consumption. The engine uses an exhaust energy recovery system with improved engine controls.
Aerodynamics. Because of their frequent high-speed operation, motor coaches may benefit significantly from aerodynamic drag reduction. However, there is limited information available in the literature and little additional data were provided during committee site visits that speak directly to motor coach aerodynamics. As such, our estimates of motor coach aerodynamic drag reduction potential are based on extending results of the line-haul analysis to the motor coach segment. Cab streamlining and boat tailing offer the best prospects for reducing aerodynamic drag.
Rolling Resistance. Motor coaches can benefit from low rolling resistance tires, wide-base singles, or automatic inflation systems. Wide-base singles are available for motor coaches, but they are not widely deployed. There is only a single axle on a motor coach that uses dual tires (and hence can take advantage of a WBS). Benefits are estimated from the Class 8 tractor trailer and are scaled using a factor of 0.9 to account for differences in duty cycle and weight.
Transmission and Driveline. Motor coaches are unique in that they all use automatic transmissions but spend much of their time on the highway. This is because automatic transmissions offer a smoother ride, which is important in a passenger-driven application. That said, European motor coaches tend to use manual or automated manual transmissions. The committee has assumed the following to charac-
|
11 |
“Commercial Bus Emissions Characterization and Idle Reduction: Idle and Urban Cycle Test Results,” June 14, 2006, prepared for the American Bus Association, U.S. Department of Energy, U.S. Environmental Protection Agency, and U.S. Federal Highway Administration. Available at http://www.buses.org/files/download/motorcoach_idling_study.pdf. |
TABLE 6-14 Results for Urban Transit Buses—Selected Sources
|
New York Citya |
Series 50 diesel, non-EGR |
Orion VII Hybrid, non-EGR |
|
Average mpg |
2.65 |
3.45 |
|
WMATAb |
Automatic transmission diesel |
Hybrid |
|
Dyno mpg |
3.85 |
4.8 |
|
Revenue mpg |
3.18 |
3.51 |
|
Vehicle cost |
$349,000 |
$522,000 |
|
Capital cost/mile |
$0.81 |
$1.19 |
|
Operating cost/mile |
$1.19 |
$1.13 |
|
Total cost/mile |
$2.00 |
$2.32 |
|
New York Cityc |
Series 50 diesel with diesel particulate filter |
Orion VII Hybrid |
|
Average mpg |
2.33 |
3.18 |
|
Vehicle cost |
$280,000-$300,000 |
$450,000-$550,000 |
|
Seattle/King Countyc |
Diesel 60 ft |
Hybrid 60 ft (New Flyer/Allison) |
|
Fuel |
2.50 mpg |
3.17 mpg |
|
Fuel cost/mile |
$0.79 |
$0.62 |
|
Maintenance cost/mile |
$0.46 |
$0.44 |
|
Total cost/mile |
$1.25 |
$1.06 |
|
Chapel Hilld |
Diesel |
Hybrid |
|
|
$240,000 |
$530,000 |
|
New York Cityd |
Hybrid |
|
|
|
3.19 mpg, 34% better than diesel |
|
|
NOTE: Hybrid 26 to 52 percent (average 37 percent) improvement in fuel efficiency; hybrid reduced costs: extended brake life 50 to 100 percent. Clean Fuels Grant Program: 90 percent of incremental hybrid cost. Federal Transit Administration: 80 percent of cost of standard diesel. Operating cost of hybrid is 15 percent lower than diesel. EGR, exhaust gas recirculation. aBarnitt (2008). bBus Engineering (2008). cRanganathan (2006). dUSA Today, January 22, 2008. |
||
terize transmission and driveline opportunities in the motor coach segment:
-
Motor coaches generally use technologies similar to those used by tractor trailers to improve driveline efficiency but adopt technologies similar to the transit bus to enhance transmission efficiency.
-
Because the motor coach does not have two drive axles, unlike the tractor trailer, it cannot benefit from switching to a single drive axle.
-
Because the motor coach spends more time at high speed, the efficiency benefit of using an eight-speed transmission is estimated to be lower.
The transmission assumed for 2015 to 2020 is an eight-speed AT along with reduced driveline friction and aggressive shift logic.
Weight Reduction. Estimates for the benefit of weight reduction in motor coaches are drawn from the IFEU (2003)
TABLE 6-15 Hybrid Technology Cost and Benefits for Transit Buses
|
Architecture |
Incremental Capital Cost ($) |
Fuel Consumption Benefit (%) |
Introductory Year |
Incremental Weight (lb) |
|
Gasoline series |
200,000 |
25-35a |
Available—~150 on road |
2,000 |
|
Diesel series |
220,000 |
30-40 |
Available—~ 75 on road |
2,600 |
|
Diesel parallel and dual mode or dual mode |
200,000 |
22-35b |
Available—2,000-3,000 on road |
940-2,840 |
|
aSOURCE: TIAX (2009). |
||||
TABLE 6-16 Urban Transit Buses Can Benefit from Hybridization and from Weight Reduction
|
Category |
Description |
Benefit (%) |
Capital Cost ($) |
CCPPR ($/%) |
Weight (lb) |
|
Aero |
— |
— |
— |
— |
— |
|
Engine |
Advanced 6-9 L engine |
14 |
13,000 |
929 |
500 |
|
Tire |
Improved low-rolling-resistance duals |
1.50 |
300 |
200 |
— |
|
Transmission and driveline |
8-speed automatic transmission, reduced driveline friction, aggressive shift logic |
4 |
1,800 |
450 |
— |
|
Hybrid |
Diesel series hybrid |
35 |
22,000a |
220,000 |
6,286 1,500 |
|
Management and coaching |
— |
— |
— |
— |
— |
|
Idle reduction |
— |
— |
— |
— |
— |
|
Total added weight |
Added components |
−5 |
— |
— |
+2,000 |
|
Weight reduction |
Material substitution—2,500 lb |
6.25 |
15,300 |
2,448 |
−2,500 |
|
Total |
2015-2020 package |
47.8 |
52,400a |
1,096 |
−500 |
|
|
|
|
250,400 |
5,238 |
|
|
NOTE: For each vehicle class, the fuel consumption benefit of the combined technology packages is calculated as follows: [% FCRpackage = 100 [1 − (1 − {% FCRtech1/100 }) (1 − {% FCRtech2/100}) … {(1 − {% FCRtechN/100})] where % FCRtech x is the percent benefit of an individual technology. CCPPR, capital cost per percent reduction. aWith 90% federal subsidy of the incremental cost. SOURCE: TIAX (2009). |
|||||
report, which estimates 2.4 percent fuel savings per 10 percent weight reduction. Data were estimated for an 18 metric ton vehicle traveling on a primarily highway duty cycle. For a 36,000-lb coach, this fuel-savings estimate equates to 0.7 percent per 1,000 lb saved. Costs are estimated using the same logic as that described for the transit bus. The committee assumed a 36,000-lb coach, which weighs approximately the same as a tractor trailer, and so no scaling is needed.
Motor Coach Summary
The most cost-effective technology was the advanced diesel engine with a bottoming cycle. Hybrids were not considered for motor coaches by TIAX because of the high cost of hybrid systems and relatively low benefit on a commuter motor coach duty cycle (less than 12 percent fuel consumption reduction). TIAX discusses two potential hybrid archi-
TABLE 6-17 Motor Coaches Benefit from Aerodynamics and from Engine Improvements, Including Waste-Heat Recovery
tectures for the motor coach application: a parallel system similar to that used in transit buses and a parallel system similar to that prototyped for Class 8 tractor trailers.
SUMMARY OF FUEL CONSUMPTION AND COST DATA
As shown in Table 6-18, the 2015-2020 packages reduce fuel consumption by 32 to 51 percent; all of the vehicle classes, with the exception of the motor coach and refuse hauler, are over 40 percent. The costs of these packages range from $14,000 (Class 2b) to $250,000 (transit bus). However, the other applications lie in a narrow band from $40,000 to $85,000. Many of the technologies benefit from anticipated reductions in the cost of hybrid vehicles during this time frame. The CCPPR estimates range from $331 to $5,232 per percent improvement, depending on vehicle class. For five of the seven vehicle classes, the benefits range from $915 to $1,674 per percent fuel consumption reduction. The cost of saving a gallon of fuel per year ranged from a low of $8.42 for tractor-trailer trucks to $48.95 for transit buses. Saving a gallon of fuel in a transit bus costs almost six times more than saving a gallon in tractor-trailer operations, but transit buses now enjoy huge subsidies for the implementation of fuel-saving technologies. This huge range in cost shows that care must be taken if cost-effective fuel-savings are to be realized in practice.
TABLE 6-18 Fuel Consumption Improvement, Cost, and CCPPR, 2015 to 2020 Vehicle Technology
|
|
TT |
Box |
Bucketa |
Refuse |
Bus |
Coach |
2b |
|
Fuel Consumption Reduction |
|||||||
|
Aerodynamics |
11.5% |
6% |
— |
— |
— |
8% |
3% |
|
Engine |
20% |
14% |
11.2% |
14% |
14% |
20% |
23% |
|
Weight |
1.25% |
4% |
3.2% |
1% |
6.25% |
1.05% |
0.75% |
|
Tire |
11% |
3% |
2.4% |
2.5% |
1.5% |
3% |
2% |
|
Transmission |
7% |
4% |
3.2% |
4% |
4% |
4.5% |
7.5% |
|
Hybrid |
10% |
30% |
40% |
25% |
35% |
— |
18% |
|
Management |
6% |
— |
— |
— |
— |
— |
— |
|
Idle reductionb |
— |
— |
— |
— |
— |
— |
— |
|
Subtotalc |
51.0% |
49.4% |
51.3% |
40.2% |
50.4% |
32.5% |
44.9% |
|
Added weight (lb)d |
2,030 |
1,100 |
1,050 |
1,500 |
2,000 |
1,100 |
300 |
|
Adjusted fuel consumption total |
50.5% |
47.1% |
49.6% |
38.4% |
47.8% |
32.0% |
44.5% |
|
Cost ($) |
|||||||
|
Aerodynamics |
12,000 |
3,250 |
— |
— |
— |
4,500 |
100 |
|
Engine |
23,000 |
13,000 |
13,000 |
14,800 |
13,000 |
23,000 |
4,000 |
|
Weight |
13,500 |
4,770 |
4,770 |
3,000 |
15,300 |
6,000 |
600 |
|
Tire |
3,600 |
300 |
300 |
300 |
300 |
450 |
10 |
|
Transmission |
5,800 |
1,800 |
1,800 |
2,700 |
1,800 |
2,400 |
1,000 |
|
Hybrid |
25,000 |
20,000 |
30,000 |
30,000 |
220,000 |
— |
9,000 |
|
Management |
1,700 |
— |
— |
— |
— |
— |
— |
|
Idle reductionb |
— |
— |
— |
— |
— |
— |
— |
|
Total |
84,600 |
43,120 |
49,870 |
50,800 |
250,400 |
36,350 |
14,710 |
|
Cost Benefit ($/Percent Fuel Consumption Benefit) |
|||||||
|
Aerodynamics |
1,043 |
542 |
— |
— |
— |
563 |
33 |
|
Engine |
1,150 |
929 |
929 |
1,057 |
929 |
1,150 |
174 |
|
Weight |
10,800 |
1,193 |
1,193 |
3,000 |
2,448 |
5,714 |
800 |
|
Tire |
327 |
100 |
100 |
120 |
200 |
150 |
5 |
|
Transmission |
829 |
450 |
450 |
675 |
450 |
533 |
133 |
|
Hybrid |
2,500 |
667 |
750 |
1,200 |
6,286 |
— |
500 |
|
Management |
283 |
— |
— |
— |
— |
— |
— |
|
Idle reductionb |
— |
— |
— |
— |
— |
— |
— |
|
All packages |
1,674 |
915 |
1,006 |
1,323 |
5,232 |
1,135 |
331 |
|
NOTE: The baseline year for the analysis is 2008. For each vehicle class, the fuel consumption benefit of the combined technology packages is calculated as follows: [% FCRpackage = 100 [1 − (1 − {% FCRtech1/100}) (1 − {% FCRtech2/100}) … (1 − {% FCRtechN/100 })] where % FCRtech x is the percent benefit of an individual technology. aThe 2015-2020 hybrid capital costs are forecasted to be reduced by up to 47 percent from the 2013-2015 costs. This is due to technology and volume changes but may not be fully realized. bOvernight idle reduction is assumed to be implemented as part of the hybrid package. cFor each vehicle class, the fuel consumption benefit of the combined technology packages is calculated as noted above. dThe fuel consumption penalty resulting from weight increases due to the various technology packages has not been included in the results. SOURCE: TIAX (2009), p. 5-8. |
|||||||
The near-term (2013-2015) analysis (Table 6-19) was done in a manner similar to the analysis for the 2015-2020 time frame. The technologies that are included vary by market segment but, broadly speaking, include a high-cost first-generation hybrid system for urban vehicles and aero-dynamic improvements coupled with first-generation waste heat recovery on highway vehicles. All of the technologies include significant engine efficiency improvements as indicated. The near-term packages have projected fuel consumption benefits that range from 14 to 40 percent, while costs range from $4,435 (for the Class 2b pickup and van segment) to $215,600 (for the transit bus, which includes a high-cost hybrid system). However, most of the vehicle classes lie in a relatively narrow band that shows 30 to 40 percent fuel consumption reduction at costs that range from $44,000 to $62,000. The CCPPR of these packages is $1,270 to $1,860 per percent benefit for five of the vehicle classes, but ranges from $207 (for Class 2b vehicles) to $5,890 per percent (for transit buses).
Cost-Effectiveness Metrics
In this chapter, CCPPR has been presented in terms of dollars per percent reduction in fuel consumption. This allows comparison of fuel-saving technologies across a range of vehicle classes and applications. Unfortunately, as a true metric of cost-benefit ratio, dollars per percent fuel savings has many drawbacks. The committee would not have used this metric if enough information had been available in time to support the use of a better metric. The committee believes that a metric of dollars per gallon saved per year is a much more useful measure of cost-benefit ratio. This metric allows
TABLE 6-19 Fuel Consumption Improvement, Cost, and Cost Effectiveness, 2013-2015 Vehicle Technology
|
Technology |
TT |
Box |
Bucketa |
Refuse |
Bus |
Coach |
2b |
|
Fuel Consumption Reduction |
|||||||
|
Aerodynamics |
5.5% |
— |
— |
— |
— |
— |
3.0% |
|
Engine |
10.5% |
9.0% |
7.2% |
10.5% |
9.0% |
10.5% |
14.0% |
|
Weight |
0.8% |
2.0% |
1.6% |
— |
3.0% |
0.7% |
0.4% |
|
Tire |
4.5% |
1.8% |
1.4% |
1.5% |
1.0% |
1.8% |
1.0% |
|
Transmission |
5.0% |
1.5% |
1.2% |
1.5% |
1.5% |
2.0% |
4.5% |
|
Hybrid |
— |
22.0% |
35.0% |
20.0% |
30.0% |
— |
— |
|
Management |
3.0% |
— |
— |
— |
— |
— |
— |
|
Idle reduction |
6.0% |
— |
— |
— |
— |
— |
— |
|
Subtotalb |
30.6% |
32.7% |
42.2% |
30.5% |
39.7% |
14.5% |
21.4% |
|
Added weight (lb)c |
1,530 |
800 |
1,050 |
1,500 |
2,000 |
800 |
0 |
|
Adjusted fuel consumption total |
30.0% |
30.5% |
40.2% |
28.4% |
36.6% |
14.0% |
21.4% |
|
Cost ($) |
|||||||
|
Aerodynamics |
9,000 |
— |
— |
— |
— |
— |
100 |
|
Engine |
14,200 |
10,300 |
10,300 |
12,300 |
10,300 |
14,200 |
3,000 |
|
Weight |
6,000 |
1,590 |
1,590 |
— |
4,800 |
3,000 |
225 |
|
Tire |
900 |
300 |
300 |
300 |
300 |
240 |
10 |
|
Transmission |
5,200 |
200 |
200 |
200 |
200 |
300 |
1,100 |
|
Hybrid |
— |
38,000 |
50,000 |
40,000 |
200,000 |
— |
— |
|
Management |
1,000 |
— |
— |
— |
— |
— |
— |
|
Idle reduction |
8,000 |
— |
— |
— |
— |
— |
— |
|
Total |
44,300 |
50,390 |
62,390 |
52,800 |
215,600 |
17,740 |
4,435 |
|
Cost Benefit ($/Percent Fuel Consumption Benefit) |
|||||||
|
Aerodynamics |
1,636 |
— |
— |
— |
— |
— |
33 |
|
Engine |
1,352 |
1,144 |
1,144 |
1,171 |
1,144 |
1,352 |
214 |
|
Weight |
8,000 |
795 |
795 |
— |
1,600 |
4,286 |
563 |
|
Tire |
200 |
167 |
167 |
200 |
300 |
133 |
10 |
|
Transmission |
1,040 |
133 |
133 |
133 |
133 |
150 |
244 |
|
Hybrid |
— |
1,727 |
1,429 |
2,000 |
6,667 |
— |
— |
|
Management |
333 |
— |
— |
— |
— |
— |
— |
|
Idle reduction |
1,333 |
— |
— |
— |
— |
— |
— |
|
All strategies |
1,475 |
1,652 |
1,552 |
1,859 |
5,890 |
1,268 |
207 |
|
NOTE: For each vehicle class, the fuel consumption benefit of the combined technology packages is calculated as follows: [% FCRpackage = 100 [1 − (1 − {% FCRtech1/100 }) (1 − {% FCRtech2/100}) … (1 − {% FCRtechN/100})] where % FCRtech x is the percent benefit of an individual technology. aThe 2015-2020 hybrid capital costs are forecasted to be reduced by up to 47 percent from the 2013-2015 costs. This is due to technology and volume changes but may not be fully realized. bFor each vehicle class, the fuel consumption benefit of the combined technology packages is calculated as noted above. cThe fuel consumption penalty resulting from weight increases due to the various technology packages has not been included in the results. SOURCE: TIAX (2009), p. 5-7. |
|||||||
a direct comparison of the costs of various fuel-saving technologies in terms of how many dollars it costs to reduce a vehicle’s fuel consumption by one gallon per year. Since the overall goal of energy policy is to reduce fuel consumption at the least cost to society, the committee believes that the metric of dollars invested per gallon of fuel saved is a very good metric to consider.
To calculate the proposed metric, information is need on the average VMT and fuel consumption of the target vehicle class. Given this, it is easy to determine the number of gallons consumed per year by vehicles in the target class, and from there to determine the cost to reduce that fuel consumption in units of dollars per gallon saved per year. Some examples:
-
The fuel consumption reduction potential for the tractor-trailer application, in the 2015 to 2020 time frame, is 51 percent at a cost of $84,600. Assuming an average VMT of 120,000 miles per year and an average fuel consumption of 18 gallons/100 miles (data from VIUS, 2002), this results in a cost of $7.68 per gallon saved per year.
-
The fuel consumption reduction potential for Class 6 box and bucket trucks, in the 2015 to 2020 time frame, is 47.1 percent for box trucks and 49.6 percent for bucket trucks. The resulting cost for box trucks is $43,120 and the cost for bucket trucks is $49,870. For Class 6 box trucks with an average VMT of 25,000 miles per year and an average fuel consumption of 12.5 gallons per 100 miles (committee estimates based on VIUS data), the cost is $29.29 per gallon saved per year. In the case of bucket trucks, where average VMT is 13,300 miles per year (survey result reported by Chatham Consulting) and average fuel consumption is 20 gallons per 100 miles (committee estimate, including fuel spent idling to support bucket operation), the cost is $37.80 per gallon saved per year.
-
The fuel consumption reduction potential for the Class 2b pickup and van application, in the 2015 to 2020 time frame, is 44.5 percent at a cost of $14,710. With an average VMT of 14,000 miles per year and an average fuel consumption of 7 gallons per 100 miles (committee estimates), the cost is $33.73 per gallon saved per year.
-
The fuel consumption reduction potential for refuse trucks, in the 2015 to 2020 time frame, is 38.4 percent at a cost of $50,800. At an average VMT of 20,000 miles per year and an average fuel consumption of 35 gallons per 100 miles (committee estimates), the cost is $18.90 per gallon saved per year.
-
The fuel consumption reduction potential for transit bus applications, in the 2015 to 2020 time frame, is 47.8 percent at a cost of $250,400. With an average VMT of 35,167 miles per year and an average fuel consumption of 31 gallons per 100 miles (TRB, 2009), the cost is an extremely high $48.05 per gallon saved per year.
-
The fuel consumption reduction potential for the motor coach application, in the 2015 to 2020 time frame, is 32 percent at a cost of $36,350, which results in a cost benefit of $1,117 per percent fuel consumption reduction. With a VMT of 56,000 miles per year and an average fuel consumption of 17.5 gallons per 100 miles (American Bus Association, 2006), the cost is $11.59 per gallon saved per year.
Table 6-20 summarizes a comparison of CCPPR measured by dollars per percent fuel saved, compared to a metric of dollars per gallon saved per year. A breakeven fuel price is also provided in the table. This breakeven price is the price of fuel such that the value of the discounted fuel savings over 10 years is just equal to the cost of the technology. This price does not necessarily reflect how truck buyers would evaluate technologies, since they often do not plan to own the truck for a full life, have a different discount rate, and would need to consider O&M costs. However, a lifetime breakeven price can be a useful metric for considering the social costs and benefits of regulation. Note that while the cost-effectiveness in terms of dollars per percent fuel saved is best for Class 2b, when measured in terms of dollars per gallon saved or breakeven fuel price, the Class 2b technologies prove to be very expensive. Tractor-trailer trucks, which require a relatively large investment per percent fuel saved, are actually the best bargain in terms of cost per gallon of fuel saved. The
TABLE 6-20 Fuel Consumption Reduction Potential for Typical Vehicles, 2015-2020, and Cost-Effectiveness Comparisons for Seven Vehicle Configurations
|
Vehicle Class |
Fuel Consumption Reduction (%) |
Capital Cost ($) |
Cost-Effectiveness Metric |
||
|
Dollars per Percent Fuel Saved |
Dollars per Gallon Saved per Year |
Breakeven Fuel Pricea ($/gal) |
|||
|
Tractor-trailer |
51 |
84,600 |
1,674 |
7.68 |
1.09 |
|
Class 6 box truck |
47 |
43,120 |
915 |
29.30 |
4.17 |
|
Class 6 bucket truck |
50 |
49,870 |
1,006 |
37.80 |
5.38 |
|
Class 2b pickup |
45 |
14,710 |
331 |
33.73 |
4.81 |
|
Refuse truck |
38 |
50,800 |
1,323 |
18.90 |
2.69 |
|
Transit bus |
48 |
250,400 |
5,232 |
48.05 |
6.84 |
|
Motor coach |
32 |
36,350 |
1,135 |
11.59 |
1.65 |
|
NOTE: Values shown are for one set of input assumptions. Results will vary depending on these assumptions. aCalculated assuming a 7 percent discount rate and a 10-year life, excluding incremental operating and maintenance costs associated with the technologies. SOURCE: Adapted from TIAX (2009). |
|||||
transit bus stands out as a very expensive approach (without subsidies) to fuel saving by both metrics. Note that both of these metrics include only initial purchase cost. Increases in O&M costs are not included.
OPERATING AND MAINTENANCE COSTS
Driver pay has historically been the highest expense for all sectors of the trucking industry. However, due to recent increases in energy costs, diesel fuel cost per mile (CPM) equals or exceeds driver pay as the top cost for many motor carriers. Costs per mile are generally divided into two groups, vehicle and driver based. Significant operational costs include:
-
Vehicle-Based
-
Fuel and engine oil
-
Truck/trailer lease or purchase payments
-
Repair and maintenance
-
Fuel taxes
-
Truck insurance premiums
-
Tires
-
Licensing and permits
-
Tolls
-
-
Driver-Based
-
Driver wages
-
Driver benefits
-
Driver bonuses
-
The results of the American Transportation Research Institute (2008) survey of operating costs in terms of CPM and cost per operating hour (CPH) are shown in Table 6-21.
The technologies presented earlier in this chapter will significantly reduce fuel costs for fleets and customers. The addition of hardware such as turbocompounding, aerodynamic devices, hybrid power train components, and waste heat recovery systems (bottoming cycles) will increase complexity and potentially maintenance costs. Use of OBD, as is required on exhaust emission devices, should allow information to be made available to reduce repair and maintenance costs.
TABLE 6-21 Motor Carrier Marginal Expenses
|
Expenses |
Cost per Mile ($) |
Cost per Hour ($) |
|
Vehicle-Based |
|
|
|
Fuel-oil costs |
0.634 |
33.00 |
|
Truck/trailer lease or purchase payments |
0.206 |
10.72 |
|
Repair and maintenance |
0.092 |
4.79 |
|
Fuel taxes |
0.062 |
3.23 |
|
Truck insurance premiums |
0.060 |
3.12 |
|
Tires |
0.030 |
1.56 |
|
Licensing and overweight-oversize permits |
0.024 |
1.25 |
|
Tolls |
0.019 |
0.99 |
|
Driver-Based |
|
|
|
Driver pay |
0.441 |
16.59 |
|
Driver benefits |
0.126 |
6.56 |
|
Driver bonus payments |
0.036 |
1.87 |
|
Total Marginal Costs |
1.73 |
83.68 |
|
SOURCE: Adapted from American Transportation Research Institute (2008). |
||
TABLE 6-22 Incremental Operations and Maintenance Costs
|
Technology |
Cost per Mile ($) |
|
Aerodynamics |
No increase |
|
Single wide tires and advanced lubricants |
0.0040 |
|
Hybrid power train |
0.0060 |
|
Turbocompounding |
0.0003-0.0007 |
|
Bottoming cycle |
0.0030 |
According to the NESCCAF/ICCT (2009)report, O&M costs account for 5 percent of the total capital cost every 100,000 miles. An assessment was also made of incremental O&M costs for new technologies (Table 6-22).
The estimated O&M costs provided in Table 6-22 are projections, because many of the technologies are not in the field yet. Field experience may result in significant changes to these projections. For example, the committee has heard anecdotal evidence of substantial costs related to the repair and maintenance of aerodynamic devices that are damaged in service. The committee did not have the resources to undertake a complete study of operating and maintenance costs for all applications of future technologies. Additional study is required to refine estimates of O&M costs for fuel-saving technologies, since in some cases O&M costs can represent a substantial portion of the overall cost. Policymakers will need to consider fleet fuel savings (cost per gallon saved) as a parameter in their studies and evaluations.
INDIRECT EFFECTS AND EXTERNALITIES
Overview
The first part of this chapter presented the direct costs and benefits associated with various technology packages aimed at improving the efficiency of medium- and heavy-duty vehicles. Capital and O&M costs were identified and weighed against fuel-saving benefits. Understanding these direct costs and benefits is critical, as the economics of technology implementation are a primary decision attribute for manufacturers, carriers, and operators. However, direct costs and benefits are not the only costs and benefits associated with the application of new technologies. There are also in-direct costs, benefits, effects, and externalities (impacts that are not put in market terms) that should be addressed. Some of these indirect effects represent unintended consequences associated with technologies or policies designed to spur greater fuel efficiency in medium- and heavy-duty vehicles.
This part of the chapter presents a number of indirect costs and benefits including:
-
Fleet turnover effects
-
Ton-miles traveled and the rebound effect
-
Vehicle class shifting by consumers
-
Environmental co-benefits and costs
-
Congestion
-
Safety impacts
-
Incremental weight effects
-
Manufacturability and product development.
The committee identified these indirect costs and benefits as important to discuss, although the committee recognizes this is not an exhaustive list. Assessment of possible indirect effects during policy development will help avoid or mitigate negative unintended consequences.
Fleet Turnover Effects
The implementation of regulations that increase the capital costs of new vehicles could have an effect on consumer purchase decisions, especially when access to capital is limited. In particular, instead of purchasing a new (more expensive) vehicle, consumers may likely choose to maintain their existing vehicle in order to extend its life. If these existing vehicles are less efficient than new ones, the overall effect of the regulation may be dampened or even counterproductive. The issue of how new technologies and regulations will affect new vehicle prices and operating costs—and the impact on fleet turnover from those cost effects—is an area that needs further analysis.
The purchase of new medium- and heavy-duty vehicles is a capital-intensive prospect. For example, the latest Class 8b tractor rigs commonly cost more than $100,000 (CARB, 2008). In addition, the adoption of efficiency improvement strategies such as aerodynamic retrofits or advanced engine designs, as shown in Tables 6-18 and 6-19, can add thousands of dollars to the cost of a truck. Accordingly, incremental vehicle cost increases associated with new fuel economy (or other) standards combined with truck owner budget constraints are likely to impact truck purchasing decisions at the fleet level.
The impact of increasing new vehicle purchase and operating costs will likely be twofold. First, some vehicle owners may decide to accelerate their purchase schedule, obtaining a new vehicle before the adoption of a new standard, thereby deferring the incremental cost of the standard until their next purchase cycle. Buyers may also be concerned about the reliability of unproven technology, further increasing their incentive for early purchases. This approach also allows truck buyers to observe the performance of the new technology secondhand, without incurring the associated risk.
Such early purchase behavior is referred to as “pre-buy.” The associated dip in purchases in the time immediately following the introduction of the new, more costly vehicles meeting the standard is referred to as “low-buy.” Such impacts have been observed recently in association with the adoption of the 2004 and 2007 heavy-duty emission standards and their associated price increases. Second, some fraction of vehicle owners may simply defer purchasing new trucks for some period of time, keeping their older vehicles in operation longer than they would have otherwise. The net impact of these altered purchasing patterns is to delay the full impact of any new standards that entail notable incremental costs. Figure 6-2 shows sales of Class 8 trucks from 1990 to 2007.
Truck sales are highly cyclical, responding to general economic conditions. As Figure 6-2 suggests, however, prebuy behavior can alter somewhat the pattern of sales. In particular, there appears to be a general industry consensus that the sizable peak in 2006 were largely attributable to pre-buy behavior in advance of more stringent and costly NOx and PM standards being introduced in the following years. The size of the peak appears to roughly correspond to the size of the incremental cost increase for the new standard—from about $1,000 for the 2004 standard12 to between $7,000 and $10,000 for the 2007 standards.
An economic analysis of pre-buy and low-buy impacts for Class 8 trucks between 2005 and 2008 (NERA, 2008) utilized a vehicle scrap model along with a price elasticity model to predict increases and decreases in annual sales.13 The model was relatively successful in predicting pre-buy increases although somewhat less successful in predicting low-buy decreases.
Both the NERA modeling exercise and subsequent data also showed that the low-buy “dip” was actually more substantial than the pre-buy “peak” by a ratio of about 3 to 2, meaning that there was a net decrease in sales over this period. A net downturn in sales also indicates that a portion of vehicle owners may be keeping their older units on the road longer (assuming freight demand levels do not decrease substantially). The aggregate impact of all of these factors was estimated to result in a net increase in national annual NOx emissions in 2010 of more than 50,000 tons, relative to the case without pre-buy/low-buy and elasticity effects. This represents about 1 percent of expected NOx emissions from all on-road sources.14
Although not identical to the situation presented by a potential fuel efficiency standard, where some or all of the incremental vehicle cost may eventually be recouped through future fuel savings, buyer responses to the cost increases associated with previous NOx and PM standards could provide
|
12 |
The 2004 heavy-duty engine standards actually began to penetrate the market at substantial levels in 2003 as a result of the consent decree pull-ahead. |
|
13 |
The elasticity model assumed a 1 percent increase in sales price translated to a 1.9 percent decrease in sales. |
|
14 |
See http://www.epa.gov/ttn/chief/trends/index.html for national emission inventory trends. |
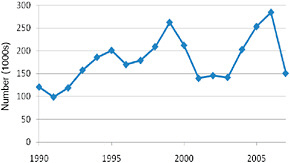
FIGURE 6-2 New retail Class 8 truck sales, 1990-2007. SOURCE: TRB (2009).
a rough sense of the possible pre-buy and low-buy impacts associated with future fuel efficiency regulations.
In addition to pre-buy influences, other factors can have a confounding effect on vehicle purchasing behavior, making it difficult to predict sales changes on a consistent basis. NERA notes other factors influencing sales prices, including fluctuations in steel prices. The likelihood of keeping an older vehicle on the road longer will also involve decisions about resale markets, variable O&M costs, and future demand levels. In fact, the California Air Resources Board has concluded that predicted economic activity in the transportation sector is by far the most important determinant impacting heavy-duty vehicle purchase decisions. From this perspective, much of the “low-buy” in heavy truck sales in 2007 may actually be due to the general economic down-turn rather than a retreat from pre-buy expenditures. More research is needed to explore this effect.
In summary, during periods of stable or growing demand in the freight sector, pre-buy behavior may have a significant impact on purchase patterns, especially for larger fleets with better access to capital and financing. Under these same conditions, smaller operators may simply elect to keep their current equipment on the road longer, which is all the more likely given continued improvements in diesel engine durability over time. On the other hand, to the extent that fuel economy improvements can offset incremental purchase costs, these impacts will be lessened. Nevertheless, when it comes to efficiency investments, most heavy-duty fleet operators require relatively quick payback periods, on the order of 2 to 3 years. As such, pre-buy effects may still be a factor impacting the pace of new technology introduction.
Ton-Miles Traveled and the Rebound Effect
To understand the aggregate systemwide effect on fuel consumption, not only must the effect of fuel-saving measures on fuel consumption per ton-mile be considered, but also whether fuel consumption improvements reduce or raise total operating costs. Reductions in cost will lead to truck traffic increases, thereby partially offsetting the individual truck fuel savings. This effect is the so-called rebound effect and has been measured in many statistical studies pertaining to the light-duty vehicle fleet. Regulations that lead to increases in costs will have the opposite effect.
In light-duty vehicles the studies measure the increased driving that occurs in reaction to the reduction in the variable cost of driving a mile as a result of the application of fuel-saving technologies. In medium- and heavy-duty trucking, this “rebound” is a more complex phenomenon and has been studied less than the light-duty vehicle effect.
The problem can be conceptualized as follows. If investment in new technology is cost effective as seen by the private firm, and lowers the cost of truck transport, two types of reactions would be expected. First, lower costs in this very competitive industry are likely to be passed on to shippers as lower prices. The lower prices will reduce delivered prices of freight, which to some degree will lead to higher demand for the products being shipped and hence more shipments. Over a long term the cost of shipping will affect decisions on production and distribution center locations, which will also affect the demand for trucking services. In addition, the lower cost of shipping by truck relative to other modes, particularly rail, will lead to more freight being diverted from rail to being shipped by truck.
If the application of technology pushes beyond the private cost-effective level, and the costs of shipping increase, the response will be the reverse—higher costs will reduce shipments by truck. This case may be socially efficient if the higher cost is truly reflecting the additional social costs of climate change and oil security due to fuel consumption—costs that are difficult to determine. In this case the goal of the standard is to push technology adoption beyond the point a purely private decision would take it.
The aggregate effects of truck costs on the demand for shipping are summarized statistically by the own-price elasticity of trucking. The own-price elasticity measures the total percentage increase in the demand for shipments relative to the percentage change in the price of shipping. The modal-shift response, which is part of the total response, is summarized statistically by the cross-price elasticity. The cross-price elasticity measures the percentage change in rail shipments for a given percentage change in truck shipping rates.
Studies measuring own-price and cross-price elasticities have concentrated on long-haul freight movements since these movements are most subject to intermodal competition, represent a significant fraction of freight movement, and account for 78 percent of fuel consumed by medium- and heavy-duty trucks. The results of these studies range widely, depending on the type of product being shipped, the geography of the shipments, trip lengths, and the specific functional form used to describe the relationship. In addition, some studies measure the effect on tons shipped, and some measure the effect on ton-miles or volume. A literature survey by Christidis and Leduc (2009) reported elasticity estimates
from eight studies mostly in the range of −0.5 to −1.5A second survey (Graham and Glaister, 2004) also cites a likely range of −0.5 to −1.5 for thewn-price elasticity, although it does not specify if that is for tons or ton-miles. A recent study by the Federal Highway Administration (FHWA) used own-price elasticity for ton-miles of –0.97, meaning that a 1 percent increase in the price of shipping one ton over one mile results in slightly less than a 1 percent reduction in ton-miles shipped. A study for the National Cooperative Highway Research Program cited a rail cross-price elasticity of 0.52 based on the intermodal competition model and identified a range of cross-price elasticities of 0.35 to 0.59 from an analysis of Class 1 railroads (Dennis, 1988; Jones et al., 1990). Given the wide range of estimates and the imprecision of the demand variables, it is not possible to provide a confident measure of the rebound effect.
Vehicle Class Shifting by Consumers
When manufacturers build vehicles, they make trade-offs related to various vehicle attributes in order to produce a vehicle that is most attractive to a given market segment. For example, manufacturers regularly need to balance issues of performance, cost, and fuel efficiency. In cases where regulation incentivizes a certain class of vehicles to meet a fuel efficiency standard at the expense of performance, a potential buyer may choose to purchase a larger class vehicle to offset the performance losses. This behavior would lead to less efficient vehicles on the road—exactly the opposite effect of what an efficiency standard is designed to achieve. This behavior can be called “consumer class shifting.” Class shifting could also occur if the cost of different vehicle classes is affected disproportionately by the regulations. For example, requiring aerodynamic fairings on all Class 8 vehicles may cause some companies that currently use these vehicles on long-haul operations to choose smaller, less efficient vehicles rather than invest in the fairings. Others, however, will find they will have to add fairings that provide little benefit at high cost.
There is little or no literature that describes the cross-class mode shift between truck types based on cost or performance, although at least one manufacturer interviewed for this report expressed consumer class shifting as a concern (particularly for lower class vehicles). To induce consumer class shifting, regulations would need to significantly increase the cost or decrease the performance of one class of trucks relative to another.
Environmental Co-Benefits and Costs
It is often (but not always) the case that fuel efficiency improvements result in reductions of other pollutants as well. Certain technologies such as hybridization or idle reduction reduce the amount of time an internal combustion engine is operating, resulting in a direct reduction in all emissions (namely NOx and PM) during this period. Another example occurs when engine loads are reduced (e.g., through adoption of aerodynamic or rolling resistance improvements), which in turn reduce NOx emissions (Schubert and Kromer, 2008). Table 6-23 demonstrates trade-offs between fuel efficiency technologies and engine-out NOx emissions.15
In interpreting Table 6-23, it is important to note that all engines have to meet stringent NOx and PM standards at certification. In addition, new 2007-2010 exhaust emissions standards effectively require aftertreatment technologies (SCR and PM traps) that will substantially reduce engine-out emissions prior to exhaust. Therefore, although trade-offs exist between engine efficiency improvements and engine-out emissions, any engine modifications to improve fuel efficiency must ultimately comply with emission standards at certification and during in-use operation. In fact, the committee expects that new NOx control technologies such as SCR will be so effective in reducing tailpipe emissions as to potentially allow engine manufacturers to increase engine efficiency while still complying with emission standards.
Congestion
Traffic congestion has increased dramatically throughout the world due to increased vehicle miles traveled and can result in significant loss of time, money, and fuel. Travel in congested conditions results in both longer and less predictable travel times. The Texas Transportation Institute (TTI) estimated that in 2007 the 439 urban areas in the United States experienced 4.2 billion vehicle-hours of delay, resulting in 2.8 billion gallons of wasted fuel and $87.2 billion in delay and fuel costs (Schrank and Lomax, 2005). TTI (2007) also found that the commercial vehicle cost of congestion, in both lost time and fuel, was ~$77 per vehicle-hour. The major causes of traffic congestion in the United States, as a percentage of total congestion, are (1) bottlenecks (traffic demand exceeds roadway capacity)—50 percent; (2) traffic incidents—25 percent; (3) work zones—15 percent; (4) bad weather—10 percent; and (5) poor signal timing—5 percent (AHUA, 2004). There are two questions. First, if regulations increase truck VMT, what are the potential implications for congestion? Second, if regulations cause degradation in truck performance, will slower trucks, or trucks with reduced hill-climbing ability, cause congestion to increase?
This chapter identifies how the demand for long-haul trucking could increase if regulations on reducing fuel consumption effectively reduce the net operating cost of long-haul trucking (i.e., the “rebound effect”). The effect on demand for trucking services is shown to be potentially significant, depending on the technology chosen and the own-price and cross-price elasticities of demand. There is
TABLE 6-23 Fuel Efficiency Technology Versus NOx Emissions Trade-off
|
Fuel Efficiency Technology |
Effect on Efficiency |
Effect on NOx |
|
Aerodynamic/weight reduction |
+/++++ |
Anticipated decrease, depending on mode |
|
Variable valve actuation |
+ |
Depends on design |
|
Higher cylinder pressure |
++ |
Increases proportionally |
|
Miller cycle |
+++ |
May decrease due to aftercooling |
|
Multistage turbo |
++ |
Increases if EGR cannot be used |
|
Mechanical turbocompound |
+ |
Minimal |
|
Electrical turbocompound |
++ |
Minimal |
|
Bottoming cycle |
++++ |
Minimal |
|
Thermoelectrics |
+ |
Minimal |
|
Enhanced exhaust insulation |
Minimal |
Minimal |
|
Hybridization |
+++ |
Reduction |
|
Idle reduction |
++++ |
Reduction |
little information, however, about effects of potential performance degradation, although, where present, they may result in locally significant effects on congestion.
The remainder of this section focuses on basic freeway segments and is applied to the heavier, slower trucks (Classes 4 through 8). Trucks have an impact on congestion at other traffic control locations, such as signalized and unsignalized intersections, merge sections, and freeway-to-freeway off-ramps, but the data to analyze these impacts are not readily available. In the highway capacity manual (HCM), in basic freeway analysis, trucks are represented as “passenger car equivalents” (PCE; TRB, 2000). The PCE concept is meant to capture the effect that heavy vehicles have on traffic flow on a freeway because heavy vehicles occupy more space, travel more slowly up steep grades and more quickly down them, accelerate more slowly, brake more slowly, and change lanes more slowly than passenger cars. Furthermore, different passenger car operators react differently to the presence of trucks, for example, following farther behind trucks than cars.
The HCM increases the PCE for trucks based on roadway conditions such as grade, number of lanes, distance to roadside obstructions, and width of lanes. It does not, however, distinguish between truck PCEs under congested and uncongested conditions. FHWA simulated the effect of combination trucks as part of its truck size and weight study to estimate how effective truck PCEs change based on the weight-to-horsepower ratio of the truck itself, grade of the roadway, road type, geography, and congestion levels. FHWA did not estimate the impacts of other roadway characteristics such as lane width or distance to obstructions (Battelle, 2005). Generally, steeper grades, longer hills, fewer lanes, and a higher weight-to-horsepower ratio increase the number of PCEs for a single truck. Truck PCE conversions are necessary to calculate a volume-to-capacity (V/C) ratio, which can be used to estimate congestion and delay measurement.
While different formulas have been developed to estimate traffic speeds based on V/C ratios, an illustrative example can be provided through the use of the Bureau of Public Roadsformula:
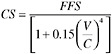
where CS is congestion speed, FFS is free-flow speed, V is volume of traffic, and C is traffic volume capacity. The formula implies that as a basic freeway segment approaches capacity (as the V/C ratio approaches 1.0), traffic speed will be reduced. To calculate delay, both congested and free-flow travel times must be calculated from the segment length and congested and free-flow speeds and then the difference between the free-flow travel time and the congested travel time must be measured.
An alternative perspective on congestion measurement uses estimates from the literature on the marginal cost of one combination truck on overall congestion. Parry (2006) estimates the marginal congestion cost of combination trucks to be $0.168 per mile in urban areas and $0.037 per mile in rural areas. The marginal congestion cost describes the cost, measured in lost travel time, that a single additional combination truck imposes on the rest of the traffic already on the roadway. Generally, as congestion increases, the marginal cost increases.
Safety Impacts
New regulations that would affect fuel efficiency of medium- and heavy-duty vehicles must consider impacts on vehicle and highway safety. The safety impacts are of several types. First, new technologies may have specific safety issues associated with them. For example, hybridization will introduce high-voltage electrical equipment into trucks; operators, service mechanics, and emergency personnel will need to be educated about appropriate handling of this equipment. Second, the rebound effect may increase overall truck traffic on the road, thereby leading to potentially higher incidences of accidents. Third, some technologies and/or approaches to improving fuel efficiency may actually lead to a safer highway system; for example, speed reductions, improved driver training, and use of side fairings might reduce hazards to other vehicles in inclement weather. Fourth, if new technologies diminish the performance of vehicles (e.g., decrease acceleration times), negative safety impacts could occur. Lastly, if new technologies or regulations have the effect of increasing payload capacity for trucks, fewer
trucks may be in operation, potentially resulting in safety benefits. Of these five types of safety issues, only the second one (safety issues related to a rebound effect is discussed in detail here). A more detailed assessment would be needed on all these safety aspects based on the type of regulation that may be put forward by the U.S. Department of Transportation (DOT).
This chapter has described how the demand for long-haul trucking will increase if fuel economy regulations effectively reduce long-haul truck operating costs. Truck traffic could increase by 2.2 to 10.5 percent, depending on the technology alternatives and assumed demand elasticities. The literature shows that truck traffic has a direct correlation with injuries and fatalities. Estimates of increased truck traffic can be multiplied by the injury and fatality crash rates to estimate the range of potential deaths and injuries caused by an increase in travel. Regulations that push beyond the private cost-effective levels of fuel savings can result in a decline in VMT, and the effect would be a decline in crash rates.
Recent data for highway crashes indicate crash rates for truck tractors with trailers of 2.4 per 100 million VMT for fatal crashes and 51.1 per 100 million VMT for injury crashes (Federal Motor Carrier Safety Administration, 2007). To the extent that regulations or technologies incentivize increased VMT, accidents and fatalities could potentially increase; in contrast, if regulations or technologies decrease VMT, accidents and fatalities could potentially decrease.
To estimate the dollar costs from these additional crashes, a Federal Motor Carrier Safety Administration-commissioned study on the costs of medium and large truck crashes was used (Zoloshnja and Miller, 2006). This study provides estimates of unit costs for highway crashes involving medium/heavy trucks by severity. Crash costs are broken out by truck type and severity of the crash, including no injury crashes, crashes with nonfatal injuries, and crashes with a fatality. The injury costs represent the present value, computed at a 4 percent discount rate, of all costs over the victims’ expected life span that result from a crash. They include medically related costs, emergency services costs, property damage costs, lost productivity, and the monetized value of the pain, suffering, and quality of life that the family loses because of a death or injury. As expected, fatal crashes cost more than any other crashes. The cost estimates exclude mental health care costs for crash victims, roadside furniture repair costs, cargo delays, earnings lost by family and friends caring for the injured, and the value of schoolwork lost. Table 6-24 shows the study findings for one truck type and severity of the crash. The crash costs by severity for “truck tractor and one trailer” can be used to estimate the costs resulting from the additional crashes.
Effects of Incremental Changes in Weight
Certain fuel-saving technologies will add to vehicle weight, affecting operators’ costs in three ways. First, transporting the extra weight itself increases fuel costs, partially offsetting the fuel savings the technologies allow. This effect was discussed in Chapters 4 and 5.
TABLE 6-24 Estimated Costs for Crashes Involving Truck Tractor with One Trailer, 2006
Second, in medium-duty truck applications, the extra weight may increase the loaded gross weight of some present Class 2 vehicles to over 10,000 lb and of some present Class 6 vehicles to more than 26,000 lb. Surpassing these weight thresholds will subject drivers and companies operating the vehicles to federal and state motor carrier safety regulations. The federal regulations apply to vehicles over 10,000 lb in commercial use that operate across state lines. Operators are required to register with DOT. The regulations cover record keeping, driver qualifications, driver hours of service, safety equipment, and other practices (Federal Motor Carrier Safety Administration, 2008). Many states have adopted similar regulations for vehicles used intrastate. Drivers operating vehicles over 26,000 lb must have a commercial drivers license (CDL) that meets federal standards.
A truck operator who has not previously been subject to these motor carrier safety regulations or to CDL requirements and is considering whether to adopt new vehicles with fuel-saving technologies and higher weight that would trigger the regulations will have several options. The operator may acquire the heavier vehicles and comply with the regulations or specify offsetting weight-saving equipment in order to stay under the threshold, or acquire smaller trucks than previously used. Vehicle manufacturers may decide to market new vehicle designs that facilitate the latter two choices. Any of these choices will increase the operator’s truck transportation costs, and the operator will select the one with the least cost. Complying with the safety regulations may have benefits to the operator and to society that at least partially offset compliance costs.
Finally, in heavy-duty operations in which trucks are sometimes loaded to the 80,000-lb legal gross weight limit that applies on most major U.S. roads, and in operations in which trucks are sometimes loaded to axle weight limits (e.g., refuse haulers, dump trucks), the added weight of some fuel-saving devices (without concomitant vehicle weight-reducing materials) will reduce cargo capacity, increasing average cost per ton-mile and necessitating more vehicle-miles of travel to carry a given quantity of freight. In an operation in which trucks are almost always loaded to the gross weight
or axle weight limit, the added cost will be proportional to the loss of payload. For example, the payload of a truck loaded near the 80,000-lb limit is about 50,000 lb, so an additional 500 lb of fuel-saving devices would reduce capacity by 1 percent and increase average cost per ton-mile by 1 percent in an application in which trucks are usually loaded to the gross weight limit. Fuel savings from the devices would at least partially offset this cost increase.
Most large trucks on the road are not loaded to the gross weight or axle weight limits. For example, 70 percent of traffic of five-axle tractor semitrailer mileage is at gross weights below 70,000 lb. For operations in which trucks are never or rarely loaded to the gross or axle weight limits, the loss of cargo weight capacity would not affect costs. For a typical fleet that operates sometimes at the weight limit and sometimes below, costs would be intermediate between the two extreme cases.
Fuel-saving technologies that add weight include the following:
-
Engine efficiency improvements: turbocompound systems and waste heat recovery systems
-
Hybrid power systems
-
Aerodynamic fairings
In hybrid systems the added weight of batteries and other components may not be offset by downsizing of the internal combustion engine. European manufacturers report payload penalties of 100 to 200 kg for their medium-duty truck hybrids (Baker et al., 2009). One manufacturer of aerodynamic fairings reports that its trailer underside fairings weigh 150 to 230 lb and a trailer rear fairing 75 lb (Freight Wing, no date; Transport Canada, 2009). A complete aero package might add 500 lb.
Manufacturability and Product Development
As a final note, the committee was tasked to determine whether the fuel consumption reduction technologies discussed throughout this report could be efficiently integrated into the manufacturing process. The committee found no current studies or analyses suggesting that manufacturability was a major barrier to the integration of gas/diesel engine, hybrid, aero, tire, or other technologies in the vehicle manufacturing process. (Note: There may still be issues and barriers related to the availability and manufacturing of the technologies themselves.) This finding was examined and reinforced during the committee’s site visits to engine, chassis, truck, bus, hybrid, trailer, and other manufacturers/users, including Allison Transmission, ArvinMeritor, Cummins, Great Dane, Ford, Eaton, Enova, WalMart, Navistar, Azure, Peterbilt, and PACCAR. These manufacturers were familiar with the technologies that could be introduced during the 2010-2015 time period, and they did not see any significant issues for their manufacturing processes. However, several manufacturers suggested that the larger challenge was aligning new technology deployment with their product development process (PDP) or cycle. The opportunities to integrate new technology designs into a PDP are limited, and sufficient time is needed for design and validation, customer acceptance, testing, and compliance strategy development. In addition, fuel consumption reduction technologies must be integrated with emission and safety technologies in compliance with regulations.
FINDINGS AND RECOMMENDATION
Direct Costs and Benefits
Finding 6-1. Since tractor-trailer trucks have relatively high fuel consumption, very high average vehicle miles traveled, and a large share of the overall truck market, it makes sense to put a priority on fuel consumption reduction. A given percentage reduction in this vehicle category will save more fuel than a matching percent improvement in any other vehicle category. In fact, the potential fuel savings in tractor-trailer trucks represents about half of the total possible fuel savings in all categories of medium- and heavy-duty vehicles.
Finding 6-2. The fuel consumption reduction potential for the tractor-trailer application, in the 2015 to 2020 time frame, is 50.5 percent at a cost of $84,600, which results in a capital cost per percent reduction (CCPPR) of $1,674 per percent fuel consumption reduction.
Finding 6-3. The fuel consumption reduction potential for Class 6 box and bucket trucks, in the 2015 to 2020 time frame, is 47.1 percent for box trucks and 49.6 percent for bucket trucks. The resulting cost for box trucks is $43,120 with a CCPPR of $915 per percent fuel saved, and the cost for bucket trucks is $49,870 with a CCPPR of $1,005 per percent fuel consumption reduction.
Finding 6-4. The fuel consumption reduction potential for the Class 2b pickup and van application, in the 2015 to 2020 time frame, is 44.5 percent at a cost of $14,710, which results in a CCPPR of $331 per percent fuel consumption reduction.
Finding 6-5. The fuel consumption reduction potential for the refuse truck, in the 2015 to 2020 time frame, is 38.4 percent at a cost of $50,800, which results in a CCPPR of $1,323 per percent fuel consumption reduction.
Finding 6-6. The fuel consumption reduction potential for transit bus applications, in the 2015 to 2020 time frame, is 47.8 percent at a cost of $250,400 (without subsidy), which results in a CCPPR of $5,232 per percent fuel consumption reduction.
Finding 6-7. The fuel consumption reduction potential for the motor coach application, in the 2015 to 2020 time frame, is 32 percent at a cost of $36,350, which results in a CCPPR of $1,136 per percent fuel consumption reduction.
Finding 6-8. Table 6-25 summarizes, for the seven vehicle applications studied, the fuel consumption reduction potential (from Chapters 4 and 5), the capital cost, and the cost-benefit for the 2015 to 2020 time frame, as stated in Findings 6-2 to 6-7.
TABLE 6-25 Summary of Potential Fuel Consumption Reduction, Cost, and Cost-Benefit
|
Vehicle Class |
Fuel Consumption Reduction (%) |
Capital Cost ($) |
Cost-Effectiveness Metric |
||
|
Dollars per Percent Fuel Saved |
Dollars per Gallon Saved per Year |
Breakeven Fuel Pricea ($/gal) |
|||
|
Tractor-trailer |
51 |
84,600 |
1,674 |
7.68 |
1.09 |
|
Class 6 box truck |
47 |
43,120 |
915 |
29.30 |
4.17 |
|
Class 6 bucket truck |
50 |
49,870 |
1,006 |
37.80 |
5.38 |
|
Class 2b pickup |
45 |
14,710 |
331 |
33.73 |
4.81 |
|
Refuse truck |
38 |
50,800 |
1,323 |
18.90 |
2.69 |
|
Transit bus |
48 |
250,400 |
5,232 |
48.05 |
6.84 |
|
Motor coach |
32 |
36,350 |
1,135 |
11.59 |
1.65 |
|
NOTE: Values shown are for one set of input assumptions. Results will vary depending on these assumptions. aCalculated assuming a 7 percent discount rate and a 10-year life, excluding incremental operating and maintenance costs associated with the technologies. SOURCE: Adapted from TIAX (2009). |
|||||
The tractor trailer offers the best cost-benefit potential, followed by the motor coach. The refuse hauler costs more than twice as much per gallon of fuel saved, and the other vehicle classes are even more expensive.
Indirect Costs and Benefits
Finding 6-9. A number of indirect effects and unintended consequences associated with regulations aimed at reducing fuel consumption in the trucking sector can be important. In particular, regulators should consider the following effects in the development of any regulatory proposals: rate of replacement of older vehicles (fleet turnover impacts), increased ton-miles shipped due to the lower cost of shipping (rebound effect), purchasing one class of vehicle rather than another in response to a regulatory change (vehicle class shifting), environmental co-benefits and costs, congestion, safety, and incremental weight impacts.
Finding 6-10. Consumer buying in anticipation of new regulations (pre-buy) and retention of older vehicles can slow the rate of fleet turnover and the rate at which regulatory standards can affect fleetwide fuel consumption. The committee believes the effects will be transient and reduced to the extent that fuel consumption savings offset incremental purchase costs. Government incentives in the form of tax credits or excise tax reductions with a sunset date could be used to help minimize anticipated pre-buy/low-buy fluctuations in the future. Regulators must be cognizant of these potential effects and should consider regulatory mechanisms that minimize these potential distortions.
Finding 6-11. Elasticity estimates vary over a wide range, and it is not possible to calculate with a great deal of confidence what the magnitude of the “rebound” effect is for heavy-duty trucks. The rebound effect measures the increase in ton-miles shipped resulting from a reduction in the cost of shipping. A rebound effect nevertheless likely exists that will partially offset fuel consumption declines due to the adoption of new cost-effective technologies. To the extent the regulation pushes beyond the private cost-effective point, the rebound effect will be reversed. Estimates of fuel savings from regulatory standards will be somewhat misestimated if the rebound effect is not considered.
Finding 6-12. Standards that differentially affect the capital and operating costs of individual vehicle classes can cause purchase of vehicles that are not optimized for particular operating conditions. The complexity of truck use and the variability of duty cycles increase the probability of these unintended consequences.
Finding 6-13. Reduced fuel consumption through fuel efficiency technologies in medium- and heavy-duty vehicles will likely reduce emissions of criteria pollutants. Efficiency improvements achieved by improved aerodynamics, tire rolling resistance, and weight reductions will translate into lower tailpipe emissions as well.
Finding 6-14. To the extent that regulations alter the number of shipments and VMT, there will be some safety and congestion impacts. A more detailed assessment of these impacts would be needed based on the type of regulation that may be put forward by the U.S. Department of Transportation.
Finding 6-15. There are potential safety issues associated with particular fuel reduction technologies. Examples are hybrids that use high-voltage batteries or aerodynamic fairings that may detach from trucks on the road.
Finding 6-16. Some fuel-efficienc-improving technologies will add weight to vehicles and push those vehicles over federal threshold weights, thereby triggering new operational
conditions and affecting, in turn, vehicle purchase decisions. More research is needed to assess the significance of this potential impact.
Finding 6-17. Some fuel-efficiency-improving technologies will reduce cargo capacity for trucks that are currently “weighed out” and will therefore force additional trucks onto the road. More research is needed to assess the significance of this potential impact.
Finding 6-18. The committee found no current studies or analyses suggesting that manufacturability was a major barrier to the integration of gas/diesel engine, hybrid, aerodynamic, tire, or other technologies in the vehicle manufacturing process. However, there may be challenges with integrating new technologies into manufacturers’ product development processes, and sufficient time is needed for design and validation, customer acceptance, testing, and compliance strategy development.
Recommendation 6-1. The National Highway Traffic Safety Administration, in its study, should do an economic/payback analysis based on fuel usage by application and different fuel price scenarios. Operating and maintenance costs should be part of any study.
BIBLIOGRAPHY
American Bus Association. 2006. Commercial Bus Emissions Characterization & Idle Reduction: Idle & Urban Cycle Test Results. Prepared by the U.S. Department of Energy, U.S. Environmental Protection Agency, and U.S. Federal Highway Administration. Available at http://www.buses.org/files/download/motorcoach_idling_study.pdf.
AHUA (American Highway Users Alliance). 2004.Unclogging America’s Arteries, 1999-2004. Available at www.highways.org.
American Transportation Research Institute. 2008. An Analysis of the Operational Costs of Trucking. Total Cost Summary. P. 18, Table 4. Arlington, Va.
Baker, H., R. Cornwell, E. Koehler, and J. Patterson. 2009. Review of Low Carbon Technologies for Heavy Goods Vehicles—Annex 1. Prepared for the U.S. Department of Transportation by Ricardo PLC, West Sussex, U.K. June.
Barnitt, R. 2008. BAE/Orion Hybrid Electric Buses at New York City Transit: A Generational Comparison. Technical Report NREL/TP-540-42217. March. Available at http://www1.eere.energy.gov/vehiclesandfuels/avta/pdfs/heavy/bae-orion_he_buses.pdf.
Barth, M., and K. Boriboonsomsin. 2008. Real-world CO2 impacts of traffic congestion. Transportation Research Record. Submitted March 31, 2008. Washington, D.C.
Battelle Memorial Institute. 2005. Traffic Operations and Truck Size and Weight Regulations, Working Paper 6. Prepared for the U.S. Federal Highway Administration. February. Columbus, Ohio.
Bus Engineering. 2008. Comparison of WMATA’s newest bus fleet. April 16.
Calstart HTUF Dialog, October 2008. Available at http://www.calstart.org/HomePage.aspx?aspxerrorpath/Homepage.aspx/programs/htuf/hybrid_dialog_search.php.
CARB (California Air Resources Board). 2008. Final Regulation Order to Reduce Greenhouse Gas Emissions from Heavy-Duty Vehicles. Available at http://www.arb.ca.gov/regact/2008/ghghdv08/ghgfro.pdf.
Christidis, Panavotis, and Guillaume Leduc. 2009. Longer and Heavier Vehicles for Freight Transport. JRCC52005. European Commission Joint Research Center, Institute for Prospective Technology Studies.
Cooper, C. 2009. Reducing Heavy-Duty Long Haul Combination Truck Fuel Consumption and CO2 Emissions. Boston: NESCCAF.
Dennis, Scott M. 1988. The Intermodal Competition Model. Association of American Railroads. September.
DOE (U.S. Department of Energy), Energy Information Administration (EIA). 2009. Assumptions to the Annual Energy Outlook 2009. Available at http://www.eia.doe.gov/oiaf/aeo/assumption/transportation.html.
EPA (U.S. Environmental Protection Agency). 2006. Motor Coach Idling Field Observation Study for Washington, DC, Metro Area. Transportation and Regional Programs Division and SmartWay Transport Partnership Group, Office of Transportation and Air Quality, U.S. Environmental Protection Agency. Available at http://epa.gov/smartway/documents/420s06004.pdf.
Federal Motor Carrier Safety Administration. 2007. Commercial Vehicle Facts. November. Available at http://www.fmcsa.dot.gov/facts-research/facts-figures/analysis-statistics/cmvfacts.htm.
Federal Motor Carrier Safety Administration. 2008. A Motor Carrier’s Guide to Improving Highway Safety. October.
Freight Wing, Inc. No date. Freight Wing Trailer Aerodynamics. Available at http://www.freightwing.com/.
IFEU (Institut für Energieund Umweltforschung, Heidelberg GmbH). 2003. Energy Savings by Lightweighting. Heidelberg, Germany: IFEU.
Jones, J., F. Nix, and C. Schwier. 1990. The Impact of Changes in Road User Charges on Canadian Railways. Prepared for Transport Canada by the Canadian Institute of Guided Ground Transport, Kingston, Ontario. September.
Lowe, M., et al., Center on Globalization Governance and Competiveness, Duke University. 2009. Manufacturing Climate Solutions, Carbon Reducing Technologies and U.S. Jobs. June 10. Available at http://www.cggc.duke.edu/environment/climatesolutions/greeneconomy_Ch9_HybridDrivetrainsforTrucks.pdf.
NESCCAF, ICCT, Southwest Research Institute, and TIAX. 2009. Reducing Heavy-Duty Long Haul Combination Truck Fuel Consumption and CO2 Emissions. Washington, D.C.: International Council on Clean Transportation (ICCT). October.
Parry, I. 2006. How Should Heavy-Duty Trucks Be Taxed? Washington, D.C.: Resources for the Future. April.
Ranganathan, S. 2006. Hybrid Buses Costs and Benefits. Washington, D.C.: Environmental and Energy Study Institute. Available at http://www.eesi.org/files/eesi_hybrid_bus_032007.pdf.
Research and Markets. 2009. Lithium-Ion and Nickel-Metal Hydride Batteries, Lithium, Rare Earth Lanthanum and the Future of Hybrid Electric Vehicles, Plug-in Hybrid Electric Vehicles and Electric Vehicles 2009-2020. Brochure. Available at www.researchandmarkets.com/. Accessed November 2, 2009.
Schrank, D., and T. Lomax. 2005. The 2005 Urban Mobility Report. Texas Transportation Institute, Texas A&M University System. Available at http://mobility/tamu.edu.
Schubert, R., and M. Kromer. 2008. Heavy-Duty Truck Retrofit Technology: Assessment and Regulatory Approach. Prepared by TIAX, LLC, for the Union of Concerned Scientists, September 12.
TTI (Texas Transportation Institute). 2007. 2007 Annual Urban Mobility Report, Appendix A. College Station, Tex: TTI.
TIAX LLC. 2009. Assessment of Fuel Economy Technologies for Medium-and Heavy-Duty Vehicles. Final Report for the National Academy of Sciences. Sept. 16.
Transport Canada. 2009. Freight Wing Fleet Trial Program on Aerodynamic Fairings. Modified June 26. Available at http://www.tc.gc.ca/programs/environment/ecofreight/casestudies/freightwing-eng.htm.
TRB (Transportation Research Board). 2000. Highway Capacity Manual. Washington, D.C.: TRB.
TRB. 2009. Transportation Energy Data Book. Edition 28-2009, Table 5.14. Washington, D.C.: TRB.
Walsh, J. 2009. Mack delivers hybrid refuse truck to New York City. Press release, May 28.
Zaloshnja, E., and T. Miller. 2006. Unit Costs of Medium and Heavy Truck Crashes. Final Report. Prepared for the Federal Motor Carrier Safety Administration. December. Available from National Technical Information Service, Springfield, Va. Also available at www.ai.volpe.dot.gov/.


