
2
The School Meals Programs
This chapter describes criteria for eligibility and the process for application, certification, verification, participation, meal counting, and reimbursement in the National School Lunch Program (NSLP) and the School Breakfast Program (SBP). It is essential to understand all elements of the school meals programs to be able to consider alternative procedures that could reduce administrative burden and make it possible to provide nutritious meals to a greater number of the nation’s school-age children.
CONCEPTUAL FRAMEWORK
Figure 2-1 illustrates the flow of the process from determining the eligibility of students to serving them nutritionally qualified meals, noting that there are different distributions of students and meals served across the free, reduced-price, and full-price meal categories at each point. The first two boxes and the first oval in the figure reflect distributions based on all enrolled students; the second oval and last box relate to average daily meals served. For simplicity, we have assumed that the process depicted in the figure occurs instantaneously1 and have ignored how the distributions and the relationships among them change over time.
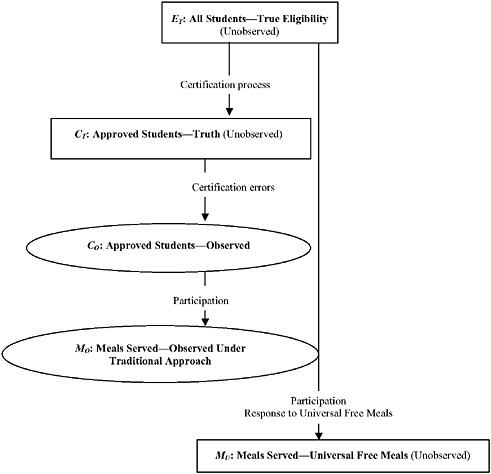
FIGURE 2-1 School meals process and distributions of enrolled students and meals served across free, reduced-, and full-price categories: traditional approach and universal free meals.
The top box in the figure, labeled “ET: All Students—True Eligibility (Unobserved),” represents the distribution of all enrolled students by their true eligibility status, including those who are eligible for free meals using program rules described below, those who are eligible for reduced-price meals using program rules, and all other students, who are eligible for full-price meals. As noted, this distribution is not observed.
The process by which students are identified and approved as being eligible for free or reduced-price meals is known as certification.2 Students
who are found to be eligible through the certification process become approved students.
The second box in the figure, labeled “CT: Approved Students—Truth (Unobserved),” represents the distribution of all enrolled students according to a certification process with no errors. Some students who are eligible for free or reduced-price meals decline to participate in the certification process (or the verification process). All students who either do not apply or are not directly certified for free meals are eligible for full-price meals, as are those students who apply but are found to be ineligible for free or reduced-price meals. The distribution, CT, is not observed. The number of students in the free category of CT will be less than or equal to the number in the free category of ET by the number of students who were not directly certified and who did not apply for benefits. These students will be in the full-price category of CT. Likewise, students in the reduced-price category of ET who did not apply will be in the full-price category of CT.
The first oval in the figure (third item), labeled “CO: Approved Students—Observed,” represents the distribution of enrolled students into categories of approved for free meals, approved for reduced-price meals, and eligible for full-price meals, in which the categories of approved for free or reduced-price meals are as determined by the actual operation of the certification process and maintained in school records. The certification process is described below. The difference between CT and CO is due to misclassification of students (errors) during the certification process. For example, some students who are eligible for free meals may have been approved for reduced-price meals.
On any given day, a student may bring a meal from home or purchase a meal that does not qualify for reimbursement because it does not satisfy the nutritional requirements of the school meals programs. Hence, schools must count the total number of reimbursable meals served each day and note whether each child taking a meal is approved for a free or reduced-price meal or must pay full price. The last two distributions in Figure 2-1 reflect the distribution of average daily reimbursable meals served across the three categories.
The second oval in the figure (fourth item), “MO: Meals Served—Observed Under Traditional Approach,” represents the distribution of meals served (across the free, reduced-, and full-price categories) in a school that uses the traditional procedures for certifying students and claiming reimbursement. While some students never participate (take meals) or participate on only some days, others participate every day. When students line up in the cafeteria with their trays, a cashier determines whether each meal served qualifies as reimbursable under the school meals programs in terms of food group composition, serving size, etc. The cashier also determines whether the child is approved for a free or
reduced-price meal in a way that ensures there will be no overt identification of the student’s eligibility category.3 This process provides the meal counts maintained in school records that are used to determine federal reimbursements in the school meals programs.
The third box in the figure (fifth item), “MU: Meals Served—Universal Free Meals (Unobserved),” represents the participation distribution when meals are provided for free to all students. The distribution is unobserved because meals are not counted by category when they are provided for free under a special operating provision, such as Provisions 2, 3, or 4. The available evidence suggests that if meals were provided at no cost, more students would participate. This distribution is important in assessing the costs and benefits of a new provision, and the ultimate objective of the panel is to determine whether there is a reliable and operationally feasible method for estimating this distribution for a school, group of schools, or school district using available data.
ELIGIBILITY
Students are eligible for free school meals if their family’s “current” income is at or below 130 percent of the poverty guideline for their family size. Current income requested on the application form “may be for the current month, the amount projected for the first month the application is made for, or for the month prior to application.”4 Students are “categorically eligible” for free meals if someone in the family participates in certain other means-tested public assistance programs targeted for the low-income population. Specifically, students are categorically eligible for free meals if their families receive assistance from the Supplemental Nutrition Assistance Program (SNAP, formerly the Food Stamp Program), Temporary Assistance to Needy Families (TANF), or the Food Distribution Program on Indian Reservations (FDPIR). A student is also categorically eligible if he/she is enrolled in a Head Start or Even Start Program, or if the student is (1) a homeless child as determined by the school district’s homeless liaison or by the director of a homeless shelter, (2) a migrant child as determined by the state or local Migrant Education Program
|
3 |
The Richard B. Russell National School Lunch Act (Section 9B(10), pp. 3-22) states: (10) No physical segregation of or other discrimination against any child eligible for a free lunch or a reduced price lunch under this subsection shall be made by the school nor shall there be any overt identification of any child by special tokens or tickets, announced or published list of names, or by other means, see http://www.fns.usda.gov/cnd/Governance/Legislation/NSLA-10-2008.pdf [accessed May 2010]. |
|
4 |
See Eligibility Manual for School Meals: Federal Policy for Determining and Verifying Eligibility, see http://www.fns.usda.gov/cnd/Governance/notices/iegs/EligibilityManual.pdf [accessed June 2010]. |
coordinator, or (3) a runaway child who is receiving assistance from a program under the Runaway and Homeless Youth Act and is identified by the local educational liaison.
Students who are not eligible for free meals are eligible for reduced-price meals if their family’s “current” income is greater than 130 percent of the poverty guideline and at or below 185 percent of the poverty guideline. All other students are eligible for full-price meals.5
CERTIFICATION
Certification is the process by which students are approved as being eligible for free or reduced-price meals. There are two types of certification: direct certification and the solicitation, submission, and review of applications. School districts, usually through their state agency, directly certify “categorically eligible” students based primarily on their participation in SNAP, TANF, and FDPIR. The 2004 Child Nutrition and WIC Reauthorization Act required that all school districts establish a system of direct certification of students from households that receive SNAP benefits by school year (SY) 2008-2009. Some states or districts also make use of TANF or other program data as part of direct certification. For direct certification, states or districts match lists of students (including names, addresses, etc.) with the administrative data concerning individuals participating in SNAP or other assistance programs. Students matched in this way are “directly certified” as being eligible for free school meals. Parents are notified that their students are eligible and do not need to file an application. Matching for direct certification is done at least once a year. Some states conduct direct certification more frequently to identify newly eligible students. For example, Washington State conducts direct certification monthly. As discussed below, certification for free meals remains effective for the rest of the school year and for up to 30 days into the next school year. Through direct certification, an estimated 71 percent of students from SNAP-participant households nationwide were certified for free school meals in SY 2008-2009 without applications.6 Due to errors in record matching or participation in a program for which a state does not perform direct certification, some categorically eligible students are not directly certified. Families of such students can establish their categorical eligibility by providing a SNAP, TANF, or FDPIR case number on their application for school meals.
|
5 |
See Eligibility Manual for School Meals: Federal Policy for Determining and Verifying Eligibility, see http://www.fns.usda.gov/cnd/Governance/notices/iegs/EligibilityManual.pdf [accessed June 2010]. |
|
6 |
In some states, direct certification rates were nearly 100 percent (U.S. Department of Agriculture, Food and Nutrition Service, 2009). |
Just prior to and at the beginning of a school year (normally mid-July through early September), school districts send a letter to the parents of their students describing the school meals programs, inviting them to apply, and providing an application form. The application requests information about participation in SNAP or other assistance programs, family composition, and family income. School or district officials review the applications and make a determination about whether the child should be approved for free or reduced-price meals. If an application lists a legitimate case number for SNAP or other approved program, the student is certified as being categorically eligible for free meals.
While most applications are submitted at the beginning of the school year, applications and eligibility are in effect from the date of approval for the entire school year and up to 30 operating days into the subsequent school year. A family may submit an application at any time during the year and may do so later in the year if, for example, its income changes or it starts participating in SNAP or TANF.
The distribution of approved students by category for the school meals programs in fiscal year (FY) 2005-2009 is shown in Table 2-1. This is the CO distribution in Figure 2-1.
Not all families with students who are eligible for free or reduced-priced meals submit applications. The Food and Nutrition Service (FNS) reported that “available data indicate that between 16 percent and 25 percent of potentially eligible families do not apply for school meals benefits” (U.S. Department of Agriculture, Food and Nutrition Service, 1994a). Although this may no longer be true in light of incentives (such as the allocation of funds in other programs) and processes (such as direct certification) for certifying as many eligible students as possible for free meals, more recent estimates are not available.
TABLE 2-1 Percentage of Enrolled Students by Approval Status for School Meals Programs, FY 2005-2009
TABLE 2-2 Number of Students Eligible for NSLP from Two Sources: (1) CPS Estimates Based on Annual Income and (2) NSLP Certifications for Free and Reduced-Price Meals (in thousands), 1993-1999
|
Year |
Free Lunch |
Free and Reduced-Price Lunch |
||||
|
CPS-Income Eligible |
NSLP Certified |
Certified/ Eligible (%) |
CPS-Income Eligible |
NSLP Certified |
Certified/ Eligible (%) |
|
|
1999 |
12,464 |
15,876 |
127 |
18,928 |
19,260 |
102 |
|
1998 |
13,128 |
15,965 |
122 |
19,190 |
19,067 |
99 |
|
1997 |
13,461 |
15,799 |
117 |
19,416 |
18,762 |
97 |
|
1996 |
13,382 |
15,415 |
115 |
19,727 |
18,273 |
93 |
|
1995 |
13,655 |
14,920 |
109 |
20,030 |
17,577 |
88 |
|
1994 |
13,718 |
14,396 |
105 |
19,609 |
16,952 |
86 |
|
1993 |
13,924 |
13,792 |
99 |
19,750 |
16,273 |
82 |
|
SOURCE: U.S. Department of Agriculture, Food and Nutrition Service (1999:3, 5). |
||||||
An FNS study enabled a comparison of the distributions of eligible and certified students (U.S. Department of Agriculture, Food and Nutrition Service, 1999). It used data from the Current Population Survey (CPS) to estimate the percentage of students who were income eligible for free and reduced-price meals, providing a survey-based estimate for ET (Figure 2-1), with eligibility based on annual income data. These estimates were compared with the numbers of students approved as being eligible for free or reduced-price meals, CO. Table 2-2, taken from that report, indicates that the number of students certified was growing from 1993 through 1998, whereas the number eligible according to annual income was flat or declining. By 1998, the number of students approved for free meals was 127 percent of the number of students who were estimated as being income eligible for free meals, and the number of students approved for free or reduced-price meals was 102 percent of the number of students who were estimated as being income eligible for free or reduced-price meals. These results were interpreted as evidence that there was over-certification in the school meals programs and contributed to the passage of the Improper Payments Act of 2002, which requires that various federal agencies identify and reduce erroneous payments in their programs (National Research Council, 2009:14).7 Subsequent research found that at
|
7 |
As discussed in Chapters 3 and 5 of the National Research Council report, estimates of eligibility based on annual income are likely to be too low, given that families may have 1 or more months of low income that would qualify them for free or reduced-price meals even when their annual income exceeded the income eligibility limits. |
least some of the difference between estimated income eligibility from the CPS and approval status under the school meals programs may be due to how income relative to poverty is measured (annual or monthly) and to changes in monthly income from the time of application to the time of verification (U.S. Department of Agriculture, Economic Research Service, 2006b).
In response to the Improper Payments Act, FNS funded the Access, Participation, Eligibility, and Certification (APEC) study in 2004 to obtain national estimates of the amounts and rates of erroneous payments in the NSLP and the SBP (U.S. Department of Agriculture, Food and Nutrition Service, 2007b). Erroneous payments may arise because of certification errors due to household reporting, administrative mistakes, or non-certification errors in counting and claiming payment for reimbursable meals. The study used a complex sample design to survey school districts, schools, and students.
The APEC study provided baseline estimates of erroneous payments for SY 2005-2006. It also provided parameters for estimation models to allow FNS staff to update estimates of erroneous payments. The study found that 77.5 percent of all certified students and denied applicants were correctly certified or denied meal benefits, whereas 22.5 percent were certified in error or erroneously denied benefits. It also found that over-certification was more common than undercertification—the percentage of students certified for a higher level of benefits than that for which they were eligible (the overcertification rate) was 15 percent; the percentage of students either certified for a lower level of benefits than that for which they were eligible or erroneously denied benefits (the undercertification rate) was 7.5 percent. More detailed results from the APEC study are discussed in Chapter 6.
VERIFICATION
In addition to special studies, such as the APEC study, school districts are required to annually verify a sample of NSLP and SBP applications. Typically, a school district is required to conduct an annual verification of 3 percent or 3,000 (whichever is smaller) of the applications approved and on file as of October 1 of the current school year.8 Verification is to be completed by November 15 of the current school year. Samples are to be selected from “error prone” applications, which are those with reported monthly income within $100 of a school meals eligibility threshold (130 percent or 185 percent of the applicable poverty guideline). The households that submitted the applications selected for verification are
required to submit documentation of income for any point in time between the month prior to application and the time of verification. School districts make at least one follow-up attempt with households that do not respond. The students in households that fail to provide the required documentation are removed from eligibility. Results of the outcomes of verification studies are reported annually on Form FNS-742. Data for each school district are reported via state agencies to FNS regional offices, which upload the data to FNS headquarters, where they are maintained.
PARTICIPATION
Any child attending a school that participates in the school meals programs may obtain a meal. Cashiers assess which meals meet the nutritional requirements of the NSLP and the SBP and, for qualifying meals, record each student’s approval status (free, reduced price, full price) in a way that does not overtly identify the student’s status. Meal counts are aggregated to the school, to the school district, and to the state. This process provides the meal counts maintained in school records, which are also reported to FNS via Form FNS-10.
FNS defines participation as the 9-month (September-May) average of each month’s average daily meals served, divided by an attendance factor of .927 to account for school absenteeism.9 Table 2-3, from a special tabulation from the FNS National Data Bank, shows participation (average daily number of meals served divided by .927) in the NSLP by year and the percentage of meals served that were free, reduced price, or full price. The percentage distribution is MO in Figure 2-1.
Another way of looking at participation is by meal category (see Table 2-4). Dividing participation (average daily number of meals served by category divided by .927) in a month by the total number of enrolled students approved in that category shows consistently higher participation by students approved for free meals, followed by students approved for reduced-price meals, followed by students having to pay full price.
While the participation rates in Table 2-4 are based on meals served divided by .927 (in the numerator), similar national rates are obtained when participation is measured by the number of approved students who take meals. As discussed in the FNS report School Lunch Eligible Non-Participants (U.S. Department of Agriculture, Food and Nutrition Service, 1994a:I-5):
[S]ome children who are approved to receive free or reduced-price meals do not always obtain the meals. Previous studies have shown that stu-
|
9 |
See http://www.fns.usda.gov/pd/cnpmain.htm [accessed May 2010]. |
TABLE 2-3 Official NSLP Participation (average daily meals divided by .927) and Percentage of Lunches Served by Approval Category, FY 2005-2009
|
Fiscal Year |
NSLP Participation |
Percentage of Lunches Served |
||
|
Free |
Reduced Price |
Full Price |
||
|
2009 |
31,227,700 |
52.0 |
10.1 |
37.9 |
|
2008 |
31,015,182 |
49.6 |
10.1 |
40.3 |
|
2007 |
30,513,236 |
48.9 |
10.0 |
41.2 |
|
2006 |
30,132,869 |
49.0 |
9.8 |
41.2 |
|
2005 |
29,646,189 |
49.2 |
9.7 |
41.1 |
|
SOURCE: Tabulation from the Food and Nutrition Service National Data Bank provided to the panel, February 4, 2010. |
||||
TABLE 2-4 NSLP Participation (average daily meals divided by 0.927) by Approval Category, FY 2005-2009
|
Fiscal Year |
Participation Rate (Percentage) |
||
|
Free |
Reduced Price |
Full Price |
|
|
2009 |
80.0 |
72.1 |
46.0 |
|
2008 |
80.7 |
72.2 |
46.4 |
|
2007 |
80.5 |
73.3 |
46.1 |
|
2006 |
78.5 |
70.8 |
46.3 |
|
2005 |
79.1 |
71.5 |
44.9 |
|
SOURCE: Tabulation from the Food and Nutrition Service National Data Bank provided to the panel, February 4, 2010. |
|||
dent participation rates (the percentage of students in a given group who take or purchase a meal on a typical day) are about 80 percent for students approved for free meals, about 70 percent for students approved for reduced-price meals, and about 45 percent for students who pay full price. Participation rates decline considerably as students get older.
More recent information on participation is available from the School Nutrition Dietary Assessment Study-III (U.S. Department of Agriculture, Food and Nutrition Service, 2007a). The main focus of the study was to look at the nutritional content of school meals and to identify student and parent reasons for participation or nonparticipation. This study used the following two definitions of participation: (1) percentage of enrolled students who took a meal that qualified under the school meals program on a target day, and (2) the percentage who “usually” took such a meal, with “usually” defined as 3 or more days per week.
On a typical day in SY 2004-2005, about 62 percent of all students participated in the NSLP and about 18 percent participated in the SBP. Nearly three-quarters of students reported participating in the NSLP 3 or more days per week, and one-quarter reported participating in the SBP 3 or more days per week. Parents of students who did not participate in the NSLP reported some of the same reasons as students did for this decision—for example, that their child did not like the cafeteria food (68 percent) or preferred to bring a lunch from home (65 percent).
Table 2-5 shows participation rates according to the first definition separately for elementary, middle, and high school students by income level and reported receipt of free or reduced-price meals (official approval status was not determined). The table shows that about 87 percent of all elementary school students with family income less than or equal to 185 percent of poverty (that is, students income eligible for either a free or a reduced-price meal) participated in the school lunch program on the target day, and 62 percent of all elementary school students with family income more than 185 percent of poverty participated in the school lunch program. For middle school students, participation rates were lower than for elementary school students in all three income categories; participation by those eligible for a reduced-price meal fell in between participation for those eligible for a free meal and those not eligible for either a free or a reduced-price meal. For high school students, participation rates were lowest of all, except that the participation rate of high school students eligible for a reduced-price meal was no lower than the corresponding middle school participation rate
TABLE 2-5 Target Day Participation Rates in the NSLP (percentage of enrolled students) from the School Nutrition Dietary Assessment Study-III—by Income Level, Meal Category, and School Level
|
Income/Meal Category |
Elementary |
Middle |
High |
All Students |
|
Income Relative to Poverty Guideline: |
|
|
|
|
|
Less than or equal to 130 percent |
86.9 |
71.7 |
55.5 |
75.7 |
|
Between 130 and 185 percent |
86.5 |
63.5 |
64.1 |
75.5 |
|
More than 185 percent |
62.1 |
54.6 |
36.3 |
52.6 |
|
Receipt of Meals (parent report): |
|
|
|
|
|
Receives free or reduced-price meals |
86.5 |
70.7 |
66.4 |
78.8 |
|
Does not receive free or reduced-price meals |
60.1 |
51.9 |
34.3 |
49.6 |
|
SOURCE: U.S. Department of Agriculture, Food and Nutrition Service (2007a:vol. II, p. 36). |
||||
and higher than the participation rate of high school students eligible for a free meal.
The main objective of our panel is to recommend a method for estimating the unobserved distribution in Figure 2-1 labeled “MU: Meals Served—Universal Free Meals (Unobserved).” This distribution reflects what would happen in the future if a district adopted free meals for all students through a new approach that used available data, such as those from the American Community Survey (ACS), to establish claiming percentages for reimbursement from the U.S. Department of Agriculture (USDA). A student who was approved for a reduced-price meal would save 40 cents per meal with universal free meals, and a student who would otherwise pay for a meal would save the entire amount that was charged by the school district. Consequently, one might expect the rate of increased participation from providing free meals to all students to be greatest for students who formerly had to pay for their meals, followed by reduced-price-eligible students, followed by students already eligible for free meals.
COUNTING, CLAIMING, AND REIMBURSEMENT
The meal counting process begins when the cashier determines whether a child’s meal qualifies as a reimbursable meal (by satisfying the nutritional requirements described in Chapter 1)10 and whether the child is approved for a free meal or a reduced-price meal or must pay full price. As noted above, a student’s approval status cannot be overtly identified by this process. Thus, for example, all students taking a reimbursable school meal must go through the same cashier’s line, regardless of eligibility status. According to the APEC report (U.S. Department of Agriculture, Food and Nutrition Service, 2007b:vol. I, p. 16):
[T]o obtain meal reimbursements, school personnel must accurately count, record, and claim the number of reimbursable program meals actually served to students by category—free, reduced-price, and full price (except for schools using Provision 2 or 3 in nonbase years). To do this, school districts must put in place a system that issues benefits, records meal counts at the school’s point of service, and reports them to the central district office. The district must receive reports of meal counts from the schools, consolidate them, and submit claims for reimbursement to its state agency.
The state reports monthly aggregates to FNS on Form FNS-10. These data are used by FNS to determine reimbursements due to the states. The states distribute the reimbursement to the school districts.
|
10 |
That is if the meal satisfies the nutritional requirements described in Chapter 1. |
TABLE 2-6 Federal Reimbursement Rates for 2009-2010 School Meals Programs by Eligibility Category
|
Eligibility Category |
Lunch Rate |
Breakfast Rate |
|
Free (income at or below 130% of poverty guideline) |
$2.68 ($2.70) |
$1.46 ($1.74) |
|
Reduced Price (income 130 to 185% of poverty guideline) |
$2.28 ($2.30) |
$1.16 ($1.44) |
|
Full Price (income greater than 185% of poverty guideline) |
$0.25 ($0.27) |
$0.26 ($0.26) |
|
NOTE: Dollar amounts in parentheses are reimbursement increments for schools serving large proportions of free and reduced-price meals (see text). SOURCE: See http://www.fns.usda.gov/cnd/Governance/notices/naps/nsl09-10t.pdf [accessed June 0210]. |
||
Most of the support USDA provides to schools in the NSLP and the SBP comes in the form of a monthly cash reimbursement for each meal served. Table 2-6 shows reimbursement rates by eligibility category for SY 2009-2010. (Rates may be adjusted at the beginning of each school year.) Schools that served more than 60 percent free and reduced-price lunches 2 years earlier are eligible for 2 cents more per category for the NSLP (shown in parentheses in the table); schools that served more than 40 percent free and reduced-price lunches are eligible for higher severe-needs rates for the SBP (shown in parentheses in the table). Higher reimbursement rates are also in effect for Alaska and Hawaii.
SPECIAL PROVISIONS FOR OPERATING THE SCHOOL MEALS PROGRAMS
For determining claiming percentages for reimbursement from USDA for free, reduced-, and full-price meals, schools, groups of schools, or entire school districts may choose to participate in one of three special provisions instead of following the traditional procedures for eligibility determination and meal counting. Typically, they apply for these provisions through the state. These provisions are most appropriate for areas with high percentages of students eligible for free or reduced-price meals. Provisions 1 and 2 were approved in federal regulations in 1980. Provision 3 was approved in regulations in 1995.
Provisions 1, 2, and 3
Provision 1 permits schools enrolling at least 80 percent of students who are eligible for free or reduced-price meals to certify students’ eligi-
bility for free meals for 2 years instead of reestablishing eligibility every year. There are currently very few schools operating under Provision 1.
Provision 2 permits schools, groups of schools, and entire school districts to establish claiming percentages for federal reimbursement via information collected during a base period and to serve all meals at no charge for a 4-year period. The first year is the base year, during which the school makes eligibility determinations, conducts verifications, and takes meal counts by type (but does not charge for any meals). During the next 3 years, the school makes no new eligibility determinations or verification checks and counts only the total number of reimbursable meals served each day.11 Reimbursement during these years is determined by applying the percentages of free, reduced-, and full-price meals served during the corresponding month of the base year to the total count of reimbursable meals for the claiming month. The base year is included as part of the 4 years. At the end of each 4-year period, the state agency may approve a 4-year extension if the income level of the school’s population remains stable.12 Some schools use Provision 2 only for the SBP. These schools still collect applications, make eligibility determinations, and perform verifications for households with students that participate in the NSLP.
Provision 3 permits schools, groups of schools, and school districts to receive the same level of federal cash and commodity assistance each year during a 4-year period, with some adjustments. The base year is the last year the school made eligibility determinations and counted reimbursable meals by type. For the subsequent 4-year period, schools must serve meals to all participating students at no charge, and they do not make additional eligibility determinations or conduct additional verification checks. For each of the 4 years, the level of federal cash and commodity support is adjusted only to reflect changes in enrollment, the number of operating days, and inflation. Unlike Provision 2, the base year of Provision 3 is not included as part of the 4 years, and schools may charge students for meals during the base year. At the end of each 4-year period, the state agency may approve a 4-year extension if the income level of the school’s population remains stable.
Provision 1 offers the least reduction in paperwork and administrative burden of the three provisions. Provisions 2 and 3 offer greater reductions in paperwork and administrative burden; in return, schools electing to use one of these two provisions must pay the difference between fed-
eral reimbursement and the cost of providing all meals at no charge from sources other than federal funds. According to the Food Research and Action Center, “Schools that have implemented Provision 2 or 3 have found that they can offset cost differentials with as few as 60 to 75 percent of students eligible for free- or reduced-price school meals.”13 According to the SNDA Study-III, 12.9 percent of schools used Provision 2 and 1.3 percent of schools used Provision 3 to provide free meals to all students in SY 2004-2005 (U.S. Department of Agriculture, Food and Nutrition Service, 2007b).
Philadelphia Pilot Project
FNS uses pilot projects to test alternative procedures in the school meals programs. One pilot project in the School District of Philadelphia is ongoing and is relevant to the panel’s work. This district has a hybrid system with one-third of schools operating under the traditional procedures and two-thirds of schools providing free meals to all students and developing claiming percentages by combining information about students in households that were directly certified for free meals with information from a household survey designed to determine eligibility for free and reduced-price meals (Reinvestment Fund, 2007). The application and verification processes are eliminated for the no-fee schools. The steps in the process for estimating claiming percentages included direct certification, followed by a survey of nondirectly certified students. The direct certification and household survey data showed that 79.6 percent of the students attending the no-fee public schools were eligible for free or reduced-price meals.
In the early 2000s, FNS commissioned the U.S. Census Bureau to conduct a study to develop eligibility estimates for schools in the School District of Philadelphia from the 2000 Census long-form sample (Geverdt, 2005), which the ACS replaces. Developing appropriate digitized school attendance boundaries was the most challenging part of obtaining estimates for school attendance areas and was undertaken in collaboration with officials in Philadelphia. The estimates from the decennial census were compared with the counts of students approved for free and reduced-price meals from the National Center for Education Statistics’ (NCES) Common Core of Data (CCD). The study found that, on average, the census estimated that 61 percent of students were eligible for free or reduced-price meals compared with 74 percent approved according to the CCD. Some of this difference is likely to be due to the difference between
|
13 |
See http://www.frac.org/html/federal_food_programs/cnreauthor/provision2.htm [accessed May 2010]. |
eligibility as measured by annual income in the census and eligibility as measured by monthly income in the school meals programs.
Alternative Reimbursement Formulas
Under the traditional procedures for operating the school meals programs (and under Provision 1), federal financial assistance to school districts is calculated as the total number of reimbursable meals served to students approved as eligible for free, reduced-, or full-price meals multiplied by the applicable meal reimbursement rates. Thus, federal government outlays (G) for reimbursable meals under the NSLP or the SBP are
where
-
Gt is the government outlay for reimbursable meals in month t, in dollars;
-
Rf is the reimbursement rate for free meals for this school year, in dollars (e.g., $2.68 for the NSLP in SY 2009-2010, if the school is not eligible for an increment);
-
Rr is the reimbursement rate for reduced-price meals for this school year, in dollars;
-
Rp is the reimbursement rate for full-price meals for this school year, in dollars;
-
Mft is the total number of free meals served in month t;
-
Mrt is the total number of reduced-price meals served in month t;
-
Mpt is the total number of full-price meals served in month t; and
-
Mt= Mft+ Mrt+ Mpt is the total number of reimbursable meals served in month t.
Under Provision 2, the number of meals served by category, Mft, Mrt, and Mpt, in the school, group of schools, or school district are unknown because they are not counted, but the total, Mt, is known, and can be used along with counts of meals served by category during the same month of the base year to determine the reimbursement amount. Therefore, the reimbursement formula for Provision 2 is
where
-
G2t is the government outlay for reimbursable meals served in month t in Provision 2 schools, in dollars;
-
Rf, Rr, and Rp are reimbursement rates as defined above;
-
Mt is the total number of reimbursable meals served during month t;
-
Mf0,t is the total number of free meals served in month t of the base year;
-
Mr0,t is the total number of reduced-price meals served in month t of the base year;
-
Mp0,t is the total number of full-price meals served in month t of the base year; and
-
M0,t= Mf0,t+ Mr0,t+ Mp0,t is the total number of reimbursable meals served during month t of the base year.
The ratios in the equation above are the Provision 2 claiming percentages.
Under Provision 3, meals served by category are estimated by using meals served in the same month of the base year multiplied by a factor reflecting the change in enrollment and inflation since the base year. Therefore, the reimbursement formula for Provision 3 is
where
-
G3t is the government outlay in month t for Provision 3 schools, in dollars;
-
Rf, Rr, and Rp are reimbursement rates as defined above;
-
Mf0,t is the total number of free meals served in month t of the base year;
-
Mr0,t is the total number of reduced-price meals served in month t of the base year;
-
Mp0,t is the total number of full-price meals served in month t of the base year; and
-
δ is a ratio adjustment factor (ratio of current value to base year value) reflecting changes in enrollment and inflation.
Philadelphia uses an enrollment-based method in conjunction with the traditional approach. About one-third of the schools (low poverty) operate under traditional procedures and about two-thirds of the schools (high poverty) provide free meals to all students and use claiming percentages based on data from a socioeconomic survey combined with the number of directly certified students to estimate the percentage of
enrolled students eligible for free, reduced-price, and full-price meals. The overall reimbursement formula is
where
-
GtTraditional is the federal government outlay for one-third of the schools using the traditional application and meal counting and claiming procedures; and
-
Gtsurvey is the federal government outlay established for two-thirds of the schools operating no-fee programs as described below:
where
-
Mt is the total number of reimbursable meals served in month t;
-
Rf, Rr, and Rp are reimbursement rates as defined above;
-
Ef is the number of enrolled students who have been directly certified or estimated as eligible for free meals from a survey of students’ families;
-
Er is the number of enrolled students who have been estimated as eligible for reduced-price meals based on a survey of students’ families;
-
E is the total student enrollment; and
-
Ep= E – Ef– Er is the number of enrolled students who are eligible for full-price meals.
If sufficiently accurate estimates of eligibility can be derived from the ACS and other data, the following formula, similar to the formula used for the two-thirds of Philadelphia schools operating no-fee programs, was described to the panel by FNS as one that the agency would consider using to determine reimbursement for a school, group of schools, or an entire district that provides universal free meals under a new special provision, which we term Provision 4:
where
-
Ge4t is the government outlay for reimbursable meals served in month t in Provision 4 schools, based on eligibility estimates, in dollars;
-
Rf, Rr, and Rp are reimbursement rates as defined above;
-
Mt is the total number of reimbursable meals served in month t;
-
Ef is the estimated number of enrolled students who are eligible for free meals based on the ACS and other sources;
-
Er is the estimated number of enrolled students who are eligible for reduced-price meals based on the ACS and other sources;
-
E is the estimated number of enrolled students in Provision 4 schools based on the ACS and other sources; and
-
Ep= E – Ef– Er is the estimated number of enrolled students who are eligible for full-price meals.
In light of the differences between the distributions of students by eligibility category in Table 2-1 and the distributions of meals served by eligibility category in Table 2-3, a substantial concern with the previous “enrollment-based” reimbursement equation—that is, an equation based on the distribution of enrolled students—is that it might be unfair to districts. Specifically, as illustrated in an example presented by FNS at the first meeting of the panel,14 districts might receive smaller reimbursements than they would with a “participation-based” equation, that is, an equation based on the distribution of meals served. Therefore, the panel will focus on a more general expression for the Provision 4 reimbursement formula:15
where
-
Gp4t is the government outlay for reimbursable meals served in month t in Provision 4 schools, based on eligibility and participation estimates, in dollars;
-
Rf, Rr, and Rp are reimbursement rates as defined above;
-
Mt is the total number of reimbursable meals served in month t;
-
Cf is the claiming percentage for free meals, an estimate for the fraction of reimbursable meals served to students eligible for free meals;
-
Cr is the claiming percentage for reduced-price meals, an estimate for the fraction of reimbursable meals served to students eligible for reduced-price meals; and
-
Cp= 1 – Cf– Cr is the claiming percentage for full-price meals.
The claiming percentage16 for a category is the estimated fraction of reimbursable meals that will be served to students who are eligible for that category (however, meals will be provided free to all students). The three claiming percentages are the MU distribution in Figure 2-1, and, as noted above, the ultimate objective of this panel is to determine whether there is a reliable and operationally feasible method for estimating this distribution.
Having worked through the complex procedures and sets of steps for administering the NSLP and SBP programs under traditional and special provisions for reimbursement, one can see the potential advantages of an approach using existing data that could further reduce the burden on parents and schools and at the same time enable the school meals programs to serve additional students. The remaining chapters describe our technical approach for developing and evaluating methods for estimating the claiming percentages in the Provision 4 reimbursement equation. The next chapter discusses the ACS and other sources of data relevant to our study.


