
5
Divergent Patterns of Smoking Across High-Income Nations
Fred Pampel
Tobacco use in high-income nations is notable in two ways. First, despite intense and in many ways successful public health campaigns, average cigarette use remains stubbornly high. Second, there is considerable diversity in the prevalence and intensity of tobacco use across nations. Given the clear connection between tobacco use and premature death, both characteristics have the potential to affect current and future mortality trajectories.
First, smoking remains high enough to affect mortality for some time to come. In brief review, after rising during the decades before 1970 in most high-income nations, per capita cigarette consumption fell by 9 percent from 1970 to 1990 (World Health Organization, 1997, pp. 15, 23). Since then, public health efforts have moved beyond initial antitobacco policies that relied on public service ads, bans on certain types of advertising, and warning labels on tobacco product packaging. Policies now focus on more stringent restrictions, such as bans on indoor smoking in bars, restaurants, and workplaces; steep increases in tobacco taxes and cigarette prices; and strict enforcement of limits on sales to minors and tobacco company promotions (Davis et al., 2007; Eriksen and Cerak, 2008).
Smoking prevalence in the new policy environment has continued to decline in the United States (Rock et al., 2007), and the drop from 44.1 for men and 31.5 for women in 1970 (U.S. Department of Health and Human Services, 2001, p. 36) to 23.1 for men and 18.3 for women in 2008 (Dube et al., 2009) represents a major public health accomplishment (Warner, 2005). At the same time, however, the rate of decline has slowed over the past decade in the United States (Mendez and Warner, 2004); the most recent figures even show a small increase in prevalence (19.8 to 20.6 percent) from
2007 to 2008 (Dube et al., 2009). More generally, cigarette use persists at frustratingly high levels in all high-income nations. Using figures circa 2000, the Tobacco Atlas (Mackay, Eriksen, and Shafey, 2006) reports that about 35 percent of men and 22 percent of women in developed nations smoke; Cutler and Glaeser (2006) report that in 17 European nations an average of 30 percent smoke.
The persistence of smoking relates closely to socioeconomic status (SES) differences in health behaviors. The decline in smoking has proceeded fastest among high-SES groups, leaving disadvantaged groups as the primary users of cigarettes (Pampel, 2005). Of the components of SES, education proves a stronger predictor of smoking than occupation or income, although higher levels of all three are associated with lower smoking (Barbeau, Krieger, and Soobader, 2004; Huisman, Kunst, and Mackenbach, 2005a). For example, analysis of the 2006 U.S. National Health Interview Survey shows that odds ratios of smoking equal 3.7 for high school dropouts relative to college graduates, 2.2 for laborers and farmers relative to professionals and managers, and 2.6 for the lowest income quartile relative to the highest income quartile. Rock et al. (2007) report that 43.5 percent of those with 9 to 11 years of education smoke, compared with 10.0 percent of those with an undergraduate degree and 7.3 percent of those with a graduate degree. Even among the most educated, the low rates still translate into millions of smokers. Among the less educated, the problem is considerably worse and has led to government efforts in the United States to focus on eliminating SES disparities in smoking (Fagan et al., 2004).1
Second, high-income nations show considerable diversity around the average. Despite similarly high levels of economic development compared with the rest of the world and educated populations largely familiar with the harm of tobacco, the high-income nations of Western Europe plus Australia, Canada, Japan, New Zealand, and the United States differ in the prevalence and intensity of use. For example, according to figures from Cutler and Glaeser (2006) for the European Union, smoking rates range from 19 and 21 percent in Sweden and Portugal, respectively, to 34 percent in Spain, 35 percent in Germany, and 38 percent in Greece. The Tobacco Atlas (Mackay et al., 2006) reports smoking percentages of 17 percent in Sweden, 20 percent in Portugal, 32 percent in Germany, 32 percent in Spain, and 38 percent in Greece. That is, smoking is at least twice as common in some
nations as in others. And the levels do not vary simply by region. Sweden and Portugal are similarly low, whereas Germany and Spain are similarly high. English-speaking nations outside Europe have relatively low smoking rates (22 and 20 percent in the United States and Canada, respectively).
Gender complicates the picture. According to the Tobacco Atlas, the gap in male prevalence between Sweden (17 percent) and Greece (47 percent) reaches 30 percent; that between Sweden and Germany (37 percent) reaches 20 percent. For women, the gaps are smaller but still substantial. Lower levels of 10 percent in Portugal and 18 percent in Sweden contrast with higher levels of 28 percent in Germany, 28 percent in the Netherlands, and 29 percent in Greece. The United States shows similar prevalence among men (24 percent) and women (19 percent), whereas Japan has a huge gap between men (47 percent) and women (14 percent).
Differences in smoking between the United States and European nations generate particular interest. Throughout the 1950s, the United States had higher levels of cigarette consumption than other countries (Forey et al., 2002), perhaps because it was a major source of tobacco leaf, the location of many large tobacco companies, and the source of innovative and misleading advertising about the safety of smoking (Brandt, 2007). In more recent years, however, smoking among Americans has dropped faster than in Europe, particularly among men. Cutler and Glaeser (2006) highlight this change in their paper “Why Do Europeans Smoke More Than Americans?” As discussed below, their answer to the question—differences in beliefs about the harm of smoking—offers one of several explanations for country differences.
The addictive attractions of nicotine and widespread access to cigarettes certainly play a role in the persistence across countries. But for insight into the national differences, other factors relating to government policies, social patterns of smoking, beliefs, and the timing of adoption need to be considered. The next sections review explanations of the cross-national patterns of smoking and then examine variation in smoking prevalence among high-income nations.
AN EPIDEMIC OR DIFFUSION MODEL OF NATIONAL DIFFERENCES
Epidemiologists note that population changes in smoking take a form analogous to an epidemic that spreads from relatively small parts of a population to other parts and then eventually recedes (Lopez, 1995; Lopez, Collishaw, and Piha, 1994; Mackenbach, 2006). More than changes in level, the epidemic involves a diffusion process that changes the socioeconomic composition of the smoking population. In the early stages, smoking emerges first among high-SES groups, who are most open to innovations
and have the resources to adopt them (Rogers, 2003). During the middle stages, smoking diffuses to the rest of the population but begins to decline among high-SES persons, who become concerned with health, fitness, and the harm of smoking and who separate themselves from other groups by rejecting smoking and other unhealthy lifestyles (Link, 2008). Like smoking decades earlier, the adoption of healthy lifestyles is itself an innovation that emerges after the spread of the epidemic and relates closely to SES (Pampel, 2005). In the later stages of the epidemic, smoking falls among all groups, but disparities widen as the decline occurs faster among high- than among low-SES groups.
Gender also plays a role: the diffusion process among women typically lags a few decades behind that among men (Lopez, 1995; U.S. Department of Health and Human Services, 2001, p. 135). Since men adopt cigarettes first, the earliest stage of the epidemic shows a rising gap between men and women. In the middle stage, smoking among men levels off while it rises more quickly among women (particularly young and high-status women), and the gap stops growing. In later stages, smoking declines faster among men than women, and the gap narrows. With women adopting smoking later, educational disparities in smoking tend to emerge less strongly than for men; among older women in particular, high-SES rather than low-SES groups tend to smoke (Pampel, 2001).
These status-based processes of change in cigarette smoking should produce diverse experiences and patterns across nations (Giskes et al., 2005; Huisman, Kunst, and Mackenbach, 2005b; Schaap et al., 2008). Nations that began the epidemic earlier and have had more time for smoking to diffuse through the population and recede should have lower smoking than nations that began the epidemic later. Furthermore, nations that began the epidemic earlier should show stronger SES disparities in smoking among men, as the diffusion process has had more time for low-SES groups to adopt smoking and high-SES groups to stop smoking. Because of the female lag in adoption, however, the patterns may be less clear among women.
Since smoking begins by adulthood for the vast majority of smokers, attitudes and behaviors at the time of a cohort’s adolescence will shape later patterns of smoking (Preston and Wang, 2006; U.S. Department of Health and Human Services, 2001, p. 453). Older groups that entered adolescence during periods of growing cigarette use decades ago will reflect patterns at earlier stages of diffusion. High-SES groups should show relatively high rates of smoking, and SES disparities should be modest. Among younger age groups that entered adolescence during periods of declining cigarette use and later stages of diffusion, the predictions about levels and SES disparities should be stronger. Lower SES groups should show substantially higher rates of smoking, and SES disparities should be greater. Again, however, because the diffusion process began later and has proceeded less
far for women, the size of SES disparities in smoking should prove smaller for women than for men.
Why did some nations start the epidemic earlier than others? Many culturally and historically specific circumstances affect the timing, but national income probably plays a role (Cutler and Glaeser, 2006; Pampel, 2007). Historically high levels of national income should foster early adoption and the spread of smoking because more people can afford tobacco. However, as national income further increases, another mechanism tends to lower smoking, particularly among high-SES groups. The growing longevity that accompanies economic growth makes the health costs of smoking greater and more obvious, and the costs come to outweigh any benefits. Thus, if historically high national income predicts the early start of the epidemic, it also predicts the early retreat of the epidemic in later decades. This prediction holds particularly for high-SES groups, who benefit most from health advances and greater longevity (Becker and Murphy, 1988; Cutler and Lleras-Muney, 2008; Murphy and Topel, 2006). For lower SES groups, the risks of premature mortality from causes other than smoking may limit the perceived harm of smoking (Lawlor et al., 2003). In short, historical economic conditions relate to the timing of adoption and current national differences in smoking.
Other explanations of differences across nations offer alternatives to the diffusion arguments:
-
Prices: higher prices due largely to taxes may increase costs and reduce levels of smoking overall (Gallus et al., 2006), but particularly among economically disadvantaged groups (Farrelly and Bray, 1998; Levy, Mumford, and Compton, 2006; Townsend, 1987; Warner, 2000). Thomas et al. (2008, p. 234) conclude from a comprehensive review that “the balance of econometric evidence suggests that increasing the price of tobacco is more effective in reducing smoking in lower-income adults and those in manual occupations.”
-
Government regulations: by reducing opportunities to smoke and emphasizing the dangers of the habit, bans on smoking in public places may reduce prevalence, again particularly among low-SES service and factory workers most affected by the bans (Farrelly, Evans, and Sfekas, 1999; Moskowitz, Lin, and Hudes, 2000; Sorenson et al., 2004).
-
Inequality: low inequality moderates relative deprivation and associated stress among low-SES groups and reduces the dependence on smoking as a way to cope with disadvantaged circumstances (Wilkinson, 1996).
-
Beliefs: acceptance of evidence that smoking causes harm and beliefs about dangers of smoking reduce prevalence (Cutler and Glaeser, 2006).
Cross-national evidence for these arguments is thin, but micro-level or withinnation evidence suggests their potential influence at the macro level.
NATIONAL DIFFERENCES IN TOBACCO USE
The second edition and web update of International Smoking Statistics (ISS) (Forey et al., 2002, 2009) provide the most complete source of data on smoking across the high-income nations. The second edition compiles reported smoking prevalence from surveys done through 1995 in each of 21 nations. The web update includes figures through 2005, but for only half of the countries thus far. To maximize the number of countries with data, the analysis examines male and female smoking prevalence for the years from 1950 to 1995. Because the harm of smoking accumulates over several decades, data ending in 1995 can still help to explain current levels of mortality (and can be supplemented later with more recent figures available from other sources). Data before 1950 exist for too few nations to include in the analysis.
The ISS reports the percentage of current smokers among adult men and women but not the percentage of former or never smokers. Since quitting reduces mortality, the greater risks of death among current smokers make current prevalence a valuable measure. However, it is also true that grouping former and never smokers together misses information, as former smokers have higher mortality than never smokers. The ISS also reports the kind of question used in the survey. Questions varyingly refer to all tobacco products, manufactured cigarettes, total cigarettes, unspecified tobacco products, and unspecified cigarettes. Questions may also refer to all smoking, regular smoking, and unspecified smoking. Dummy variables created for each set of categories adjust for varying levels of smoking generated by different questions.
A pooled regression of nations and time points of the percentage male and percentage female smokers uses several determinants: 20 dummy variables for nation (United States omitted), 45 dummy variables for year (1995 omitted), 4 product dummy variables (the total cigarettes category omitted), and 2 frequency dummy variables (the all-smoking category omitted). The controls for year adjust for differences across nations in the number and timing of available surveys, and the controls for product and frequency adjust for the type of questions asked. The controls for year are needed in particular for the unbalanced structure of the pooled data. Although some nations have many more data points than others, the year dummy variables control for this imbalance by adjusting for the average trend (i.e., the level of smoking at each time point).
Table 5-1, which is based on this regression model, lists the adjusted smoking prevalence for each nation in two forms: first as a deviation from
the omitted value for the United States and then as a percentage for all cigarettes and all smoking. For men, Australia, Finland, Sweden, and the United States have the lowest smoking rates, and Greece, Japan, and Spain have the highest ones. It is notable that, when percentages are averaged across all years, the United States has lower smoking than nearly all European nations. The patterns in the next columns, for female smoking, show quite different orderings. Women in Austria, Finland, Japan, and Portugal have the lowest smoking rates, and women in Denmark, Ireland, the Netherlands, and the United Kingdom have the highest ones. With a correlation across nations for men and women equaling −.23, the rankings by gender tend to be reversed. Those nations with low male smoking tend to have high female smoking (e.g., Sweden, United States), and those with high male smoking tend to have low female smoking (e.g., Japan, Portugal).
For purposes of calibrating the effect of smoking on mortality, however, prevalence measures alone may be misleading, as they do not reflect the intensity of smoking. Figures on cigarette consumption (number per year per adult) combine both the number of smokers and the number of cigarettes per smoker but do not separate smoking of men and women or count cigarettes smuggled or brought in from other countries. The columns listing mean cigarette consumption by nation again average figures for each nation from 1950 to 1995, both as deviations from the United States and as adjusted means. The low consumption in Finland, Portugal, and Sweden also shows in low prevalence, and the United Kingdom and the Netherlands are high on both consumption and prevalence measures. Yet several countries show large differences, and the correlation for all countries of cigarette consumption with the average of male and female prevalence equals only .39. Despite low to medium levels of prevalence, Australia, Canada, and the United States show high consumption. Conversely, Denmark, Norway, and Spain have medium to high prevalence but lower consumption.
One interpretation of the discrepancy is that some nations have relatively few smokers who consume many cigarettes per day, while others have more smokers who consume relatively few cigarettes per day. Alternatively, measurement error may greatly bias one of the measures. One way to check on their validity is to examine the relationships of the prevalence and consumption measures with lung cancer. The fact that about 87 percent of lung cancer deaths in the United States (Satcher, Thompson, and Kaplan, 2002) occur among smokers suggests that lung cancer rates can serve as a valid indicator of smoking. The more effective measure should better predict later mortality from a cause closely associated with smoking. The last columns of Table 5-1 present, for each nation, the age-standardized lung cancer rates for men and women in 2000, calculated from the World Health Organiza-
TABLE 5-1 Average Smoking Measures for Males and Females Among 21 High-Income Nations, 1950-1995
|
Nation |
N Data Points |
Male Prevalencea |
Female Prevalencea |
Cigarettes Sold per Adult |
Lung Cancer Mortality (Age Standardized) |
||||
|
Difference vs. U.S. |
Adjusted Mean |
Difference vs. U.S. |
Adjusted Mean |
Difference vs. U.S. |
Adjusted Mean |
Male |
Female |
||
|
Australia |
41 |
0.2 |
36.8 |
−0.3 |
26.7 |
−10.0** |
78.3 |
103.4 |
51.8 |
|
Austria |
20 |
2.7 |
39.3 |
−9.5*** |
17.5 |
−35.0*** |
53.3 |
114.2 |
39.9 |
|
Belgium |
42 |
8.2*** |
44.8 |
−4.8*** |
22.2 |
−21.7*** |
66.6 |
213.2 |
35.6 |
|
Canada |
74 |
4.2** |
40.8 |
2.7** |
29.7 |
−4.2 |
84.1 |
137.7 |
86.6 |
|
Denmark |
119 |
7.3*** |
43.9 |
12.3*** |
39.3 |
−36.7*** |
51.6 |
140.4 |
93.6 |
|
Finland |
86 |
−2.8** |
33.8 |
−10.6*** |
16.5 |
−44.5*** |
43.8 |
110.4 |
29.1 |
|
France |
88 |
10.5*** |
47.1 |
−2.0** |
25.0 |
−36.3*** |
52.0 |
134.6 |
24.2 |
|
Germany |
93 |
6.4*** |
43.0 |
−4.8*** |
22.3 |
−31.8*** |
56.5 |
129.9 |
36.7 |
|
Greece |
22 |
21.1*** |
57.7 |
−4.8*** |
22.2 |
−22.5*** |
65.8 |
150.3 |
27.8 |
|
Ireland |
39 |
6.2*** |
42.8 |
6.0*** |
33.1 |
−13.1*** |
75.2 |
125.5 |
72.7 |
|
Italy |
36 |
8.4*** |
45.0 |
−5.6*** |
21.4 |
−41.8*** |
46.5 |
149.4 |
31.7 |
|
Japan |
47 |
28.2*** |
64.8 |
−14.8*** |
12.2 |
−17.0*** |
71.4 |
104.6 |
36.2 |
|
Netherlands |
75 |
10.6*** |
47.2 |
7.4*** |
34.4 |
−14.0*** |
74.3 |
166.3 |
52.9 |
|
New Zealand |
19 |
4.0** |
40.6 |
5.6*** |
32.7 |
−18.8*** |
69.6 |
102.7 |
63.0 |
|
Norway |
85 |
3.0** |
39.6 |
5.0*** |
32.0 |
−45.0*** |
43.3 |
95.1 |
52.6 |
|
Portugal |
26 |
5.1** |
41.7 |
−18.2*** |
8.8 |
−44.2*** |
44.1 |
85.1 |
17.4 |
|
Spain |
30 |
16.3*** |
52.9 |
−6.0*** |
21.1 |
−30.6*** |
57.7 |
140.2 |
15.8 |
|
Sweden |
80 |
−5.1*** |
31.5 |
0.7 |
27.8 |
−49.3*** |
39.0 |
65.7 |
43.9 |
|
Switzerland |
27 |
2.6 |
39.2 |
−1.2 |
25.8 |
−17.6*** |
70.7 |
107.6 |
36.6 |
|
United Kingdom |
99 |
8.7*** |
45.3 |
9.4*** |
36.4 |
−16.1*** |
72.2 |
128.6 |
74.7 |
|
United States |
35 |
0.0 |
36.6 |
0.0 |
27.0 |
0.0 |
88.3 |
147.7 |
95.1 |
|
aControlling for year, product type, and frequency. *p < .05, **p < .01, ***p < .001 (compared to value for United States). SOURCE: Author’s calculations from International Smoking Statistics and World Health Organization mortality database. |
|||||||||
tion database (2009).2 Sweden has the lowest lung cancer rate among men, and Belgium the highest. Spain and Portugal have the lowest rate among women, and the United States and Denmark have the highest.
To summarize the relationships, the top rows of Table 5-2 list the correlations between the measures of smoking and the age-standardized lung cancer rates. The correlations of the male lung cancer rate with male prevalence and cigarette consumption equal only .275 and .365. However, one outlying case greatly affects the male correlations. Japan has average male smoking of 65 percent, by far the highest, but is sixth lowest on lung cancer. This oddity attenuates the relationship. The same correlations with Japan omitted equal .506 and .398. For women, who are not affected strongly by outliers, the correlations of the female lung cancer rate with female prevalence and cigarette consumption equal .719 and .541. The correlations are higher for women than men, but both genders show the usefulness of prevalence.3 Still, the correlations are small given the strong relationship between smoking and lung cancer at the individual level. The crude measures of prevalence miss much about former smoking, years smoked, intensity of inhalation, and exposure to fumes that weakens the observed aggregate relationships between smoking and lung cancer.
NATIONAL DIFFERENCES IN TRENDS
Along with average levels across nations, differences in the rate of decline in smoking may influence current levels of smoking-related mortality. In describing the trends, it helps to focus on the last 25 years, from 1970 to 1995, when all the nations have complete data. With sparser data before 1970, nations have different starting points for the trends and comparisons become biased. For the shorter time period, regressions of male and female prevalence on a year quadratic with controls for nation, product type, and frequency measures show a nearly linear downward trend in prevalence for both men and women (see Figure 5-1).4 Prevalence decreases on average by 9.0 percentage points per decade among men and 2.3 percentage points per decade among women. Male smoking still exceeds female smoking prevalence, but the greater rate of decline among men leads to converging levels. Adjusted for controls, levels in 1970 of 57.8 and 31.9 for men and women fall to 34.9 and 26.1 in 1995. The decline in cigarette consumption differs
TABLE 5-2 Relationships of 2000 Age Standardized Lung Cancer Mortality Rates with Measures of Smoking Prevalence, Cigarette Consumption, and Change
|
Level Measures Bivariate Correlations |
Male Lung Cancer Rate |
Female Lung Cancer Rate |
||||
|
All Nations |
No Japan |
All Nations |
No Japan |
All Nations |
||
|
Male Prevalence |
0.275 |
0.506* |
|
|
|
|
|
Female Prevalence |
|
|
|
|
0.719* |
|
|
Cigarette Consumption |
|
|
0.365 |
0.398 |
|
0.541* |
|
Level and Change Multivariate Standardized |
Male Lung Cancer Rate |
Female Lung Cancer Rate |
||||
|
All Nations |
No Japan |
All Nations |
No Japan |
All Nations |
||
|
Male Prevalence |
0.269 |
0.495* |
|
|
|
|
|
Male Change |
−0.184 |
−0.156 |
|
|
|
|
|
Female Prevalence |
|
|
|
|
0.513* |
|
|
Female Change |
|
|
|
|
−0.330 |
|
|
Cigarette Consumption |
|
|
0.499 |
0.667* |
|
0.214 |
|
Cig. Consumption Change |
|
|
0.224 |
0.405 |
|
−0.547* |
|
N |
21 |
20 |
21 |
20 |
21 |
21 |
|
*p < .05. SOURCE: Author’s calculations from International Smoking Statistics and World Health Organization mortality database. |
||||||
only slightly from the decline in prevalence. As also graphed in Figure 5-1, it shows some increase in the early 1970s before a nearly linear decline to a 1995 level of 44.2 cigarettes per adult per year.
Nations vary significantly in the extent of the downward trend, but the rate of change has limited influence on the age-standardized lung cancer rates in 2000. Table 5-2 examines simple regressions of the lung cancer rates on both the average prevalence and the average rate of change to compare the effects of level and trend in smoking. For men, prevalence has a larger net effect on lung cancer than does the trend (particularly with Japan omitted). The effect of trend is small and negative. For women, the same pattern emerges: prevalence has a positive effect, but trend has a negative effect. Obviously, there is spuriousness here. That those countries with the greatest drop have the highest lung cancer suggests that the drop occurs at later stages of the epidemic, after mortality has peaked. This pattern shows in cigarette consumption as well. The level of consumption has stronger
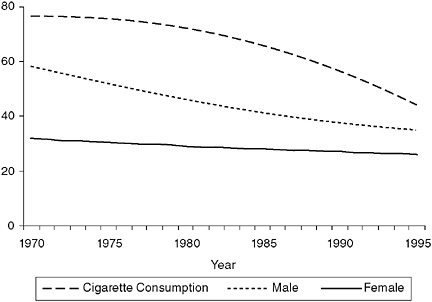
FIGURE 5-1 Adjusted trends in male prevalence (%), female prevalence (%), and cigarette consumption (number per adult).
SOURCE: Author’s calculations from International Smoking Statistics (Forey et al., 2002).
effects, while the trend has mixed effects, positive for men and negative for women. Although none of the measures of smoking prove ideal in predicting subsequent mortality, the prevalence measures work well and distinguish between male and female smoking. The next step is to explain national patterns in these measures.
SOURCES OF NATIONAL DIFFERENCES: AGGREGATE CORRELATIONS
According to the epidemic or diffusion model, greater national income and a later stage of diffusion should lead to lower prevalence and greater decline of smoking. A simple test of these claims is to correlate past characteristics with subsequent patterns of smoking. I use two measures to predict smoking prevalence during the 1970 to 1995 period. First, gross domestic product (GDP) per capita in 1950 (20 years before the first year of the smoking data and 45 years before the last year) measures the resources available for an early start to the epidemic. An early start to the epidemic should lead in subsequent decades to a decline in smoking among men and an increase among women, while a later start should lead to high levels among men and low levels among women. Thus, nations with high income earlier in the 20th century will have lower smoking and greater decline among men but higher
smoking and a smaller decline among women. Second, a measure of cigarette consumption per capita in 1950 also reflects the stage of diffusion. Nations with high consumption earlier in the century will have advanced farther in the rising part of the epidemic and therefore will have lower prevalence and a greater drop in more recent years for men but not for women. These diffusion-based predictions run counter to a null hypothesis of persistence in relative position—that nations with the highest past smoking will have the highest levels today.
The correlations of the 1950 variables with the average prevalence for 1970 to 1995 fit the diffusion predictions (see Table 5-3). Measures of the stage of the epidemic are correlated negatively with male prevalence and positively with female prevalence. For men, nations with high GDP and cigarette consumption early on have low smoking later on; for women, whose smoking follows that of men after a lag, high GDP and cigarette consumption in the past lead later to high smoking among women and gender convergence in smoking. Conversely, low GDP and cigarette consumption in the past and a late start to the epidemic lead to high male smoking and low female smoking.
For changes over time, the results are less clear but still revealing (bottom panel of Table 5-3). For men, the stage of diffusion appears to have little influence, perhaps because all nations have advanced far enough for male smoking to fall from previous levels. For women, however, the correlations
TABLE 5-3 Correlations of Smoking Level and Trend Measures with Gross Domestic Product (GDP) and Cigarette Consumption in 1950
|
|
Prevalence |
Cig. Cons. |
GDP 1950 |
ln GDP 1950 |
Cig. Cons. 1950 |
|
|
|
Male |
Female |
||||
|
Male Prevalence |
1.00 |
|
|
|
|
|
|
Female Prevalence |
−0.17 |
1.00 |
|
|
|
|
|
Cig. Cons. |
0.04 |
0.31 |
1.00 |
|
|
|
|
GDP 1950 |
−0.57** |
0.62** |
0.42* |
1.00 |
|
|
|
ln GDP 1950 |
−0.58** |
0.68*** |
0.35 |
0.98*** |
1.00 |
|
|
Cig. Cons. 1950 |
−0.35 |
0.41 |
0.79*** |
0.56** |
0.53* |
1.00 |
|
|
Trend |
Cig. Cons. Trend |
GDP 1950 |
ln GDP 1950 |
Cig. Cons. 1950 |
|
|
|
Male |
Female |
||||
|
Male Trend |
1.00 |
|
|
|
|
|
|
Female Trend |
0.57** |
1.00 |
|
|
|
|
|
Cig. Cons. Trend |
0.23 |
0.75*** |
1.00 |
|
|
|
|
GDP 1950 |
−0.09 |
−0.68*** |
−0.69*** |
1.00 |
|
|
|
ln GDP 1950 |
−0.13 |
−0.70*** |
−0.72*** |
0.98*** |
1.00 |
|
|
Cig. Cons. 1950 |
−0.03 |
−0.51* |
−0.76*** |
0.56** |
0.53* |
1.00 |
|
*p < .05, **p < .01, ***p < .001. SOURCE: Author’s calculations from International Smoking Statistics. |
||||||
between stage of diffusion and trend are negative. This means that nations farther along in the epidemic earlier in the century show greater drops in female smoking. That these nations on average have both higher prevalence and a greater drop again fits the predictions. Late-stage nations have given women more time to reach higher levels of smoking and begin to decline. For early-stage nations, smoking among women has neither reached the higher levels of late-stage nations nor declined much.
What else might explain the historical differences? It’s not apparent that historical differences across nations in government regulation of business or welfare support of the population can explain the differences. Both free-market nations like the United States and social democratic nations like Sweden have low male smoking, while egalitarian nations like the Netherlands and inegalitarian nations like Greece have high smoking. The economic and political environments of individual nations certainly affect smoking, but not in ways that easily account for the patterns. Thus far, the results seem to support the diffusion hypothesis.
SOURCES OF NATIONAL DIFFERENCES: INDIVIDUAL DATA
Eurobarometer 2006
Even were updated figures on men and women for more recent years available from International Smoking Statistics, other sources of data that distinguish smoking by SES are needed to fully test the arguments. The various theories of national differences make competing predictions about SES disparities in smoking as well as levels of smoking. To move beyond aggregate data and test the SES predictions, I examine a recent data source with individual-level data on smoking. The Eurobarometer (EB) 66.2 survey, done in October-November 2006, asks about sociodemographic characteristics and smoking of nationally representative samples in 31 nations (or national regions, such as Northern Ireland and East Germany) that belong to or are being considered for membership in the European Union (International Data Resource Center, 2006). Along with the high-income Western European nations, the survey includes many former Communist nations, Malta, the Republic of Cyprus, and the Turkish Cypriot Community. The surveys use multistage probability samples of typically 1,000 respondents (but fewer for small nations like Luxembourg and national regions like Northern Ireland). I focus on adults ages 26 to 64. Younger persons have not had time to complete school and establish a position in the socioeconomic hierarchy, and older persons may be sufficiently affected by smoking-related mortality as to attenuate the disparities. Annex A provides additional details about the Eurobarometer measures.
With questions on whether each individual currently smokes or formerly smoked, the survey allows for comparisons across countries of the level of
smoking not only among men and women but also among low- and high-SES groups. The diffusion theory predicts that nations at later stages should have lower levels of male smoking and higher levels of female smoking, but it also makes predictions about the distribution of smoking. Nations at later stages should show larger SES disparities in smoking, particularly among men and less so for women. Other arguments predict that taxes and regulations will lower smoking. Although specifying different causes of low rates of smoking, the two groups of arguments predict similarly low rates of smoking among the same set of mostly northern nations with a long history of smoking and strong antitobacco policies. However, the tax and regulation arguments differ from the diffusion arguments in regard to SES disparities in smoking. Advocates say that higher taxes and greater restrictions affect low-SES groups most attuned to prices, least influenced by scientific information, and more focused on current health than future health. Nations with these policies should show smaller rather than larger SES disparities in smoking.
National Differences
Table 5-4 first presents the percentage of male and female smokers ages 25-64 for each nation from the Eurobarometer. The addition of the many Eastern and Southern European nations to the 21 studied previously affirms points about levels and variation in smoking. First, smoking prevalence in 2006—after decades of knowledge about the harm of smoking and more recent changes in policies to restrict smoking and make it more expensive—remains high. The mean levels equal 40.6 percent for men and 28.5 percent for women. Cyprus, Hungary, Latvia, Lithuania, and Romania contribute to the high mean for men. But figures show that 40.1 percent of men smoke in West Germany, 40.9 percent in Italy, 45.5 percent in Spain, and 59.1 percent in Greece. Only in Sweden does the level fall below 20 percent. Female smoking is lower than for men, but in many countries more than one-third of women smoke (Bulgaria, Great Britain, Greece, Hungary, Northern Ireland, Poland, and Spain). Nations with the lowest female smoking rates, such as Latvia, Malta, and Portugal, are probably on the upswing in adoption rather than the downswing of rejection.
The range in smoking rates is large as well. For men, it goes from 14.0 percent in Sweden to 59.1 percent in Greece. For women, it goes from 17.2 percent in Portugal to 40.7 percent in Greece. On average, men are 47 percent more likely to smoke than women, but again there is much variation. Men are 41 percent less likely to smoke than women in Sweden but 180 percent more likely in Latvia.5
TABLE 5-4 Percentage Current Smokers and Ratios for Men to Women and for Low- to High-Education Groups by Country: Eurobarometer 2006 (ages 25-64)
|
Country |
Gender |
Male Education |
Female Education |
||||||
|
Male |
Female |
Ratio |
Lowa |
Highb |
Ratio |
Lowa |
Highb |
Ratio |
|
|
Sweden |
14.0 |
23.6 |
0.59 |
12.6 |
14.1 |
0.90 |
44.2 |
20.0 |
2.21 |
|
Netherlands |
26.6 |
28.1 |
0.95 |
32.1 |
24.8 |
1.30 |
33.2 |
23.3 |
1.42 |
|
Slovenia |
27.2 |
25.3 |
1.07 |
22.9 |
27.5 |
0.83 |
23.6 |
22.1 |
1.07 |
|
Luxembourg |
29.0 |
25.8 |
1.12 |
33.4 |
16.9 |
1.98 |
21.6 |
18.0 |
1.20 |
|
Belgium |
29.7 |
24.8 |
1.20 |
29.0 |
29.1 |
0.99 |
18.6 |
18.3 |
1.02 |
|
Ireland |
31.6 |
31.3 |
1.01 |
50.0 |
16.7 |
3.00 |
54.5 |
19.4 |
2.81 |
|
Finland |
31.7 |
23.9 |
1.33 |
55.0 |
28.0 |
1.97 |
40.0 |
19.4 |
2.06 |
|
Malta |
31.8 |
21.6 |
1.47 |
38.0 |
21.0 |
1.81 |
15.8 |
16.3 |
0.97 |
|
Denmark |
36.0 |
31.0 |
1.16 |
47.1 |
34.5 |
1.37 |
51.7 |
28.9 |
1.79 |
|
Slovakia |
36.6 |
23.2 |
1.58 |
49.3 |
27.4 |
1.79 |
26.3 |
18.5 |
1.42 |
|
Northern Ireland |
37.3 |
37.9 |
0.98 |
42.1 |
13.3 |
3.16 |
51.7 |
13.0 |
3.98 |
|
Germany East |
37.8 |
31.0 |
1.22 |
27.9 |
22.2 |
1.26 |
54.6 |
15.8 |
3.46 |
|
Great Britain |
37.8 |
35.5 |
1.07 |
52.6 |
25.5 |
2.06 |
46.9 |
18.8 |
2.49 |
|
France |
38.8 |
29.2 |
1.33 |
49.2 |
35.2 |
1.40 |
21.0 |
24.0 |
0.87 |
|
Portugal |
38.8 |
17.2 |
2.25 |
42.1 |
30.0 |
1.40 |
11.5 |
13.6 |
0.85 |
|
Germany West |
40.1 |
30.5 |
1.32 |
56.4 |
29.2 |
1.93 |
27.8 |
21.9 |
1.27 |
|
Czech Republic |
40.5 |
25.9 |
1.56 |
100.0 |
35.6 |
2.81 |
41.6 |
23.5 |
1.77 |
|
Italy |
40.9 |
24.1 |
1.69 |
35.9 |
42.7 |
0.84 |
24.9 |
25.8 |
0.97 |
|
Austria |
41.5 |
28.4 |
1.46 |
46.6 |
32.7 |
1.42 |
31.4 |
20.4 |
1.54 |
|
Croatia |
44.0 |
29.8 |
1.48 |
58.0 |
36.3 |
1.60 |
20.5 |
28.2 |
0.73 |
|
Spain |
45.5 |
34.7 |
1.31 |
44.0 |
40.0 |
1.10 |
32.8 |
31.2 |
1.05 |
|
Estonia |
46.0 |
31.9 |
1.44 |
68.5 |
38.5 |
1.78 |
38.5 |
27.3 |
1.41 |
|
Bulgaria |
46.4 |
35.0 |
1.33 |
50.0 |
40.8 |
1.22 |
35.0 |
32.9 |
1.06 |
|
Poland |
47.0 |
36.2 |
1.30 |
66.9 |
38.8 |
1.72 |
37.2 |
33.2 |
1.12 |
|
Romania |
48.7 |
23.8 |
2.04 |
39.8 |
52.5 |
0.76 |
4.7 |
33.2 |
0.14 |
|
Cyprus (TCC) |
51.8 |
27.6 |
1.88 |
51.6 |
48.1 |
1.07 |
21.8 |
26.1 |
0.84 |
|
Hungary |
52.5 |
38.2 |
1.37 |
75.2 |
31.9 |
2.36 |
47.4 |
29.0 |
1.63 |
|
Cyprus (Republic) |
55.9 |
21.8 |
2.56 |
58.4 |
61.8 |
0.94 |
18.7 |
31.3 |
0.60 |
|
Lithuania |
57.2 |
24.0 |
2.38 |
49.5 |
44.4 |
1.12 |
15.4 |
17.7 |
0.87 |
|
Latvia |
57.3 |
20.4 |
2.80 |
63.3 |
47.3 |
1.34 |
32.2 |
14.9 |
2.16 |
|
Greece |
59.1 |
40.7 |
1.45 |
52.5 |
58.9 |
0.89 |
27.3 |
40.3 |
0.68 |
|
Mean |
40.6 |
28.5 |
1.47 |
48.4 |
33.7 |
1.55 |
31.4 |
23.4 |
1.47 |
|
SD |
10.4 |
5.8 |
0.49 |
16.7 |
12.2 |
0.63 |
13.3 |
6.8 |
0.80 |
|
aFinished school before age 15. bFinished school after age 19. SOURCE: Data from Eurobarometer 2006. |
|||||||||
The results by SES reveal additional variation across countries. Table 5-4 lists smoking among those with low education (finished school before age 15) and high education (finished school after age 19) and then lists the ratio. The mean ratio of 1.55 for men indicates higher smoking among low-education groups. The male ratios reach 2.06, 3.00, and 3.16 in Great Britain, Ireland, and Northern Ireland, respectively, but fall below 1.00 in Belgium, Greece, Italy, Cyprus (Republic), Slovenia, Romania, and Sweden. The mean ratio for women is only slightly lower than for men but has a larger standard deviation. Northern Ireland again shows much greater smoking among less educated persons, but several other nations show greater smoking among more educated persons. The ratio equals only 0.14 in Romania, 0.60 in Cyprus (Republic), and 0.68 in Greece. However, these ratios are not age-adjusted and may confound low education with old age; multivariate, multilevel analysis to follow examines education effects with controls for age and other variables.
Individual-Level Models
To start, consider the individual-level relationships with smoking when averaged across all nations. Using available measures from the Eurobarometer and multilevel estimation from HLM 6.08 (Raudenbush et al., 2004), Table 5-5 presents the logistic regression coefficients relating current smoking to individual measures. Of special interest, education and occupational ranking lower smoking for both men and women, and goods owned lower smoking for men. However, as the variance components show, the effects of these three variables differ significantly across nations, and the negative coefficients may hide substantial diversity in SES effects.
As suggested by diffusion arguments, the negative effects of the SES measures emerge stronger among younger persons than older persons. Without presenting more tables, results from adding interaction terms of age by education, occupation, and goods owned offer some insights. The positive effects of the interaction terms show that as age increases, the negative effects of the SES variables moderate. Thus, younger age groups entering adulthood at later stages of diffusion show stronger SES disparities, whereas older age groups entering adulthood many decades ago during earlier stages of diffusion show weaker SES disparities.
Aggregate Influences
Table 5-6 examines a different set of determinants. It lists effects of several aggregate variables on the nation-specific intercept (or level of smoking at the means for all the individual-level variables) and the nation-specific slopes for education, occupation, and goods owned. The table contains eight
TABLE 5-5 Unstandardized Coefficients and t Statistics from Multilevel Logistic Regression of Current Smoking on Individual Predictors
|
Predictors |
Males |
Females |
||
|
b |
Variance |
b |
Variance |
|
|
t |
Components |
t |
Components |
|
|
Age |
0.107*** |
|
0.098*** |
|
|
|
6.442 |
|
3.916 |
|
|
Age2 |
−0.001*** |
|
−0.001*** |
|
|
|
−7.615 |
|
−4.729 |
|
|
Urban |
0.101* |
|
0.193*** |
|
|
|
2.429 |
|
5.568 |
|
|
Married |
−0.410*** |
|
−0.652*** |
|
|
|
−8.555 |
|
−10.824 |
|
|
Out of School |
0.569 |
|
1.178*** |
|
|
|
1.891 |
|
4.118 |
|
|
Educationa |
−0.060*** |
0.003** |
−0.085*** |
0.010*** |
|
|
−4.069 |
|
−5.381 |
|
|
Reports Job |
0.132 |
|
0.289* |
|
|
|
0.509 |
|
2.511 |
|
|
Occupationb |
−0.053*** |
0.001* |
−0.031** |
0.006*** |
|
|
−5.790 |
|
−2.653 |
|
|
Goods Ownedc |
−1.115*** |
0.439** |
−0.032 |
1.127*** |
|
|
−6.889 |
|
−0.253 |
|
|
Intercept |
−0.442*** |
0.104*** |
−0.988*** |
0.070*** |
|
|
−7.415 |
|
−19.187 |
|
|
N persons |
7643 |
|
10175 |
|
|
N nations |
31 |
|
31 |
|
|
aFor those out of school. bFor those reporting a job. cProportion of nine household items owned. *p < .05, **p < .01, ***p <.001. SOURCE: Data from Eurobarometer 2006. |
||||
TABLE 5-6 Unstandardized Coefficients and t Statistics from Multilevel Logistic Regression of Current Smoking Intercepts and Slopes on Level-2 Predictors
|
Level-2 Predictors |
Level-1 Male Intercept and Slopes as Outcomes |
|||
|
Intercept |
Education |
Occupation |
Goods Owned |
|
|
Logged GDP per Capita |
|
|
|
|
|
b |
−0.115** |
−0.013 |
−0.004 |
−0.020 |
|
t |
−2.555 |
−0.712 |
−0.430 |
−0.112 |
|
Gini Coefficient of Income Inequality |
|
|
|
|
|
b |
0.114* |
0.014 |
0.000 |
0.039 |
|
t |
1.980 |
0.954 |
0.039 |
0.260 |
|
Ex-Communist Nations (=1) |
|
|
|
|
|
b |
0.041 |
−0.012 |
−0.008 |
−0.153 |
|
t |
0.700 |
−0.703 |
−0.933 |
−0.974 |
|
Tobacco Control Scalea |
|
|
|
|
|
b |
−0.115** |
−0.019 |
−0.002 |
−0.386*** |
|
t |
−2.309 |
−1.242 |
−0.165 |
−3.082 |
|
Smoking Ban Scalea |
|
|
|
|
|
b |
−0.114** |
−0.004 |
0.009 |
−0.138 |
|
t |
−2.291 |
−0.287 |
1.006 |
−0.689 |
|
Cigarette Price Scalea |
|
|
|
|
|
b |
−0.045 |
−0.006 |
−0.002 |
−0.215 |
|
t |
−0.879 |
−0.428 |
−0.131 |
−1.792 |
|
Current M/F Ratiob |
|
|
|
|
|
b |
0.177*** |
0.023** |
0.011 |
0.204* |
|
t |
2.909 |
2.767 |
0.964 |
1.950 |
|
Ever M/F Ratiob |
|
|
|
|
|
b |
0.210*** |
0.025** |
0.011 |
0.247** |
|
t |
4.057 |
2.473 |
1.171 |
2.146 |
|
aScales from Joosens and Raw (2006) with values ranging from 26 to 74 for tobacco control, 1 to 21 for smoking ban, and 7 to 30 for cigarette price bPercentage male current or ever smokers as a ratio to percentage female current or ever smokers, with high score indicating early stage of diffusion. *p < .10, **p < .05, ***p < .01. SOURCE: Data from Eurobarometer 2006. |
||||
|
Level-1 Female Intercept and Slopes as Outcomes |
|||
|
Intercept |
Education |
Occupation |
Goods Owned |
|
−0.001 |
−0.044*** |
−0.040*** |
−0.566*** |
|
−0.016 |
−2.966 |
−3.003 |
−3.703 |
|
−0.026 |
0.024 |
0.021 |
0.288 |
|
−0.393 |
1.415 |
1.488 |
1.669 |
|
0.023 |
0.005 |
0.015 |
0.206 |
|
0.437 |
0.294 |
1.038 |
1.103 |
|
0.051 |
−0.043** |
−0.039*** |
−0.725*** |
|
1.281 |
−2.477 |
−3.123 |
−4.225 |
|
−0.046 |
−0.005 |
−0.009 |
−0.142 |
|
−1.152 |
−0.206 |
−0.545 |
−0.583 |
|
0.081** |
−0.026 |
−0.024 |
−0.525** |
|
2.317 |
−1.361 |
−1.691 |
−2.339 |
|
−0.183*** |
0.057*** |
0.048*** |
0.799*** |
|
−3.141 |
4.153 |
4.102 |
4.094 |
|
−0.181*** |
0.065*** |
0.060*** |
0.907*** |
|
−3.311 |
4.136 |
4.491 |
5.361 |
aggregate measures that may relate to the outcomes across the 31 nations or national regions.6
-
GDP per capita in purchase price parities (logged to capture percentage change) measures standard of living in 2004 (from Heston, Summers, and Aten, 2006).
-
The Gini coefficient of inequality relates to the degree of relative deprivation and comes from data originally compiled by Deininger and Squire (1996) and updated by the World Bank (2009).
-
A dummy variable coded 1 for the former Communist nations captures a key source of economic differences in Europe.
-
For tobacco control policies, Joossens and Raw (2006) present a scale that combine separate measures—based on data and ratings provided by experts in each of 30 European countries—of price, bans on smoking in public places, public information campaigns, advertising bans, health warnings, and funding for treatment. I use the full scale and also two of its key components—prices and bans on smoking in public places. The full scale ranges from 26 to 74 (with a potential maximum of 100).
-
The ban scale measures the extent of smoke-free workplaces, cafes and restaurants, and other public places, with complete and enforced bans receiving high scores and legislated but unenforced bans receiving low scores. The scale ranges from 1 (United Kingdom) to 21 (Ireland).
-
The price scale uses data on the price (adjusted for GDP per capita) of Marlboro and the price of cigarettes in the most popular price category. The scale is transformed so that the nation with the most expensive prices gets a score of 30 (United Kingdom) and the nation with the lowest prices gets a score of 7 (Luxembourg).
-
For the stage of diffusion, measures of GDP and cigarette consumption in 1950 are not available for many of the nations. An alternative measure, the smoking prevalence of men relative to the smoking prevalence of women in the 2000s, has been used by Gallus et al. (2006). Since adoption of smoking by women lags behind that of men and moves toward parity only in the later stages of diffusion, a ratio close to 1 indicates a later stage of diffusion and a ratio well above 1 indicates an early stage of diffusion. I use two sources for the male and female smoking rates that go into the ratio measure. First, Gallus et al. (2006) report figures on male and female prevalence in the early 2000s from the Tobacco Control Country Profiles that
-
are gathered independently from the Eurobarometer. Second, I use a measure created from the Eurobarometer survey on ever-smoking prevalence at ages 26-64. Although from the same data set, eversmoking differs from the outcome variable of current smoking and reduces definitional overlap. With either source of prevalence data, the ratio of male to female smoking is an obvious and trivial predictor of the likelihood of smoking among men or women, but it may indicate less obviously how the stage of cigarette diffusion moderates the influence of SES on individual smoking.
To summarize these results briefly, the measures of cigarette diffusion have consistently significant coefficients in the expected direction, but the others do not. The earlier the stage (or the higher the male-to-female ratio), the weaker the effect of education (i.e., the positive effect of an early stage moderates the otherwise negative effect of the SES variables). Conversely, the later the stage (or the lower the male-to-female ratio), the stronger the negative effect of education. Of the 12 interaction coefficients for the diffusion measures, 10 reach significance. Partly consistent with these results are the significant negative effects of GDP for women. The higher income nations, generally those at later stages of diffusion, have stronger female SES disparities in smoking. Otherwise, the Gini coefficient has little influence on the individual coefficients, and ex-Communist nations do not differ from the other nations in the effects of the SES variables.
The results for restrictive tobacco policies show little consistent association. Moreover, the direction of the relationship often is opposite to that expected. The policies are associated with lower smoking for men, but higher smoking for women, and all the significant effects on SES disparities in smoking are negative. That is, restrictive policies are associated with stronger negative effects of SES or with larger rather than smaller disparities. The small number of nations warrants use of simple level-2 models and prevents additional tests of various combinations of variables. Moreover, rigorous tests of the impact of policies require longitudinal data and comparisons of smoking before and after a policy change. Even with these limitations, the results consistently show that the diffusion measures produce the expected effects, whereas the tobacco policy variables do not.
Cutler and Glaeser (2006) offer an alternative explanation based on stronger antitobacco beliefs in the United States compared with Europe. They note that taxes, prices, and regulations fail to explain lower U.S. smoking, as all these tend to be greater in Europe than the United States. However, a higher percentage of survey respondents in the United States than in Europe agree with statements about the harm of smoking for health. To minimize cognitive dissonance bias—smokers rejecting scientific evidence as a way to justify their habit—Cutler and Glaeser examine beliefs among
nonsmokers. For this subset of respondents, data from the 1994 General Social Survey show that 94 percent of Americans agreed that smoking causes cancer, while data from the 1994 Eurobarometer show that an average of 90 percent across 14 Western European nations agreed. Cutler and Glaeser interpret this difference as evidence that stronger American beliefs in the harm of smoking reduce prevalence. The stronger beliefs result from concerted efforts of government and health advocacy groups to publicize the facts. Government decentralization, the prominence of specialized interest groups, and the actions of numerous health advocacy groups contribute to the lower smoking in the United States. As Cutler and Glaeser (2006) say, “While greater U.S. entrepreneurship and economic openness led to more smoking during an earlier era (and still leads to more obesity today), it also led to faster changes in beliefs about smoking and ultimately less cigarette consumption.”
However, beliefs as well as smoking may be associated with the stage of diffusion; the United States is exceptional in regard to its long history of smoking as well as its antismoking beliefs. In a simple test, I correlate the figures on beliefs and smoking from Cutler and Glaeser (2006, Tables 5-1 and 5-4) and the measures of GDP and cigarette consumption from 1950.7 With a sample size of 14 nations, the correlation of beliefs with smoking equals −.19, while the correlations of 1950 GDP and cigarette consumption with smoking equal −.01 and −.27, respectively. That consumption 44 years earlier correlates with smoking at least as well as current beliefs highlights the importance of the long-term diffusion process.8 Moreover, 1950 cigarette consumption has a positive correlation of .20 with beliefs. The truncated sample makes these results only suggestive, but it could be that beliefs change with the stage of the epidemic.
DISCUSSION
The analyses presented in this study, although limited methodologically in many ways, tend to tell a consistent story about national variation in levels, trends, and SES differences of smoking: cigarette smoking is initially adopted by high-SES men, the habit diffuses first to men in other SES groups and later to high-SES women, high-SES men then reject smoking, male and female smoking rates converge, and SES disparities in smoking grow (Mackenbach, 2006). Based on diffusion processes of innovations, class distinction, and imitation and on the balance of costs and
benefits of smoking for SES groups, the pattern of change seems to be similar across countries. What differs is the timing of the start of the epidemic and diffusion process, with early-starting nations having advanced farther in the process than nations starting later. Thus, smoking spread earlier in English-speaking nations and Belgium and the Netherlands than in Southern European nations. A perspective based on diffusion helps answer several questions about differences across nations.
What caused some countries like the United States to have smoked more heavily in the past and dropped more steeply in recent decades than other nations? These nations started the epidemic earlier. This explanation seems to work better than alternatives focusing on policies, inequality, and beliefs. And why did some nations start earlier? One reason is economic—citizens in high-income nations like the United States could afford to start earlier. Results thus show that high GDP in 1950 relates to the early rise in smoking and to subsequent decline. In Southern Europe, later economic development slowed the start of the epidemic. No doubt cultural factors play a role as well. Events unique to the United States, such as the domestic cultivation of the tobacco plant, the invention of the cigarette rolling machine, and the development of innovative advertising to attract smokers, affected the early start of the epidemic here and in English-speaking trading partners. Thus, the seven nations with highest per capita cigarette consumption in 1950 were Australia, Belgium, Canada, Ireland, New Zealand, the United Kingdom, and the United States. Among the lowest were Austria, Germany, Italy, Portugal, and Spain.
What causes convergence in male and female smoking rates in nations like the United States and Sweden but substantially lower smoking among women than men in Southern Europe? Again, this pattern fits the diffusion argument. In nations at later stages, the drop in smoking among men has occurred more quickly than among later adopting women and has produced some convergence (Schaap et al., 2008). The Southern European nations are in the earlier stages of diffusion, so women are just starting to follow men in the adoption of smoking and the gap remains large. A good predictor of current female smoking is the level of male smoking several decades earlier. Nations with high smoking in 1950 have low male smoking today but relatively high female smoking, while nations with low smoking in 1950 have high male smoking today and low female smoking. If the pattern continues, this too will change. Female smoking in nations at later stages will drop, while female smoking in nations at early stages will rise. Several previous studies further suggest that gender equality does little to influence these trends and patterns in female smoking (Pampel, 2001, 2002, 2003).
Why has smoking become much more prevalent among low-SES groups? Common explanations focus on several traits of disadvantaged groups: higher stress, lower health benefits from quitting, orientations toward short-term utility, low efficacy to deal with the difficulties of resisting and quitting, exposure to more advertising, greater opportunities to buy and use cigarettes in poor communities, and lower social and cultural capital. In cross-national comparisons, however, variation in SES effects appears consistent with the diffusion argument. Among nations at later stages of diffusion, early adoption by high-SES groups in the past leads to low current smoking rates and later adoption by low-SES groups leads to higher rates of current smoking—which jointly produce the growing disparities observed in many nations. Among nations at earlier stages of diffusion and among later adopting women, however, the process has proceeded less far and disparities are smaller.
How can government policies speed the process of change toward lower smoking? Government tobacco restrictions are certainly associated with lower prevalence rates; U.S. studies show the benefits of comprehensive antismoking policies (Fiori and Baker, 2009). However, the policies may affect men and high-SES groups most—those already most likely to reject smoking, according to diffusion arguments. For example, despite more than a decade of higher taxes and bans on smoking, SES disparities among native-born whites and blacks in the United States remain just as large today as in 1990 (Pampel, 2009).
In Europe, Finland, Ireland, Italy, Norway, Sweden, and the United Kingdom have the strongest tobacco control policies, and Austria, Denmark, Germany, Greece, Portugal, and Spain, have the weakest. Although Italy is an exception, the former group has consistently lower smoking rates among men than the latter group. However, the Eurobarometer data show little association between restrictive policies and female smoking prevalence or SES disparities in smoking. If anything, tobacco control policies are associated with greater rather than smaller SES disparities. The Eurobarometer data do not allow the kind of test needed to properly evaluate the impact of policies on disparities, but the pattern of results tends to favor the diffusion argument. A study of quit ratios in 18 European countries similarly finds that the least educated smokers benefited no more than highly educated smokers from tobacco control policies (Schaap et al., 2008).
If in the context of cigarette diffusion, policies to raise taxes, ban smoking in public places, and otherwise restrict access to cigarettes all lower the level of smoking but fail to moderate disparities, tobacco reduction efforts may need to more directly target low-SES groups. Such strategies might include worksite-based smoking cessation interventions (Sorensen et al., 2004), education efforts focused more specifically on priority groups with
high risks of smoking (Barbeau et al., 2004), and recognition that techniques of behavior change may differ substantially across SES backgrounds (Frohlich and Potvin, 2008). The same kind of policies may help nations at early stages of the epidemic do more to prevent adoption of smoking by women and low-SES groups who have yet to start smoking in large numbers. Such changes might alter the spread of the epidemic and quicken its passage.
More generally, gains to longevity among low-SES groups may help speed the decline in smoking during the diffusion process. As Cutler and Glaeser (2006) argue, the trend toward adoption of smoking with income growth reverses when the health costs of smoking come to exceed the short-term benefits. High-SES groups reach this reversal point soonest, but reductions in mortality from nonsmoking causes among low-SES groups may foster the rejection of smoking.
What are the limitations of the findings? To qualify claims on behalf of the diffusion argument, the evidence is more illustrative than authoritative. The measures of smoking across nations show inconsistencies, the measures of diffusion are imprecise, and the measures of tobacco control policies cover only the more recent years. Furthermore, analyses comparing a relatively small number of nations have weak statistical power. Additional analyses of the Eurobarometer data by age or cohort groups might give additional insights but would still be limited by the cross-sectional design. The evidence suggests promise rather than confirmation of the diffusion theory’s predictions of variation in smoking across time, nations, and social groups.
One might object on theoretical grounds as well. The mechanisms underlying the regularities of adoption and rejection of smoking by gender and SES seem vague compared with the concrete influences of higher prices, smoking bans, deprivation, and knowledge of the harm of tobacco. Given inadequacies of the cross-national data and measures available for analysis, the chapter neither specifies nor tests for underlying SES-based mechanisms relevant to smoking, A guide to doing so comes from work on diffusion and fertility decline. Casterline (2001) defines diffusion as change in behavior of some that affects the likelihood of change in behavior among others, and he identifies mechanisms of social influence, social learning, social comparison or emulation, social coercion, and social capital through which diffusion operates. Palloni (2001), after arguing that the diffusion-of-innovation theories fail to identify the decision-making processes that give meaning to the underlying mechanisms, further suggests refinements to make the theories more complete. However, similar theoretical development has not occurred with regard to the spread of smoking.
Two types of data would allow better tests of diffusion arguments and evaluation of the ability of policies to speed the process of change toward
smoking reduction. First, at the macro level, over-time survey data on smoking prevalence and national-level changes in policies across nations would allow one to evaluate the effect of policy changes. Without following individuals over time, consecutive cross-sectional data that cover a decade or more and have comparable measures across a large number of nations can better establish causal relations by comparing changes over time as well as differences across nations in policies, diffusion stage, and SES disparities. If the data also identify areas within nations, particularly those with different linguistic, religious, and ethnic compositions, it might give further insight into the social dynamics of diffusion.
Second, more micro-oriented designs can help identify the mechanisms underlying the spread of smoking or smoking cessation. Casterline (2001) identifies the kinds of data needed to test diffusion arguments. The data should be longitudinal, include measures of social exposure to innovations, both informal and formal, and relate perceptions of the attitudes and behaviors of others at time one to outcomes at time two. Some success with this kind of approach comes from the analysis of education-based networks in the Framingham Heart Study by Christakis and Fowler (2008). Studies of teen smoking likewise have focused on the strong influence of peer networks and interpersonal influence on initiation and adoption (see Jacobson et al., 2001, for a review). Comparative studies would likewise benefit from more detailed micro-level measures of diffusion variables.
REFERENCES
Barbeau, E., Krieger, N., and Soobader, M.-J. (2004). Working class matters: Socioeconomic disadvantage, race/ethnicity, gender, and smoking in NHIS 2000. American Journal of Public Health, 94(2), 269-278.
Becker, G.S., and Murphy, K.M. (1988). A theory of rational addiction. Journal of Political Economy, 96(4), 675-700.
Brandt, A.M. (2007). The Cigarette Century: The Rise, Fall, and Deadly Persistence of the Product That Defined America. New York: Basic Books.
Casterline, J.B. (2001). Diffusion processes and fertility transition: Introduction. In National Research Council, Diffusion Processes and Fertility Transition: Selected Perspectives (pp. 1-38). Committee on Population, J.B. Casterline (Ed.) Division of Behavioral and Social Sciences and Education. Washington DC: National Academy Press.
Christakis, N.A., and Fowler, J.H. (2008). The collective dynamics of smoking in a large social network. New England Journal of Medicine, 358(21), 2249-2258.
Cutler, D.M., and Glaeser, E.L. (2006). Why Do Europeans Smoke More Than Americans? National Bureau of Economic Research Working Paper 12124. Available: http://www.nber.org/papers/w12124 [accessed June 2010].
Cutler, D.M., and Lleras-Muney, A. (2008). Education and health: Evaluating theories and evidence. In R.F. Schoeni, J.S. House, G.A. Kaplan, and H. Pollack (Eds.), Making Americans Healthier: Social and Economic Policy as Health Policy (pp. 29-60). New York: Russell Sage Foundation.
Davis, R.M., Wakefield, M., Amos, A., and Gupta, P.C. (2007). The hitchhiker’s guide to tobacco control: A global assessment of harms, remedies, and controversies. Annual Review of Public Health, 28, 171-194.
Deininger, K., and Squire, L. (1996). A new data set measuring income inequality. World Bank Economic Review, 10(3), 565-591.
Dube, S.R., Asman, K., Malarcher, A., and Carabollo, R. (2009). Cigarette smoking among adults and trends in smoking cessation—United States, 2008. Morbidity and Mortality Weekly Report, 58(44), 1227-1232.
Eriksen, M.P., and Cerak, R.L. (2008). The diffusion and impact of clean indoor air laws. Annual Review of Public Health, 29, 171-185.
Fagan, P., King, G., Lawrence, D., Petrucci, S.A., Robinson, R.G., Banks, D., Marable, S., and Grana, R. (2004). Eliminating tobacco-related health disparities: Directions for future research. American Journal of Public Health, 94(2), 211-217.
Farrelly, M.C., and Bray, J. (1998). Response to increases in cigarette prices by race/ethnicity, income, and age groups—United States, 1976-1993. Morbidity and Mortality Weekly Report, 47(29), 605-609.
Farrelly, M.C., Evans, M.N., and Sfekas, A.E. (1999). The impact of workplace smoking bans: Results from a national survey. Tobacco Control, 8(3), 272-277.
Fiori, M.C., and Baker, T.B. (2009). Stealing a march in the 21st century: Accelerating progress in the 100-year war against tobacco addiction in the United States. American Journal of Public Health, 99(7), 1170-1175.
Forey, B., Hamling, J., Lee, P., and Wald, N. (Eds.). (2002). International Smoking Statistics (2nd ed.). Oxford, England: Oxford University Press.
Forey, B., Hamling, J., Hamling, J., and Lee, P. (2009). International Smoking Statistics Web Edition. P.N. Lee Statistics and Computing. Available: http://www.pnlee.co.uk/ISS.htm [accessed June 2010].
Frohlich, K.L., and Potvin, L. (2008). The inequality paradox: The population approach and vulnerable populations. American Journal of Public Health, 98(2), 216-221.
Gallus, S., Schiaffino, A., La Vecchia, C., Townsend, J., and Fernandez, E. (2006). Price and cigarette consumption in Europe. Tobacco Control, 15(2), 114-119.
Giskes, K., Kunst, A.E., Benach, J., Borrell, C., Costa, G., Dahl, E., Dalstra, J.A.A., Federico, B., Helmert, U., Judge, K., Lahelma, E., Moussa, K., Ostergren, P.O., Platt, S., Prattala, R., Rasmussen, N.K., and Mackenbach. J.P. (2005). Trends in smoking behaviour between 1985 and 2000 in nine European countries by education. Journal of Epidemiology and Community Health, 59(5), 395-401.
Heston, A., Summers, R., and Aten, B. (2006). Penn World Table Version 6.2. Center for International Comparisons of Production, Income and Prices at the University of Pennsylvania. Available: http://pwt.econ.upenn.edu/php_site/pwt_index.php [accessed June 2010].
Huisman, M., Kunst, A.E., and Mackenbach, J.P. (2005a). Inequalities in the prevalence of smoking in the European Union: Comparing education and income. Preventive Medicine, 40(6), 756-764.
Huisman, M., Kunst, A.E., and Mackenbach, J.P. (2005b). Educational inequalities in smoking among men and women aged 16 years and older in 11 European countries. Tobacco Control, 14(2), 106-113.
International Data Resource Center. (2006). Eurobarometer 66.2: Nuclear Energy and Safety and Public Health Issues, October-November 2006. Interconsortium for Political and Social Research. Available http://www.icpsr.umich.edu/cocoon/IDRC/STUDY/21460.xml [accessed June 2010].
Jacobson, P.D., Lantz, P., Warner, K., Wasserman, J., Pollack, H., and Ahlstrom, A. (2001). Combating Teen Smoking: Research and Policy Strategies. Ann Arbor: University of Michigan.
Joossens, L., and Raw, M. (2006). The Tobacco Control Scale: A new scale to measure country activity. Tobacco Control, 15(3), 247-253.
Lawlor, D.A., Frankel, S., Shaw, M., Ebrahim, S., and Davey Smith, G. (2003). Smoking and ill health: Does lay epidemiology explain the failure of smoking cessation programs among deprived populations? American Journal of Public Health, 93(2), 266-270.
Levy, D.T., Mumford, E.A., and Compton, C. (2006). Tobacco control policies and smoking in a population of low education women, 1992-2002. Journal of Epidemiology and Community Health, 60(supplement 2), ii20-ii26.
Link, B.G. (2008). Epidemiological sociology and the social shaping of population health. Journal of Health and Social Behavior, 49(4), 367-384.
Lopez, A.D. (1995). The lung cancer epidemic in developed countries. In A.D. Lopez, G. Caselli, and T. Valkonen (Eds.), Adult Mortality in Developed Countries: From Description to Explanation (pp. 111-143). Oxford, England: Clarendon.
Lopez, A.D., Collishaw, N.E., and Piha, T. (1994). A descriptive model of the cigarette epidemic in developed countries. Tobacco Control, 3(3), 242-247.
Mackay, J., Eriksen, M., and Shafey, O. (2006). The Tobacco Atlas, 2nd edition. Geneva, Switzerland: World Health Organization. Available: http://www.cancer.org/docroot/AA/content/AA_2_5_9x_Tobacco_Atlas.asp [accessed June 2010].
Mackenbach, J.P. (2006). Health Inequalities: Europe in Profile. An Independent, Expert Report Commissioned by the UK Presidency of the EU. Rotterdam, Germany: Erasmus University Medical Center.
Mendez, D., and Warner, K.E. (2004). Adult cigarette smoking prevalence: Declining as expected (not as desired). American Journal of Public Health, 94(2), 251-252.
Moskowitz, J.M., Lin, Z., and Hudes, E.S. (2000). The impact of workplace smoking ordinances in California on smoking cessation. American Journal of Public Health, 90(5), 757-761.
Murphy, K.M., and Topel, R.H. (2006). The value of health and longevity. Journal of Political Economy, 114(5), 871-904.
Palloni, A. (2001). Diffusion in sociological analysis. In National Research Council, Diffusion Processes and Fertility Transition: Selected Perspectives (pp. 66-114). Committee on Population, J.B. Casterline (Ed.). Division of Behavioral and Social Sciences and Education. Washington DC: National Academy Press.
Pampel, F.C. (2001). Cigarette diffusion and sex differences in smoking. Journal of Health and Social Behavior, 42(4), 388-404.
Pampel, F.C. (2002). Cigarette use and the narrowing sex differential in mortality. Population and Development Review, 28(1), 77-104.
Pampel, F.C. (2003). Declining sex differences in lung cancer mortality in high income nations. Demography, 40(1), 45-65.
Pampel, F.C. (2005). Diffusion, cohort change, and social patterns of smoking. Social Science Research, 34(1), 117-139.
Pampel, F.C. (2007). National income, inequality, and global patterns of cigarette use. Social Forces, 86(2), 455-466.
Pampel, F.C. (2009). The persistence of educational disparities in smoking. Social Problems, 56(3), 526-542.
Peto, R., Lopez, A.D., Boreham, J., Thun, M., and Heath, C., Jr. (1994). Mortality from Smoking in Developed Countries 1950-2000: Indirect Estimates from National Vital Statistics. Oxford, England: Oxford University Press.
Preston, S.H., and Wang, H. (2006). Sex mortality differences in the United States: The role of cohort smoking patterns. Demography, 43(4), 631-646.
Raudenbush, S., Bryk, A.S., Cheong, Y.F., and Congdon, R. (2004). HLM 6: Hierarchical Linear and Nonlinear Modeling. Chicago: Scientific Software International.
Rock, V.J., Malarcher, A., Kahende, J.W., Asman, K., Husten, C., and Caraballo, R. (2007). Cigarette smoking among adults—United States, 2006. Morbidity and Mortality Weekly Report, 56(44), 1157-1161.
Rogers, E.M. (2003). Diffusion of Innovations. New York: Free Press.
Satcher, D., Thompson, T.G., and Kaplan. J.P. (2002). Women and smoking: A report of the surgeon general. Nicotine and Tobacco Research, 4(1), 7-20.
Schaap, M.M., Kunst, A.E., Leinsalu, M., Regidor, E., Ekholm, O., Dzurova, D., Helmert, U., Klumbiene, J., Santana, P., and Mackenbach, J.P. (2008). Effect of nationwide tobacco control policies on smoking cessation in high and low educated groups in 18 European countries. Tobacco Control, 17(4), 248-255.
Shafey, O., Dolwick, S., and Guindon, G.E. (Eds.). (2003). Tobacco Control Country Profiles, 003. Atlanta: American Cancer Society.
Sorenson, G., Barbeau, E., Hunt, M.K., and Emmons, K. (2004). Reducing social disparities in tobacco use: A social contextual model for reducing tobacco use among blue-collar workers. American Journal of Public Health, 94(2), 230-239.
Thomas, S., Fayter, D., Misso, K., Ogilvie, D., Petticrew, M., Sowden, A., Whitehead, M., and Worthy, G. (2008). Population tobacco control interventions and their effects on social inequalities in smoking: Systematic review. Tobacco Control, 17(4), 230-237.
Townsend, J.L. (1987). Cigarette tax, economic welfare and social class patterns of smoking. Applied Economics, 19(3), 355-365.
U.S. Department of Health and Human Services. (2001). Women and Smoking: A Report of the Surgeon General. Rockville, MD: Author.
Warner, K.E. (2000). The economics of tobacco control: Myths and realities. Tobacco Control, 9(1), 78-89.
Warner, K.E. (2005). Tobacco policy in the United States: Lessons for the obesity epidemic. In D. Mechanic, L.B. Rogut, and D.C. Colby (Eds.), Policy Challenges in Modern Health Care (pp. 99-114). New Brunswick, NJ: Rutgers University Press.
Wilkinson, R.G. (1996). Unhealthy Societies: The Afflictions of Inequality. London, England: Routledge.
World Bank. (2009). Measuring Income Inequality Database: Research at the World Bank. Available: http://go.worldbank.org/UVPO9KSJJ0 [accessed July 2009].
World Health Organization. (1997). Tobacco or Health: A Global Status Report. Geneva, Switzerland: Author.
World Health Organization. (2009). WHO Mortality Database: Tables. Health Statistics and Health Information Systems. Available: http://www.who.int/healthinfo/morttables/en/index.html [accessed June 2010].
ANNEX 5A
To measure education, the Eurobarometer survey asks respondents at what age they finished school. The responses are coded as (0) still studying, (1) no education and age 13 and under, (2) age 14, (3) age 15, (4) age 16, (5) age 17, (6) age 18, (7) age 19, (8) ages 20-21, (9) ages 22-24, and (10) ages 25 and older. Another variable that equals 0 for those still studying and 1 for all others complements the education variable. Controlling for both variables shows the effect of completed education independent of those still studying.9 This measure of age of finishing school aims to avoid problems of comparability across diverse education systems that affect measures of formal degrees. However, the age measure may overstate the attainment of those finishing at a later age because of slowness and problems in school rather than advanced degrees.
The measure of occupation uses the EB classification of current or last job in the following categories: (0) no job; (1) farmer or fisherman; (2) unskilled manual, servant; (3) skilled manual; (4) service—hospital, restaurant, police; (5) supervisor; (6) shop owner, craftsman, self-employed; (7) traveling—salesman, driver; (8) work mainly at a desk; (9) middle management—department head, junior manager, teacher, technician; (10) business proprietor, partner or full owner of a company; (11) general management, director, top management; and (12) professional—lawyer, doctor, accountant, architect. The measure treats the categories as a continuous scale, and, given the diverse mix of occupations in some of the categories, the ranking has some arbitrariness. However, the measure relates closely to smoking, and rearranging categories (4 and 7, for example) does little to change the results. Much as for education, a second occupational variable that equals 1 for those with a current or former job and 0 for those never having done any paid work complements the occupation measure.
To measure economic standing, the surveys ask about ownership of goods rather than income. A scale based on the proportion of the following goods owned by the respondent has an alpha reliability of .764: household phone, mobile phone, television, DVD player, music CD player, computer, Internet connection, car, and paying for an apartment or house. Given reporting errors common in usual income measures, goods-based measures do better to predict smoking (Schaap et al., 2008).
Other control variables include age or years since birth treated as a quadratic term to reflect the increase and decrease in smoking prevalence


