
Appendix G
Baccalaureate Origins of Underrepresented Minority PhDs
Appendix G examines in detail the national data on baccalaureate origins of African Americans and Hispanics who earn PhDs in the natural sciences and engineering. The focus is on baccalaureate origins of PhDs because the analysis examines the production of the broad array of baccalaureate institutions rather than just doctoral institutions, yet it is centered on the preparation of students who go on to earn doctorates.
This is not meant to imply that preparation of bachelor’s- and master’s-level scientists and engineers is not important. Perhaps it is more important now than ever, with innovations such as the professional science master’s degree spreading nationwide. This is not meant either to let the elite research universities off the hook when it comes to accepting and graduating underrepresented minority doctoral students in science and engineering—they are definitely responsible, particularly since their production has been collectively inadequate in graduating underrepresented minorities with doctorates in STEM fields. This is meant, however, to suggest that holding students to high standards and expectations such as one would find in the preparation of students for success at the doctoral level is very important, and so it is instructive to learn more about who is doing that and in what ways.
CONTEXT: SCIENCE AND ENGINEERING
The National Science Foundation (NSF) reports in The Role of HBCUs as Baccalaureate-Origin Institutions of Black S&E Doctorate Recipients that African American S&E doctorate recipients earned their bachelor’s
degrees from a wide range of institutions.1 In 2006, one-third of these new doctorates had earned their bachelor’s from a Historically Black College or University (HBCU) and two-thirds from non-HBCUs. Similarly, about 30 percent of the undergraduate institutions awarding bachelor’s degrees to these individuals were HBCUs. Another 25 percent were non-HBCU research universities, and the rest of the institutions were from a range of non-HBCUs, including doctorate, master’s, and liberal arts colleges, as well as a group of foreign institutions.
The proportion of African American S&E doctorates who had received their bachelor’s degrees from HBCUs has fluctuated in recent decades, as NSF relates:
In the latter 1970s, over 40 percent of black S&E doctorate recipients received their baccalaureate degrees from HBCUs. This percentage fell to 25 percent in the first part of the 1990s before increasing to about 33 percent in 2006. During the same period (1977-2006), the share of blacks receiving bachelor’s degrees from HBCUs fell from 36 percent to 21 percent.”2
But the role of HBCUs is strong in terms of overall numbers per institution. While they award a minority of the bachelor’s degrees to African American S&E doctorates, the institutions awarding the largest number of bachelor’s to this group are HBCUs. NSF reports that for African American S&E doctorate recipients in the period 1997-2006, the top 8 baccalaureateorigin institutions were HBCUs, and overall, 20 of the top 50 baccalaureate institutions were. The top 5 baccalaureate institutions were Howard University, Spelman College, Hampton University, Florida A&M University, and Morehouse College.
When normalized for the number of bachelor’s degrees awarded nine years earlier to African American undergraduates, however, another important picture emerges. In this case, only 5 of the top 50 baccalaureate institutions for 1997-2006 African American S&E doctorates, including the social sciences, are HBCUs, with just Spelman in the top 25. The top five institutions were Massachusetts Institute of Technology, Swarthmore College, Princeton University, Harvard University, and Amherst College. This shows the role that elite predominantly white institutions (PWIs) can play. The “normalization” masks that these institutions have actually produced just small numbers that are a relatively high percentage relative to a small base and primarily in the social sciences (with the exception of MIT), but they
indicate the potential that could be unleashed when these institutions attract greater numbers of underrepresented minorities in STEM.
ANALYSIS: FOCUS ON NATURAL SCIENCE AND ENGINEERING
Our further analysis focuses more specifically on the natural sciences and engineering (NS&E) for the period 2002-2006 (most recent five years studied) to explore institutional strengths in particular areas.
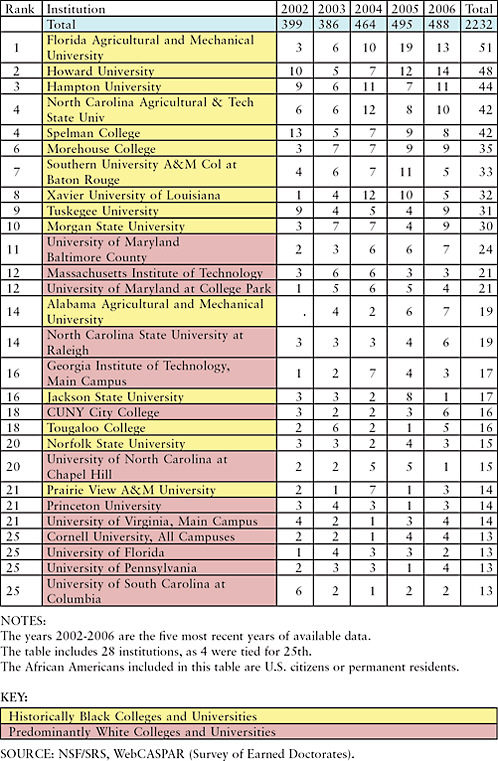
As shown in Table G-1, the top 10 baccalaureate institutions of African Americans who went on to earn doctorates in the natural sciences and engineering (NS&E) for the period 2002-2006 were HBCUs. This is a pattern similar to the NSF analysis for science and engineering, though with more HBCUs rising into the top 10 group. The top baccalaureate institutions for NS&E doctorates were Florida A&M University, Howard University, Hampton University, North Carolina A&T State University, Spelman College, Morehouse College, Southern University at Baton Rouge, Xavier University of Louisiana, Tuskegee University, and Morgan State University.
If we expand the analysis to the “top 25” institutions (actually 28, as there is a 4-way tie for the 25th spot), 15 of these institutions were HBCUs and 13 were non-HBCUs. The highest ranked PWIs were the University of Maryland Baltimore County, Massachusetts Institute of Technology, University of Maryland College Park, North Carolina State University, Georgia Institute of Technology, and the City University of New York (CUNY) City College.
Historically Black Institutions
The ranking of the 15 HBCUs in NS&E is higher than the ranking of the 11 HBCUs in the top 25 baccalaureate institutions for African Americans who earned doctorates in all S&E fields during this period. Florida A&M University and North Carolina A&T State University, in particular, ranked higher in the NS&E list than they did in the overall S&E list because of their strong engineering programs. As shown in Table G-2, burrowing down further into specific NS&E fields, distinctive patterns of institutional focus emerge:
-
Three institutions have large numbers due to engineering programs that produce bachelor’s who go on to doctorates in the field. These include one HBCU (North Carolina A&T State University) and two PWIs (Massachusette Institute of Technology and Georgia Institute of Technology).
-
Two institutions have similar concentrations in the life sciences, particularly the biological sciences. These are Xavier University, an HBCU,
-
and the University of Maryland Baltimore County, PWI with a program that has focused on the development of minorities in the biological sciences. Hampton University, noted below, also has a large concentration in the biological sciences.
-
Alabama A&M University, Jackson State University, and Southern University at Baton Rouge have concentrations more generally in the life sciences, with a focus on the agricultural sciences. (The four top schools in the agricultural sciences are these three, plus Tuskegee University, noted below.)
-
Eight institutions have concentrations in both engineering and the life sciences. These include five HBCUs (Florida A&M University, Howard University, Morgan State University, Tuskegee University, and Prairie View A&M University) and three PWIs (University of Maryland College Park, North Carolina State, and City University of New York City College).
-
Hampton, Spelman, Morehouse, Norfolk State, and Tougaloo have granted bachelor’s degrees to future doctorates across the natural sciences disciplines.
Thus, for HBCUs, there are several strategies evident for developing African Americans who earn doctorates in NS&E fields: Five baccalaureate institutions educate undergraduates across a range of natural sciences disciplines; six institutions have strong engineering programs; one has a particularly strong program in the biological sciences; four have strong programs in the agricultural sciences; and a handful have strong programs in both engineering and the life sciences.
Predominantly White Institutions
Among the top six PWIs, there are three noteworthy approaches that can be discerned in Table G-3:
-
MIT admits outstanding African American engineering students, a small number who have a higher propensity for graduating and continuing on to doctoral study than other African American undergraduates.
-
Georgia Tech and UMBC have focused efforts to recruit, support, and graduate students in engineering and the biological sciences who continue on to doctoral study in their fields.
-
North Carolina State University, University of Maryland College Park, and City University of New York City College have relatively large numbers of African American students who are distributed across fields, some small percentage of whom continue to graduate school.
Taken individually, the achievements of MIT, Georgia Tech, and UMBC are remarkable. Taken together, unfortunately, the numbers they are pro-
TABLE G-2 Top 15 Baccalaureate Origin Institutions of African American Doctorates in the Natural Sciences and Engineering (NS&E) that are Historically Black Colleges and Universities (HBCUs), by Broad Field, 2002-2006 (most recent 5 years)
|
HBCUs |
Total |
|
Florida Agricultural and Mechanical University |
51 |
|
Howard University |
48 |
|
Hampton University |
44 |
|
North Carolina Agricultural & Tech State University |
42 |
|
Spelman College |
42 |
|
Morehouse College |
35 |
|
Southern University A&M Col at Baton Rouge |
33 |
|
Xavier University of Louisiana |
32 |
|
Tuskegee University |
31 |
|
Morgan State University |
30 |
|
Alabama Agricultural and Mechanical University |
19 |
|
Jackson State University |
17 |
|
Tougaloo College |
16 |
|
Norfolk State University |
15 |
|
Prairie View A&M University |
14 |
|
TOTAL HBCUs |
469 |
|
Engineering |
Physical Sciences |
||||||||||
|
2002 |
2003 |
2004 |
2005 |
2006 |
Subtotal |
2002 |
2003 |
2004 |
2005 |
2006 |
Subtotal |
|
1 |
3 |
6 |
7 |
5 |
22 |
0 |
3 |
0 |
1 |
1 |
5 |
|
5 |
1 |
3 |
1 |
3 |
13 |
2 |
0 |
1 |
1 |
. |
4 |
|
1 |
0 |
1 |
1 |
1 |
4 |
4 |
1 |
1 |
1 |
3 |
10 |
|
6 |
1 |
8 |
3 |
8 |
26 |
0 |
0 |
1 |
1 |
0 |
2 |
|
3 |
2 |
1 |
2 |
1 |
9 |
3 |
1 |
1 |
0 |
1 |
6 |
|
0 |
1 |
1 |
1 |
3 |
6 |
1 |
1 |
4 |
2 |
1 |
9 |
|
1 |
1 |
0 |
4 |
1 |
7 |
0 |
0 |
3 |
1 |
1 |
5 |
|
0 |
1 |
1 |
0 |
0 |
2 |
0 |
0 |
1 |
1 |
0 |
2 |
|
3 |
2 |
1 |
2 |
4 |
12 |
0 |
0 |
0 |
0 |
0 |
0 |
|
1 |
3 |
2 |
2 |
4 |
12 |
1 |
0 |
0 |
2 |
1 |
4 |
|
0 |
0 |
0 |
1 |
3 |
4 |
0 |
2 |
1 |
2 |
1 |
6 |
|
0 |
1 |
1 |
1 |
0 |
3 |
2 |
0 |
0 |
2 |
1 |
5 |
|
0 |
1 |
0 |
0 |
1 |
2 |
1 |
2 |
0 |
0 |
1 |
4 |
|
0 |
0 |
0 |
1 |
0 |
1 |
0 |
3 |
1 |
2 |
0 |
6 |
|
0 |
0 |
3 |
0 |
2 |
5 |
2 |
1 |
0 |
1 |
0 |
4 |
|
21 |
17 |
28 |
26 |
36 |
128 |
16 |
14 |
14 |
17 |
11 |
72 |
|
Math and ComputerSciences |
Life Sciences |
||||||||||
|
2002 |
2003 |
2004 |
2005 |
2006 |
Subtotal |
2002 |
2003 |
2004 |
2005 |
2006 |
Subtotal |
|
0 |
0 |
0 |
1 |
1 |
2 |
2 |
0 |
4 |
10 |
6 |
22 |
|
1 |
0 |
0 |
1 |
2 |
4 |
2 |
4 |
3 |
9 |
9 |
27 |
|
2 |
0 |
1 |
0 |
1 |
4 |
2 |
5 |
8 |
5 |
6 |
26 |
|
0 |
0 |
0 |
1 |
0 |
1 |
0 |
5 |
3 |
3 |
2 |
13 |
|
3 |
0 |
0 |
2 |
1 |
6 |
4 |
2 |
5 |
5 |
5 |
21 |
|
0 |
2 |
0 |
0 |
0 |
2 |
2 |
3 |
2 |
6 |
5 |
18 |
|
1 |
0 |
0 |
1 |
0 |
2 |
2 |
5 |
4 |
5 |
3 |
19 |
|
0 |
0 |
0 |
0 |
0 |
0 |
1 |
3 |
10 |
9 |
5 |
28 |
|
1 |
1 |
0 |
1 |
0 |
3 |
5 |
1 |
4 |
1 |
5 |
16 |
|
0 |
0 |
0 |
0 |
0 |
0 |
1 |
4 |
5 |
0 |
4 |
14 |
|
0 |
0 |
0 |
0 |
0 |
0 |
0 |
2 |
1 |
3 |
3 |
9 |
|
0 |
0 |
1 |
0 |
0 |
1 |
1 |
2 |
0 |
5 |
0 |
8 |
|
0 |
0 |
0 |
0 |
0 |
0 |
1 |
3 |
2 |
1 |
3 |
10 |
|
1 |
0 |
0 |
0 |
2 |
3 |
2 |
0 |
1 |
1 |
1 |
5 |
|
0 |
0 |
0 |
0 |
0 |
0 |
0 |
0 |
4 |
0 |
1 |
5 |
|
9 |
3 |
2 |
7 |
7 |
28 |
25 |
39 |
56 |
63 |
58 |
241 |
TABLE G-3 Top 13 Baccalaureate Origin Institutions of African American Doctorates in the Natural Sciences and Engineering (NS&E) that are Predominantly White Universities, by Broad Field, 2002-2006 (most recent 5 years)
|
Non-HBCUs |
Total |
|
University of Maryland Baltimore County |
24 |
|
Massachusetts Institute of Technology |
21 |
|
University of Maryland at College Park |
21 |
|
North Carolina State University at Raleigh |
19 |
|
Georgia Institute of Technology, Main Campus |
17 |
|
CUNY City College |
16 |
|
University of North Carolina at Chapel Hill |
15 |
|
Princeton University |
14 |
|
University of Virginia, Main Campus |
14 |
|
Cornell University, All Campuses |
13 |
|
University of Florida |
13 |
|
University of Pennsylvania |
13 |
|
University of South Carolina at Columbia |
13 |
|
TOTAL Non-HBCUs |
213 |
|
Engineering |
Physical Sciences |
||||||||||
|
2002 |
2003 |
2004 |
2005 |
2006 |
Subtotal |
2002 |
2003 |
2004 |
2005 |
2006 |
Subtotal |
|
0 |
1 |
3 |
1 |
1 |
6 |
0 |
0 |
0 |
0 |
0 |
0 |
|
1 |
4 |
3 |
3 |
2 |
13 |
2 |
1 |
0 |
0 |
0 |
3 |
|
1 |
2 |
1 |
3 |
2 |
9 |
0 |
0 |
2 |
0 |
0 |
2 |
|
2 |
0 |
1 |
2 |
2 |
7 |
0 |
0 |
0 |
0 |
0 |
0 |
|
1 |
0 |
5 |
4 |
2 |
12 |
0 |
0 |
0 |
0 |
0 |
0 |
|
0 |
2 |
1 |
1 |
2 |
6 |
0 |
0 |
1 |
0 |
0 |
1 |
|
0 |
0 |
0 |
1 |
0 |
1 |
0 |
0 |
2 |
2 |
0 |
4 |
|
2 |
2 |
1 |
0 |
0 |
5 |
0 |
0 |
0 |
0 |
1 |
1 |
|
0 |
0 |
0 |
0 |
0 |
0 |
1 |
1 |
1 |
0 |
0 |
3 |
|
0 |
1 |
0 |
0 |
1 |
2 |
0 |
1 |
0 |
1 |
0 |
2 |
|
0 |
0 |
1 |
1 |
0 |
2 |
0 |
0 |
0 |
1 |
0 |
1 |
|
1 |
0 |
1 |
1 |
0 |
3 |
0 |
0 |
1 |
0 |
0 |
1 |
|
0 |
1 |
0 |
0 |
0 |
1 |
0 |
0 |
0 |
0 |
1 |
1 |
|
8 |
13 |
17 |
17 |
12 |
67 |
3 |
3 |
7 |
4 |
2 |
19 |
|
Math and Computer Sciences |
Life Sciences |
||||||||||
|
2002 |
2003 |
2004 |
2005 |
2006 |
Subtotal |
2002 |
2003 |
2004 |
2005 |
2006 |
Subtotal |
|
0 |
0 |
0 |
0 |
0 |
0 |
2 |
2 |
3 |
5 |
6 |
18 |
|
0 |
0 |
1 |
0 |
0 |
1 |
. |
1 |
2 |
. |
1 |
4 |
|
0 |
1 |
1 |
0 |
0 |
2 |
. |
2 |
2 |
2 |
2 |
8 |
|
0 |
0 |
0 |
0 |
1 |
1 |
1 |
3 |
2 |
2 |
3 |
11 |
|
0 |
2 |
0 |
0 |
1 |
3 |
. |
. |
2 |
. |
. |
2 |
|
0 |
0 |
0 |
0 |
0 |
0 |
3 |
. |
. |
2 |
4 |
9 |
|
0 |
0 |
0 |
0 |
0 |
0 |
2 |
2 |
3 |
2 |
1 |
10 |
|
1 |
0 |
0 |
0 |
0 |
1 |
. |
2 |
2 |
1 |
2 |
7 |
|
0 |
0 |
0 |
0 |
0 |
0 |
3 |
1 |
. |
3 |
4 |
11 |
|
0 |
0 |
0 |
0 |
0 |
0 |
2 |
. |
1 |
3 |
3 |
9 |
|
0 |
0 |
0 |
0 |
0 |
0 |
1 |
4 |
2 |
1 |
2 |
10 |
|
0 |
1 |
0 |
0 |
0 |
1 |
1 |
2 |
1 |
. |
4 |
8 |
|
1 |
0 |
0 |
0 |
0 |
1 |
5 |
1 |
1 |
2 |
1 |
10 |
|
2 |
4 |
2 |
0 |
2 |
10 |
20 |
20 |
21 |
23 |
33 |
117 |
ducing do not move the overall trend-line in numbers of African American doctorates very much.
TOP BACCALAUREATE INSTITUTIONS OF HISPANIC NS&E DOCTORATES
Context: Science and Engineering
The NSF has not produced an InfoBrief on Hispanic-serving institutions similar to the one it has produced on Historically Black Colleges and Universities, so we are not able to provide the same data on the larger S&E context that we did for African Americans.
Analysis: Focus on Natural Sciences and Engineering
As shown in Table G-4, of the top 25 baccalaureate institutions (actually 26, as two are tied for 25th) of Hispanics who earned doctorates in the natural sciences and engineering (NS&E) during the period 2002-2006, not surprisingly, three are campuses of the University of Puerto Rico. The remaining institutions include 17 predominantly white institutions (PWIs) and 5 Hispanic-Serving Institutions (HSIs).
Among the top 25 baccalaureate institutions for African American NS&E doctorates, just 13 are PWIs, so the composition of the largest baccalaureate institutions, particularly for Hispanic NS&E students who are not from Puerto Rico, differs substantially from those that provide baccalaureate education for African Americans.
Also, in contrast to the position of HBCUs as baccalaureate institutions of African American NS&E doctorates, the largest baccalaureate institutions for Hispanics after the University of Puerto Rico campuses are PWIs. The largest institutions are: University of Puerto Rico Mayaguez, University of Puerto Rico, Rio Piedras, University of California Berkeley, Massachusetts Institute of Technology, and the University of Florida.
The baccalaureate institutions of Hispanic NS&E doctorates are geographically concentrated. Not surprisingly, the majority (14) of the top institutions are located in the West (California, Texas, New Mexico, and Arizona). This geographic concentration underscores an important difference between HBCUs, which were created with the purpose of educating African Americans, and HSIs, which, with a small number of exceptions, do so because they are located in or near large Hispanic populations.
The students who attend the top 25 institutions are predominantly in the life sciences, followed by engineering. Some patterns emerge from an examination of Table G-5 which provides data by broad field for the top institutions:
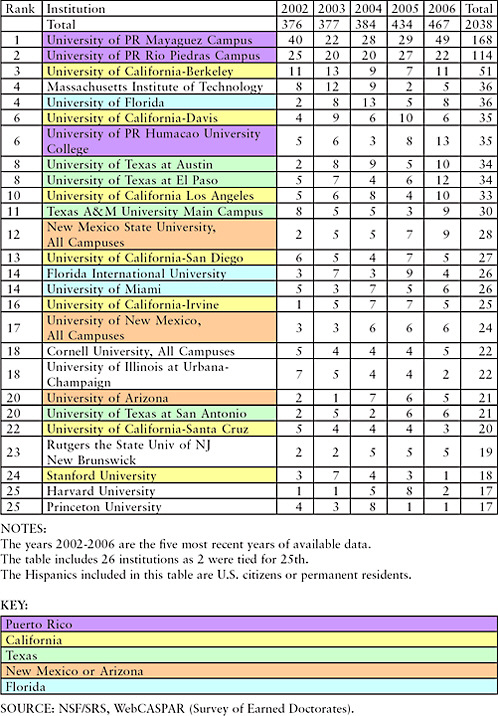
TABLE G-5 Top 25 Baccalaureate Origin Institutions of Hispanic Doctorates in the Natural Sciences and Engineering (NS&E), by Broad Field, 2002-2006 (most recent 5 years)
|
Institutions |
Total |
|
University of Puerto Rico Campuses |
|
|
University of PR Mayaguez Campus |
168 |
|
University of PR Rio Piedras Campus |
114 |
|
University of PR Humacao University College |
35 |
|
Hispanic-Serving Institutions |
|
|
University of Texas at El Paso |
34 |
|
New Mexico State University, All Campuses |
28 |
|
Florida International University |
26 |
|
University of Miami |
26 |
|
University of New Mexico, All Campuses |
24 |
|
University of Texas at San Antonio |
21 |
|
Other Institutions |
|
|
University of California-Berkeley |
51 |
|
Massachusetts Institute of Technology |
36 |
|
University of Florida |
36 |
|
University of California-Davis |
35 |
|
University of Texas at Austin |
34 |
|
University of California-Los Angeles |
33 |
|
Texas A&M University Main Campus |
30 |
|
University of California-San Diego |
27 |
|
University of California-Irvine |
25 |
|
Cornell University, All Campuses |
22 |
|
University of Illinois at Urbana-Champaign |
22 |
|
University of Arizona |
21 |
|
University of California-Santa Cruz |
20 |
|
Rutgers the State Univ of NJ New Brunswick |
19 |
|
Stanford University |
18 |
|
Harvard University |
17 |
|
Princeton University |
17 |
|
Total |
939 |
|
Engineering |
Physical Sciences |
||||||||||
|
2002 |
2003 |
2004 |
2005 |
2006 |
Subtotal |
2002 |
2003 |
2004 |
2005 |
2006 |
Subtotal |
|
15 |
12 |
15 |
8 |
23 |
73 |
8 |
3 |
4 |
4 |
8 |
27 |
|
1 |
3 |
0 |
1 |
3 |
8 |
5 |
5 |
7 |
10 |
7 |
34 |
|
1 |
0 |
0 |
2 |
1 |
4 |
2 |
0 |
2 |
4 |
7 |
15 |
|
1 |
4 |
1 |
3 |
6 |
15 |
2 |
0 |
0 |
0 |
2 |
4 |
|
0 |
1 |
1 |
1 |
2 |
5 |
0 |
1 |
2 |
1 |
1 |
5 |
|
1 |
0 |
0 |
2 |
1 |
4 |
1 |
4 |
0 |
2 |
1 |
8 |
|
1 |
1 |
1 |
0 |
1 |
4 |
3 |
0 |
2 |
0 |
1 |
6 |
|
0 |
1 |
1 |
1 |
2 |
5 |
1 |
1 |
0 |
0 |
1 |
3 |
|
0 |
0 |
0 |
0 |
0 |
0 |
0 |
2 |
0 |
1 |
0 |
3 |
|
2 |
1 |
3 |
2 |
2 |
10 |
2 |
2 |
1 |
2 |
1 |
8 |
|
4 |
6 |
3 |
. |
2 |
15 |
4 |
2 |
2 |
1 |
2 |
11 |
|
1 |
2 |
4 |
2 |
2 |
11 |
0 |
0 |
0 |
0 |
0 |
0 |
|
0 |
2 |
0 |
3 |
2 |
7 |
1 |
0 |
1 |
0 |
1 |
3 |
|
1 |
2 |
4 |
1 |
1 |
9 |
0 |
2 |
1 |
0 |
1 |
4 |
|
1 |
0 |
1 |
0 |
0 |
2 |
2 |
1 |
3 |
1 |
2 |
9 |
|
6 |
0 |
0 |
1 |
3 |
10 |
1 |
1 |
2 |
0 |
0 |
4 |
|
0 |
0 |
0 |
3 |
0 |
3 |
1 |
2 |
1 |
2 |
0 |
6 |
|
0 |
1 |
1 |
0 |
0 |
2 |
1 |
0 |
0 |
3 |
1 |
5 |
|
1 |
3 |
1 |
0 |
1 |
6 |
3 |
0 |
0 |
0 |
0 |
3 |
|
4 |
1 |
2 |
1 |
1 |
9 |
0 |
1 |
1 |
0 |
1 |
3 |
|
0 |
0 |
1 |
0 |
1 |
2 |
0 |
1 |
4 |
0 |
0 |
5 |
|
0 |
0 |
0 |
0 |
0 |
0 |
0 |
0 |
1 |
0 |
1 |
2 |
|
1 |
1 |
1 |
1 |
0 |
4 |
1 |
1 |
0 |
0 |
1 |
3 |
|
0 |
1 |
1 |
1 |
0 |
3 |
0 |
1 |
2 |
2 |
0 |
5 |
|
0 |
0 |
0 |
0 |
0 |
0 |
0 |
1 |
1 |
2 |
0 |
4 |
|
2 |
. |
0 |
0 |
0 |
2 |
1 |
0 |
0 |
1 |
1 |
3 |
|
43 |
42 |
41 |
33 |
54 |
213 |
39 |
31 |
37 |
36 |
40 |
183 |
|
Institution |
Total |
|
University of Puerto Rico Campuses |
|
|
University of PR Mayaguez Campus |
168 |
|
University of PR Rio Piedras Campus |
114 |
|
University of PR Humacao University College |
35 |
|
Hispanic Serving Institutions |
|
|
University of Texas at El Paso |
34 |
|
New Mexico State University, All Campuses |
28 |
|
Florida International University |
26 |
|
University of Miami |
26 |
|
University of New Mexico, All Campuses |
24 |
|
University of Texas at San Antonio |
21 |
|
Other Institutions |
|
|
University of California-Berkeley |
51 |
|
Massachusetts Institute of Technology |
36 |
|
University of Florida |
36 |
|
University of California-Davis |
35 |
|
University of Texas at Austin |
34 |
|
University of California-Los Angeles |
33 |
|
Texas A&M University Main Campus |
30 |
|
University of California-San Diego |
27 |
|
University of California-Irvine |
25 |
|
Cornell University, All Campuses |
22 |
|
University of Illinois at Urbana-Champaign |
22 |
|
University of Arizona |
21 |
|
University of California-Santa Cruz |
20 |
|
Rutgers the State Univ of NJ New Brunswick |
19 |
|
Stanford University |
18 |
|
Harvard University |
17 |
|
Princeton University |
17 |
|
Total |
939 |
|
Math and Computer Sciences |
Life Sciences |
||||||||||
|
2002 |
2003 |
2004 |
2005 |
2006 |
Subtotal |
2002 |
2003 |
2004 |
2005 |
2006 |
Subtotal |
|
2 |
1 |
0 |
1 |
1 |
5 |
15 |
6 |
9 |
16 |
17 |
63 |
|
2 |
0 |
2 |
0 |
2 |
6 |
17 |
12 |
11 |
16 |
10 |
66 |
|
0 |
1 |
0 |
0 |
1 |
2 |
2 |
5 |
1 |
2 |
4 |
14 |
|
0 |
1 |
0 |
0 |
0 |
1 |
2 |
2 |
3 |
3 |
4 |
14 |
|
0 |
0 |
0 |
0 |
1 |
1 |
2 |
3 |
2 |
5 |
5 |
17 |
|
1 |
0 |
0 |
1 |
0 |
2 |
0 |
3 |
3 |
4 |
2 |
12 |
|
0 |
0 |
1 |
0 |
0 |
1 |
1 |
2 |
3 |
5 |
4 |
15 |
|
0 |
0 |
1 |
1 |
0 |
2 |
2 |
1 |
4 |
4 |
3 |
14 |
|
1 |
0 |
0 |
0 |
0 |
1 |
1 |
3 |
2 |
5 |
6 |
17 |
|
1 |
3 |
1 |
1 |
0 |
6 |
6 |
7 |
4 |
2 |
8 |
27 |
|
0 |
0 |
2 |
0 |
0 |
2 |
0 |
4 |
2 |
1 |
1 |
8 |
|
0 |
1 |
1 |
0 |
0 |
2 |
1 |
5 |
8 |
3 |
6 |
23 |
|
1 |
1 |
0 |
1 |
1 |
4 |
2 |
6 |
5 |
6 |
2 |
21 |
|
0 |
1 |
0 |
1 |
0 |
2 |
1 |
3 |
4 |
3 |
8 |
19 |
|
0 |
1 |
1 |
0 |
2 |
4 |
2 |
4 |
3 |
3 |
6 |
18 |
|
0 |
0 |
0 |
0 |
1 |
1 |
1 |
4 |
3 |
2 |
5 |
15 |
|
0 |
1 |
0 |
0 |
0 |
1 |
5 |
2 |
3 |
2 |
5 |
17 |
|
0 |
0 |
0 |
1 |
1 |
2 |
0 |
4 |
6 |
3 |
3 |
16 |
|
0 |
0 |
0 |
1 |
0 |
1 |
1 |
1 |
3 |
3 |
4 |
12 |
|
0 |
0 |
0 |
0 |
0 |
0 |
3 |
3 |
1 |
3 |
0 |
10 |
|
0 |
0 |
1 |
0 |
0 |
1 |
2 |
0 |
1 |
6 |
4 |
13 |
|
1 |
0 |
0 |
0 |
0 |
1 |
4 |
4 |
3 |
4 |
2 |
17 |
|
0 |
0 |
0 |
0 |
1 |
1 |
0 |
0 |
4 |
4 |
3 |
11 |
|
0 |
0 |
0 |
0 |
0 |
0 |
3 |
5 |
1 |
0 |
1 |
10 |
|
0 |
0 |
0 |
1 |
0 |
1 |
1 |
0 |
4 |
5 |
2 |
12 |
|
0 |
1 |
1 |
0 |
0 |
2 |
1 |
2 |
7 |
0 |
0 |
10 |
|
9 |
12 |
11 |
9 |
11 |
52 |
75 |
91 |
100 |
110 |
115 |
491 |
For Puerto Rico, the Mayaguez campus has a strong engineering program. The Mayaguez and Rio Piedras campuses both have strong life sciences programs.
For the continental United States, three institutions have strong engineering programs. One is an HSI (University of Texas at El Paso) and two are PWIs (MIT and Texas A&M). MIT is the one institution that appears on the list of top baccalaureate institutions for both African American and Hispanic PhDs, both rankings due to engineering programs, though MIT also has a strong record as the baccalaureate institution for Hispanics in the physical sciences.
In the life sciences, the largest institutions are two PWIs—University of California-Berkeley and the University of Florida—that have a particular focus in this broad field. The next three largest programs are at New Mexico State (an HSI) and the University of California-Davis and the University of Texas at Austin (both PWIs). For New Mexico State, about half of the students in the life sciences are in the biological sciences, and the other half are in the agricultural sciences. The other programs focus more strongly on the biological sciences.
The rest of the institutions not discussed already awarding bachelor’s are also largely concentrated in the life sciences. These include the University of California-Los Angeles, Florida International University, University of California-San Diego, University of Miami, Cornell, University of California-Irvine, University of California- Santa Cruz, Rutgers, Stanford, Harvard, Princeton, and the Universities of New Mexico, Arizona, Illinois, and Texas at San Antonio.


