
5
Dietary Reference Intakes for Adequacy: Calcium and Vitamin D
OVERVIEW
Bone health has been selected as the indicator to serve as the basis of the Dietary Reference Intakes (DRIs) for calcium and vitamin D. The review that underpins this conclusion has been described in Chapter 4, the component of this report addressing the hazard identification step of risk assessment and specifying the selected indicator. The next step in the risk assessment approach for DRI development—the hazard characterization component of risk assessment—is contained in this chapter. The dose–response relationship between the nutrient intake and bone health is examined and dietary reference values for adequacy are specified. In the case of DRIs for calcium and vitamin D, such values take the form of Estimated Average Requirements (EARs) and Recommended Dietary Allowances (RDAs) or, alternatively, Adequate Intakes (AIs). The discussions related to the Tolerable Upper Intake Level (UL), which is also a DRI value, are contained in Chapter 6.
Currently available data on bone health outcomes—when considered as an integrated body of evidence—can be used to derive EARs and RDAs for calcium and vitamin D for all life stages except infants. Bone health measures associated with bone accretion, bone maintenance, and bone loss are relevant to different DRI life stages, and thus the indicator of bone health has been reflected by different bone health measures depending upon the life stage. With respect to infants 0 to 12 months of age, for whom data were very sparse, an AI can be specified for each nutrient based on the available evidence concerning levels of intake observed to be adequate.
The DRIs for calcium and vitamin D established in 1997 (IOM, 1997) also relied on bone health as the indicator in setting reference values for adequacy. However, the 1997 report established an AI for all life stage groups; no EARs or RDAs were specified. Newer data plus an integration of data have allowed the estimation of EARs and RDAs for all life stages except infants. Quantitative comparisons between AIs and EARs and RDAs are not appropriate.
In 1997, AIs were established for calcium in lieu of EARs and RDAs as a result of uncertainties associated with balance studies, lack of concordance between observational and experimental data, and lack of longitudinal data to verify the relationship between calcium intake, calcium retention and bone loss (IOM, 1997). In the past 10 years, newer evidence on skeletal health has emerged from a combination of large-scale randomized trials and calcium balance studies as described in Chapter 4. Further, there are now data relative to a number of life stage groups, and these help to avoid reliance on extrapolating or scaling data from one life stage to another unstudied life stage.
In the case of vitamin D, the 1997 report concluded that there were inadequate data available for EARs and RDAs as a result of uncertainties about sun exposure, the vitamin D content of the diet, and vitamin D stores (IOM, 1997). In the intervening years data have emerged that allow a requirement distribution to be simulated for vitamin D, which, in turn, has been found to be concordant with other available data. This analysis unexpectedly indicated that the dose–response relationship regarding median requirements is not significantly affected by age. Further, several newer studies can be used to elucidate the contributions made by sun exposure and to help separate total intake contributions from contributions stemming from cutaneous synthesis. Strides have been made in estimating the vitamin D content of foods as well as the amounts of vitamin D consumed by the U.S. and Canadian populations.
Despite new data since the earlier Institute of Medicine (IOM) report (IOM, 1997), there remain a number of uncertainties that have caused challenges in estimating DRI values for calcium and vitamin D. Notable among these is the absence of intervention trials that study dose–response relationships for the nutrients. Rather, most of the evidence is derived from a single dose that is often relatively high. Further, some studies fail to specify information about the background diet and hence the total level of intake is lacking. When this is the case, the mean population requirement may be below the dose used in the study, but cannot be further specified. In addition, there is the common practice of designing studies to examine calcium and vitamin D in combination, thereby precluding the ability to discern the effects of each nutrient alone, which is of interest when establishing a reference value for a nutrient.
As discussed in Chapter 4, there are very limited data to suggest that there may be some biological differences in the way in which different ethnic/racial groups respond to calcium and vitamin D, most notably among those of African American ancestry. The extent to which such observations may affect requirements for the nutrients is unknown at this time. Although it is important to take into account biological differences where they may exist among, for example, African Americans, Hispanics, and those of Asian descent, the available data are too limited to permit the committee to assess whether separate, quantitative reference values for such groups are required. The DRIs established in this report are based on the current understanding of the biological needs for calcium and vitamin D across the North American population. Other factors may come into play in terms of ensuring adequate intakes of these nutrients—for example, lactose intolerance or food choices—but as far as is known these factors do not affect the basic biological need for these nutrients. Rather, they are discussed in Chapter 8 as issues relevant to the application of the DRIs by dietary practitioners.
Described in this chapter is the committee’s decision-making regarding the dose–response relationships for calcium and bone health, and for vitamin D and bone health. From these conclusions, DRI values for adequacy are specified. A significant underlying assumption made by the committee is that the DRIs for calcium are predicated on intakes that meet requirements for vitamin D and that the DRIs for vitamin D rest on the assumption of intakes that meet requirements for calcium. In other words, the requirement for one nutrient assumes that the need for the other nutrient is being met. This is an essential assumption, for three reasons:
-
Given that reference values are intended to act in concert for the purposes of planning diets, health policy makers would be working to meet all nutritional needs; therefore it would be inappropriate to establish requirements for such purposes on the basis that one or more related nutrients would be consumed by the population in inadequate amounts.
-
An inadequacy in one of the nutrients could cause changes in the efficient handling of or physiological response to the other nutrient that might not otherwise be present. For example, in vitamin D–deficient states with minimal calcium intake, absorption of calcium from the gut cannot be enhanced. The compensatory metabolic response to this scenario is the accelerated conversion of 25-hydroxyvitamin D (25OHD) to its active form (calcitriol) through an increase in parathyroid hormone (PTH) levels. Such perturbations confound the estimation of the true requirement under neutral circumstances.
-
No amount of vitamin D is able to compensate for inadequate total calcium intake; thus, setting a realistic DRI value for vitamin D requires that calcium is available in the diet in adequate amounts.
However, the committee has also commented on the consequences for one nutrient when the other is inadequate, in order to be transparent regarding the science underpinning the determination of reference values for these two nutrients.
CALCIUM: DIETARY REFERENCE INTAKES FOR ADEQUACY
The EARs, RDAs, and AIs for calcium are shown in Table 5-1 by life stage group. The studies used to estimate these values have been included in the review of potential indicators contained in Chapter 4. Therefore, in the discussions below, the relevant data are highlighted but not specifically critiqued again.
Infants 0 to 12 Months of Age
|
Data are not sufficient to establish an EAR for infants 0 to 6 and 7 to 12 months of age, and therefore AIs have been developed based on the available evidence. An AI value is not intended to signify an average requirement, but instead reflects an intake level based on approximations or estimates of nutrient intakes that are assumed to be adequate. Whether and how much the AI values for infants could be lowered and still meet the physiological needs for human milk-fed infants are unknown because mechanisms for adaptation to lower intakes of calcium are not well described for the infant population, and experimental data with overall relevance to estimating average requirements are extremely limited.
Calcium requirements for infants are presumed to be met by human milk (IOM, 1997). There are no functional criteria for calcium status that reflect response to calcium intake in infants (IOM, 1997). Rather, human milk is recognized as the optimal source of nourishment for infants (IOM, 1991; Gartner et al., 2005). There are no reports of any full-term, vitamin D–replete infants developing calcium deficiency when exclusively fed human milk (Mimouni et al., 1993; Abrams, 2006). Therefore, AIs for calcium
TABLE 5-1 Calcium Dietary Reference Intakes (DRIs) for Adequacy (amount/day)
for infants are based on mean intake data from infants fed human milk as the principal fluid during the first year of life and on the studies that have determined the mean calcium content of breast milk. Additionally, information on calcium absorption and calcium accretion is taken into account.
With respect to estimating AIs for calcium for infants, studies reviewed previously in this report have provided the following information:
-
Based on infant weighing studies, a reasonable average amount of breast milk consumed is 780 mL/day. The average level of calcium within a liter of breast milk is 259 mg (± 59 mg). It is therefore estimated that the intake of calcium for infants fed exclusively human milk is 202 mg/day. This number is rounded to 200 mg/day.
-
Calcium absorption for this age group ranges somewhat above and below 60 percent depending upon the total amount of calcium consumed. For development of the AI, a 60 percent calcium absorption rate was assumed.
-
The usual accretion rate for calcium in infants can be estimated using the approximation of 100 mg/day overall during the first year of life, with the recognition that the available literature contains reports of varying rates above and below that level.
Infants 0 to 6 Months of Age
Using the estimates described above for the calcium content of breast milk and the amount of milk consumed per day, the AI for calcium for infants 0 to 6 months of age is 200 mg/day, a value reflective of the calcium provided to exclusively breast-fed infants. The expected net retention of calcium from human milk assuming 60 percent absorption would be 120 mg/day, which is in excess of the values predicted from calcium accretion based on cadaver and metacarpal analysis. An AI of 200 mg/day is expected, therefore, to result in retention of sufficient amounts of calcium to meet growth needs.
Further, for infants in the first 4 months of life, balance studies suggest that 40 to 70 percent of the daily calcium intake is retained by the human milk-fed infant (Widdowson, 1965; Fomon and Nelson, 1993). In balance studies using human milk–fed infants, the mean calcium intake was 327 mg/day, and calcium retention was 172 mg/day on average (Fomon and Nelson, 1993). If infants consume calcium at the AI daily, they would achieve similar or greater calcium retention even if the efficiency of absorption was at the lower observed value of 30 percent. Thus, the AI should meet most infants’ needs.
The AI established here of 200 mg/day is similar to the AI of 210 mg/day derived by the 1997 report (IOM, 1997). The difference is extremely small—only 10 mg/day—and likely within measurement error; however, the new AI reflects the current best estimate for calcium levels obtained exclusively from human milk
Infants 6 to 12 Months of Age
Estimation of the AI for infants 6 to 12 months of age takes into account the additional intake of calcium from food. From 6 to 12 months of age, the intake of solid foods becomes more significant, and calcium intakes may increase substantially from these sources. Only extremely limited data are available for typical calcium intakes from foods by older milk-fed infants, and mean calcium intake from solid foods has been approxi-
mated as 140 mg/day for formula-fed infants (personal communication, Dr. Steven Abrams, February 22, 2010).
For the purpose of developing an AI for this age group, it is assumed that infants who are fed human milk have intakes of solid food similar to those of formula-fed infants of the same age (Specker et al., 1997). Based on data from Dewey et al. (1984), mean human milk intake during the second 6 months of life would be 600 mL/day. Thus, calcium intake from human milk with a calcium concentration of about 200 mg/L during this age span (Atkinson et al., 1995) would be approximately 120 mg/day. Adding the estimated intake from food (140 mg/day) to the estimated intake from human milk (120 mg/day) gives a total intake of 260 mg/day. Again, this AI is slightly and probably insignificantly less than the 1997 AI (IOM, 1997) but is the current best estimate.
Children and Adolescents 1 Through 18 Years of Age
For these life stage groups, the focus is the level of calcium intake consistent with bone accretion and positive calcium balance. Studies conducted primarily between 1999 and 2009 (see Table 5-2) provide a basis for estimating EARs and calculating RDAs. In contrast to earlier reference value deliberations for which there were virtually no available studies focused on children and adolescents, this committee benefited from several recent studies that used children as subjects.
The approach used for children was to determine average calcium accretion through bone measures such as DXA and average calcium retention as estimated by calcium balance studies (i.e., positive balance). Next, the factorial method (IOM, 1997) was used with these two data sets to estimate the intake needed to achieve the bone accretion. Average bone calcium accretion is used rather than peak calcium accretion because the committee judged this value to be more consistent with meeting the needs
TABLE 5-2 Calcium Intake Estimated to Achieve Average Bone Calcium Accretion for Children and Adolescents Using the Factorial Method
|
Study Author, Year |
Age/Gender |
Average Calcium Accretion (mg/day) |
Urinary Losses (mg/day) |
Endogenous Fecal Calcium Losses (mg/day) |
Sweat Losses (mg/day) |
Total Needed (mg/day) |
Absorption (percent) |
Estimated Total Intake (Adjusted for Absorption) |
|
Lynch et al., 2007 |
1–3 Male/Female |
142 |
34 |
40 |
— |
216 |
45.6 |
474 |
|
Abrams et al., 1999; Ames et al., 1999 |
4–8 Male/Female |
140–160 |
40 |
50 |
— |
240 |
30.0 |
800 |
|
Vatanparast et al., 2010 |
9–13 Female |
151 |
106 |
112 |
55 |
424 |
38.0 |
1,116 |
|
9–13 Male |
141 |
127 |
108 |
55 |
465 |
38.0 |
1,224 |
|
|
14–18 Female |
92 |
106 |
112 |
55 |
365 |
38.0 |
961 |
|
|
14–18 Male |
210 |
127 |
105 |
55 |
500 |
38.0 |
1,316 |
|
|
9–18 Female |
121 |
106 |
112 |
55 |
394 |
38.0 |
1,037 |
|
|
9–18 Male |
175 |
127 |
108 |
55 |
465 |
38.0 |
1,224 |
of 50 percent of this population, and hence an EAR (rather than an AI). Moreover, as discussed in Chapter 2, peak calcium accretion with higher total calcium intakes is likely transitory and, thus, not consistent with DRI development.
The application of the factorial method using average bone calcium accretion allows an estimate of the calcium intake required to support bone accretion and net calcium retention, as shown in Table 5-2. The approach is described below, specifically for each life stage for children and adolescents.
Children 1 Through 3 Years of Age
The data are very limited for children 1 through 3 years of age given the challenges in studying young children. However, a report by Lynch et al. (2007) provides relevant data. Linear and non-linear modeling in this study suggested a target average calcium retention level of 142 mg/day, consistent with the growth needs of this life stage group. Through the factorial method, a calcium intake of 474 mg/day is estimated to meet this need (see Table 5-2). Given that these data are derived from mean estimates and are assumed to be normally distributed, the mean value is very likely the median value. An estimated EAR is, therefore, established as 500 mg of calcium per day, rounded from 474 mg/day.
An assumption specified by Lynch et al. (2007) is that an additional 30 percent calcium retention would meet the needs of 97.5 percent of this age group. This was calculated as 180 mg/day and is based on calcium absorptive efficiency for young children, and it is judged reasonable. This results in an estimated RDA for calcium of 700 mg/day calcium, with rounding.
Clearly, there are uncertainties when reliance is placed on a single study. The ability to study calcium requirements in a controlled study, however, does offer the ability to estimate an average requirement rather than an AI. The study is of high quality, and the reference values specified are in line with those specified for younger and older children.
Children 4 Through 8 Years of Age
The work of Abrams et al. (1999) and Ames et al. (1999) has indicated that, like that for younger children, an average calcium retention level of approximately 140 mg/day is consistent with the needs of bone accretion. However, there is evidence of a small increase during pre-puberty, yielding a calcium retention range of approximately 140 to 160 mg/day to allow for bone accretion across this age group of which a portion will be pre-pubertal. Using the factorial method (see Table 5-2) and from the non-linear dose–response relationship identified by the work of Ames
et al.(1999) and Abrams et al. (1999), a calcium intake of 800 mg/day could be expected to achieve the levels of calcium needed for bone accretion. Again, the assumption that another approximately 30 percent is needed to cover about 97.5 percent of the population—through derivation as mean estimates and the assumption of normal distribution—results in a calculated and rounded RDA value for calcium of 1,000 mg/day.
Again, as with younger children, there are relatively few studies available and most have small sample sizes. While the studies included some ethnic/racial diversity, they focused on girls. These limitations cannot be remedied at this time. However, the data are sufficiently robust to support an estimation of an average requirement of 800 mg/day calcium.
Children 9 Through 13 Years of Age and Adolescents 14 Through 18 Years of Age
As reviewed in Chapter 4, data from a recent study (Vatanparast et al., 2010) have provided bone calcium accretion levels for children and adolescents ranging from 92 to 210 mg/day. Average bone calcium accretion was included in the factorial method, and the intake levels can be estimated as shown in Table 5-2.
While the committee was aware of data suggesting that calcium retention may vary by gender among children, these differences between girls and boys and between the 9- to 13- and 14- to 18-year age groups are relatively small quantitatively, and the limited nature of the data do not allow further specification of these differences to the extent they are real. Given the application of DRI values in real world settings such as school meal planning, recommending that boys receive a small amount more calcium than girls is not practicable, but it is also not warranted given the limited nature of the data suggesting this possibility. Additionally, there is wide variability in the onset of puberty and the pubertal growth spurt, and it is reasonable to conclude that increases in calcium intake may be needed early in puberty at times when children may be only 9 or 10 years old. Thus, for reference values for both boys and girls in the 9- to 13- and 14- to 18-year life stages, the differences in calcium intake to achieve mean bone calcium accretion as elucidated by Vatanparast et al. (2010) have been interpolated between 9- to 18-year old girls (1,037) and boys (1,224). This interpolation yields an estimated mean need for calcium for boys and girls of 1,100 mg/day with rounding, a value approximately at the midpoint between the two groups. Again, assuming a normal distribution, this estimate to achieve a mean calcium accretion represents the median and, thus, an EAR. The EAR is therefore set at 1,100 mg for both boys and girls for both life stages encompassed by the 9 through 18 year age range. In order to cover 97.5 percent of the population, an estimated RDA value for calcium of 1,300 mg/day is established.
The uncertainties surrounding the reference value stem from reliance on primarily a single study. Although carefully carried out, the study included only white children. These newer data, however, provide the opportunity to identify an average requirement.
Adults 19 Through 50 Years of Age
|
While there is evidence of minor bone accretion into early adulthood, the levels required to achieve this accretion—which appears to be site dependent—are very low. The goal, therefore, is intakes of calcium that promote bone maintenance and neutral calcium balance.
The report from Hunt and Johnson (2007) provides virtually the only evidence for these life stage groups. Based on a series of controlled calcium balance studies, they have established a calcium intake level of 741 mg/day to maintain neutral calcium balance. They further provide the 95 percent prediction interval around the level required for neutral calcium balance.
Other available measures that relate to bone maintenance include bone mineral density (BMD), but studies that measured bone mass concomitant to calcium intake are highly confounded by failures to control for other variables that impact bone mass and to specify a dose–response relationship. There is no evidence that intakes of calcium higher than those specified by Hunt and Johnson (2007) offer benefit for bone health in the context of bone maintenance for adults 19 to 50 years of age. Osteoporotic fracture is not a relevant measure for this life stage, therefore extrapolating from the more prevalent data focused on older adults is not appropriate, nor is extrapolating from the data for younger persons for whom the concern is bone accretion.
Therefore, the Hunt and Johnson (2007) data, which reflect the outcomes of a series of metabolic studies, provide a reasonable basis for an EAR for calcium of 800 mg/day calcium. That is, the observed value of 741 mg/day is rounded, but rounded up to 800 mg/day given the uncertainty. The upper limit of the 95 percent prediction interval around this estimate (1,035 mg/day) is appropriate as the basis for an RDA for calcium and rounded to 1,000 mg/day. As is the case with younger life stage groups, there is now the 2007 Hunt and Johnson study on the topic of calcium and bone health, which has allowed the estimation of an average requirement.
However, the data are still very sparse, and the DRI for this age group relies on one study, albeit a well-controlled and carefully analyzed study.
Adults 51 Years of Age and Older
|
Men and Women 51 Through 70 Years of Age
The natural process of bone loss begins to manifest itself in the latter stages of adulthood. It begins earlier for women than for men as a result of the onset of menopause, which usually occurs when women reach 50 to 55 years of age. By the time both men and women have reached 70 or more years of age, each are experiencing bone loss. However, women—who have been undergoing the loss longer—are more at risk for adverse consequences. It is important to underscore that the goal of calcium intake during these life stages is to lessen the degree of bone loss; calcium intake at any level is not known to prevent bone loss.
Although calcium absorption (active calcium transport) has been reported to decrease with age (Avioli et al., 1965; Bullamore et al., 1970; Alevizaki et al., 1973; Gallagher et al., 1979; Tsai et al., 1984), it is challenging to consider higher calcium intake as a remedy given that calcium intake must be extremely high to have an effect on calcium uptake via passive absorption (i.e., paracellular transport, see Chapter 2).
The relative lack of data pertaining to bone changes in men as they age has received comment (Orwoll et al., 1990). It has been pointed out that cross–sectional data suggest that, overall, the rate of bone loss in men is substantially slower than that in women, and men have a lower incidence of fractures (Khosla et al., 2008); perhaps this accounts for the lack of research focused on this group. The limited available trials and observation studies (e.g., Osteoporotic Fractures in Men [MrOS] study) concerning bone health focus on men older than the 5 through 70 year age range (usu-
ally > 65 years) and typically include vitamin D administration. Likewise, organizations such as the National Osteoporosis Foundation have issued guidelines that do not stipulate BMD testing for men until the age of 70 years (NOF, 2008), whereas they recommend BMD testing at an earlier age for women. Given this context, the data from Hunt and Johnson (2007) with respect to neutral calcium balance among adults can provide some information for specifying requirements among men between the ages of 51 and 70 years. Although there were only two men over the age of 50 years in the Hunt and Johnson (2007) study, the absence of evidence that significant changes occur in skeletal maintenance for men in their 50s and 60s results in the assumption that their needs are akin to those of younger men. Therefore, the calcium EAR and RDA for men 51 to 70 years of age are set at the same levels as for persons 31 to 50 years of age: the EAR for calcium is established as 800 mg/day, and the RDA for calcium is 1,000 mg/day. The newer calcium balance data are used with caution, given its limitations for this purpose.
Women 51 through 70 years of age are considered separately from men. Although it is evident that calcium intake does not prevent bone less during the first few years of menopause, there is the question of whether or to what extent calcium intake can mitigate the loss of bone during and immediately following the onset of menopause. Although about half of the women in the Hunt and Johnson (2007) study were over the age of 50, the authors did not stratify on the basis of menopausal status. Therefore, there are some uncertainties surrounding the use of these newer calcium balance data for the purposes of determining an EAR and RDA for women. However, other information is available that can be useful. Absolute hip fracture rates are lower than for women in this age rang than for women over the age 70 but still greater than for premenopausal women. Moreover, BMD is a reliable predictor for fracture risk later in life and therefore becomes a useful measure for DRI purposes.
The available data for BMD among women 51 through 70 years of age provide mixed results concerning the relationship between BMD and calcium intake in menopausal women. This may be due in part to study protocols—which usually have relied on a single dose of 1,000 mg or more daily—that have failed to clarify background diet or estimate total intake. On balance, there is somewhat more evidence for a benefit of higher calcium intake among women over the age of 60 years, a group that is likely about half of the DRI life stage of women 51 through 70 years of age. Specifically, the meta-analysis conducted by Tang et al. (2007), which included studies in women ranging in mean age from 50 to 85 years, indicated that total calcium intake alone equal to 1,200 mg or more per day had a positive effect on BMD as well as a modest (relative risk [RR] = 0.88; 95%
confidence interval [CI]:0.83–0.95), but significant, effect on fracture risk reduction. In breaking down the meta-analysis further, there were six studies of more than 1,100 women with a mean age of 60 years who received additional calcium without vitamin D compared with placebo. The average calcium supplementation was 1,100 mg/day in the treated group, and those women had risk reduction for hip fracture and significant increases in both hip and spine BMD.
Further, evidence from the Women’s Health Initiative trial (WHI) (Jackson et al., 2006) conducted using 36,282 women ages 50 to 79 years indicated that participants who were randomized to 1,000 mg of calcium plus 400 International Units (IU) of vitamin D per day experienced a small, but significant, improvement in hip bone density and a modest reduction in hip fractures, although the change in hip fracture risk was not statistically significant. A subgroup analysis indicated that women over the age of 60 years also experienced a small but statistically non-significant reduction in hip fracture risk (hazard ratio [HR] = 0.74; 95 percent CI 0.52–1.06) compared with those randomized to placebo. These data are taken into account cautiously for several reasons. The WHI study may be confounded by both hormone replacement therapy considerations as well as the inclusion of vitamin D, although the supplementation level of vitamin D was relatively low. The appropriateness of conducting a subgroup analysis for fracture risk, although interesting, is always considered questionable. Further, the same subgroup analysis revealed that women between the ages of 50 and 60 years experienced a greater hip fracture risk when they were supplemented with calcium and vitamin D. The absolute risk of hip fractures for women 50 to 60 years of age is derived from a small number of fractures per total cohort (i.e., 13 fractures in 6,694 women 50 to 60 years of age). The Tang et al. (2007) meta-analysis is compromised by the inability to study a true dose–response relationship; many studies were grouped at the 1,200 mg/day level of intake and could not be used to reveal the effects at lower levels of intake.
Within the confines of these limitations, there is nonetheless the emerging conclusion that in regard to the relevant indicator for this group, that is, BMD, a somewhat higher intake of calcium than required by men or suggested by the newer calcium balance data is justified for all postmenopausal women within the life stage 51 through 70 years. Not unexpectedly, absolute hip fracture rates are very low in the 50- to 60-year age group (e.g., 0.03 percent per year in WHI), and therefore fracture risk is not a particularly relevant factor, although to the extent that a subgroup analysis can be relied upon, women greater than 60 years of age appear to experience some benefit from calcium intake relevant to fracture risk reduction.
It would appear that the life stage consisting of women 51 through
70 years of age reflects a diverse set of physiological conditions—notably premenopausal, perimenopausal, and postmenopausal—with respect to the condition of bone health, and cannot be reliably characterized as a homogeneous single group for the purpose of deriving EARs and RDAs for calcium. Some may benefit from increased calcium, and some may not. Further, there is considerable variability in the age of onset of menopause, and so assumptions about the proportion of this age group that may or may not benefit cannot be made. Therefore, to ensure public health protection and to err on the side of caution, preference is given to covering the apparent benefit for BMD with higher intakes of calcium for postmenopausal women within this group. The EAR for women 51 through 70 years is set at 1,000 mg calcium per day. The addition of 200 mg/day to the estimates provided by Hunt and Johnson (2007) gives a reasonable margin of safety for lessening bone loss to the extent that is possible and is reasonably consistent with data from the existing intervention trials. Further, the value of 1,000 mg/day is still within the 95 percent prediction interval offered by Hunt and Johnson (2007) for a value that encompasses a wider range of persons than younger menopausal women. Although this does result in a different DRI for women than for men in the 51 through 70 year age group, the physiological differences and apparent response to increased calcium intake evidenced from randomized trials warrants this difference.
As there is no reason to assume that requirements for this life stage are not normally distributed, the approximate 20 to 30 percent addition to achieve the level needed to cover 97.5 percent of the population results in an estimated RDA of 1,200 mg/day. The level errs in the direction of a lower value given concerns about an upper level of intake (see Chapter 6).
This reference value for women 51 to 70 years of age is notably uncertain and reflects a decision to provide public health protection in the face of inconsistent data. It also identifies menopausal women between the ages of 51 and 70 years as the basis for the reference value, rather than nonmenopausal women, on the assumption that during this life stage many and eventually all will become menopausal. The value cannot be more certain until such time as there is information on calcium balance specifically for women experiencing the early stages of menopause, as well as well-controlled trials that more clearly elucidate dose–response measures for menopausal younger women relative to calcium intake and bone health.
Adults >70 Years of Age
Bone loss and the resulting osteoporotic fractures are the predominant bone health concern for persons >70 years of age. Although measures to ascertain fracture risk are often self-reported and can be challenging to
verify, fracture risk represents the best measure for bone health for this life stage. One important caution is that the estimation of the effect of fracture risk is greatly complicated by the limited evidence concerning dose–response data relative to calcium intake. Importantly, calcium balance studies to determine the levels of calcium that result in neutral calcium balance are lacking in the literature for persons over the age of 70 years. Hunt and Johnson (2007) were able to incorporate only two women over the age of 70 years.
The analysis of Tang et al. (2007) is limited by the nature of the studies available, in that most studies tested intervention levels at or above 1,200 mg/day and often did not report total calcium intake. Those studies in the Tang et al. (2007) analysis that examined calcium alone, without vitamin D supplementation, were few. The authors’ conclusion that 1,200 mg/day was beneficial relative to reduced fracture risk is relevant, but may be compromised by the inability to examine the effectiveness at other levels. In contrast to the Tang et al. (2007) analysis, Peacock et al. (2000), Grant et al. (2005), and Prince et al. (2006), who studied calcium intake alone, were unable to demonstrate benefits for bone health among persons over 70 years of age with supplemental calcium intakes (750 to 1,200 mg/day); however, a compliance sub-analysis conducted by Prince et al. (2006) suggested reduced fracture incidence with calcium supplementation of 1,200 mg/day.
The data available do not clearly elucidate a requirement for calcium and primarily suggest values that may result in covering nearly all of the population group in terms of reduced fracture risk. That is, the available studies were not examining the levels of calcium intake that were effective, but rather were examining whether their administered calcium intake was effective. Further, the benefit of calcium supplementation was evident in the case of sub-analysis on the basis of compliance, which, while informative, are not ideal data sets. In addition, the populations studied varied considerably, many could be considered at high risk (such as institutionalized older persons and persons with low body weight), and the effect of calcium supplementation was usually not taken into account in the context of vitamin D status or existing calcium nutriture.
For this reason, public health protection was considered, and it was determined that a requirement somewhat above that established by calcium balance studies for bone maintenance was appropriate despite the unknowns and the inability to clearly estimate a dose–response for calcium relative to fracture risk. As with those estimates used for postmenopausal women, a 200 mg/day calcium increment was added to the estimated requirements for younger persons, resulting in an EAR value of 1,000 mg of calcium per day. It is assumed that the rapid and notable bone loss ob-
served for early menopause has ceased, and the bone loss for women in this life stage group is similar to that experienced by men. The estimation of an RDA to cover more than 97.5 percent of the life stage group consistent with normally distributed data results in an RDA of 1,200 mg/day, again in the face of concerns about high levels of intake (see Chapter 6).
Pregnancy and Lactation
|
Pregnancy
The EAR for non-pregnant women and adolescents is appropriate for pregnant women and adolescents based on the randomized controlled trials (RCTs) of calcium supplementation during pregnancy that reveal no evidence that additional calcium intake beyond normal non-pregnant requirements has any benefit to mother or fetus (Koo et al., 1999; Jarjou et al., 2010). Consistent with the RCT data indicating the appropriateness of the non-pregnant EAR and RDA for the pregnant woman is (1) the epidemiologic evidence suggesting that parity is associated with a neutral or even a protective effect relative to maternal BMD or fracture risk (Sowers, 1996; Kovacs and Kronenberg, 1997; O’Brien et al., 2003; Chantry et al., 2004), and (2) the physiologic evidence that maternal calcium needs are met through key changes resulting in a doubling of the intestinal fractional calcium absorption, which compensates for the increased calcium transferred to the fetus (200 to 250 mg/day) and potentially some transient mobilization of maternal bone mineral, particularly in the late third trimester.
Overall, it appears that pregnant adolescents make the same adaptations as pregnant women, and there is no evidence of adverse effects of pregnancy on BMD measures among adolescents.
The EARs are thus 800 mg/day for pregnant women and 1,100 mg/day for pregnant adolescents. Likewise, the RDA values for non-pregnant women and adolescents are applicable, providing RDAs of 1,000 mg/day and 1,300 mg/day, respectively.
Lactation
The EAR for non-lactating women and adolescents is appropriate for lactating women and adolescents based on (1) the strong evidence of physiologic changes resulting in a transient maternal bone resorption to provide the infant with calcium (Kalkwarf et al., 1997; Specker et al. 1997; Kalkwarf, 1999) and (2) evidence from RCTs and observational studies that increased total calcium intake does not suppress this maternal bone resorption (Cross et al., 1995; Fairweather-Tait et al., 1995; Prentice et al., 1995; Kalkwarf et al., 1997; Laskey et al., 1998; Polatti et al., 1999) or alter the calcium content of human milk (Kalkwarf et al., 1997; Jarjou et al., 2006). Post-lactation maternal bone mineral is restored without consistent evidence that higher calcium intake is required, as based on two RCTs (Cross et al., 1995; Prentice et al., 1995) and several observational studies (Sowers, 1996; Kovacs and Kronenberg 1997; Kalkwarf, 1999).
Adolescents, like adults, resorb bone during lactation and recover fully afterward with no evidence that lactation impairs achievement of peak bone mass (Chantry et al., 2004).
The EARs are thus 800 for lactating women and 1,100 mg/day for lactating adolescents. Likewise, the RDA values for non-lactating women and adolescents are applicable, providing RDAs of 1,000 and 1,300 mg/day, respectively.
VITAMIN D: DIETARY REFERENCE INTAKES FOR ADEQUACY
The EARs, RDAs, and AIs for vitamin D are shown in Table 5-3 by life stage group. The identical EARs across age groups are notable and, as discussed below, reflect the concordance of serum 25OHD levels with the integrated bone health outcomes as well as the lack of an age effect on the simulated dose–response. Studies used to estimate these values have been included in Chapter 4 in the review of potential indicators.
While at the outset the consideration of vitamin D requirements recognizes that humans are physiologically capable of obtaining vitamin D
TABLE 5-3 Vitamin D Dietary Reference Intakes (DRIs) for Adequacy (amount/day)
|
Life Stage Group |
AI |
EAR |
RDA |
|
Infants |
|
|
|
|
0 to 6 mo |
400 IU (10 µg) |
— |
— |
|
6 to 12 mo |
400 IU (10 µg) |
— |
— |
|
Children |
|
|
|
|
1–3 y |
— |
400 IU (10 µg) |
600 IU (15 µg) |
|
4–8 y |
— |
400 IU (10 µg) |
600 IU (15 µg) |
|
Males |
|
|
|
|
9–13 y |
— |
400 IU (10 µg) |
600 IU (15 µg) |
|
14–18 y |
— |
400 IU (10 µg) |
600 IU (15 µg) |
|
19–30 y |
— |
400 IU (10 µg) |
600 IU (15 µg) |
|
31–50 y |
— |
400 IU (10 µg) |
600 IU (15 µg) |
|
51–70 y |
— |
400 IU (10 µg) |
600 IU (15 µg) |
|
> 70 y |
— |
400 IU (10 µg) |
800 IU (20 µg) |
|
Females |
|
|
|
|
9–13 y |
— |
400 IU (10 µg) |
600 IU (15 µg) |
|
14–18 y |
— |
400 IU (10 µg) |
600 IU (15 µg) |
|
19–30 y |
— |
400 IU (10 µg) |
600 IU (15 µg) |
|
31–50 y |
— |
400 IU (10 µg) |
600 IU (15 µg) |
|
51–70 y |
— |
400 IU (10 µg) |
600 IU (15 µg) |
|
> 70 y |
— |
400 IU (10 µg) |
800 IU (20 µg) |
|
Pregnancy |
|
|
|
|
14–18 y |
— |
400 IU (10 µg) |
600 IU (15 µg) |
|
19–30 y |
— |
400 IU (10 µg) |
600 IU (15 µg) |
|
31–50 y |
— |
400 IU (10 µg) |
600 IU (15 µg) |
|
Lactation |
|
|
|
|
14–18 y |
— |
400 IU (10 µg) |
600 IU (15 µg) |
|
19–30 y |
— |
400 IU (10 µg) |
600 IU (15 µg) |
|
31–50 y |
— |
400 IU (10 µg) |
600 IU (15 µg) |
|
NOTE: AI = Adequate Intake; EAR = Estimated Average Requirement; IU = International Unit; RDA = Recommended Dietary Allowance. |
|||
through exposure to sunlight, the estimation of DRIs for vitamin D immediately requires a plethora of related considerations ranging from factors that affect and alter sun exposure and vitamin D synthesis, to public health recommendations regarding the need to limit sun exposure to avoid cancer risk. Just as importantly, the available data have not sufficiently explored the relationship between total intake of vitamin D per se and health outcomes. In short, a dose–response relationship between vitamin D intake and bone health is lacking. Rather, measures of serum 25OHD levels as a biomarker of exposure (i.e., intake) are more prevalent.
After considering the available evidence, including data published
after the 2009 analysis by the Agency for Healthcare Research and Quality (Chung et al., 2009), hereafter referred to as AHRQ-Tufts, the committee concluded:
-
A dose–response relationship can be simulated based on serum 25OHD measures. That is, serum 25OHD levels can reflect intake, and there are studies that relate bone health outcomes to serum 25OHD levels, as described in Chapter 4.
-
Newer data provide the ability to link vitamin D intakes to the change in serum 25OHD level under conditions of minimal sun exposure, thereby reducing the confounding introduced by the effect of sun exposure on serum 25OHD concentrations. These data also provide an approach for estimating dietary reference values related to intakes that will achieve targeted serum 25OHD concentrations, albeit without regard to the contributions from sun exposure.
Generally, association studies that use a biomarker of exposure in relation to health outcomes can present challenges when establishing reference values. Such measures are not necessarily valid or reliable markers, and they can be subject to considerable confounding by a host of variables. In the case of vitamin D, there are certain factors that allow more confidence in using this measure in the estimation of reference values. Specific deficiencies of vitamin D lead to recognized, measurable deficiency states with adverse effects on the indicator of interest, in this case bone health as evidenced by rickets and osteomalacia. The next consideration is whether the biomarker is an accurate reflection of intake. In the case of serum 25OHD concentrations, despite the lack of clarity about the impact of a number of variables on serum 25OHD concentrations, the measure can be reasonably associated with total intake when sunlight exposure is minimal.
On this basis, serum 25OHD concentrations were used to simulate a dose–response relationship for bone health. Next, the available data—notably those obtained under conditions of limited sun exposure—were integrated in order to estimate a total intake that would result in the desired serum 25OHD relative to measures of bone health. This step-wise process for simulating a dose–response relationship for vitamin D considered, first, the relevance to this study of the confounding introduced by 25OHD assay methodologies and related measurement problems, including “assay drift.” Next, the data from three bodies of evidence described in Chapter 3—the relationship between calcium absorption and serum 25OHD levels; serum 25OHD levels and bone health in children; and serum 25OHD levels and bone health in older adults—were summarized and used to specify a dose–response curve for serum 25OHD. Interestingly, concordance of
serum 25OHD levels and bone health for median requirements emerged across all age groups. Finally, the relationship between changes in vitamin D intake and changes in serum 25OHD concentrations was considered.
Simulation of a Dose–Response Relationship for Vitamin D Intake and Bone Health
“Assay Drift” and Implications for Interpretation of Serum 25OHD Data in the Literature
In considering serum 25OHD levels as reported by various studies, the committee was aware of the so-called “assay drift” associated with longitudinal comparison of assay results collected in the National Health and Nutrition Examination Survey (NHANES), as well as the large inter-laboratory variation worldwide (Carter et al., 2010) and the differences in performance characteristics between the various antibody-based and liquid chromatography (LC)-based assays. Although it was reported that a consistent assay bias was recognized within the NHANES data for certain time periods (2000–2006)1, this assay drift as described in Chapter 3 is small in comparison with the inter-laboratory variation or the methodological differences observed in data from the Vitamin D External Quality Assurance Scheme (DEQAS)(Carter et al., 2010).
Accordingly, for the purposes of this study, a correction of data based on knowledge of assay drift was neither practical nor necessary for the determination of DRI values. The NHANES assay drift applies to certain data analyzed within a known time frame (2004–2006), but at the same time other data using similar methods might have experienced drift that was unknown and therefore could not be accounted for or corrected. Moreover, the dispersion of serum 25OHD levels across the range of vitamin D intakes is very large, as exemplified by data from Millen et al. (2010).
Although methodological issues contribute to uncertainty in comparing data among studies, the differences in serum 25OHD over time due to assay drift are relatively small and thus inconsequential when viewed relative to other sources of biological variation. In essence, assay drift is considered to be a component of the noise within the signal, and one of the contributors to uncertainty. But for DRI purposes it did not require re-evaluation or normalization of data. Regarding NHANES data specifically as they were used by the committee as a basis for the intake assessment (Chapter 7), the ramifications of “assay drift” are more significant
|
1 |
Centers for Disease Control and Prevention (CDC). Available online at http://www.cdc.gov/nchs/data/nhanes/nhanes3/VitaminDanalyticnote.pdf (accessed July 8, 2010). |
for longitudinal comparisons, which were not a component of the intake assessment.
Conclusions Regarding Data for Serum 25OHD and Bone Health
The evidence presented in Chapter 4 allows the following conclusions about serum 25OHD concentrations relative to DRI development:
-
Calcium absorption
Given that an identified key role of vitamin D is to enhance calcium absorption, evidence regarding the level of serum 25OHD associated with maximal calcium absorption is relevant to establishing a dose–response relationship for serum 25OHD level and bone health outcomes. As outlined in Chapter 4, for both children and adults there was a trend toward maximal calcium absorption between serum 25OHD levels of 30 and 50 nmol/L, with no clear evidence of further benefit above 50 nmol/L.
-
Rickets
In the face of adequate calcium, the risk of rickets increases below a serum 25OHD level of 30 nmol/L and is minimal when serum 25OHD levels range between 30 and 50 nmol/L. Moreover, when calcium intakes are inadequate, vitamin D supplementation to the point of serum 25OHD concentrations up to and beyond 75 nmol/L has no effect.
-
Serum 25OHD level and fracture risk: Randomized clinical trials using adults
Because available trials often administered relatively high doses of vitamin D, serum 25OHD concentrations varied considerably. Although some studies suggested that serum 25OHD concentrations of approximately 40 nmol/L are sufficient to meet bone health requirements for most people, findings from other studies suggested that levels of 50 nmol/L and higher were consistent with bone health. Given that causality has been established between changes in serum 25OHD levels and bone health outcomes, information from observational studies can be useful in determining the dose–response relationship.
-
Serum 25OHD level and fracture risk: Observational studies using adults
Melhus et al. (2010) found that serum 25OHD levels below 40 nmol/L predicted modestly increased risk of fracture in elderly men, but there was no additional risk reduction above 40 nmol/L,
-
suggesting maximum population coverage at 40 nmol/L. In contrast, Ensrud et al. (2009) observed that men with 25OHD levels below 50 nmol/L had greater subsequent rates of femoral bone loss, and there was no additional benefit from serum 25OHD concentrations higher than 50 nmol/L, suggesting maximum population coverage at 50 nmol/L. Still other studies suggested that somewhat higher serum 25OHD concentrations were needed to provide maximum population coverage. For example, Cauley et al. (2008), in a prospective cohort study, reported that serum 25OHD concentrations in the range of 60 to 70 nmol/L were associated with the lowest risk of hip fracture; above this level, risk was reported to increase, but not significantly. Looker and Mussolino (2008), using NHANES data, found that, among individuals with serum 25OHD levels above 60 nmol/L, the risk of hip fracture was reduced by one-third. The van Schoor et al. (2008) study reported that in more than 1,300 community-dwelling men and women ages 65 to 75 years, serum 25OHD levels less than or equal to 30 nmol/L were associated with a greater risk of fracture. Cauley et al. (2010) noted that men in the MrOs cohort with levels of serum 25OHD less than 50 nmol/L experienced a significant increase in hip fracture risk that was attenuated somewhat when considering hip BMD.
-
Osteomalacia from postmortem observational study
Data from the work of Priemel et al. (2010) have been used by the committee to support a serum 25OHD level of 50 nmol/L as providing coverage for at least 97.5 percent of the population. The data, however, do not allow specification of serum 25OHD levels above which half of the population is protected from osteomalacia and half is at risk; rather the evidence indicated that even relatively low serum 25OHD levels were not associated with the specified measures of osteomalacia, mostly likely owing to the impact of calcium intake. This is consistent with a number of studies, both from trials and from observational work, indicating that vitamin D alone appears to have little effect on bone health outcomes; it is most effective when coupled with calcium.
The wide variation in the precise relationship of serum 25OHD levels to any specific outcome for bone health is evident in the discussion above and the conclusion of the 2007 AHRQ report (Cranney et al., 2007; hereafter referred to as AHRQ-Ottawa) that a specific threshold serum 25OHD level could not be established for rickets. Nonetheless, the committee found a striking concordance of the data surrounding serum 25OHD lev-
els across several of the specific outcomes and across age groups, which, in turn, allows an estimation of serum 25OHD concentrations that are consistent with an EAR- and RDA-type reference value when the indicators of bone health are integrated (see Figure 5-1). As shown above, the levels range between 30 and 50 nmol/L, respectively, for the EAR and the RDA. Further, the higher level of 75 nmol/L proposed by some as “optimal” and hence consistent with an RDA-type reference value is not well supported.
The congruence of the data links serum 25OHD levels below 30 nmol/L with the following outcomes: increased risk of rickets, impaired fractional calcium absorption, and decreased bone mineral content (BMC) in children and adolescents; increased risk of osteomalacia and impaired fetal skeletal outcomes; impaired fractional calcium absorption and an increased risk of osteomalacia in young and middle-aged adults; and impaired fractional calcium absorption and fracture risk in older adults. Similarly, for all age groups, there appears to be little causal evidence of additional benefit to any of these indicators of bone health at serum 25OHD levels above 50 nmol/L, suggesting that this level is consistent with an RDA-type reference value in that this value appears to cover the needs of 97.5 percent of the population. For some bone health outcomes, such as BMD
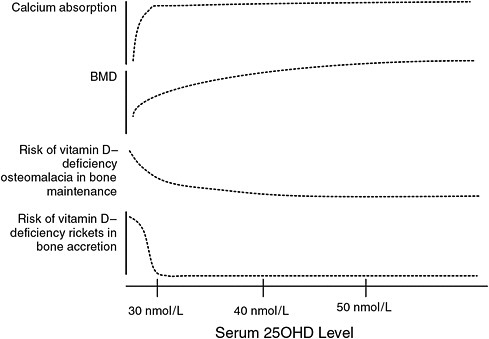
FIGURE 5-1 Conceptualization of integrated bone health outcomes and vitamin D exposure.
in adults, the results of the available RCT(s) show a negative relationship between serum 25OHD level and outcome, and the available observational studies yield mixed results. In addition, for several of these specific outcomes, the RCTs that show benefit for what is generally a single tested dose of supplemental vitamin D do not allow inference of intermediate levels of 25OHD in serum between the placebo and dose. When evaluating the congruence of the data, the committee, therefore, looked at the lowest effective dose and the achieved serum 25OHD level. Uncertainty does exist for the selected serum 25OHD levels consistent with an EAR- and RDA-type level; this uncertainty stems from the wide range of effects and relationships and the lack of a relevant dose–response relationship.
Overall, when the data are examined for an EAR-type of serum 25OHD concentration—that is, a median type of value, a level above which approximately half the population might meet requirements and below which one-half might not—the data do not specifically provide such information, although this value can be concluded to lie between 30 and 50 nmol/L for all age groups. This is likely due to the unique inter-relationship between calcium and vitamin D. At lower levels of vitamin D, there appears to be a compensation on the part of calcium, and calcium intake can overcome the marginal levels of vitamin D. Calcium appears to be the more critical nutrient in the case of bone health, and therefore has an impact the dose–response relationship. Therefore, calcium or lack thereof may “drive” the need for vitamin D.
In the case of vitamin D—or more precisely serum 25OHD concentrations—the data, especially for adults, do not lend themselves readily to the usual DRI model, which is based on the assumption that data concerning a median intake will be as available or even more prevalent than data concerning coverage for most of the population. The standard model specifies, based on the assumption of a normal distribution for requirements, that the average or median requirement (i.e., the EAR) is used to calculate the RDA. This unanticipated situation is primarily evident for adults for whom it is not possible to estimate the level of 25OHD in serum at which 50 percent of the population is at increased risk of osteomalacia. Rather, in this case, the data allow a better estimation of the serum 25OHD level that likely covers most persons in the population. In children and adolescents, however, and to some extent in adults, the integration of these indicators as shown in Figure 5-1 enables an approximation of a level of serum 25OHD at which the risk of adverse bone health outcomes increases; however, there is uncertainty associated with this value given the limitations of the data at present. Thus, for children and adolescents, a serum 25OHD level of 40 nmol/L from the middle of the range of 30 to 50 nmol/L, at which risk to the population is increasing, was selected to serve as the targeted level for a median dietary requirements. For adults, the evidence that most are covered by a serum 25OHD level of 50 nmol/L is used
as the starting point, and a value of 40 nmol/L is estimated as the targeted level for a median dietary requirement.
Overall, as shown in Figure 5-1, the data suggest that 50 nmol/L can be set as the serum 25OHD level that coincides with the level that would cover the needs of 97.5 percent of the population. The serum 25OHD level of 40 nmol/L serum 25OHD is consistent with the median requirement. The lower end of the requirement range is consistent with 30 nmol/L, and deficiency symptoms may appear at levels less than 30 nmol/L depending upon a range of factors. What remains is to ascertain the level of vitamin D intake that would achieve these levels of 25OHD in serum.
Integration of Data to Estimate Vitamin D Intakes to Achieve Serum 25OHD Concentrations
As diet is not necessarily the only source of vitamin D for the body, it would be ideal if the relative contribution made by sunlight to the overall serum 25OHD levels could be quantified, thereby clearing the path to better estimate total intakes of the nutrient needed to maintain a specified serum 25OHD level associated with the health outcome. In fact, however, the examination of data related to dietary recommendations about vitamin D is complicated by the confounding that sun exposure introduces, especially because the factors that affect sun exposure—such as skin pigmentation, genetics, latitude, use of sunscreens, cultural differences in dress, etc.—are not clearly measured and controlled for in research studies and in some cases not fully understood. Further, and just as critically, vitamin D requirements cannot be based on an accepted or “recommended” level of sun exposure as a means to meet vitamin D requirements, because existing public health concerns about sun exposure and skin cancer preclude this possibility. The absence of studies to explore whether a minimal-risk ultraviolet B (UVB) exposure relative to skin cancer exists to enable vitamin D production has been noted (Brannon et al., 2008).
Instead, the best remaining approach is to describe the relationship between total intake and serum 25OHD levels under conditions of minimal sun exposure. In doing so, the committee made the assumption that the outcomes, therefore, would reflect only a very small component attributable to sun exposure as would occur naturally in free-living individuals in winter in the northern hemisphere. This approach to DRI development requires that persons who use the DRI values for health policy or public health applications adjust their considerations relative to adequacy of the diet based on whether the population of interest is minimally, moderately, or highly exposed to sunlight. As mentioned previously, the potential contribution from body stores remains unknown and thus introduces uncertainty. Further, the application of the DRIs relative to assessing the
adequacy of vitamin D intake/exposure for the population (foods, supplements, and sun exposure) would benefit from consideration of the serum 25OHD concentrations in the population of interest.
The committee examined information from controlled trials in younger and older adults and in children that could be used in the simulation to describe the relationship between vitamin D intake and changes in serum 25OHD concentrations. Of interest was the condition of minimal sun exposure, which occurs in northern latitudes and in Antarctica during their respective winters. The focus was clinical trials in Europeans or North Americans in which baseline total intake was measured or could be reliably estimated using peer-reviewed published data on baseline intakes of the population studied. In this way, the total intake of vitamin D (baseline plus supplement) was known or could be reliably estimated at latitudes greater than 50°N during late fall (October) through early spring (April) or in Antarctica during its fall (March) through its winter (October). These studies are summarized in Table 5-4. Studies needed to report measured serum 25OHD levels as means or medians with estimates of variance (standard deviation [SD], CI, or inter-quartile ranges) are included. Some studies in the United State at 40°N to 46°N were identified that met all inclusion criteria except that of latitude. These are also included in Table 5-4.
In reviewing these studies, most of which were published in the past 2 years, the committee noted the variability in the declines in serum 25OHD levels during the winter seasons in the respective hemispheres and the existence of a non-linear response to doses of vitamin D. These are discussed below prior to the description of the simulated dose–response analysis.
Winter season change in serum 25OHD levels across age groups As shown in Figure 5-2, the serum 25OHD levels of the placebo groups in the studies conducted with children (Viljakainen et al., 2006) and with younger, middle-aged, and older adults (Cashman et al., 2008, 2009; Smith et al., 2009) decreased over a wide range during the winter season at each latitude. In one study where participants started the season with lower baseline serum 25OHD levels (i.e., 36 nmol/L), the concentrations decreased only slightly (i.e., to 34 nmol/L) (Smith et al., 2009). However, in other studies where participants began the season with higher baseline serum 25OHD levels (i.e., 57 to 66 nmol/L, respectively) the serum 25OHD levels decreased more (i.e., to 34 and 43 nmol/L, respectively) (Viljakainen et al., 2006; Cashman et al., 2008, 2009), compared with those participants with lower baseline levels. In short, the decline in serum 25OHD levels in the placebo arm of these studies appears to be greatest when initial serum 25OHD levels are higher. Slightly higher intake of vitamin D (of approximately 10 to 150 IU/day, compared with other studies) in the study with
TABLE 5-4 Key Studies on the Response of Serum 25OHD Levels to Total Dietary Vitamin D Intake in Children and Adolescents, Young and Middle-Aged Adults, and Older Adults During the Winter at High Northern Latitudes and in Antarctica When Sun Exposure Is Minimal and at Lower Northern Latitudes When Sun Exposure Is Reduced
|
Reference; Type of Study |
Location (Latitude) |
Season (Duration) |
Population Description |
Baseline Vitamin D Intake (IU/day) |
Baseline 25OHD Level (nmol/L) |
Vitamin D Dose (IU/day) |
Total Vitamin D Intake (IU/day) |
Achieved 25OHD Level (nmol/L) |
|
Children and adolescents |
||||||||
|
Latitude ≥ 50°N |
||||||||
|
Ala-Houhala et al., 1988 |
Finland (61°N) |
February–March (1 y) |
8–10 y boys/girls n = 60 |
200a |
46.0 ± 15.5 (n = 27) |
0 |
200a |
43.3 ± 19.5 |
|
|
|
|
|
|
49.3 ± 19.0 (n = 24) |
400 |
600a |
71.3 ± 23.8 |
|
RCT |
|
|
|
|
|
|
|
|
|
Schou et al., 2003 |
Denmark (55°N) |
November–January (4 wk) |
6–14 y boys/girls n = 20 |
96a |
— |
0 |
96 |
33.7 ± 3.3 (n = 10) 32.3 ± 4.1 (n= 10) |
|
|
|
|
|
|
|
600 |
696b |
50.2 ± 4.5 (n = 10) 43.4 ± 2.9 (n = 10) |
|
Double-blind RCT/crossover |
|
|
|
|
|
|
|
|
|
Viljakainen et al., 2006 |
Finland (61°N) |
September–March (1 y) |
11 y girls n = 212 |
200 |
47.8 ± 18.2 (n= 73) |
0 |
200 |
42.8 |
|
|
|
|
|
188 |
46.3 ± 17.4 (n= 65) |
200 |
388 |
51.7 |
|
RCT |
|
|
|
|
|
|
|
|
|
|
|
|
|
196 |
46.7 ± 15.2 (n= 64) |
400 |
596 |
58.8 |
|
|
|
|
|
(FFQ; 10–14% using unspecified supplement) |
|
|
|
|
|
Latitude 40–49° N |
||||||||
|
Rajakumar et al., 2008 |
Pittsburgh, PA (40°N) |
December–April (1 mo) |
6–10 y boys/girls African American obese and nonobese n = 41 |
218 (obese) |
55.5 ± 24.0 |
400 |
618 |
65.5 ± 20.3 |
|
339 (nonobese) |
64.8 ± 24.3 |
400 |
738 |
72.8 ± 16.8 |
||||
|
Non-RCT |
|
|
(FFQ) |
|
|
|
|
|
|
Young and middle-aged adults |
||||||||
|
Latitudes ≥ 50°N and Antarctica |
||||||||
|
Cashman et al., 2009 |
Cork, Ireland (51°N) Cochrane, Northern Ireland (55°N) |
October/November–February/April (22 wk) |
mean 29.9 ± 6.2 y range 20–40 y men/women |
135 (80–200) |
65.7 (58.4–94.1) (n = 57) |
0 |
135 |
37.4 (31.4–47.9) |
|
Double-blind RCT |
|
172 (88–228) |
60.0 (50.0–89.7) (n = 48) |
200 |
372 |
49.7 (44.6–60.9) |
||
|
|
|
140 (92–188) |
72.2 (55.7–81.9) (n = 57) |
400 |
540 |
60.0 (51.0–69.1) |
||
|
|
|
|
|
144 (72–232) |
76.9 (55.9–89.3) (n = 53) |
600 |
744 |
69.0 (59.1–84.2) |
|
|
|
|
|
(FFQ) |
|
|
|
|
|
Smith et al., 2009 |
Antarctica (78°S) |
June/July–August (5 mo with 0, 18 wk, and 25 wk samples) |
39–44 y men/women |
302 (235–302) |
44 ± 18 (n = 18) |
400 |
659 |
55 ± 19 (18 wk) 57 ± 15 (25 wk) |
|
|
|
|
329 (328–352) |
44 ± 19 (n = 19) |
1,000 |
1,342 |
63 ± 20 (18 wk) 63 ± 25 (25 wk) |
|
|
Double-blind RCT |
|
|
||||||
|
|
|
|
356 (276–356) |
45 ± 14 (n = 18) |
2,000 |
2,305 |
71 ± 20 (18 wk) 71 ± 23 (25 wk) |
|
|
|
|
|
|
(Diet questionnaire) |
|
|
|
|
|
Reference; Type of Study |
Location (Latitude) |
Season (Duration) |
Population Description |
Baseline Vitamin D Intake (IU/day) |
Baseline 25OHD Level (nmol/L) |
Vitamin D Dose (IU/day) |
Total Vitamin D Intake (IU/day) |
Achieved 25OHD Level (nmol/L) |
|
Viljakainen et al., 2009 |
Helsinki, Finland (61°N) |
November–April (25 wk) |
21–49 y men |
264 ± 112 |
64.7 ± 18.5 (n = 16) |
0 |
264 |
52.2 (∆ −12.5 ± 9.1) |
|
|
|
304 ± 2,202 |
60.3 ± 11.6 (n = 16) |
412 |
716 |
75.4 (∆ +15.3 ± 2.3) |
||
|
Double-blind RCT |
|
|
|
|||||
|
|
|
|
|
344 ± 252 |
62.3 ± 13.6 (n = 16) |
760 |
1,104 |
90.1 (∆ +27.8 ± 17.5) |
|
|
|
(FFQ) |
|
|
|
|
||
|
Latitudes 40–49°N |
||||||||
|
Biancuzzo et al., 2010 |
Boston, MA (42°N) |
February–May (11 wk) |
mean 29–41 y range 18–79 y men and women including European Americans, Asian Americans, African Americans, North Americans, Hispanic Americans |
200c |
49.5 ± 24 (n = 15) |
0 |
200 |
45.3 ± 16.0 |
|
|
|
|
49.0 ± 27.8 (n= 20) |
1,000 D3 |
1,200 |
70.0 ± 27.5 |
||
|
Double-blind RCT |
|
|
|
|||||
|
|
|
|
|
41.5 ± 24.8 (n= 16) |
1,000 D2 |
1,200 |
68.5 ± 26.3 |
|
|
Harris and Dawson-Hughes, 2002 |
Boston, MA (42°N) |
December–April (8 wk) |
18–35 y |
132 |
48.9 ± 17.2 |
0 |
132 |
53.5 (∆ −4.6 ± 6.5)(n = 13) |
|
|
|
71 |
59.9 ± 16.4 |
800 |
871 |
82.4 (∆ 22.5 ± 14.7) (n = 14) |
||
|
|
|
|
|
(FFQ) |
|
|
|
|
|
RCT |
|
|
|
|
|
|
|
|
|
Heaney et al., 2003d |
Omaha, NE (41.2°N) |
October–March (120–140 d) |
38.7 ± 11.2 y |
< 200 (estimated from milk consumed) |
70.1 ± 5.8 |
0 |
< 200 |
52 |
|
|
72.0 ± 4.0 |
1,000 |
< 1,200 |
77.1 |
||||
|
|
|
|
69.3 ± 4.2 |
5,000 |
< 5,200 |
150 |
||
|
RCT |
|
|
|
|
||||
|
|
|
|
|
|
65.6 ± 6.3 |
10,000 |
< 10,200 |
212 |
|
Holick et al., 2008 |
Boston, MA (42°N) |
February–May (11 wk) |
mean 35.5–40.5 y men and women |
316c |
46.5 ± 22.2 (n = 55) |
0 |
316 |
47.0 ± 19.8 |
|
|
|
|
|
(Diet questionnaire used, but baseline intakes not reported) |
49.0 ± 27.8 (n = 20) |
1,000 (D3) |
1,316 |
72.3 ± 27.5 |
|
Double-blind RCT |
|
|
|
|||||
|
|
|
|
|
42.3 ± 26.3 (n = 16) |
1,000 (D2) |
1,316 |
67.0 ± 24.0 |
|
|
|
|
|
|
|
50.5 ± 26.0 (n = 18) |
500 D2 + 500 D2 |
1,316 |
71.0 ± 19.3 |
|
Li-Ng et al., 2009 |
Long Island, NY (40.7°N) |
December–March (3 mo) |
mean 58.1–59.3 y range 18–80 y including European Americans, African Americans, Asian Americans |
168.0 ± 146.5 |
63.0 ± 25.8 (n= 70) |
0 |
168 |
61.9 (∆ −2.1) |
|
|
147.3 ± 182.3 |
64.3 ± 25.4 (n= 78) |
2,000 |
2,147 |
88.5 ± 23.2 |
|||
|
|
|
|
||||||
|
Double-blind RCT |
|
|
(FFQ) |
|
|
|
|
|
|
Nelson et al., 2009 |
Bangor, ME (44.5°N) |
September–February |
19–35 y women |
140 ± 104 |
61.9 ± 22.5 |
0 |
140 |
72.7 ± 27.8 |
|
|
|
|
|
140 ± 124 |
62.1 ± 24.0 (n= 31) |
800 |
940 |
97.4 ± 31.3 |
|
Double-blind RCT |
|
|
|
(4 d food records) |
|
|
|
|
|
Older adults |
||||||||
|
Latitude ≥ 50°N |
||||||||
|
Cashman et al., 2009 |
Cork, Ireland (51°N) Cochrane, Northern Ireland (55°N) |
September/November–February/April (22 wk) |
mean 70.7 ± 5.4 y > 64 y men/women |
188 |
58.8 (43.6,78.5) (n = 55) |
0 |
188 |
41.6 (28.0–55.4) |
|
|
164 |
51.8 (41.3,68.7) (n = 48) |
200 |
364 |
53.2 (45.6–68.7) |
|||
|
Double-blind RCT |
|
|||||||
|
|
|
168 |
54.3 (42.6,72.0) (n = 53) |
400 |
568 |
69.5 (58.0–81.4) |
||
|
|
|
|
192 |
55.1 (39.6, 70.4) (n = 48) |
600 |
792 |
73.8 (62.0–89.2) |
|
|
|
|
|
|
(7 d diet record) |
|
|
|
|
|
Reference; Type of Study |
Location (Latitude) |
Season (Duration) |
Population Description |
Baseline Vitamin D Intake (IU/day) |
Baseline 25OHD Level (nmol/L) |
Vitamin D Dose (IU/day) |
Total Vitamin D Intake (IU/day) |
Achieved 25OHD Level (nmol/L) |
|
Honkanen et al., 1990 |
Kuopio, Finland (62.9°N) |
November/December–February/March (11 wk) |
67–72 y women |
380a |
36.2 ± 2.7 (n = 26) |
0 |
380 |
23.3 (18–28, CI) |
|
|
|
|
42.8 ± 3.5 (n = 25) |
1,800 |
2,180 |
80.7 (75–86, CI) |
||
|
RCT |
|
|
||||||
|
Larsen et al., 2004 |
Randers, Denmark (56°N) |
January–June (1 mo) |
mean 74–74.9 y range 65–103 y men/women |
136a for women |
33 ± 19 (n = 37) |
0 |
136 |
34 ± 19 |
|
RCT |
|
37 ± 19 (n= 67) |
400 |
536 |
46 ± 17 |
|||
|
|
|
|
|
|
||||
|
|
|
|
|
|
49.0 ± 14.2 (n= 22) |
350 |
414 |
59 ± 20 (combined 350–400 IU) |
|
|
|
|
|
|
50.0 ± 15.9 (n= 23) |
400 |
464 |
|
|
Van Der Klis et al., 1996 |
Groningen, Netherlands (53.2°N) |
April–May (5 wk) |
61 y Dutch women |
64e (n = 20) |
61.2 ± 2.4 |
0 |
64 |
NS from baseline |
|
|
|
400 |
464 |
87.9 ± 26.9 (n =19) |
||||
|
RCT |
|
|
|
|
|
|||
|
|
|
|
|
|
|
800 |
864 |
87.9 ± 26.9 (n =19) |
|
Viljakainen et al., 2006 |
Helsinki, Finland (61°N) |
January–April (12 wk) |
65–85 y women |
436 |
52.2 ± 19.9 (n= 12) |
0 |
436 |
43.9 (∆ −8.3 ± 13.2) |
|
|
|
388 |
46.0 ± 14.3 (n= 13) |
200 |
588 |
56.9 (∆ +10.9 ± 8.9) |
||
|
RCT |
|
|
|
|||||
|
|
|
|
|
424 |
46.5 ± 10.2 (n= 11) |
400 |
824 |
60.9 (∆ +14.4 ± 4) |
|
|
|
|
|
388 |
44.1 ± 13.5 (n= 13) |
800 |
1,188 |
67.8 (∆ 23.7 ± 11.9) |
|
|
|
|
|
(FFQ) |
|
|
|
|
|
Latitudes 40–49°N |
||||||||
|
Dawson-Hughes et al., 1991 |
Boston, MA (42°N) |
February–May (winter period of 12-mo study) |
mean 61–62 y women |
90 |
|
0 |
90 |
60.6 (55.6–65.6, CI) (n = 125) |
|
|
|
110 |
|
400 |
510 |
92.1 (87.9–96.3, CI) (n = 121) |
||
|
Double-blind RCT |
|
|
(FFQ) |
|
|
|
||
|
Harris and Dawson-Hughes, 2002 |
Boston, MA (42°N) |
December–April (8 wk) |
62–79 y |
115 |
53.8 ± 18.2 |
0 |
115 |
49.3 (∆ −4.5 ± 6.5) (n = 11) |
|
|
|
142 |
61.5 ± 15.7 |
800 |
942 |
83.6 (∆ −22.1 ± 13.4) (∆ + 22.1 ± 13.4) (n = 14) |
||
|
|
|
(FFQ) |
|
|
|
|||
|
RCT |
|
|
|
|
|
|
|
|
|
NOTE: BMD = bone mineral density; FFQ = food frequency questionnaire; IU = International Units; mo = month(s); NS = not significant; RCT = randomized controlled trial; wk = week(s); y = year(s). aBaseline intakes from Andersen et al. (2005). bBaseline intake from Ambroszkiewicz et al. (2007). cNHANES intake data for 2005–2006. dAchieved serum 25OHD levels for Heaney et al. (2003) were extracted from their graphic presentation in the article, and no variance could be extracted. eBergink et al. (2009). |
||||||||
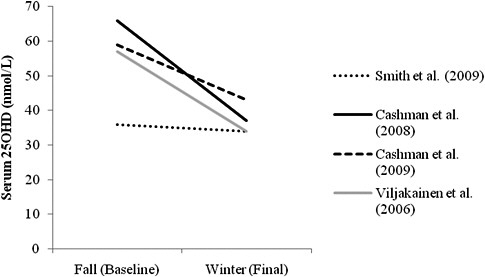
FIGURE 5-2 Fall (baseline) and winter (final) values of serum 25OHD concentrations in non-supplemented placebo (or no pills) groups measured during minimal sun and UVB exposure (Cashman et al., 2008, 2009; Smith et al., 2009) or at the same season for the year-long trials in children (Viljakainen et al., 2006) at latitudes above 50°N or in Antarctica.
NOTE: Values in the graph from Viljakainen et al. (2006) differ from values listed in Table 5-4 due to the use of a subgroup (6-month values for girls recruited in the fall) for graphing purposes.
the lowest baseline serum 25OHD levels (Smith et al., 2009) may have accounted for the attenuated reduction in serum 25OHD level.
A similar trend exists across many of the studies with a placebo group, as summarized in Table 5-4. Declines of 3 to 13 nmol/L in serum 25OHD level are reported for those with baseline levels from 36 to 47 nmol/L. Larger declines in serum 25OHD levels of 8 to 62 nmol/L are reported for those with baseline levels of 64 to 96 nmol/L. However, considerable variability exists in the seasonal decline in serum 25OHD level in winter months, as demonstrated by the increases of 1 nmol/L in some participants with baseline serum 25OHD levels of 33 nmol/L at latitudes above 50°N (Larsen et al., 2004), and increases of 4.6 to 10.8 nmol/L from a baseline of 48.9 to 61.9 nmol/L in some participants at latitudes above 42°N (Harris et al., 2002; Nelson et al., 2009).
These observations suggest that the assumption of minimal sun exposure was met. Further, they suggest that during the winter season small intakes of vitamin D may play a role in attenuating the winter decline in serum 25OHD levels in those with lower baseline serum 25OHD levels. They
also suggest that the kinetics of vitamin D turnover or mobilization from stores may differ in those who have lower baseline serum 25OHD levels. Further, it is possible that the greater decline of serum 25OHD levels in those with higher baseline levels could, perhaps, also represent regression to the mean, at least in part. At this time, it is not possible to clarify which of these possibilities occur.
Non-linear response to vitamin D dosing The available data suggest a non-linear response of serum 25OHD above baseline levels to doses of vitamin D for all age groups. Non-linear response to doses of vitamin D (total or IU/kg) is also reported in mice (Fleet et al., 2008) and rats (Anderson et al., 2008; Fleet et al., 2008), demonstrating the biological plausibility of a non-linear response of serum 25OHD concentrations to vitamin D intake. It is noted that AHRQ-Ottawa and Heaney et al. (2003) reported a linear relationship between serum 25OHD levels and vitamin D dosing that ranges from 0.7 nmol/L per 40 IU (Heaney et al., 2003) to 1 to 2 nmol/L per 100 IU (AHRQ-Ottawa). Notably, AHRQ-Ottawa found heterogeneity that remained after adjusting for dose. However, in the studies considered by the committee, there is a steeper rise in serum 25OHD levels when vitamin D dosing is less than 1,000 IU/day of vitamin D. A slower, more flattened response is seen when doses of 1,000 IU/day or higher are administered. In short, regardless of baseline intakes or serum 25OHD levels, under conditions of dosing the increment in serum 25OHD above baseline differs depending upon whether the dose was above or below 1,000 IU/day. This is evidenced by examining several studies in young, middle-aged and older adults.
Smith et al. (2009) in Antarctica found a low serum 25OHD level of 37 nmol/L in men and women during the winter season (June to September). The rise in serum 25OHD levels with doses of 400, 1,000, and 2,000 IU/day after 13 and 20 weeks was 2.1, 0.8 and 0.54 nmol/L per 40 IU/day, respectively. In two other studies at latitudes of 52°N to 55°N during winter, the rise in serum 25OHD levels in response to 200, 400, or 600 IU of vitamin D per day with serum 25OHD baseline levels of 37 to 42 nmol/L was examined in young and older individuals. The average rise in serum 25OHD levels was equivalent to approximately 2.3 nmol/L for an intake of 40 IU vitamin D3 per day without a difference due to age (Cashman et al., 2008, 2009). Others also found that age does not influence the change in serum 25OHD level in response to vitamin D intake (Harris and Dawson-Hughes, 2002). When the dose is 1,000 IU/day or higher, the rise in serum 25OHD level in individuals of all ages is approximately 1 nmol/L for a 40 IU/day intake, which is similar to the response to vitamin D intake found in the AHRQ-Ottawa analysis.
Analysis and Outcomes
A regression analysis of the relationship between serum 25OHD level and total intake of vitamin D during the winter season at latitudes above 49.5°N or in Antarctica, a period of low sun and UVB exposure, was carried out for each of three age groups—children and adolescents, young and middle-aged adults, and older adults. This approach differs from the others such as the study reported by Heaney et al. (2003) in that total vitamin D intake and not just a supplemental dose of vitamin D was considered, and because we show a non-linear response to total intake rather than the linear response published previously. The interest for this report was an approach that would be relevant to determining the intake needed to achieve the serum 25OHD levels consistent with an EAR- and RDA-type value. The regression analysis using a mixed effect model was preceded by a log transformation of the total vitamin D intake data because the log transformation was the best curvilinear fit. The model controlled for the effect of study clustering by including study as a random effect. Controlling for study effect using a random effect was needed because the interclass correlation of the variance due to study effect compared with the total variance was very high, approximately 95 percent overall, with about 88 percent for children and adolescents, 95 percent for young and middle-aged adults, and 96 percent for older adults. The regression was set for a y0 intercept of 0 nmol of 25OHD per liter of serum, consistent with the biological reality preventing a negative value for achieved serum 25OHD levels. Baseline serum 25OHD levels did not have significant effect, and was, therefore, not included in the analysis.
The outcome is presented in Figure 5-3. Importantly, age did not significantly affect the response of serum 25OHD level to log vitamin D intake. Neither the main effect of age (p = 0.162) nor the interaction term between age and the log of total vitamin D intake (p = 0.142) was significant. Thus, there was no effect of age in the response of serum 25OHD level to total intake among the three age groups—children and adolescents, young and middle-aged adults, or older adults. This finding suggests that across ages under conditions of minimal sun exposure, similar intakes of vitamin D result in similar serum 25OHD concentrations, as shown in Figure 5-4.
Because there was no age effect in the response of serum 25OHD level to total intake of vitamin D, a single, combined regression analysis with study as a random effect was carried out. This resulted in the predictive equation of achieved 25OHD in nmol/L = 9.9 ln (total vitamin D intake) with predicted CIs of y = 8.7 ln total vitamin D intake) and upper interval of y = 11.2 ln (total vitamin intake), as specified in Figure 5-4.
The committee also analyzed the achieved 25OHD with total vitamin D intake at latitudes between 40°N to 49°N during the winter (data shown
in Table 5-4 above) for which assumption of minimal sun exposure may not be as fully met as at latitudes above 49.5°N or in Antarctica during the winter. The approach was the same as described above for the simulated dose–response in which achieved serum 25OHD level was analyzed at latitudes above 49.5°S. The interclass correlation was large, approximately 80 percent, and study effect was again included as a random effect in the mixed effects model. Age did not affect achieved serum 25OHD level relative to log total vitamin D intake (p = 0.09 for main effect and p = 0.6 for the interaction of age and log total vitamin D intake), although the data available for children was limited to one study. Therefore, a combined analysis of all age groups at the lower latitudes was conducted. The predicted achieved serum 25OHD level was y = 12.3 ln (total vitamin D intake), which explained 45 percent of the within-study variability and 96.6 percent of the between-study variability. The predicted upper and lower CIs for achieved serum 25OHD levels were y = 10.1 ln (total vitamin D intake) and y = 14.5 ln (total vitamin D intake). There was a significant difference between lower and higher latitudes (p = 0.000 for the main effect and p = 0.021) for the interaction of latitude and ln (total vitamin D intake). Compared to the simulated dose–response at higher latitudes, the achieved serum 25OHD level at lower latitudes was 24 percent greater for the same total intake as that achieved at higher latitudes. Of note, less of the within-study variance at lower latitudes was explained by the total vitamin D intake (45 percent) compared to that explained (72 percent) for the higher latitudes. Taken together, these results suggest that sun exposure may be more than minimal at lower latitudes, as anticipated. Thus, the committee used the simulated dose–response at the higher latitudes to ensure minimal sun exposure to ensure as little contribution from endogenous production as the evidence allows.
Given the lack of an age effect in the response of the achieved serum 25OHD levels to any total intake of vitamin D, the intake to achieve the EAR-type value of 40 nmol/L was the same across all groups. An intake of 400 IU is associated with a predicted mean circulating 25OHD level of 59 nmol/L in children and adolescents, young and middle-aged adults, and older adults with a lower predicted CI of approximately 52 nmol/L. An intake of 600 IU/day predicts a mean serum 25OHD level of 63 nmol/L in children, adults, and older adults with a lower predicted CI of 56 nmol/L. Although this suggests that intakes of 400 and 600 IU would over-shoot the targeted serum 25OHD concentrations, there is considerable uncertainty in this simulated dose–response relationship that needs to be taken into account. This includes: (1) the large inter-study variance, which is most pronounced in older persons; (2) predicted lower CIs for each age group resulting in an achieved serum 25OHD level of 36 to 46 nmol/L for a 400 IU/day intake and a 38 to 49 nmol/L for a 600 IU/day intake (as
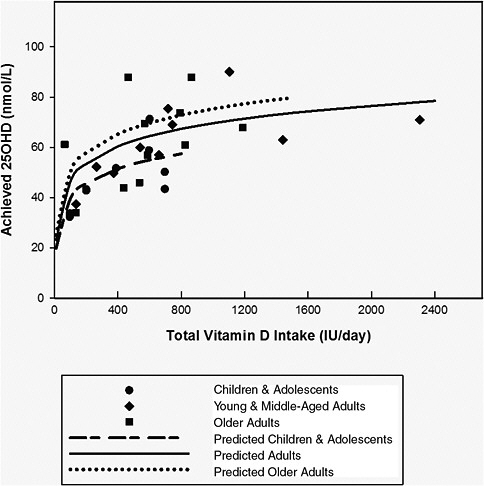 FIGURE 5-3 Response of serum 25OHD level to total intake of vitamin D in northern latitudes in Europe and Antarctica during their respective winter seasons |
shown in Figure 5-4), even though there is no significant age effect; (3) the uncertainties in the comparability of the serum 25OHD levels measured with different assays across these studies; and (4) the uncertainty surrounding the predicted CIs of this relationship. Given these limitations and the uncertainties, the committee selected the estimated intakes needed in a fashion that would err on the side of the specified intake “overshooting” the targeted serum value to ensure that the specified levels of intake achieved the desired serum 25OHD levels of 40 and 50 nmol/L. This approach is used despite possible contributions to serum 25OHD from sun exposure that could not be taken into account.
|
when effective sun exposure for endogenous vitamin D synthesis is minimal. Mean or median responses of serum 25OHD level to total intake in the winter seasons at northern latitudes (> 49.5°N) and in Antarctica (78°S) (summarized in Table 5-4) were analyzed using a mixed effect model by regression following log transformation with study in a random effects model to control for the large study residual variability for: (1) children and adolescents (boys and girls) ages 6 to 14 years in Finland (Ala-Houhala et al., 1988); (2) young and middle-aged adults ages 19 to 59 years from men in Antarctica (Smith et al., 2009), Ireland (Cashman et al., 2008, 2009), and Finland (Viljakainen et al., 2006, 2009), and Denmark (Schou et al., 2003); and (3) older adult women and men > 60 years of age in Ireland (Cashman et al., 2009), the Netherlands (Van Der Klis et al., 1996), Finland (Viljakainen et al., 2006), and Denmark (Larsen et al., 2004). The relationship of serum 25OHD level to total intake of vitamin D is: • For children and adolescents: achieved serum 25OHD = 8.6 ln(total vitamin D intake), which explains 68.8 percent of the within-subject variability and 98.3 percent of the between-study variability. Predicted CIs were y = 6.0 ln (total vitamin D intake) for lower limit, and y = 11.3 ln (total vitamin D intake) for upper limit. • For young and middle-aged adults: achieved serum 25OHD = 10.1 ln (total vitamin D intake), which explained 70.3 percent of the within-study variability and 98.4 percent of the between-study variability. Predicted CIs were y = 6.3 ln (total vitamin D intake) for lower limit, and y = 13.8 ln (total vitamin D intake) for upper limit. • For older adults > 71 years: achieved 25OHD = 10.9 ln (total vitamin D intake), which explains 77.5 percent of the within-study variability and 92.2 percent of the between-study variability. Predicted CIs were y = 7.7 ln (total vitamin D intake) for lower limit and y = 14.2 ln (total vitamin D intake) for upper limit. • The interaction term between age and the log of total vitamin D intake (p = 0.142), as well as the main effect of age (p = 0.162) were not significant. NOTE: log(total vitamin D) has been back-transformed to total vitamin D for presentation in this figure. |
Specification of Vitamin D Dietary Reference Intakes for Adequacy
The DRIs for adequacy for vitamin D have been introduced previously in Table 5-3. The rationale for each is presented in the discussions below.
Infants 0 to 12 Months of Age
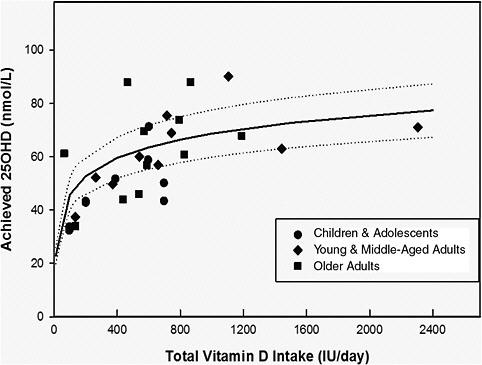
FIGURE 5-4 Response of serum 25OHD level to total intake of vitamin D in all age groups in northern latitudes in Europe and Antarctica during their respective winter seasons when effective sun exposure for endogenous vitamin D synthesis is minimal. Mean responses of serum 25OHD level to total vitamin D intake in the winter seasons at latitudes 49.5°N (Europe) and 78°S (Antarctica) for ages 6 to > 60 years (Ala-Houhala et al., 1988; Van Der Klis et al., 1996; Schou et al., 2003; Larsen et al., 2004; Viljakainen et al., 2006, 2009; Cashman et al., 2008, 2009; Smith et al., 2009; see Table 5-4 for summary of studies) were analyzed by regression using mixed effect model following log transformation controlling for study effect by a random effects model because there was no effect of age on the response of serum 25OHD level to total intake of vitamin D. The relationship for achieved vitamin D is y achieved 25OHD in nmol/L = 9.9 ln (total vitamin D intake) (shown as solid line) with predicted CIs (shown as two dashed lines) for lower interval of y = 8.7 ln (total vitamin D intake) and upper interval of y = 11.2 ln (total vitamin D intake). This regression explains 72 percent of the within-study variability and 96.4 percent of the between-subject variability.
NOTE: Log (total vitamin D intake) was back-transformed to total vitamin D intake for presentation in this figure.
Data are not sufficient to establish an EAR for infants less than 1 year of age, and therefore an AI has been developed. Unlike the case for calcium, the content of human milk does not shed light on the vitamin D requirements of infants, as breast milk is not a meaningful source of vitamin D.
The AI for the 0 to 6 months and 6 to 12 months life stage groups is set at 400 IU of vitamin D per day. There are very limited data beyond the conclusion that maintaining serum 25OHD concentrations in this life stage group above 30 nmol/L, and more likely closer to 50 nmol/L, appears to cover adequately the needs of the majority of the infants and support normal bone accretion. There are no data to suggest that older infants would benefit from higher intakes.
Intakes in the range of 400 IU/day appear consistent with maintenance of the desirable serum 25OHD concentrations. There are no reports of a clinical deficiency in infants receiving 400 IU of vitamin D per day, and an intake of 400 IU/day appears to maintain a serum 25OHD level generally above 50 nmol/L in infants (Greer et al., 1982; Rothberg et al., 1982; Ala-Houhala, 1985; Ala-Houhala et al., 1988; Greer and Marshall, 1989; Hollis and Wagner, 2004). There are differences in the volume of milk or formula intake during this 12-month period, with newborns taking in less than older infants. The AI of 400 IU/day, therefore, represents an overall intake for the first year of life, and may vary across the life stages; it also assumes early introduction of a supplement for breast-fed babies. In the case of exclusive formula feeding, there is an assumption of a gradual increase in intake to 800 to 1,000 mL/day during infancy, which for most standard formulas provides about 400 IU/day. Note is made of the case reports concerning the development of rickets among dark-skinned infants who are exclusively breast-fed and not provided a vitamin D supplement (see Chapter 8).
Children and Adolescents 1 Through 18 Years of Age
|
||||
For these life stage groups, ensuring normal, healthy bone accretion is central to the DRI values. The requirement distribution developed using serum 25OHD concentrations and the intakes estimated to achieve such concentrations are the basis for the reference values.
For very young children in this life stage group, virtually no data are available to link vitamin D nutriture directly to measures related to bone health outcomes. AHRQ-Ottawa examined the relationship between vitamin D and rickets in children 0 to 5 years of age but found no studies that evaluated BMC, BMD, or fractures in comparison with measures of vitamin D intake. Likewise, AHRQ-Tufts found no studies that update AHRQ-Ottawa.
AHRQ-Ottawa did consider serum 25OHD concentrations in the context of the onset of rickets in newborns through children 5 years of age and identified serum concentrations below 27.5 nmol/L as being consistently associated with rickets. However, many of the relevant studies were from developing countries where calcium intake is low; therefore, for these studies, the onset of rickets was associated with higher levels of 25OHD in serum, likely due to low calcium intakes. Specker et al. (1992) has concluded that serum concentrations of approximately 27 to 30 nmol/L places the infant at an increased risk for developing rickets, although the measure is not diagnostic of the disease.
Although the prevention of rickets can be a factor in establishing reference values, it is important to seek measures that are consistent with favorable bone health outcomes. Maximizing calcium absorption, especially for this life stage group, is therefore a reasonable parameter to take into account. Here, as with rickets, serum 25OHD measures are the only data available and there are no direct measures of vitamin D intake. Abrams et al. (2009) conducted calcium absorption studies in 251 children ranging in age from 4.9 to 16.7 years and found that children with serum 25OHD levels of 28 to 50 nmol/L had higher fractional calcium absorption than children with serum 25OHD levels at or greater than 50 nmol/L, suggesting again at the least that maximal calcium absorption is reached at 50 nmol/L. Fractional calcium absorption did not increase with serum 25OHD concentration levels above 50 nmol/L. The findings are consistent with the conclusions reached previously concerning serum 25OHD levels associated with maximum population coverage. Further, as rickets in populations that are not calcium deficient occurs at serum 25OHD levels below 30 nmol/L, it is reasonable to assume that 40 nmol/L is associated with an average requirement.
Serum 25OHD concentrations of 40 to 50 nmol/L would ideally coincide with bone health benefits such as positive effects on BMC and BMD. AHRQ-Ottawa found that there was fair evidence that circulating 25OHD levels are associated with a positive change in BMD and BMC in studies in older children and adolescents. The serum 25OHD concentrations varied from 30 to 83 nmol/L. A study conducted by Viljakainen et al. (2006) reported that vitamin D intakes of 200 and 400 IU/day in adolescent girls were associated with positive BMC measures at serum 25OHD levels
of 50 nmol/L and above. This is consistent with conclusions inferred from calcium absorption studies and, in turn, with the ability to cover the requirements for nearly all in the population. A relatively wide range of total vitamin D intakes reportedly achieved serum 25OHD concentrations between approximately 40 and 60 nmol/L, but most intakes were between about 350 and 600 IU/day. The variability in the data cannot be readily attributed to differences in sun exposure because the studies were all conducted in northern locations during primarily winter months.
Taken as a body of evidence and in the absence of measures that directly relate total intake to health outcomes, the information concerning serum 25OHD concentrations associated with rickets prevention, calcium absorption, and positive effects on BMC measures are consistent with discussions above concerning a requirement distribution based on serum 25OHD concentrations. They support the conclusion that an average requirement for vitamin D for these life stage groups is associated with the achievement of concentrations of 25OHD in serum of 40 nmol/L. Further, they support the conclusion that the requirements for nearly all children and adolescents are covered when serum 25OHD concentrations reach 50 nmol/L. These findings are universally applicable across all children and adolescents from 1 to 18 years of age.
The analysis conducted, described above, indicates that an intake of vitamin D of 400 IU/day achieves serum concentrations of 40 nmol/L, and this intake is therefore set as the EAR for persons 1 to 3 years, 4 to 8 years, 9 to 13 years, and 14 to 18 years of age. As this requirement distribution appears to be normally distributed, the assumption of another 30 percent to cover nearly all the population (i.e., 97.5 percent) is appropriate and consistent with a serum 25OHD level of approximately 50 nmol/L as the target for an RDA value. Based on the same analysis relating serum 25OHD levels to intake, an intake of 600 IU/day is set as the RDA. These reference values assume minimal sun exposure.
Adults 19 Through 50 Years of Age
|
For these life stage groups, bone maintenance is the focus. The requirement distribution based on serum 25OHD concentrations and the intakes estimated to achieve such concentrations are the basis for the reference values. As described below, the available data have provided more
information about intakes and serum 25OHD levels consistent with an RDA value than they have for an EAR value.
Data relating bone health outcomes to vitamin D intake are generally limited for adults 19 to 50 years of ages. Although bone mass measures are, of course, studied in this population, consideration of the dose–response relationship between vitamin D and bone health are not usually included in such studies. In fact, there are no randomized trials in this age group, and whatever data are available come from association studies. The results are inconsistent, in part because the confounding inherent in observational studies.
Serum 25OHD concentrations relative to calcium absorption, therefore, provide an important basis for DRI development for vitamin D for these life stage groups. The conclusions described above indicating that calcium absorption is maximal at serum 25OHD concentrations between 30 and 50 nmol/L with no consistent increase in calcium absorption above approximately 50 nmol/L are informative in estimating the relevant EAR and RDA values for vitamin D for these life stage groups.
In contrast, although data from a very recent study (Priemel et al., 2010) based on post-mortem analysis of the relationship between serum 25OHD levels and osteomalacia and re-examined by the committee (as described above) suggest a serum 25OHD level that would cover the needs of approximately 97.5 percent of the population, they also reveal that a level of serum 25OHD consistent with an average requirement is somewhat elusive. That is, serum 25OHD levels of approximately 40 nmol/L to even 30 nmol/L might be expected to be consistent with coverage for no more than half of the population (i.e., a mean/median value). But, in the Priemel et al. (2010) report, even at serum 25OHD levels well below 30 nmol/L more than half of the population studied failed to demonstrate osteomalacia as defined histologically in the study. In essence, these data, which admittedly have limitations, suggest that for some adults the need for vitamin D is extremely low. This is likely due to the very strong interrelationship between calcium and vitamin D; it may even suggest that calcium is the “driver” nutrient relative to bone health, and that calcium is able to more readily overcome lower levels of vitamin D for the purposes of bone health, while vitamin D is likely unable to compensate for a lack of calcium. This finding underscores the uncertainties that are introduced by the calcium-vitamin D interrelationship.
For the purposes of ensuring public health in the face of uncertainty and providing a reference value for stakeholders, a prudent approach is to begin the consideration of the DRIs for these age groups with the level of 25OHD in serum that is consistent with coverage of the requirement of nearly all adults in this age range, that is, 50 nmol/L. Taken together with calcium absorption and BMD, and assuming a normal distribution
of requirements, given no evidence that the distribution is not normal, a serum level of 40 nmol/L can be set as consistent with a median requirement. This modified approach is bolstered by—and consistent with—the relationship between serum 25OHD levels and calcium absorption, in which serum 25OHD levels of between 30 and 50 nmol/L were consistent with maximal calcium absorption. Based on these considerations as well as the intake versus serum response analysis described above, an EAR of 400 IU/day and an RDA of 600 IU/day are established for adults 19 to 50 years of age. These DRI values assume minimal sun exposure.
Adults 51 Years of Age and Older
|
For persons in these life stage groups of 51 through 70 years and >70 years, the ability to maintain bone mass and reduce the level of bone loss is the primary focus for DRI development. Evidence related to fracture risk becomes central. For this reason, DRIs for adults >70 years of age are discussed first, followed by DRIs for adults 51 through 70 years of age.
Adults 70 Years of Age and Older
The discussions above concerning serum 25OHD levels in relation to bone health indicate that several newer studies have helped to elucidate a relationship between serum 25OHD concentrations and bone health benefits based on measures of calcium absorption and osteomalacia for a wide age range of adults. These data when used for the purposes of DRI development—coupled with the approximation of intake associated with serum 25OHD concentrations derived from the simulation analysis carried out by the committee—provide a basis for an EAR for young and middle-aged adults of 400 IU/day vitamin D consistent with a serum 25OHD concentration of 40 nmol/L, and for an RDA of 600 IU/day consistent with a serum 25OHD concentration of 50 nmol/L. However, for adults more than 70 years of age, the number of unknowns associated with the physiology of normal aging, coupled with the level of variability around the average requirement for this group that such factors may introduce, all of which may affect the estimation of the RDA (the level of intake needed to cover
97.5 percent of the population) causes a closer examination of the level of intake appropriate for an RDA value.
For this life stage group (> 70 years), the reduction in fracture risk is the most important indicator of interest, not only because of the actual event, but also because of the high mortality and morbidity associated with fractures. The factors that may have an impact on fracture risk range from functional status to neurological, metabolic, and physical determinants. Such factors enhance uncertainties about vitamin D nutriture. Changes such as impaired renal function, less efficient synthesis of vitamin D in skin, lower endogenous production of active vitamin D, increased PTH as well as age-related changes in body composition affect the daily requirement of vitamin D. Moreover, a sizeable proportion of this population can be categorized as frail compared with other age groups, and the concerns for bone health are increased. Factors of increased institutionalization also come into play. Although there is insufficient evidence to point to any one of these factors as a contributor to increasing the variability at which 97.5 percent coverage of the population occurs, when taken as a group of unknowns, it would be inappropriate to ignore the concern when considering the level of vitamin D commensurate with an RDA for this group.
For this reason, the level of uncertainty should be taken into account during the specification of the RDA for vitamin D for persons more than 70 years of age. There are very few data that are relevant to adjusting for such uncertainty. There are no dose–response data that would allow comparisons for adults more than 70 years of age regarding the effects of intakes of 600 IU of vitamin D per day with that of a higher level of intake such as 800 or 1,000 IU/day. Moreover, the evidence for fracture risk in relation to vitamin D intake for this older life stage is confounded by study protocols that do not allow separation of the effect of calcium from vitamin D; as discussed previously there is reasonably compelling evidence that calcium alone in this age group can modestly reduce the risk of fracture. Therefore, it is not surprising that the inclusion of calcium with vitamin D treatment generally, albeit not consistently, reduces the risk of fractures among the oldest adults, especially when vitamin D nutriture is considered in the context of serum 25OHD concentrations (Tang et al., 2007; Avenell et al., 2009; AHRQ-Tufts, Tang et al., 2007). Even the 10 trials that examined vitamin D alone (Lips et al., 1996; Peacock et al., 2000; Meyer et al., 2002; Trivedi et al., 2003; Avenell et al., 2004; Harwood et al., 2004; Grant et al., 2005; Law et al., 2006; Lyons et al., 2007; Smith et al., 2007), when pooled by Avenell et al. (2009), showed no statistically significant effect on fracture risk. As shown in Table 5-5, which is focused on studies with subjects more than 70 years of age and vitamin D intakes as opposed to serum 25OHD concentrations, such studies are generally non-significant for fracture risk on the basis of both vitamin D alone and vitamin D with
TABLE 5-5 Randomized Trials on Fracture Risk Associated with Vitamin D and Calcium or Vitamin D Alone in Older Men and Women
|
Author, Date |
Gender/Mean Age |
Vitamin D Dose (IU/day) |
Calcium Dose (mg/day) |
Relative Risk of Fracture |
|
Vitamin D plus Calcium |
|
|
|
|
|
Chapuy et al., 2002 |
F, 85 y |
800 |
1,200 |
0.85 NS |
|
Harwood et al., 2004 |
F, 81 y |
800 |
1,000 |
0.49 NS |
|
Grant et al., 2005 |
M/F, 77 y |
800 |
1,000 |
0.94 NS |
|
Porthouse et al., 2005 |
F, 77 y |
800 |
1,000 |
0.96 NS |
|
Vitamin D Alone |
|
|
|
|
|
Lips et al., 1996 |
M/F, 80 y |
400 |
— |
1.1 NS |
|
Meyer et al., 2002 |
M/F, 85 y |
400 |
— |
0.92 NS |
|
Trivedi et al., 2003* |
M/F, 75 y |
800 |
— |
0.67 Significant |
|
Lyons et al., 200) |
M/F, 84 y |
800 |
— |
0.96 NS |
|
*100,000 IU every four months. NOTE: NS = Non-significant |
||||
calcium. The exception is Trivedi et al. (2003), which examined vitamin D supplementation and fracture risk in a population of men and women of average age 75 years. In any case, interpretation of these data is complicated by the unknowns surrounding the background intake of vitamin D over and above the supplemented dose.
The large study (n = 2,686) carried out by Trivedi et al. (2003) included more men than women (suggesting that the included population was actually at lower risk for fracture than would have been the case if the study had focused predominantly on women) and was longitudinal (5 years), including repeat measures on the same individual. The amount of vitamin D used for treatment was the equivalent of 800 IU/day, although it was administered as a 100,000 IU dose every 4 months for the duration of the study. Although this may limit somewhat the applicability of the study for DRI purposes, it is not as large as the 500,000 IU dose once yearly used by others (e.g., Sanders et al., 2010). Under these circumstances, the work of Trivedi et al. (2003) is helpful in taking uncertainty into account.
The reason not to dismiss the effect of 800 IU of vitamin D per day as an aberration because of a lack of dose–response data, even in the face of data generally not supportive of an effect of vitamin D alone regarding reduced fracture risk for the oldest adults, is that persons more than 70 years are a very diverse group. This group is undergoing a number of physiological changes with aging that could have an impact on and increase the variability around an average requirement, particularly in light of the known and high variability of these physiological changes among aging individuals. If this is assumed to be the case, then it is likely that the
RDA for persons more than 70 years of age would be higher due to this variability. In addition, there is insufficient evidence to provide assurances that 600 IU/day vitamin D is as effective as 800 IU/day. By comparing the projected RDA based on the simulation analysis (600 IU/day) with the available evidence indicating benefit at 800 IU of vitamin D per day, taking into account the uncertainties would result in an estimation of an RDA of approximately one-third higher than the simulation analysis suggests. Overall, this is a small increase that is not known to increase the possibility of adverse events while providing a certain level of caution for this particularly vulnerable and potentially frail segment of the population. This approach is predicated on caution in the face of uncertainties, and it is anticipated that newer data in the future will help to clarify the uncertainties surrounding the level of intake of vitamin D that could be expected to cover 97.5 percent of persons over the age of 70 years.
The EAR of 400 IU/day and RDA of 800 IU/day for this life stage group, consistent with the DRIs for other life stage groups, assume minimal sun exposure.
Adults 51 Through 70 Years of Age
A question in establishing an EAR and RDA for this life stage group is the relevance of vitamin D in affecting bone loss due to the onset of menopause. Men in this life stage group have not yet reached the levels of bone loss and fracture rates associated with aging as manifested in persons more than 70 years of age and, unlike their female counterparts, they are not experiencing significant bone loss due to menopause. However, a portion—in fact perhaps the majority—of women in this life stage group are likely to be experiencing some degree of bone loss due to menopause.
As discussed above for adults more than 70 years of age, the available data do not suggest that median requirements increase with aging, resulting in support for an EAR of 400 IU/day, the same as for younger adults. Likewise, the EAR for both women and men in the 51 through 70 year life stage group is set at 400 IU of vitamin D per day.
With respect to women 51 through 70 years of age, fracture risk is lower than it is later in life; and as such, it is not entirely congruent with the situation for adults more than 70 years of age. Further, findings for this age group are at best mixed, but are generally not supportive of an effect of vitamin D alone on bone health. Although the AHRQ analyses of studies using vitamin D alone found the results to be inconsistent for a relationship with reduction in fracture risk, more recent studies have trended toward no significant effects (Bunout et al., 2006; Burleigh et al., 2007; Lyons et al., 2007; Avenell et al., 2009b). For those studies showing benefit for BMD with a vitamin D and calcium combination, interpretation
is confounded by the effects of calcium especially since calcium alone appears to have at least a modest effect on BMD. The report from the WHI (Jackson et al., 2006), a very large cohort study, has limited applicability to the question of the effect of vitamin D on bone health among women because of relatively high levels of calcium intake (baseline mean calcium intake of approximately 1,150 mg/day at randomization plus 1,000 mg/day supplement) and the confounding due to hormone replacement therapy. Given these data plus the inability to extrapolate the variability seen in the requirements surrounding persons 70 or more years of age to this life stage group, the RDA for women 51 through 70 years of age is set at 600 IU of vitamin D per day, the same level as that for younger adults. With respect to men 51 through 70 years of age, there is also no basis to deviate from the RDA set for younger adults. The available evidence for men is extremely limited, and there are not data to suggest that bone health is enhanced by vitamin D intake among men in this life stage group. An RDA of 600 IU/day is established for these men.
The DRIs for these two life stage groups assume minimal sun exposure.
Pregnancy and Lactation
|
||||||||
Pregnancy The EAR for non-pregnant women and adolescents is appropriate for pregnant women and adolescents based on: (1) AHRQ-Ottawa’s finding of insufficient evidence on the association of serum 25OHD level with maternal BMD during pregnancy and (2) the 1 available RCT (Delvin et al., 1986) and 14 observational studies reviewed in Chapter 4 regarding vitamin D deficiency and genetic absence of the vitamin D receptor (VDR) or 1α-hydroxyalase, which all demonstrate no effect of maternal 25OHD level on fetal calcium homeostasis or skeletal outcomes. Of the limited number (i.e., four) of observational studies that suggest an influence of maternal serum 25OHD levels on the offspring’s skeletal outcomes later in life (so-called developmental programming), one study reports associa-
tions consistent with an EAR-type value of approximately 40 nmol/L below which negative fetal skeletal outcomes were reported (Viljakainen et al., 2010), and another reports an RDA-type value of 50 nmol/L late in gestation above which reduced skeletal BMC was not seen in offspring at 9 years of age (Javaid et al., 2006). In addition, development of the fetal skeleton without dependence on maternal vitamin D is also biologically plausible as indicated by the studies in animal models in rats, mice, pigs, and sheep (see review in Chapter 3). Finally, there is no evidence that the vitamin D requirements of pregnant adolescents differ from those of non-pregnant adolescents.
The EAR is thus 400 IU of vitamin D per day for pregnant women and adolescents. Likewise, the RDA values for non-pregnant women and adolescents are applicable, providing an RDA of 600 IU/day for each group.
Lactation The EAR for non-lactating women and adolescents is appropriate for lactating women and adolescents based on evidence from RCTs (Rothberg et al., 1982; Ala-Houhala, 1985; Ala-Houhala et al., 1988; Kalkwarf et al., 1996; Hollis and Wagner, 2004; Basile et al., 2006; Wagner et al., 2006; Saadi et al., 2007), which are consistent with observational data (Cancela et al., 1986; Okonofua et al., 1987; Takeuchi et al., 1989; Kent et al., 1990; Alfaham et al., 1995; Sowers et al., 1998) that increased maternal vitamin D intakes increase maternal serum 25OHD levels, with no effect on the neonatal serum 25OHD levels of breast-fed infants unless the maternal intake of vitamin D is extremely high (i.e., 4,000 to 6,400 IU/day) (Wagner et al., 2006). Observational studies report no relationship between maternal serum 25OHD levels and BMD (Ghannam et al., 1999) or breast milk calcium content (Prentice et al., 1997). Also, there is no evidence that lactating adolescents require any more vitamin D or higher serum 25OHD levels than non-lactating adolescents. The EAR is thus 400 IU of vitamin D per day for lactating women and adolescents. Likewise, the RDA values for non-lactating women and adolescents are applicable, providing an RDA of 600 IU/day for each group.
REFERENCES
Abrams, S. A., K. C. Copeland, S. K. Gunn, J. E. Stuff, L. L. Clarke and K. J. Ellis. 1999. Calcium absorption and kinetics are similar in 7- and 8-year-old Mexican-American and Caucasian girls despite hormonal differences. Journal of Nutrition 129(3): 666-71.
Abrams, S. A. 2006. Building bones in babies: can and should we exceed the human milk-fed infant’s rate of bone calcium accretion? Nutrition Reviews 64(11): 487-94.
Abrams, S. A., P. D. Hicks and K. M. Hawthorne. 2009. Higher serum 25-hydroxyvitamin D levels in school-age children are inconsistently associated with increased calcium absorption. Journal of Clinical Endocrinology and Metabolism 94(7): 2421-7.
Ala-Houhala, M. 1985. 25-hydroxyvitamin D levels during breast-feeding with or without maternal or infantile supplementation of vitamin D. Journal of Pediatric Gastroenterology and Nutrition 4(2): 220-6.
Ala-Houhala, M., T. Koskinen, M. Koskinen and J. K. Visakorpi. 1988. Double blind study on the need for vitamin D supplementation in prepubertal children. Acta Paediatrica Scandinavica 77(1): 89-93.
Alevizaki, C. C., D. G. Ikkos and P. Singhelakis. 1973. Progressive decrease of true intestinal calcium absorption with age in normal man. Journal of Nuclear Medicine 14(10): 760-2.
Alfaham, M., S. Woodhead, G. Pask and D. Davies. 1995. Vitamin D deficiency: a concern in pregnant Asian women. British Journal of Nutrition 73(6): 881-7.
Ambroszkiewicz, J., W. Klemarczyk, J. Gajewska, M. Chelchowska and T. Laskowska-Klita. 2007. Serum concentration of biochemical bone turnover markers in vegetarian children. Advances in Medical Science 52: 279-82.
Ames, S. K., B. M. Gorham and S. A. Abrams. 1999. Effects of high compared with low calcium intake on calcium absorption and incorporation of iron by red blood cells in small children. American Journal of Clinical Nutrition 70(1): 44-8.
Andersen, R., C. Molgaard, L. T. Skovgaard, C. Brot, K. D. Cashman, E. Chabros, J. Charzewska, A. Flynn, J. Jakobsen, M. Karkkainen, M. Kiely, C. Lamberg-Allardt, O. Moreiras, A. M. Natri, M. O’Brien, M. Rogalska-Niedzwiedz and L. Ovesen. 2005. Teenage girls and elderly women living in northern Europe have low winter vitamin D status. European Journal of Clinical Nutrition 59(4): 533-41.
Anderson, P. H., R. K. Sawyer, A. J. Moore, B. K. May, P. D. O’Loughlin and H. A. Morris. 2008. Vitamin D depletion induces RANKL-mediated osteoclastogenesis and bone loss in a rodent model. Journal of Bone and Mineral Research 23(11): 1789-97.
Atkinson, S. A., B. P. Alston-Mills, B. Lonnerdal, M. C. Neville and M. P. Thompson. 1995. Major minerals and ionic constituents of human and bovine milk. In Handbook of Milk Composition, edited by R. J. Jensen. San Diego, CA: Academic Press. Pp. 593-619.
Avenell, A. and H. H. Handoll. 2004. Nutritional supplementation for hip fracture aftercare in the elderly. Cochrane Database System Review (1): CD001880.
Avenell, A., W. J. Gillespie, L. D. Gillespie and D. O’Connell. 2009. Vitamin D and vitamin D analogues for preventing fractures associated with involutional and post-menopausal osteoporosis. Cochrane Database System Review (2): CD000227.
Avioli, L. V., J. E. McDonald and S. W. Lee. 1965. The influence of age on the intestinal absorption of 47-Ca absorption in post-menopausal osteoporosis. Journal of Clinical Investigation 44(12): 1960-7.
Basile, L. A., S. N. Taylor, C. L. Wagner, R. L. Horst and B. W. Hollis. 2006. The effect of high-dose vitamin D supplementation on serum vitamin D levels and milk calcium concentration in lactating women and their infants. Breastfeeding Medicine 1(1): 27-35.
Bergink, A. P., A. G. Uitterlinden, J. P. Van Leeuwen, C. J. Buurman, A. Hofman, J. A. Verhaar and H. A. Pols. 2009. Vitamin D status, bone mineral density, and the development of radiographic osteoarthritis of the knee: The Rotterdam Study. Journal of Clinical Rheumatology 15(5): 230-7.
Biancuzzo, R. M., A. Young, D. Bibuld, M. H. Cai, M. R. Winter, E. K. Klein, A. Ameri, R. Reitz, W. Salameh, T. C. Chen and M. F. Holick. 2010. Fortification of orange juice with vitamin D(2) or vitamin D(3) is as effective as an oral supplement in maintaining vitamin D status in adults. American Journal of Clinical Nutrition 91(6): 1621-6.
Brannon, P. M., E. A. Yetley, R. L. Bailey and M. F. Picciano. 2008. Vitamin D and health in the 21st century: an update. Proceedings of a conference held September 2007 in Bethesda, Maryland, USA. American Journal of Clinical Nutrition 88(2): 483S-592S.
Bullamore, J. R., R. Wilkinson, J. C. Gallagher, B. E. Nordin and D. H. Marshall. 1970. Effect of age on calcium absorption. Lancet 2(7672): 535-7.
Bunout, D., G. Barrera, L. Leiva, V. Gattas, M. P. de la Maza, M. Avendano and S. Hirsch. 2006. Effects of vitamin D supplementation and exercise training on physical performance in Chilean vitamin D deficient elderly subjects. Experimental Gerontology 41(8): 746-52.
Burleigh, E., J. McColl and J. Potter. 2007. Does vitamin D stop inpatients falling? A randomised controlled trial. Age Ageing 36(5): 507-13.
Cancela, L., N. Le Boulch and L. Miravet. 1986. Relationship between the vitamin D content of maternal milk and the vitamin D status of nursing women and breast-fed infants. Journal of Endocrinology 110(1): 43-50.
Carter, G. D., J. L. Berry, E. Gunter, G. Jones, J. C. Jones, H. L. Makin, S. Sufi and M. J. Wheeler. 2010. Proficiency testing of 25-hydroxyvitamin D (25-OHD) assays. Journal of Steroid Biochemistry and Molecular Biology 121(1-2): 176-9.
Cashman, K. D., T. R. Hill, A. J. Lucey, N. Taylor, K. M. Seamans, S. Muldowney, A. P. Fitzgerald, A. Flynn, M. S. Barnes, G. Horigan, M. P. Bonham, E. M. Duffy, J. J. Strain, J. M. Wallace and M. Kiely. 2008. Estimation of the dietary requirement for vitamin D in healthy adults. American Journal of Clinical Nutrition 88(6): 1535-42.
Cashman, K. D., J. M. Wallace, G. Horigan, T. R. Hill, M. S. Barnes, A. J. Lucey, M. P. Bonham, N. Taylor, E. M. Duffy, K. Seamans, S. Muldowney, A. P. Fitzgerald, A. Flynn, J. J. Strain and M. Kiely. 2009. Estimation of the dietary requirement for vitamin D in free-living adults ≥64 y of age. American Journal of Clinical Nutrition 89(5): 1366-74.
Cauley, J. A., A. Z. Lacroix, L. Wu, M. Horwitz, M. E. Danielson, D. C. Bauer, J. S. Lee, R. D. Jackson, J. A. Robbins, C. Wu, F. Z. Stanczyk, M. S. LeBoff, J. Wactawski-Wende, G. Sarto, J. Ockene and S. R. Cummings. 2008. Serum 25-hydroxyvitamin D concentrations and risk for hip fractures. Annals of Internal Medicine 149(4): 242-50.
Cauley, J. A., N. Parimi, K. E. Ensrud, D. C. Bauer, P. M. Cawthon, S. R. Cummings, A. R. Hoffman, J. M. Shikany, E. Barrett-Connor and E. Orwoll. 2010. Serum 25 hydroxyvitamin D and the risk of hip and non-spine fractures in older men. Journal of Bone and Mineral Research 25(3): 545.
Chantry, C. J., P. Auinger and R. S. Byrd. 2004. Lactation among adolescent mothers and subsequent bone mineral density. Archives of Pediatrics and Adolescent Medicine 158(7): 650-6.
Chapuy, M. C., M. E. Arlot, F. Duboeuf, J. Brun, B. Crouzet, S. Arnaud, P. D. Delmas and P. J. Meunier. 1992. Vitamin D3 and calcium to prevent hip fractures in the elderly women. New England Journal of Medicine 327(23): 1637-42.
Chung M., E. M. Balk, M. Brendel, S. Ip, J. Lau, J. Lee, A. Lichtenstein, K. Patel, G. Raman, A. Tatsioni, T. Terasawa and T. A. Trikalinos. 2009. Vitamin D and calcium: a systematic review of health outcomes. Evidence Report No. 183. (Prepared by the Tufts Evidence-based Practice Center under Contract No. HHSA 290-2007-10055-I.) AHRQ Publication No. 09-E015. Rockville, MD: Agency for Healthcare Research and Quality.
Cranney A., T. Horsley, S. O’Donnell, H. A. Weiler, L. Puil, D. S. Ooi, S. A. Atkinson, L. M. Ward, D. Moher, D. A. Hanley, M. Fang, F. Yazdi, C. Garritty, M. Sampson, N. Barrowman, A. Tsertsvadze and V. Mamaladze. 2007. Effectiveness and safety of vitamin D in relation to bone health. Evidence Report/Technology Assessment No. 158. (Prepared by the University of Ottawa Evidence-based Practice Center (UO-EPC) under Contract No. 290-02-0021.) AHRQ Publication No. 07-E013. Rockville, MD: Agency for Healthcare Research and Quality.
Cross, N. A., L. S. Hillman, S. H. Allen, G. F. Krause and N. E. Vieira. 1995. Calcium homeostasis and bone metabolism during pregnancy, lactation, and postweaning: a longitudinal study. American Journal of Clinical Nutrition 61(3): 514-23.
Dawson-Hughes, B., G. E. Dallal, E. A. Krall, S. Harris, L. J. Sokoll and G. Falconer. 1991. Effect of vitamin D supplementation on wintertime and overall bone loss in healthy postmenopausal women. Annals of Internal Medicine 115(7): 505-12.
Delvin, E. E., B. L. Salle, F. H. Glorieux, P. Adeleine and L. S. David. 1986. Vitamin D supplementation during pregnancy: effect on neonatal calcium homeostasis. Journal of Pediatrics 109(2): 328-34.
Dewey, K. G., D. A. Finley and B. Lonnerdal. 1984. Breast milk volume and composition during late lactation (7-20 months). Journal of Pediatric Gastroenterology and Nutrition 3(5): 713-20.
Ensrud, K. E., B. C. Taylor, M. L. Paudel, J. A. Cauley, P. M. Cawthon, S. R. Cummings, H. A. Fink, E. Barrett-Connor, J. M. Zmuda, J. M. Shikany and E. S. Orwoll. 2009. Serum 25-hydroxyvitamin D levels and rate of hip bone loss in older men. Journal of Clinical Endocrinology and Metabolism 94(8): 2773-80.
Fairweather-Tait, S., A. Prentice, K. G. Heumann, L. M. Jarjou, D. M. Stirling, S. G. Wharf and J. R. Turnlund. 1995. Effect of calcium supplements and stage of lactation on the calcium absorption efficiency of lactating women accustomed to low calcium intakes. American Journal of Clinical Nutrition 62(6): 1188-92.
Fleet, J. C., C. Gliniak, Z. Zhang, Y. Xue, K. B. Smith, R. McCreedy and S. A. Adedokun. 2008. Serum metabolite profiles and target tissue gene expression define the effect of cholecalciferol intake on calcium metabolism in rats and mice. Journal of Nutrition 138(6): 1114-20.
Fomon, S. J. and S. E. Nelson. 1993. Calcium, phosphorus, magnesium, and sulfur. In Nutrition of Normal Infants, edited by S. J. Fomon. St. Louis: Mosby-Year Book, Inc. Pp. 192-216.
Gallagher, J. C., B. L. Riggs, J. Eisman, A. Hamstra, S. B. Arnaud and H. F. DeLuca. 1979. Intestinal calcium absorption and serum vitamin D metabolites in normal subjects and osteoporotic patients: effect of age and dietary calcium. Journal of Clinical Investigation 64(3): 729-36.
Gartner, L. M., J. Morton, R. A. Lawrence, A. J. Naylor, D. O’Hare, R. J. Schanler and A. I. Eidelman. 2005. Breastfeeding and the use of human milk. Pediatrics 115(2): 496-506.
Ghannam, N. N., M. M. Hammami, S. M. Bakheet and B. A. Khan. 1999. Bone mineral density of the spine and femur in healthy Saudi females: relation to vitamin D status, pregnancy, and lactation. Calcified Tissue International 65(1): 23-8.
Grant, A. M., A. Avenell, M. K. Campbell, A. M. McDonald, G. S. MacLennan, G. C. McPherson, F. H. Anderson, C. Cooper, R. M. Francis, C. Donaldson, W. J. Gillespie, C. M. Robinson, D. J. Torgerson and W. A. Wallace. 2005. Oral vitamin D3 and calcium for secondary prevention of low-trauma fractures in elderly people (Randomised Evaluation of Calcium Or vitamin D, RECORD): a randomised placebo-controlled trial. Lancet 365(9471): 1621-8.
Greer, F. R., J. E. Searcy, R. S. Levin, J. J. Steichen, P. S. Steichen-Asche and R. C. Tsang. 1982. Bone mineral content and serum 25-hydroxyvitamin D concentrations in breast-fed infants with and without supplemental vitamin D: one-year follow-up. Journal of Pediatrics 100(6): 919-22.
Greer, F. R. and S. Marshall. 1989. Bone mineral content, serum vitamin D metabolite concentrations, and ultraviolet B light exposure in infants fed human milk with and without vitamin D2 supplements. Journal of Pediatrics 114(2): 204-12.
Harris, S. S. and B. Dawson-Hughes. 2002. Plasma vitamin D and 25OHD responses of young and old men to supplementation with vitamin D3. Journal of the American College of Nutrition 21(4): 357-62.
Harwood, R. H., O. Sahota, K. Gaynor, T. Masud and D. J. Hosking. 2004. A randomised, controlled comparison of different calcium and vitamin D supplementation regimens in elderly women after hip fracture: The Nottingham Neck of Femur (NONOF) Study. Age and Ageing 33(1): 45-51.
Heaney, R. P., K. M. Davies, T. C. Chen, M. F. Holick and M. J. Barger-Lux. 2003. Human serum 25-hydroxycholecalciferol response to extended oral dosing with cholecalciferol. American Journal of Clinical Nutrition 77(1): 204-10.
Holick, M. F., R. M. Biancuzzo, T. C. Chen, E. K. Klein, A. Young, D. Bibuld, R. Reitz, W. Salameh, A. Ameri and A. D. Tannenbaum. 2008. Vitamin D2 is as effective as vitamin D3 in maintaining circulating concentrations of 25-hydroxyvitamin D. Journal of Clinical Endocrinology and Metabolism 93(3): 677-81.
Hollis, B. W. and C. L. Wagner. 2004. Vitamin D requirements during lactation: high-dose maternal supplementation as therapy to prevent hypovitaminosis D for both the mother and the nursing infant. American Journal of Clinical Nutrition 80(Suppl 6): 1752S-8S.
Honkanen, R., E. Alhava, M. Parviainen, S. Talasniemi and R. Monkkonen. 1990. The necessity and safety of calcium and vitamin D in the elderly. Journal of the American Geriatrics Society 38(8): 862-6.
Hunt, C. D. and L. K. Johnson. 2007. Calcium requirements: new estimations for men and women by cross–sectional statistical analyses of calcium balance data from metabolic studies. American Journal of Clinical Nutrition 86(4): 1054-63.
IOM (Institute of Medicine). 1991. Nutrition During Lactation. Washington, DC: National Academy Press.
IOM. 1997. Dietary Reference Intakes for Calcium, Phosphorus, Magnesium, Vitamin D, and Fluoride. Washington, DC: National Academy Press.
Jackson, R. D., A. Z. LaCroix, M. Gass, R. B. Wallace, J. Robbins, C. E. Lewis, T. Bassford, S. A. Beresford, H. R. Black, P. Blanchette, D. E. Bonds, R. L. Brunner, R. G. Brzyski, B. Caan, J. A. Cauley, R. T. Chlebowski, S. R. Cummings, I. Granek, J. Hays, G. Heiss, S. L. Hendrix, B. V. Howard, J. Hsia, F. A. Hubbell, K. C. Johnson, H. Judd, J. M. Kotchen, L. H. Kuller, R. D. Langer, N. L. Lasser, M. C. Limacher, S. Ludlam, J. E. Manson, K. L. Margolis, J. McGowan, J. K. Ockene, M. J. O’Sullivan, L. Phillips, R. L. Prentice, G. E. Sarto, M. L. Stefanick, L. Van Horn, J. Wactawski-Wende, E. Whitlock, G. L. Anderson, A. R. Assaf and D. Barad. 2006. Calcium plus vitamin D supplementation and the risk of fractures. New England Journal of Medicine 354(7): 669-83.
Jarjou, L. M., A. Prentice, Y. Sawo, M. A. Laskey, J. Bennett, G. R. Goldberg and T. J. Cole. 2006. Randomized, placebo-controlled, calcium supplementation study in pregnant Gambian women: effects on breast-milk calcium concentrations and infant birth weight, growth, and bone mineral accretion in the first year of life. American Journal of Clinical Nutrition 83(3): 657-66.
Jarjou, L. M., M. A. Laskey, Y. Sawo, G. R. Goldberg, T. J. Cole and A. Prentice. 2010. Effect of calcium supplementation in pregnancy on maternal bone outcomes in women with a low calcium intake. American Journal of Clinical Nutrition 92(2): 450-7.
Javaid, M. K., S. R. Crozier, N. C. Harvey, C. R. Gale, E. M. Dennison, B. J. Boucher, N. K. Arden, K. M. Godfrey and C. Cooper. 2006. Maternal vitamin D status during pregnancy and childhood bone mass at age 9 years: a longitudinal study. Lancet 367(9504): 36-43.
Kalkwarf, H. J., B. L. Specker, J. E. Heubi, N. E. Vieira and A. L. Yergey. 1996. Intestinal calcium absorption of women during lactation and after weaning. American Journal of Clinical Nutrition 63(4): 526-31.
Kalkwarf, H. J., B. L. Specker, D. C. Bianchi, J. Ranz and M. Ho. 1997. The effect of calcium supplementation on bone density during lactation and after weaning. New England Journal of Medicine 337(8): 523-8.
Kalkwarf, H. J. 1999. Hormonal and dietary regulation of changes in bone density during lactation and after weaning in women. Journal of Mammary Gland Biology and Neoplasia 4(3): 319-29.
Kent, G. N., R. I. Price, D. H. Gutteridge, M. Smith, J. R. Allen, C. I. Bhagat, M. P. Barnes, C. J. Hickling, R. W. Retallack, S. G. Wilson and et al. 1990. Human lactation: forearm trabecular bone loss, increased bone turnover, and renal conservation of calcium and inorganic phosphate with recovery of bone mass following weaning. Journal of Bone and Mineral Research 5(4): 361-9.
Khosla, S., S. Amin and E. Orwoll. 2008. Osteoporosis in men. Endocrine Reviews 29(4): 441-64.
Koo, W. W., J. C. Walters, J. Esterlitz, R. J. Levine, A. J. Bush and B. Sibai. 1999. Maternal calcium supplementation and fetal bone mineralization. Obstetrics and Gynecology 94(4): 577-82.
Kovacs, C. S. and H. M. Kronenberg. 1997. Maternal-fetal calcium and bone metabolism during pregnancy, puerperium, and lactation. Endocrine Reviews 18(6): 832-72.
Larsen, E. R., L. Mosekilde and A. Foldspang. 2004. Vitamin D and calcium supplementation prevents osteoporotic fractures in elderly community dwelling residents: a pragmatic population-based 3-year intervention study. Journal of Bone and Mineral Research 19(3): 370-8.
Laskey, M. A., A. Prentice, L. A. Hanratty, L. M. Jarjou, B. Dibba, S. R. Beavan and T. J. Cole. 1998. Bone changes after 3 mo of lactation: influence of calcium intake, breast-milk output, and vitamin D-receptor genotype. American Journal of Clinical Nutrition 67(4): 685-92.
Law, M., H. Withers, J. Morris and F. Anderson. 2006. Vitamin D supplementation and the prevention of fractures and falls: results of a randomised trial in elderly people in residential accommodation. Age and Ageing 35(5): 482-6.
Li-Ng, M., J. F. Aloia, S. Pollack, B. A. Cunha, M. Mikhail, J. Yeh and N. Berbari. 2009. A randomized controlled trial of vitamin D3 supplementation for the prevention of symptomatic upper respiratory tract infections. Epidemiology and Infection 137(10): 1396-404.
Lips, P., W. C. Graafmans, M. E. Ooms, P. D. Bezemer and L. M. Bouter. 1996. Vitamin D supplementation and fracture incidence in elderly persons. A randomized, placebo-controlled clinical trial. Annals of Internal Medicine 124(4): 400-6.
Looker, A. C. and M. E. Mussolino. 2008. Serum 25-hydroxyvitamin D and hip fracture risk in older U.S. white adults. Journal of Bone and Mineral Research 23(1): 143-50.
Lynch, M. F., I. J. Griffin, K. M. Hawthorne, Z. Chen, M. Hamzo and S. A. Abrams. 2007. Calcium balance in 1-4-y-old children. American Journal of Clinical Nutrition 85(3): 750-4.
Lyons, R. A., A. Johansen, S. Brophy, R. G. Newcombe, C. J. Phillips, B. Lervy, R. Evans, K. Wareham and M. D. Stone. 2007. Preventing fractures among older people living in institutional care: a pragmatic randomised double blind placebo controlled trial of vitamin D supplementation. Osteoporosis International 18(6): 811-8.
Melhus, H., G. Snellman, R. Gedeborg, L. Byberg, L. Berglund, H. Mallmin, P. Hellman, R. Blomhoff, E. Hagstrom, J. Arnlov and K. Michaelsson. 2010. Plasma 25-hydroxyvitamin D levels and fracture risk in a community-based cohort of elderly men in Sweden. Journal of Clinical Endocrinology and Metabolism 95(6): 2637-45.
Meyer, H. E., G. B. Smedshaug, E. Kvaavik, J. A. Falch, A. Tverdal and J. I. Pedersen. 2002. Can vitamin D supplementation reduce the risk of fracture in the elderly? A randomized controlled trial. Journal of Bone and Mineral Research 17(4): 709-15.
Millen, A. E., J. Wactawski-Wende, M. Pettinger, M. L. Melamed, F. A. Tylavsky, S. Liu, J. Robbins, A. Z. LaCroix, M. S. LeBoff and R. D. Jackson. 2010. Predictors of serum 25-hydroxyvitamin D concentrations among postmenopausal women: the Women’s Health Initiative Calcium plus Vitamin D clinical trial. American Journal of Clinical Nutrition 91(5): 1324-35.
Mimouni, F., B. Campaigne, M. Neylan and R. C. Tsang. 1993. Bone mineralization in the first year of life in infants fed human milk, cow-milk formula, or soy-based formula. Journal of Pediatrics 122(3): 348-54.
Nelson, M. L., J. M. Blum, B. W. Hollis, C. Rosen and S. S. Sullivan. 2009. Supplements of 20 microg/d cholecalciferol optimized serum 25-hydroxyvitamin D concentrations in 80% of premenopausal women in winter. Journal of Nutrition 139(3): 540-6.
NOF (National Osteoporosis Foundation). 2008. Clinician’s Guide to Prevention and Treatment of Osteoporosis. Washington, DC: National Osteoporosis Foundation.
O’Brien, K. O., M. S. Nathanson, J. Mancini and F. R. Witter. 2003. Calcium absorption is significantly higher in adolescents during pregnancy than in the early postpartum period. American Journal of Clinical Nutrition 78(6): 1188-93.
Okonofua, F., R. K. Menon, S. Houlder, M. Thomas, D. Robinson, S. O’Brien and P. Dandona. 1987. Calcium, vitamin D and parathyroid hormone relationships in pregnant Caucasian and Asian women and their neonates. Annals of Clinical Biochemistry 24(Pt 1): 22-8.
Orwoll, E. S., S. K. Oviatt, M. R. McClung, L. J. Deftos and G. Sexton. 1990. The rate of bone mineral loss in normal men and the effects of calcium and cholecalciferol supplementation. Annals of Internal Medicine 112(1): 29-34.
Peacock, M., G. Liu, M. Carey, R. McClintock, W. Ambrosius, S. Hui and C. C. Johnston. 2000. Effect of calcium or 25OH vitamin D3 dietary supplementation on bone loss at the hip in men and women over the age of 60. Journal of Clinical Endocrinology and Metabolism 85(9): 3011-9.
Polatti, F., E. Capuzzo, F. Viazzo, R. Colleoni and C. Klersy. 1999. Bone mineral changes during and after lactation. Obstetrics and Gynecology 94(1): 52-6.
Porthouse, J., S. Cockayne, C. King, L. Saxon, E. Steele, T. Aspray, M. Baverstock, Y. Birks, J. Dumville, R. Francis, C. Iglesias, S. Puffer, A. Sutcliffe, I. Watt and D. J. Torgerson. 2005. Randomised controlled trial of calcium and supplementation with cholecalciferol (vitamin D3) for prevention of fractures in primary care. British Medical Journal 330(7498): 1003.
Prentice, A., L. M. Jarjou, T. J. Cole, D. M. Stirling, B. Dibba and S. Fairweather-Tait. 1995. Calcium requirements of lactating Gambian mothers: effects of a calcium supplement on breast-milk calcium concentration, maternal bone mineral content, and urinary calcium excretion. American Journal of Clinical Nutrition 62(1): 58-67.
Prentice, A., L. Yan, L. M. Jarjou, B. Dibba, M. A. Laskey, D. M. Stirling and S. Fairweather-Tait. 1997. Vitamin D status does not influence the breast-milk calcium concentration of lactating mothers accustomed to a low calcium intake. Acta Paediatrica 86(9): 1006-8.
Priemel, M., C. von Domarus, T. O. Klatte, S. Kessler, J. Schlie, S. Meier, N. Proksch, F. Pastor, C. Netter, T. Streichert, K. Puschel and M. Amling. 2010. Bone mineralization defects and vitamin D deficiency: histomorphometric analysis of iliac crest bone biopsies and circulating 25-hydroxyvitamin D in 675 patients. Journal of Bone and Mineral Research 25(2): 305-12.
Prince, R. L., A. Devine, S. S. Dhaliwal and I. M. Dick. 2006. Effects of calcium supplementation on clinical fracture and bone structure: results of a 5-year, double-blind, placebo-controlled trial in elderly women. Archives of Internal Medicine 166(8): 869-75.
Rajakumar, K., J. D. Fernstrom, M. F. Holick, J. E. Janosky and S. L. Greenspan. 2008. Vitamin D status and response to Vitamin D(3) in obese vs. non-obese African American children. Obesity (Silver Spring) 16(1): 90-5.
Rothberg, A. D., J. M. Pettifor, D. F. Cohen, E. W. Sonnendecker and F. P. Ross. 1982. Maternal-infant vitamin D relationships during breast-feeding. Journal of Pediatrics 101(4): 500-3.
Saadi, H. F., A. Dawodu, B. O. Afandi, R. Zayed, S. Benedict and N. Nagelkerke. 2007. Efficacy of daily and monthly high-dose calciferol in vitamin D-deficient nulliparous and lactating women. American Journal of Clinical Nutrition 85(6): 1565-71.
Sanders, K. M., A. L. Stuart, E. J. Williamson, J. A. Simpson, M. A. Kotowicz, D. Young and G. C. Nicholson. 2010. Annual high-dose oral vitamin D and falls and fractures in older women: a randomized controlled trial. Journal of the American Medical Association 303(18): 1815-22.
Schou, A. J., C. Heuck and O. D. Wolthers. 2003. A randomized, controlled lower leg growth study of vitamin D supplementation to healthy children during the winter season. Annals of Human Biology 30(2): 214-9.
Smith, H., F. Anderson, H. Raphael, P. Maslin, S. Crozier and C. Cooper. 2007. Effect of annual intramuscular vitamin D on fracture risk in elderly men and women—a population-based, randomized, double-blind, placebo-controlled trial. Rheumatology 46(12): 1852-7.
Smith, S. M., K. K. Gardner, J. Locke and S. R. Zwart. 2009. Vitamin D supplementation during Antarctic winter. American Journal of Clinical Nutrition 89(4): 1092-8.
Sowers, M. 1996. Pregnancy and lactation as risk factors for subsequent bone loss and osteoporosis. Journal of Bone and Mineral Research 11(8): 1052-60.
Sowers, M., D. Zhang, B. W. Hollis, B. Shapiro, C. A. Janney, M. Crutchfield, M. A. Schork, F. Stanczyk and J. Randolph. 1998. Role of calciotrophic hormones in calcium mobilization of lactation. American Journal of Clinical Nutrition 67(2): 284-91.
Specker, B. L., M. L. Ho, A. Oestreich, T. A. Yin, Q. M. Shui, X. C. Chen and R. C. Tsang. 1992. Prospective study of vitamin D supplementation and rickets in China. Journal of Pediatrics 120(5): 733-9.
Specker, B. L., A. Beck, H. Kalkwarf and M. Ho. 1997. Randomized trial of varying mineral intake on total body bone mineral accretion during the first year of life. Pediatrics 99(6): E12.
Takeuchi, A., T. Okano, N. Tsugawa, Y. Tasaka, T. Kobayashi, S. Kodama and T. Matsuo. 1989. Effects of ergocalciferol supplementation on the concentration of vitamin D and its metabolites in human milk. Journal of Nutrition 119(11): 1639-46.
Tang, B. M., G. D. Eslick, C. Nowson, C. Smith and A. Bensoussan. 2007. Use of calcium or calcium in combination with vitamin D supplementation to prevent fractures and bone loss in people aged 50 years and older: a meta-analysis. Lancet 370(9588): 657-66.
Trivedi, D. P., R. Doll and K. T. Khaw. 2003. Effect of four monthly oral vitamin D3 (cholecalciferol) supplementation on fractures and mortality in men and women living in the community: randomised double blind controlled trial. British Medical Journal 326(7387): 469.
Tsai, K. S., H. Heath, 3rd, R. Kumar and B. L. Riggs. 1984. Impaired vitamin D metabolism with aging in women. Possible role in pathogenesis of senile osteoporosis. Journal of Clinical Investigation 73(6): 1668-72.
Van Der Klis, F. R., J. H. Jonxis, J. J. Van Doormaal, P. Sikkens, A. E. Saleh and F. A. Muskiet. 1996. Changes in vitamin-D metabolites and parathyroid hormone in plasma following cholecalciferol administration to pre- and postmenopausal women in the Netherlands in early spring and to postmenopausal women in Curacao. British Journal of Nutrition 75(4): 637-46.
van Schoor, N. M., M. Visser, S. M. Pluijm, N. Kuchuk, J. H. Smit and P. Lips. 2008. Vitamin D deficiency as a risk factor for osteoporotic fractures. Bone 42(2): 260-6.
Vatanparast, H., D. A. Bailey, A. D. Baxter-Jones and S. J. Whiting. 2010. Calcium requirements for bone growth in Canadian boys and girls during adolescence. British Journal of Nutrition: 1-6.
Viljakainen, H. T., A. M. Natri, M. Karkkainen, M. M. Huttunen, A. Palssa, J. Jakobsen, K. D. Cashman, C. Molgaard and C. Lamberg-Allardt. 2006. A positive dose–response effect of vitamin D supplementation on site-specific bone mineral augmentation in adolescent girls: a double-blinded randomized placebo-controlled 1-year intervention. Journal of Bone and Mineral Research 21(6): 836-44.
Viljakainen, H. T., M. Vaisanen, V. Kemi, T. Rikkonen, H. Kroger, E. K. Laitinen, H. Rita and C. Lamberg-Allardt. 2009. Wintertime vitamin D supplementation inhibits seasonal variation of calcitropic hormones and maintains bone turnover in healthy men. Journal of Bone and Mineral Research 24(2): 346-52.
Viljakainen, H. T., E. Saarnio, T. Hytinantti, M. Miettinen, H. Surcel, O. Makitie, S. Andersson, K. Laitinen and C. Lamberg-Allardt. 2010. Maternal vitamin D status determines bone variables in the newborn. Journal of Clinical Endocrinology and Metabolism 95(4): 1749-57.
Wagner, C. L., T. C. Hulsey, D. Fanning, M. Ebeling and B. W. Hollis. 2006. High-dose vitamin D3 supplementation in a cohort of breastfeeding mothers and their infants: a 6-month follow-up pilot study. Breastfeeding Medicine 1(2): 59-70.
Widdowson, E. M. 1965. Absorption and excretion of fat, nitrogen, and minerals from “filled” milks by babies one week old. Lancet 2(7422): 1099-105.


