
9
The Role of Inequality
Not all people in a country have the same risk of mortality or life expectancy at a given age. It has long been recognized that people of higher social status typically have better health, lower mortality rates, and higher life expectancy (see, for example, Lynch et al., 2004). Social inequality differs from the factors discussed in the preceding chapters of this volume in that it has been described as a “fundamental” cause of differences in exposure to, and experience of, risk for poor health outcomes (Link and Phelan, 1995; Phelan et al., 2010). The fundamental cause idea emphasizes that fact that there are many mechanisms through which social status creates social inequality in health. These mechanisms affect many aspects of life and are present at all times and in all countries, although the mechanisms and their importance may vary somewhat over time and place. Psychosocial differences—including stress; depression; and feelings of discrimination, mastery, and competence—are among the numerous mechanisms assumed to differ by social status that have not been considered specifically in this volume. Other unconsidered mechanisms include a wide range of living and working conditions throughout life. Still other mechanisms include factors already considered in some detail in previous chapters, such as health behaviors (e.g., obesity, physical activity, and smoking) and access to and utilization of health care (Braveman et al., 2011).
While socioeconomic differences in health tend to occur in all countries, the magnitude of the differentials in health and mortality can vary across countries with economic, political, social, and policy differences. The United States, for example, is thought to have greater inequality in health than Japan and some European countries (Avendano et al., 2010; Martikainen
et al., 2004). Two examples of mortality differentials in the United States that reflect largely socioeconomic differences are the substantially higher mortality among the black relative to the white population and the large geographic inequalities in health (Arias, 2010; Murray et al., 2006; Williams and Collins, 1995).
This chapter describes the gradient in mortality by socioeconomic status in the United States and other countries. It examines whether the relative size of the mortality disparity by socioeconomic status in some of this study’s comparison countries could account for the current disparities in life expectancy. It also examines whether the magnitude of the mortality gradient with socioeconomic status has changed over time and how these changes could contribute to disparities in survival.
MEASURING THE ASSOCIATION BETWEEN SOCIOECONOMIC INEQUALITY AND MORTALITY
The association between indicators of socioeconomic status, such as income and education, and mortality implies that the distribution of socioeconomic status within a country could affect mortality—in particular, that two countries with the same average income or education could have differences in health and mortality if income or education were differentially distributed. For instance, a country with greater income inequality—with more wealthy but also more poor people—may have worse average health and greater average mortality because the health benefits to the wealthy from their extra income are outweighed by the health deficits experienced by the poor. This is possible because the marginal benefits of additional income are greater for the poor than for the wealthy—an extra $10,000 per year can make a much greater difference to the health of a person earning $20,000 a year than to that of someone earning $200,000 a year. Thus when inequality is great, the decrease in life expectancy among those of lower socioeconomic status can outweigh the increase in life expectancy among those of higher socioeconomic status, leading to a life expectancy below that likely to be seen in a country with the same average level of the social indicator but less inequality (Preston, 1975; Rodgers, 1979).
Over time, a number of hypotheses have been offered concerning the precise relationship between inequality and health. The most straightforward of these, the absolute level hypothesis, holds that inequality plays no role beyond the simple one described in the previous paragraph. That is, an individual’s health is affected by his or her own socioeconomic status, but is not further affected by how the status of everyone else in the society is distributed (Kawachi et al., 2010; Lynch et al., 2004). Others have suggested that the presence of inequality itself may lead to poorer health and increased mortality for at least some of the population. Most of the pro
posed explanations along these lines focus on the social and psychological costs of inequality. Being in a lower socioeconomic class in a society with differences in status might, for example, lead to shame, distrust, or other negative emotions, which could have direct physiological effects on health through stress hormones, as well as indirect costs due to psychologically influenced behavior differences, such as stress leading to smoking (Kawachi et al., 2010; Lynch et al., 2000). Some have even suggested that the effects of inequality on a population are so pervasive that a lessening of inequality would improve health and decrease mortality for everyone (Mellor and Milyo, 2002; Wilkinson and Pickett, 2009). For a skeptical review of the evidence supporting this position, see Deaton (2003). Identifying the causal paths linking socioeconomic status to health and mortality remains an important objective for determining appropriate policy to address differentials in health and mortality, but this objective is beyond the scope of this volume (for extended discussion, see Kawachi et al., 2010).
Social inequality in health and mortality can be studied using a variety of indicators of social status, including education, occupation, income, and wealth, which are used as proxies for the complex web of mechanisms described above. All of these indicators can reflect the differential demands on and resources available to persons of different social classes that would affect their health and mortality; however, the choice of which measure is used in examining the role of social inequality in health and mortality can affect observed differences. This disparity may be especially evident when one is comparing people across a wide span of ages and across countries.
Education is the only measure of socioeconomic status that remains reasonably consistent across much of the life span and for which everyone can be classified. It is an indicator that precedes chronologically most of the health events of interest in this study and influences many of the more downstream mechanisms by which socioeconomic status affects health. On the other hand, education does not capture changes in socioeconomic status over the latter part of the life course and may not be as sensitive to state welfare policies aimed at mitigating socioeconomic differences, which differ between the United States and Europe (Avendano et al., 2010). Occupation is an indicator of social status that can be quite variable over the life cycle; many older persons, for example, may not have a current occupation. Moreover, some people, such as housewives, may never have had a formal occupation. Income and wealth vary over the life cycle as well. This variation may accurately reflect changes in economic capacity but can also reflect marital status, family status, and retirement status.
The bidirectional paths between socioeconomic status and health have been emphasized by economists (Smith, 2007), and economic measures are more likely than education to be affected by health rather than the other way around. Bidirectionality of causation is especially characteristic of older
ages, when health is an important determinant of work ability. In addition, income and wealth can be more affected by health in countries where disability and retirement benefits are less generous. Because of the link between one’s job and one’s health insurance in the United States, job loss in the United States can affect not only one’s income but also one’s access to health insurance. Paying for health care or health insurance after loss of a job, or because one does not have good health insurance, can reduce wealth. So in some circumstances, social inequality can be both a cause and a result of poor health. Forces in both directions may differ across countries, but in general, there should be less of a link between health and social status in countries with substantial social service networks and universal health insurance.
RELATIONSHIP BETWEEN OBSERVED SOCIOECONOMIC INEQUALITY AND HEALTH AND MORTALITY
Many studies have looked at the relationship between socioeconomic status and health and mortality in either one or a number of countries. They have almost invariably found that people at lower socioeconomic levels have poorer health on many dimensions (see the review in Elo, 2009). The Whitehall studies of British civil servants, for example, demonstrated a powerful link between occupational status and risk of death (Marmot et al., 1984). Likewise, in a large prospective study, Wolfson and colleagues tracked half a million Canadian men and compared their average income between the ages of 45 and 65 with their mortality rates from age 65 to 70. The researchers found a clear gradient, with men in each income bracket being less likely to die than those in the brackets below them (Wolfson et al., 1993). A study of 3 million men and women from Finland found that all-cause mortality rates among the 10 percent with the lowest income were 73 percent higher among women and 137 percent higher among men compared with the 10 percent with the highest income (Martikainen et al., 2001a). A study by Kitagawa and Hauser (1973), based on data from 1960 for the United States, was a ground-breaking work linking individual socioeconomic status to mortality. The authors found differentials in U.S. mortality by both family income and education for both whites and nonwhites aged 25–64.
Many studies examining differentials in mortality by socioeconomic status focus on mortality before age 65, when these differentials tend to be larger than at older ages. Kitagawa and Hauser (1973) looked at both younger and older adults and found that the differentials in the United States were much smaller above age 65. A number of more recent studies likewise have found fewer differentials in both health and mortality by socioeconomic status at higher ages (Antonovsky, 1967; Crimmins et al.,
2009; House et al., 1994; Marmot and Shipley, 1996; Rogot et al., 1992). This difference by age needs to be kept in mind in reviewing the results of many studies of inequality in health and mortality by socioeconomic status that cover different age ranges.
Specific causes of mortality also have been linked to socioeconomic status. For example, one massive study looked at mortality from ischemic heart disease in millions of people in 10 Western European populations. Among those aged 60+, men of lower socioeconomic status were 22 percent more likely to die from heart disease than men of higher socioeconomic status, and women of lower socioeconomic status were 36 percent more likely to die from heart disease than women of higher socioeconomic status (Avendano et al., 2006). A study in Sweden of 5,000 patients who had suffered heart attacks found that those from less affluent areas had an average survival time significantly lower than that of patients from more affluent areas (Tyden et al., 2002).
An estimation of U.S. differences in life expectancy at the end of the 1990s for three educational groups across the adult age range indicates substantial differences in the expected average length of life at all ages and for both sexes, although the differences are smaller at older ages (see Table 9-1). At age 50, men in the high education group could expect to live 5.6 more years than those with low education; for women at this age, the difference is 3.9 years. At age 80, the difference is about 1 year for men and 1.5 years for women. Thus there is no question that life expectancy in the United States would be higher if no one experienced the levels of life expectancy of the lower education groups. But is the difference in life expectancy by education greater than in other countries? This question is taken up later in the chapter.
TABLE 9-1 Life Expectancy by Age and Years of Education for the United States at the End of the 1990s
|
ex |
Males Years of Education |
Females Years of Education |
Both Sexes Combined Years of Education |
||||||
|
0–8 |
9–12 |
13+ |
0–8 |
9–12 |
13+ |
0–8 |
9–12 |
13+ |
|
|
20 |
51.2 |
52.0 |
59.4 |
57.7 |
58.4 |
62.7 |
54.2 |
55.4 |
61.0 |
|
30 |
42.5 |
43.0 |
49.7 |
48.2 |
48.8 |
52.8 |
45.2 |
46.2 |
51.2 |
|
40 |
33.6 |
34.1 |
40.2 |
38.9 |
39.5 |
43.1 |
36.1 |
37.0 |
41.6 |
|
50 |
25.3 |
25.8 |
30.9 |
29.8 |
30.5 |
33.7 |
27.4 |
28.4 |
32.2 |
|
60 |
18.0 |
18.4 |
22.2 |
21.6 |
22.1 |
24.6 |
19.8 |
20.5 |
23.4 |
|
70 |
12.2 |
12.2 |
14.6 |
14.6 |
14.6 |
16.4 |
13.5 |
13.7 |
15.5 |
|
80 |
7.6 |
7.5 |
8.5 |
8.6 |
8.5 |
9.1 |
8.2 |
8.1 |
8.8 |
|
SOURCE: Data from Molla et al. (2004). |
|||||||||
The above discussion provides some idea of the current gap in life expectancy by socioeconomic status in the United States, but what has been the time trend in these mortality differentials? In the United States, studies of the period 1960–1980 found that educational differentials in mortality increased, but the increase occurred primarily among men. There was actually a decrease in mortality differentials by education among working-age women (Pappas et al., 1993; Preston and Elo, 1995). A narrowing of educational differentials in mortality for white women aged 30 and older from 1970 to 1990 resulting from very small gains in life expectancy among those with the highest education also has been reported (Crimmins and Saito, 2001).
Several researchers who have examined the period 1980–2000 report a widening of mortality differentials for both men and women due generally to larger increases in life expectancy among those with higher education and stagnation or decreases in life expectancy among the lowest education group (Jemal et al., 2008; Meara et al., 2008). Meara and colleagues (2008) found that the educational differential in life expectancy at age 25 increased by about 30 percent from the 1980s to the 1990s. They also found that most of the increase in the differential was due to mortality change above age 45. Among women, there were increases in the educational differences in mortality from cancer, heart disease, and chronic obstructive pulmonary disease (COPD). A study of U.S. males aged 60+ covered by social security found increases in mortality differentials from 1972 to 2001 when the men were classified by their incomes at ages 45–55; improvements occurred more rapidly among men in the higher income group relative to those in the lower income group (Waldron, 2007). Thus, increasing socioeconomic inequality in mortality within the United States appears to have influenced overall U.S. mortality trends in recent decades. Life expectancy would have increased more rapidly if it had increased in all socioeconomic groups at the same rate as in the highest socioeconomic group.
WHAT CAN BE LEARNED FROM TRENDS IN RACIAL INEQUALITY IN MORTALITY IN THE UNITED STATES?
As indicated at the beginning of this chapter, blacks have much higher mortality than whites in the United States. For ages above 50, a number of researchers have concluded that racial differences in health and mortality in the United States are attributable primarily to racial differences in socioeconomic status (Hayward et al., 2000; Preston and Taubman, 1994; Smith and Kington, 1997; Williams and Collins, 1995). Because racial differences in mortality reflect largely socioeconomic differences and because more data are available in the United States by race than by socioeconomic status, an
examination of mortality trends in the United States for blacks and whites may provide further insight into differential trends in life expectancy by socioeconomic status.
Racial differences in mortality, like socioeconomic differences, are quite large over most of the life cycle but are smaller at older ages. In fact, many researchers have found a crossover between white and black mortality at the oldest ages (Johnson, 2000; Manton and Stallard, 1997), although whether there is a crossover and at what age it occurs may be related to the quality of mortality data for blacks at the oldest ages (Hill et al., 2000; Preston et al., 1996). Yet while data quality may be important in assessing mortality at very old ages, such data problems would have little effect on either the racial differences or trends in those differences discussed here.
In 2006, life expectancy in the United States at age 50 was 32.6 years for white women and 30.2 years for black women; white men at age 50 could expect to live 29.0 years on average and black men 25.2 years (see Figure 9-1). Between 1980 and 2006, life expectancy at age 50 increased by 3.6 years for black men and 3.8 years for white men. Life expectancy at age 50 for black women increased by 2.9 years and for white women by 1.7 years. Thus the racial difference in life expectancy for men is almost the same at present as it was in 1980 (see Figure 9-2). For women, however, the racial difference in life expectancy has grown smaller because of the slower growth in life expectancy for white women. These differences in life expectancy by race indicate that the slowdown in the increase in U.S. life expectancy appears to characterize women, and white women in particular. In addition, even though there appears to have been a growing inequality in mortality in the United States by socioeconomic status in recent years, this does not appear to be due to a widening of inequality by race.
The findings of two recent studies of mortality trends reinforce these conclusions. Meara and colleagues (2008) report that increasing educational disparities in mortality do not reflect growing racial disparities. Jemal and colleagues (2008) note that for the period 1993–2001 for the U.S. population aged 25–64, the annual percentage decline in age-standardized mortality was highest for black men and lowest for white women. Furthermore, among white women, those with the lowest education experienced increases in mortality rather than decreases over the period. Thus, the evidence suggests that while black/white mortality differentials are important in determining overall levels of life expectancy and explain part of the gap between the United States and other countries, changes in race differentials do not explain the trend in U.S. life expectancy.
FIGURE 9-1 U.S. life expectancy at age 50 by race and gender, 1980−2006.
SOURCES: Data from Anderson (1998, 1999, 2001); Anderson and DeTurk (2002); Arias (2010); Arias et al. (2010); National Center for Health Statistics (1984, 1985, 1986, 1987, 1988, 1989, 1990, 1991, 1992, 1994, 1995, 1996, 1997, 1998a, 1998b).
FIGURE 9-2 Racial differences in life expectancy at age 50 for U.S. men and women, 1980–2006.
SOURCES: Data from Anderson (1998, 1999, 2001); Anderson and DeTurk (2002), Arias (2010); Arias et al. (2010); National Center for Health Statistics (1984, 1985, 1986, 1987, 1988, 1989, 1990, 1991, 1992, 1994, 1995, 1996, 1997, 1998a, 1998b).
INTERNATIONAL DIFFERENCES IN THE LINK BETWEEN SOCIOECONOMIC STATUS AND HEALTH AND MORTALITY
A variety of studies have examined differences in the relationship between socioeconomic status and health and mortality across countries. An examination of self-reported health and mortality versus socioeconomic status in 22 European countries found that in almost every country, lower socioeconomic status was associated with poorer health and higher mortality. However, the size of the differences varied greatly from country to country. Differences in mortality rates tended to be larger in Northern European countries and smaller in Southern European countries, for example, but very large in Eastern Europe and the Baltic region (Mackenbach et al., 2008). An earlier study of differences in mortality due to ischemic heart disease by occupation across a group of European countries and the United States found higher gradients in the north of Europe and smaller gradients in the south, with the United States in between (Kunst et al., 1999).
A recent paper that looked at the relationship between socioeconomic status and disease in the United States and England among persons in late middle age found that in both countries, people of lower socioeconomic status had significantly higher rates of diabetes, hypertension, heart attack, stroke, lung disease, and cancer. However, people in the United States
had significantly higher rates of disease than those in England across all socioeconomic groups (Banks et al., 2006). An additional study comparing health differences between rich and poor Americans and between rich and poor Europeans aged 50–74 found that at all wealth levels, Americans had more health problems than Europeans. However, the differences were most pronounced at lower levels of wealth and largely disappeared when the wealthiest Americans were compared with the wealthiest Europeans (Avendano et al., 2009).
Researchers have reported a widening of inequalities in mortality by socioeconomic status in Europe from the 1970s through the 1990s (Harding, 1995; Hemström, 2000; Mackenbach et al., 2003; Martikainen et al., 2001b; Valkonen et al., 2000). The same widening of differentials has been reported in a number of individual countries as well, as in a study of six Western European countries by Mackenbach and colleagues (2003). In those six countries, the widening of differentials was primarily the result of faster mortality decline among the most advantaged. Thus it appears that at least some European countries, like the United States, saw less mortality improvement than they would have if the least advantaged had had the experience of the most advantaged.
Japanese socioeconomic differentials in health and mortality have historically been smaller than those in the United States (Marmot and Davey Smith, 1989). However, studies of longitudinal data on the older Japanese population indicate some differentials, including higher mortality among those of low economic and educational status (Liang et al., 2002). From the early 1960s to the late 1980s, Japan had the narrowest income differentials among all industrialized countries, and it has been suggested that smaller differentials in health by socioeconomic status in Japan may have resulted from this low level of inequality (Marmot and Davey Smith, 1989; Shibuya et al., 2002; Wilkinson, 1994). There is also some evidence of increasing inequality in socioeconomic status and associated differentials in health in Japan (Fukuda et al., 2004; Martikainen et al., 2004; Nishi et al., 2004).
Comparable date for Europe and Japan on differences in life expectancy at age 50 by socioeconomic status are not available. However, a recent analysis provides data on life expectancy at age 65 for three educational groups in 10 European countries that can be compared with data on life expectancy for the three groups at age 65 in the life tables of Molla and colleagues (2004) described previously (Majer et al., 2010). While this comparison provides an opportunity to examine the relative size of differentials in life expectancy in some of the European countries examined in this study, the educational groupings are only roughly comparable in Europe and the United States, as the boundaries of the categories for the United States are at somewhat lower education levels.
The U.S. spread in the range of life expectancy from the high to the low education group is somewhat larger than the average European spread for both men and women (see Table 9-2). For men this occurs because average life expectancy for U.S. men in the highest education group is higher than that in the European countries, while life expectancy in the lowest education group is identical. Women in each educational grouping in the United States have lower life expectancy than the average for European
TABLE 9-2 Life Expectancy at Age 65 (Years) by Level of Education in Selected European Countries and the United States
women in the comparable groups. It should be noted that there is considerable variation in inequality in life expectancy by education within Europe. Denmark shows relatively low inequality, particularly among women, while France shows higher than average inequality. Looking only at the lowest educational group, the United States has higher life expectancy for males than 6 of the 10 European countries; among females, however, the U.S. level exceeds only that of Denmark.
The results of these studies suggest that economic inequality could explain some of the differences in life expectancy between the United States and other countries, but none of the studies address that issue explicitly, nor do they address the role of trends in inequality. Two of the studies prepared for the panel attempt to do so.
THE ROLE OF SOCIOECONOMIC INEQUALITY IN DIFFERENCES IN LIFE EXPECTANCY
Avendano and colleagues (2010) examined mortality rates for different socioeconomic classes in the United States, for blacks and whites as well as the total population, and in a number of European countries, including Denmark, England, and France, using data from the U.S. National Health Interview Survey (NHIS) and a variety of European data sets (Avendano et al., 2010). They studied men and women who were aged 30–74 between 1990 and 2003; they also examined differences for white and black Americans. Educational level was used as a measure of socioeconomic status.
The authors chose to use education as the basic index of socioeconomic status because it is relatively easy to measure, it can be made closely comparable from country to country, and it is much less susceptible to the problem of reverse causation than income or wealth. The authors used comparable levels of education in each country to divide people into low, middle, and high levels of education. These three levels correspond roughly to having 11 years of education or less in the United States, 12–15 years of education, and a bachelor’s degree or more. The authors caution that the study’s findings on the relationship between education and mortality in different countries may not be generalizable to other measures of socioeconomic status or to other classifications of education.
The authors found that at ages from 30 to the mid-80s, mortality rates were lower for U.S. men than for men in Finland, Denmark, and Belgium but higher than for men in the other Western European countries considered in the study (see Table 9-3). Among women, Denmark was the only Western European country with mortality rates higher than those in the United States (see Table 9-4).
Mortality rates among U.S. blacks were much higher than those among U.S. whites and were higher than those in any of the Western European
TABLE 9-3 Mortality Ratesa Per 100,000 Person-Years According to Education Level,b Distribution of Education, and Population Attributable Fraction (PAF) for Men Aged 30–74 in Selected European Countries and the United States
|
|
Mortality Rates per 100,000 Person-Years |
Distribution of Education in the Population |
||||||
|
|
Low Ed. |
Middle Ed. |
High Ed. |
Overall Rate |
% Low |
% Middle |
% High |
PAFc |
|
United States, all |
1,840 |
1,339 |
885 |
1,379 |
20 |
54 |
26 |
39 |
|
United States, whites |
1,779 |
1,316 |
876 |
1,334 |
19 |
54 |
27 |
38 |
|
United States, blacks |
2,264 |
1,658 |
1,198 |
1,903 |
32 |
55 |
14 |
39 |
|
Finland |
1,700 |
1,410 |
942 |
1,528 |
49 |
30 |
22 |
41 |
|
Sweden |
1,151 |
953 |
706 |
1,026 |
40 |
43 |
16 |
33 |
|
Norway |
1,498 |
1,194 |
873 |
1,272 |
30 |
48 |
22 |
33 |
|
Denmark |
1,659 |
1,400 |
982 |
1,508 |
43 |
38 |
19 |
37 |
|
England/Walesd |
1,128 |
786 |
652 |
1,074 |
83 |
7 |
10 |
39 |
|
Belgium |
1,590 |
1,264 |
999 |
1,480 |
61 |
22 |
17 |
32 |
|
Switzerland |
1,477 |
1,123 |
831 |
1,165 |
20 |
56 |
24 |
30 |
|
France |
1,285 |
955 |
624 |
1,132 |
50 |
37 |
13 |
51 |
|
aRates are directly standardized to the U.S. census population of 1995. Most samples were aged 30–74 at baseline and had at least 10 years of follow-up; however, samples in Belgium and Denmark were 30–79 at baseline and had follow-up of 5 years or less. Most data sets begin in the 1990s; for example, the U.S. sample was from the 1989–1993 National Health Interview Survey with mortality follow-up through 2002. bEducation categories: low education = comparable to 0–11 years; middle education = comparable to 9–15 years; high education = comparable to 16+ years or a bachelor’s degree in the United States. cPAF = population attributable fraction. PAF calculations in this column define the “high education” group as the unexposed category. dEducation levels for England and Wales do not correspond to the International Standard Classification of Education levels. The low education category includes some individuals with medium education as well. No further distinction was possible through census data. SOURCE: Adapted from Avendano et al. (2010, Table 11-2). |
||||||||
TABLE 9-4 Mortality Ratesa Per 100,000 Person-Years According to Education Levelb and Population Attributable Fraction (PAF) for Women Aged 30–74 in Selected European Countries and the United States
|
|
Mortality Rates |
Distribution of Education in the Population |
||||||
|
|
Low Ed. |
Middle Ed. |
High Ed. |
Overall Rate |
% Low |
% Middle |
% High |
PAFc |
|
United States, all |
1,142 |
839 |
588 |
888 |
20 |
61 |
19 |
36 |
|
United States, whites |
1,099 |
818 |
583 |
856 |
18 |
62 |
20 |
34 |
|
United States, blacks |
1,399 |
1,091 |
765 |
1,197 |
30 |
57 |
13 |
39 |
|
Finland |
794 |
631 |
528 |
735 |
51 |
29 |
20 |
26 |
|
Sweden |
657 |
534 |
402 |
589 |
41 |
40 |
19 |
32 |
|
Norway |
801 |
616 |
484 |
697 |
36 |
47 |
17 |
31 |
|
Denmark |
1,037 |
814 |
664 |
960 |
53 |
28 |
19 |
29 |
|
England/Walesd |
670 |
472 |
394 |
652 |
87 |
8 |
5 |
40 |
|
Belgium |
801 |
628 |
582 |
766 |
67 |
19 |
14 |
22 |
|
Switzerland |
657 |
523 |
472 |
591 |
40 |
53 |
7 |
19 |
|
France |
530 |
387 |
334 |
492 |
62 |
28 |
10 |
31 |
|
aRates are directly standardized to the U.S. census population of 1995. Most samples were aged 30–74 at baseline and had at least 10 years of follow-up; however, samples in Belgium and Denmark were 30–79 at baseline and had follow-up of 5 years or less. Most data sets begin in the 1990s; for example, the U.S. sample was from the 1989–1993 National Health Interview Survey with mortality follow-up through 2002. bEducation categories: low education = comparable to 0–11 years; middle education = comparable to 9–15 years; high education = comparable to 16+ years or a bachelor’s degree in the United States. cPAF = population attributable fraction. PAF calculations in this column define the “higher education” group as the unexposed category. dEducation levels for England and Wales do not correspond to the International Standard Classification of Education levels. The low education category includes some individuals with medium education as well. No further distinction was possible through census data. SOURCE: Adapted from Avendano et al. (2010, Table 11-3). |
||||||||
countries examined. When the authors looked at how mortality rates varied by educational level, the international rankings differed at high versus low levels. Among those with a low level of education (equivalent to 11 years or less), the mortality among men and women in the United States, both black and white, was higher than that in any of the Western European countries. In contrast, among those with the highest level of education—equivalent to a bachelor’s degree or higher in U.S. universities—U.S. men fared better, ranking higher than men in three of the eight Western European countries. However, their U.S. female counterparts fared worse than highly educated women in all but Denmark. Mortality levels among highly educated blacks in the United States were higher than those among the highly educated in any other country. In short, among the most highly educated people, white men in the United States had mortality rates that compared favorably with those of men in some countries in Western Europe, while white women had rates that were higher than those of women in most of the Western European countries, and blacks had mortality rates worse than all of the comparable groups in Western Europe (Avendano et al., 2010).
To provide a summary of the effect of educational inequality on mortality rates, the authors calculated the relative index of inequality (RII) for each country. This number, which is obtained from a regression calculation, can be thought of as the ratio of mortality between those with the least education and those with the most (Mackenbach and Kunst, 1997). Thus an RII of 2 would mean that people at the bottom of the educational distribution have a mortality rate twice as high as that of those at the top (Hayes and Berry, 2002; Pamuk, 1985). The index takes appropriate account not only of differences in mortality among educational groups but also of the relative size of the groups. By comparing the RII among different countries, one can determine in which countries educational inequalities in mortality rates are greatest.
Figure 9-3 shows the RII for men and women in the United States and the Western European countries included in the study by Avendano and colleagues. The RII for U.S. white men was 2.4, similar to the RII for men in Norway and Switzerland and smaller than the RII for men in England or France. The RII for U.S. black men was somewhat smaller than that for white men, but still fell in the middle of that for the Western European countries. The RII for U.S. white women was larger than that for women in all the Western European countries except England and France. The RII for U.S. black women was somewhat lower than that for U.S. white women. The United States, therefore, does not stand out as having unusually large effects of educational inequality on mortality rates in this age range using this measure, although relative inequality appears to be more important for U.S. women than for U.S. men. The relatively large educational differences in mortality rates in the United States are counteracted by having a relatively
FIGURE 9-3 Relative index of inequality (RII) in mortality by education level for men and women aged 30–74 in the United States and selected European countries
NOTE: The RII is a regression-based measure that accounts for differences in the distribution of education among countries and in mortality by education. This measure regresses mortality on an education ranking, defined as the midpoint of the range of the cumulative distribution of education in each country (Mackenbach and Kunst, 1997). The RII can be interpreted as the ratio of mortality for rank 1 (the lowest point of the education distribution) to that for rank 0 (the top end of the education distribution).
SOURCE: Avendano et al. (2010, Figure 11-1).
large portion of the population at the top of the educational distribution and a relatively small portion at the bottom.
A second way of describing the effect of socioeconomic status on a country’s mortality rates is to calculate the population attributable factor (PAF). This calculation assumes that lower educational levels “cause” increased mortality, and the PAF is, in effect, the proportion of deaths in a population that would theoretically be avoided if everyone achieved the mortality rates of the highest educational level. The PAF for U.S. men was 39 percent, about the same as for English or Danish men (see Table 9-3); it was lower than the PAF for men in Finland and France. The PAF for U.S. women was 36 percent, again higher than that for the women in all of the countries except England and Wales (see Table 9-4).
The authors note that the PAF for U.S. men and women is smaller than might be expected because of a higher distribution of educational attainment in the United States. Only 20 percent of U.S. men and women aged 50 and above had an 11th-grade education or less. Among Europeans, the percentages for men were similar in Switzerland (20 percent) but were
much higher in other Northern and Western European countries (e.g., 43 in Denmark and 50 in France), while for women the numbers were even higher in the European countries. Similarly, the percentage of men with a bachelor’s degree or higher was greater in the United States than in any of the European countries; among women, the percentages with at least 16 years of education were equally high in the United States, Finland, Sweden, and Denmark. From this analysis one can conclude that while the United States has relatively large differentials in health and morality by education, the effect of this inequality is substantially muted relative to other countries because of a favorable educational distribution. For U.S. women, however, the inequality is more important in determining overall levels of mortality than in most other countries, and this is true for both blacks and whites.
U.S. life expectancy, like that of other countries, would be higher if the mortality of groups with the lowest socioeconomic status were lower. However, the poor ranking of U.S. life expectancy is not merely the result of high mortality among those of low socioeconomic status. U.S. women at both higher and lower levels of socioeconomic status rank poorly in mortality. U.S. rankings in life expectancy for women are affected by both the high levels of mortality across all socioeconomic groups and the relatively high levels of inequality.
WHAT CAN BE LEARNED FROM GEOGRAPHIC INEQUALITY?
The discussion in the previous section provides evidence for evaluating the role of differences in socioeconomic status as a source of the gap in life expectancy between the United States and other countries. Geography is a second dimension along which mortality differences can be investigated. Geographic variability in mortality in the United States has been sizable and is highly related to differences by socioeconomic status and race. Murray and colleagues (2006) divided U.S. counties into eight groups based on race, income, population, density, and homicide rates and found that in 2001, the differences in life expectancy at birth between the best-off and the worst-off groups were 15.4 years for males and 12.8 years for females. They also found that the magnitude of the differences between the best-off and the worst-off groups increased somewhat for men and decreased for women between 1982 and 2001. Singh and Siahpush (2006) report a widening of geographic inequality in mortality over the period 1980–2000. Ezzati and colleagues (2008) examined county-level mortality over a longer period, 1961–1999, and found that in 1999, men in the highest-ranked counties had a life expectancy 18 years longer than that of men in the lowest-ranked counties, while women in the highest-ranked counties had a life expectancy 13 years longer than that of women in the lowest-ranked countries. The county-to-county variability decreased from 1961 to 1983
but then increased from 1983 to 1999. During the period 1983 to 1999, there were several counties in which life expectancy actually decreased, especially among women. These studies suggest rising geographic inequality in mortality in recent decades, again particularly for women, but their results include mortality across the age range, and they do not compare changes in the United States with those in other countries.
In a paper prepared for the panel, Wilmoth and colleagues (2010) describe how life expectancy at age 50 in the United States varied across states and counties over the 50 years from 1950 to 2000. Their analysis is based on data for the United States, Japan, and 19 national or large subnational areas of Western Europe, gathered from the Human Mortality Database. The authors also studied regional mortality within five countries: the United States, Japan, France, Canada, and Germany.
The data show that U.S. life expectancy at age 50 varied significantly from state to state (see Figure 9-4). In 2000, Hawaii (not shown), Utah, and several north central states had the highest life expectancies, while the District of Columbia and several southern states had the lowest. No state other than Hawaii had a life expectancy comparable to those of the countries with the highest life expectancies, such as Japan, Australia, and Switzerland. The states with the highest life expectancies after Hawaii, mainly in the north central and mountain regions of the United States, achieved life expectancies only in the middle of the range for high-income countries; thus the U.S. disadvantage was not limited to poorer-performing states. A large number of states, many of them southern, had life expectancies well below the norm for most high-income countries. Only a few countries—Denmark, Ireland, and Scotland—had life expectancies at age 50 comparable to those of these states. These geographic variations suggest that compositional differences play a role in some of the state-to-state variation found in the United States. Southern states, and particularly the District of Columbia, have lower-thanaverage educational and income levels and a higher proportion of blacks.
Data from this paper can also be used to examine differential trends across time in the United States and other countries (see Figure 9-5). In contrast to most of the populations studied, geographic disparities in mortality in the United States increased over the past two decades of the 20th century for both men and women (Wilmoth et al., 2010). This is shown by the relative size of the bands encompassing the lines indicating life expectancy at age 50 for each quintile of the distribution in the United States, Canada, France, and Western Europe as a whole (see Figure 9-5). In the United States, the spread is wider in more recent years and wider than in the other countries. Comparing the United States with other countries, however, Wilmoth and colleagues conclude that less than 10 percent of the slow progress in gains in life expectancy at age 50 for women can be attributed to differential trends in regional disparities; the years of life expectancy gained at age 50 from
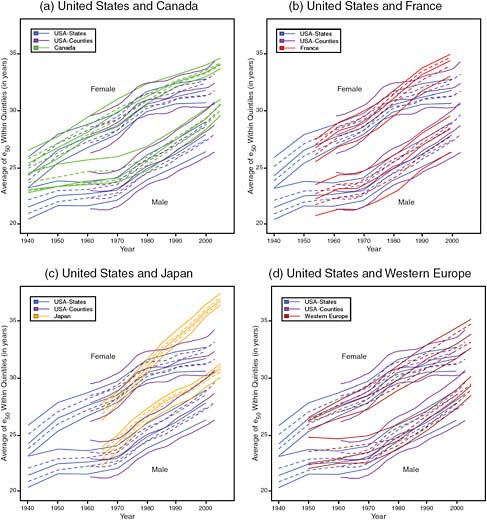
FIGURE 9-5 Trends in the average value of life expectancy at age 50 within quintiles of geographic distribution, United States compared with Canada, France, Japan, and Western Europe, 1940–2005.
NOTE: Each line represents the trend for one quintile; the spread of the lines represents the inequality across quintiles.
SOURCE: Wilmoth et al. (2010, Figures 12-7a–12-7d). Reprinted with permission.
1980 to 2000 were not much different in the upper half of the distribution than in the lower half. The authors report that for men, on the other hand, the slower progress in states with lower versus higher life expectancy was a significant factor in the slow progress of U.S. life expectancy compared with that of other countries. Thus, it appears that diverging trends in life expectancy among women are not simply a result of slowing mortality de-
cline among the least advantaged regions of the United States. Wilmoth and colleagues conclude that “any proposed explanation of the divergence in levels and trends of life expectancy observed among high-income countries in recent decades needs to acknowledge that even the most advantaged areas of the United States (at the state or county level) have been falling behind in international comparisons” (Wilmoth et al., 2010, p. 360).
WHAT EXPLAINS INCREASES IN INEQUALITY IN MORTALITY?
As indicated at the beginning of this chapter, socioeconomic status can be considered a fundamental cause of differentials in health and mortality and one that works through many mechanisms. Explanations for the existence of changes in inequality in mortality often focus on two levels: causes of death and more proximate behavioral mechanisms. For both the United States and Europe, the most important causes of death—cardiovascular diseases and cancer—tend to account for much of the inequality in mortality (Danaei et al., 2010; Mackenbach and Garssen, 2010). Recent trends in mortality differentials also have been affected by differential changes in cardiovascular diseases and cancer (Jemal et al., 2008; Mackenbach and Garssen, 2010; Meara et al., 2008). Among the types of cancer, lung cancer has had an important role in these trends.
Meara and colleagues estimated that 20 percent of the increase they observed in U.S. inequality in morality is related to different patterns of smoking. Ezzati and colleagues (2008) indicate that the increase in geographic inequality in mortality in the United States is explained in part by differential patterns of smoking and overweight.
One can ask whether larger disparities in behavioral risk factors exist in some countries than in others. Using the same educational differences as those examined by Avendano and colleagues (2010), it appears that differences in the proportion smoking in low and high education groups are larger for men in the United States than for those in most European countries or Japan (see Table 9-5). American men with less than a high school education are 2.5 times more likely to currently smoke and 1.5 times as likely to ever have smoked as those who have completed college. The current smoking prevalence among U.S. women with low education is 2.25 times higher than among the high education group. The other countries with large educational differentials among women are England and the Netherlands.
For men the educational differential in obesity is relatively small in the United States (1.3); it is similar to the differentials in Canada and England and lower than those in other countries. The educational differential in obesity for women is moderate in the United States (1.50); it is similar to those in Canada and England. Thus while there are consistent differentials in health behaviors in the United States that raise health risks among
TABLE 9-5 Smoking and Obesity by Education: Proportion Who Currently Smoke, Ever Smoked, or Are Obese by Years of Education and Ratio of Lowest Education Group (![]() years) to Highest (
years) to Highest (![]() years)
years)
|
Males Aged 50+ |
||||||||||||
|
Education (years) |
Currently Smoking |
Ever Smoked |
Obese |
|||||||||
|
|
12–15 |
|
Ratio |
|
12–15 |
|
Ratio |
|
12–15 |
|
Ratio |
|
|
Netherlands |
.31 |
.26 |
.23 |
1.35 |
.79 |
.74 |
.73 |
1.08 |
.17 |
.10 |
.06 |
2.83 |
|
Spain |
.28 |
.51 |
.31 |
.90 |
.67 |
.80 |
.61 |
1.10 |
.22 |
.05 |
.08 |
2.75 |
|
Italy |
.24 |
.24 |
.21 |
1.14 |
.62 |
.71 |
.64 |
.97 |
.18 |
.12 |
.06 |
3.00 |
|
France |
.18 |
.16 |
.30 |
.60 |
.64 |
.61 |
.68 |
.94 |
.17 |
.10 |
.08 |
2.12 |
|
Denmark |
.34 |
.34 |
.29 |
1.17 |
.74 |
.73 |
.68 |
1.09 |
.20 |
.13 |
.10 |
2.00 |
|
England (aged 52+) |
.16 |
.13 |
.10 |
1.60 |
.74 |
.68 |
.64 |
1.16 |
.27 |
.29 |
.21 |
1.29 |
|
Japan (aged 67+) |
.20 |
.23 |
.20 |
1.00 |
.78 |
.73 |
.73 |
1.08 |
.02 |
.01 |
.01 |
2.00 |
|
Canada |
.21 |
.20 |
.16 |
1.31 |
.75 |
.72 |
.65 |
1.15 |
.20 |
.20 |
.16 |
1.25 |
|
United States |
.25 |
.20 |
.10 |
2.50 |
.79 |
.72 |
.54 |
1.46 |
.28 |
.30 |
.21 |
1.33 |
|
Females 50+ |
||||||||||||
|
Education (years) |
Currently Smoking |
Ever Smoked |
Obese |
|||||||||
|
|
12–15 |
|
Ratio |
|
12–15 |
|
Ratio |
|
12–15 |
|
Ratio |
|
|
Netherlands |
.22 |
.22 |
.08 |
2.75 |
.46 |
.51 |
.55 |
.84 |
.19 |
.13 |
.08 |
2.38 |
|
Spain* |
.07 |
.27 |
.00 |
.22 |
.11 |
.46 |
.55 |
.20 |
.27 |
.13 |
.13 |
2.08 |
|
Italy |
.12 |
.21 |
.21 |
.57 |
.23 |
.50 |
.56 |
.41 |
.19 |
.11 |
.06 |
3.17 |
|
France |
.06 |
.18 |
.20 |
.30 |
.16 |
.38 |
.51 |
.31 |
.18 |
.10 |
.05 |
3.60 |
|
Denmark |
.33 |
.30 |
.24 |
1.38 |
.59 |
.57 |
.57 |
1.03 |
.16 |
.13 |
.08 |
2.00 |
|
England (aged 52+) |
.16 |
.16 |
.07 |
2.29 |
.74 |
.53 |
.54 |
1.37 |
.27 |
.31 |
.22 |
1.23 |
|
Japan (aged 67+)* |
.04 |
.08 |
.20 |
.20 |
.08 |
.10 |
.39 |
.20 |
.03 |
.01 |
.00 |
3.00 |
|
Canada |
.16 |
.18 |
.14 |
1.14 |
.44 |
.50 |
.48 |
0.92 |
.22 |
.16 |
.15 |
1.47 |
|
United States |
.18 |
.16 |
.08 |
2.25 |
.49 |
.50 |
.45 |
1.09 |
.33 |
.29 |
.22 |
1.50 |
|
*Ratio for current smoking in Spain is SOURCES: For England, English Longitudinal Study of Ageing (ELSA), 2004–2005; for other European countries, Survey of Health, Ageing and Retirement in Europe (SHARE), 2004; for the United States, Health and Retirement Study (HRS), 2004; for Japan, Nihon University Japanese Longitudinal Study of Aging (NUJLSOA), 2006; for Canada, Canadian Community Health Survey (CCHS), 2003. More information about these data sets is available at the following websites: http://www.share-project.org/ (SHARE); http://hrsonline.isr.umich.edu/ (HRS); http://www.usc.edu/dept/gero/CBPH/nujlsoa/ NUJLSOA); http://www.ifs.org.uk/elsa/ (ELSA); and http://www.statcan.gc.ca/cgi-bin/imdb/p2SV.pl?Function=getSurvey&SDDS=3226& lang=en&db=imdb&adm=8&dis=2 (CCHS). |
||||||||||||
those with lower education, a number of other countries have similar differentials.
Studies in both Europe and the United States have noted the significant role of behavioral differences in partially explaining differentials in mortality by socioeconomic status (Cutler et al., 2010; Mackenbach and Garssen, 2010; Meara et al., 2008). However, these same studies have noted that these behavioral factors do not explain most of the differentials by socioeconomic status in health, nor do they explain most of the trend. An exception is Jha and colleagues (2006), who used the Peto/Lopez method described in Chapter 7 to estimate deaths attributable to smoking at ages 35–69 among three social classes in the United States, England and Wales, Canada, and Poland. They found that a majority of the difference in mortality between the lowest and highest classes in each of these countries is attributable to smoking.
DISCUSSION
Much of this chapter has examined differences in mortality by educational level in the United States and other countries, viewing education, as an indicator of socioeconomic status, as a fundamental cause of inequalities in health. With respect to income inequalities, it is widely believed that such inequalities are greater in the United States than in other high-income countries, in part because the United States does less to redistribute wealth among its citizens (Organisation for Economic Co-operation and Development, 2008; Wolf, 1996). Poverty rates also appear to be higher in the United States than in most of the other countries considered here, as evidenced by further data from the OECD study indicating the proportion of the population below half-median income, or by micro-level data on the ratio of income at the 10th percentile relative to median income (Krueger et al., 2009).
Furthermore, a large number of people in the United States, especially at lower levels of socioeconomic status, have no health insurance, while most Western European countries have national health care coverage programs. It is also true that people in the United States are less protected from loss of either income or wealth because of health problems than those in most Western European countries. Health problems are a major reason for bankruptcy in the United States, and this is less likely to be the case in Europe or Japan (Himmelstein et al., 2005). We have also seen that socioeconomic differentials in smoking tend to be larger in the United States than in other countries.
This combination of factors could result in higher mortality rates among people in lower socioeconomic brackets in the United States than in other countries, pulling down U.S. life expectancy levels in general. This possi-
bility is consistent with the conclusion of Avendano and colleagues (2010, p. 322), that “our results partly support the hypothesis that U.S. excess mortality is to some extent attributable to larger excess mortality at lower education levels.” In particular, there is a clear pattern among U.S. white males that fits this hypothesis: among those with the least education, mortality is significantly higher in the United States than in European countries, while among those with the most education, the U.S. mortality rate ranks in the middle of values for Northern and Western European countries. On the other hand, the pattern for U.S. women is somewhat different: mortality rates are higher than in most Northern and Western European countries among both those who are highly educated and the least educated. This generalization for women is similar to that noted for geographic differences, with states in the United States faring relatively poorly compared with OECD countries at comparable points in their respective educational distributions. It is also consistent with comparative educational differentials for women in a different index of mortality—life expectancy at age 65 (see Table 9-2). By contrast, among males in the lowest educational group, those in the United States are not disadvantaged on this index.
It is difficult to draw a precise conclusion about the magnitude of the role of inequality in relative levels and trends in U.S. mortality above age 50. Clearly, if blacks were to achieve the mortality conditions of whites, the gap in life expectancy between the United States and other countries would be reduced; however, the gap exists for white Americans as well. Based on educational gradients in mortality in combination with educational distributions, the RII in the United States is not exceptionally high relative to that of other countries. Unusually high educational gradients in mortality are substantially offset by an unusually attractive educational distribution. It should be noted that had this calculation been performed differently, that is, if relative rather than absolute categories of education had been used, the conclusion might have differed.
With respect to trends, the differences are less clear. While there are reports from around the world of increasing inequality in mortality, the relative magnitude of such changes is not well understood. Black/white differences in life expectancy for women narrowed between 1980 and 2006 and remained roughly constant among men. On the other hand, the geographic differential in mortality increased between 1980 and 2000 in the United States and decreased in some comparison countries. We know that increases in economic inequality were greater in the United States during the period 1980–2000 than in several comparison countries (Krueger et al., 2009). These trends are consistent with the view that rising socioeconomic disparities contributed to the deteriorating longevity position of the United States, but data on trends in inequality are too scattered to permit a firm conclusion about their role.


