
6
Comparability of Estimates of Immigrant School-Age Children
In this chapter we discuss the definitions of immigrant students from the two allowable data sources and compare those definitions. In discussing the American Community Survey (ACS), we apply several of the analytical techniques used in Chapter 2 when considering the English language learner (ELL) estimates. We also assess the strengths and weakness of estimates based on state administrative data.
As noted in Chapter 1, Title III of the Elementary and Secondary School Act requires the U.S. Department of Education (DoEd) to allocate funds to all 50 states, the District of Columbia, and Puerto Rico on the basis of a formula that incorporates the population of immigrant children and youth in each state. Specifically, the legislation states that 20 percent of the funds are to be based on the population of “recently immigrated children and youth (relative to national counts of these populations).” Section 3301(6) defines an “eligible immigrant student” as an individual who (A) is aged 3 through 21; (B) was not born in any state; and (C) has not been attending one or more schools in any one or more states for more than 3 full academic years. In this definition, language spoken by an individual is not a criterion for classification as an immigrant. This absence in the statutory definition may affect the allocation of the 20 percent of the funds to the extent that the English speaking ability of immigrant populations might vary by state because the source of the immigrant population varies by state.
As with the counts of eligible limited English proficiency (LEP) children and youth, the data on immigrant students can and have been derived from both the ACS and administratively reported state counts, and both data series have been used in the allocation formula. Prior to fiscal 2005, the DoEd allocated the immigration-related portion of Title III funds to the states on the basis of the state-reported counts of the number of immigrant children and youth; since then, the department
has used ACS data for the number of immigrant children and youth to determine the state allocations.
ACS DATA AND ESTIMATES
Definition of Immigrant Children and Youth
Like the ACS data that the department uses to determine students with LEP, the data on immigrant status are based on self-reports. Three ACS questions are used to identify recent immigrants: (1) whether each household member was born in the United States, (2) whether he or she is a citizen, and (3) for those not born in the United States, when the person entered the country—see Box 6-1. Household members between the ages of 3 and 21 are classified as recent immigrants if they are not U.S. citizens at birth1 and entered the country less than 3 years prior to the survey.
Evaluation of the Survey Questions
Like the questions on language spoken and English speaking ability, the ACS questions that define an immigrant child or youth were adopted from the long form of the decennial census at the time the ACS was developed. They have also been a part of the Current Population Survey for some time. They play a critical role in the Census Bureau’s annual population estimates program as the basis for the net international migration estimate. Owing to their importance, the objectivity and collectability of these questions has been the subject of several analyses over the years, culminating in a major 2006 Census Bureau ACS test of the new and modified item content (Harris et al., 2007).
Although much of the research has focused on missing content, such as parental nativity and date of naturalization, the “year of arrival” question has been the subject of some evaluation because of the concern that the current question allows reporting of only one entry to the United States even when the respondents have entered multiple times, and the interpretation of “coming to live” in the United States may be too broad. Redstone and Massey (2003) identified problems with the year of entry question as a source of underestimation of the number of years that have elapsed since a person’s arrival. Most likely, the inconsistencies were the result of multiple entries into the United States by persons who may have provided the year of a recent entry rather than their first entry (Schmidley and Robinson, 2003).
The content test report suggested that there was confusion among both respondents and ACS field representatives about the kind of information that the entry question was seeking and about how to report multiple arrivals. This confusion was evident in the content test itself, when a test group that was asked further probing questions about year of arrival was not able to provide accurate answers to the ques-
|
BOX 6-1 ACS Questions on Birth, Citizenship, and Year of Entry into the United States
□ In the United States Print Name of State □ Outside the United States Print Name of Foreign Country, or Puerto Rico or Guam etc
□ Yes, born in the United States, □ Yes, born in Puerto Rico, Guam, the U.S. Virgin Islands, or Northern Marianas □ Yes, born abroad of U.S citizen parent or parents □ Yes, U.S. citizen by naturalization Print Year of Naturalization □ No, not a U.S. citizen
|
tions. Based on the results of the content test, in 2008 the ACS added a question on year of naturalization.
Unfortunately, it is not known how these issues with the precise timing of the date of entry affect the precision of the estimate of immigrant children and youth for purposes of Title III allocations. If a significant number of children and youth who had originally arrived 3 years ago or earlier reported a subsequent arrival because of confusion over the meaning of the question, there would be tendency for the count of recent immigrant children and youth from the ACS to be an overestimate.
Effect of Nonresponse on Data Quality
We next considered the possible effect of item nonresponse on the ACS estimates. The allocation (imputation) rates (described in Chapter 2) for the “place of birth” item were 7.0 percent in 2008, which is considered moderate, and the allocation rates for the “year of entry” items were also moderate, at 10.4 percent. However, the amount of imputation required has trended upwards from year to year for each of the immigrant-identifying questions: see Table 6-1.
The implications of nonresponse for the accuracy of estimates are not evident. Its effects depend, first of all, on the accuracy of the assumptions underlying the
TABLE 6-1 Allocation Rates for Nonresponse on Immigrant Items in the ACS, 2005-2008 (in percentage*)
|
Item |
2008 |
2007 |
2006 |
2005 |
|
Place of Birth |
7.0 |
5.5 |
4.8 |
4.7 |
|
Citizenship |
2.5 |
1.8 |
1.6 |
1.6 |
|
Year of Entry: Total Population Not Born in U.S. |
10.4 |
8.5 |
7.9 |
6.9 |
|
*The item allocation rates for year 2005 are for housing units only. The item allocation rates for 2006 to 2008 include housing units and group quarters populations. SOURCE: From the Census Bureau Quality Measures Page, http://www.census.gov/acs/www/UseData/sse/ita/ita_def.htm [May 2010]. |
||||
procedures used to impute the missing values, and, consequently, on whether they impute recent immigration at approximately the correct rate. Furthermore, even if estimates of the total number of recent immigrants are inaccurate, Title III allocations to states would only be affected if the errors are disproportionate across states. For 2008, the range in the imputation rates for “place of birth” and “year of entry” across states are fairly narrow with interquartile ranges (the area between the 25th and 75th percentiles) of only 1.4 percent and 3.2 percent, respectively. Given the moderate overall item nonresponse rates and the fairly limited range of rates among the states, the effects of nonresponse on the allocations are not likely to be substantial.
The ACS Estimates
The 1-year and 3-year estimates of immigrant children and youth for 2005-2008 were derived from special tabulations provided by the Census Bureau: they are shown in Table 6-2. Along with the number of immigrant children and youth aged 3-21 years, the table shows the corresponding standard errors and coefficients of variation.
The panel’s conclusions regarding the characteristics of the 1- and 3-year estimates for ELL estimates (see Chapter 2) also apply to the ACS estimates of immigrant children. Because each 3-year estimate is based on three times the sample size of the 1-year estimates, the standard errors of the former are substantially lower. The shares of the states that are based on 1-year estimates do not fluctuate a great deal.
The variation is further dampened when shares are based on 3-year estimates because consecutive 3-year estimates include 2 overlapping years (in this case, 2006 and 2007) and so are more stable than 1-year estimates: see Table 6-3. However, the 1-year estimates respond more quickly to changes in economic and social characteristics than the 3-year estimates.
The percentage share of each state’s estimate of immigrant children and youth is shown in Table 6-4.
TABLE 6-2 Number of Immigrant Children and Youth Aged 3-21, by State
|
State |
ACS 2005 |
ACS 2006 |
ACS 2007 |
ACS 2008 |
||||||||
|
Estimate |
SE |
CV |
Estimate |
SE |
CV |
Estimate |
SE |
CV |
Estimate |
SE |
CV |
|
|
Alabama |
7,710 |
862 |
0.11 |
7,335 |
829 |
0.11 |
9,815 |
1,404 |
0.14 |
5,405 |
920 |
0.17 |
|
Alaska |
965 |
431 |
0.45 |
1,765 |
487 |
0.28 |
2,555 |
728 |
0.28 |
1,095 |
433 |
0.40 |
|
Arizona |
35,660 |
2,855 |
0.08 |
32,565 |
2,852 |
0.09 |
37,565 |
3,158 |
0.08 |
22,250 |
2,429 |
0.11 |
|
Arkansas |
4,680 |
935 |
0.20 |
5,330 |
838 |
0.16 |
5,785 |
1,044 |
0.18 |
4,510 |
914 |
0.20 |
|
California |
251,275 |
9,185 |
0.04 |
214,095 |
6,483 |
0.03 |
208,295 |
6,405 |
0.03 |
179,500 |
6,834 |
0.04 |
|
Colorado |
16,835 |
1,897 |
0.11 |
13,405 |
1,539 |
0.11 |
13,560 |
1,558 |
0.11 |
12,780 |
1,417 |
0.11 |
|
Connecticut |
10,670 |
1,395 |
0.13 |
11,275 |
1,573 |
0.14 |
11,095 |
1,550 |
0.14 |
10,165 |
1,073 |
0.11 |
|
Delaware |
2,495 |
491 |
0.20 |
1,980 |
706 |
0.36 |
1,515 |
512 |
0.34 |
1,100 |
451 |
0.41 |
|
District of Columbia |
1,285 |
454 |
0.35 |
4,065 |
810 |
0.20 |
1,445 |
456 |
0.32 |
1,635 |
362 |
0.22 |
|
Florida |
93,535 |
4,263 |
0.05 |
88,770 |
4,553 |
0.05 |
83,245 |
3,785 |
0.05 |
69,790 |
5,551 |
0.08 |
|
Georgia |
36,945 |
3,031 |
0.08 |
31,160 |
2,172 |
0.07 |
26,295 |
2,172 |
0.08 |
28,460 |
2,670 |
0.09 |
|
Hawaii |
6,645 |
1,512 |
0.23 |
8,495 |
1,273 |
0.15 |
5,110 |
858 |
0.17 |
7,810 |
2,288 |
0.29 |
|
Idaho |
5,010 |
1,343 |
0.27 |
3,550 |
837 |
0.24 |
4,130 |
679 |
0.16 |
4,425 |
732 |
0.17 |
|
Illinois |
35,965 |
2,710 |
0.08 |
35,225 |
2,771 |
0.08 |
44,240 |
2,900 |
0.07 |
32,535 |
2,505 |
0.08 |
|
Indiana |
11,985 |
1,368 |
0.11 |
11,160 |
1,436 |
0.13 |
10,665 |
1,015 |
0.10 |
9,160 |
1,172 |
0.13 |
|
Iowa |
4,150 |
733 |
0.18 |
4,685 |
704 |
0.15 |
4,580 |
812 |
0.18 |
5,540 |
818 |
0.15 |
|
Kansas |
6,035 |
913 |
0.15 |
7,030 |
1,236 |
0.18 |
6,815 |
940 |
0.14 |
6,330 |
988 |
0.16 |
|
Kentucky |
5,275 |
961 |
0.18 |
5,600 |
679 |
0.12 |
6,355 |
1,202 |
0.19 |
5,710 |
961 |
0.17 |
|
Louisiana |
3,185 |
602 |
0.19 |
4,980 |
798 |
0.16 |
5,940 |
1,113 |
0.19 |
4,910 |
910 |
0.19 |
|
Maine |
995 |
497 |
0.50 |
1,715 |
469 |
0.27 |
1,075 |
393 |
0.37 |
1,520 |
436 |
0.29 |
|
Maryland |
26,765 |
2,621 |
0.10 |
23,940 |
1,858 |
0.08 |
22,260 |
1,974 |
0.09 |
19,500 |
1,392 |
0.07 |
|
Massachusetts |
23,935 |
1,876 |
0.08 |
21,920 |
1,855 |
0.08 |
24,380 |
2,174 |
0.09 |
26,290 |
2,327 |
0.09 |
|
Michigan |
20,640 |
2,328 |
0.11 |
17,700 |
2,054 |
0.12 |
21,810 |
2,030 |
0.09 |
18,945 |
1,904 |
0.10 |
|
Minnesota |
14,420 |
1,562 |
0.11 |
17,285 |
2,044 |
0.12 |
15,100 |
1,536 |
0.10 |
10,980 |
1,165 |
0.11 |
|
Mississippi |
2,695 |
703 |
0.26 |
2,925 |
663 |
0.23 |
3,300 |
534 |
0.16 |
3,420 |
896 |
0.26 |
|
Missouri |
7,315 |
1,244 |
0.17 |
7,370 |
1,123 |
0.15 |
8,090 |
1,062 |
0.13 |
8,940 |
1,031 |
0.12 |
TABLE 6-3 Average Number of Immigrant Children and Youth Aged 3-21, by State
|
State |
ACS 2005-2007 |
ACS 2006-2008 |
||||
|
Estimate |
SE |
CV |
Estimate |
SE |
CV |
|
|
Alabama |
8,680 |
575 |
0.07 |
7,295 |
607 |
0.08 |
|
Alaska |
2,080 |
483 |
0.23 |
1,800 |
303 |
0.17 |
|
Arizona |
35,815 |
1,995 |
0.06 |
30,470 |
1,584 |
0.05 |
|
Arkansas |
5,355 |
486 |
0.09 |
5,300 |
557 |
0.11 |
|
California |
225,860 |
4,538 |
0.02 |
198,565 |
3,896 |
0.02 |
|
Colorado |
14,790 |
942 |
0.06 |
13,305 |
787 |
0.06 |
|
Connecticut |
11,480 |
938 |
0.08 |
11,040 |
794 |
0.07 |
|
Delaware |
1,950 |
367 |
0.19 |
1,455 |
353 |
0.24 |
|
District of Columbia |
2,360 |
312 |
0.13 |
2,165 |
260 |
0.12 |
|
Florida |
89,035 |
2,463 |
0.03 |
80,605 |
2,367 |
0.03 |
|
Georgia |
31,355 |
1,458 |
0.05 |
27,390 |
1,319 |
0.05 |
|
Hawaii |
6,540 |
713 |
0.11 |
7,065 |
913 |
0.13 |
|
Idaho |
4,715 |
793 |
0.17 |
4,195 |
527 |
0.13 |
|
Illinois |
39,335 |
1,603 |
0.04 |
36,725 |
1,497 |
0.04 |
|
Indiana |
11,545 |
733 |
0.06 |
9,980 |
605 |
0.06 |
|
Iowa |
4,635 |
404 |
0.09 |
4,935 |
459 |
0.09 |
|
Kansas |
6,740 |
547 |
0.08 |
6,340 |
623 |
0.10 |
|
Kentucky |
6,370 |
584 |
0.09 |
5,785 |
505 |
0.09 |
|
Louisiana |
4,820 |
674 |
0.14 |
5,230 |
578 |
0.11 |
|
Maine |
1,345 |
293 |
0.22 |
1,650 |
353 |
0.21 |
|
Maryland |
24,730 |
1,313 |
0.05 |
22,530 |
1,268 |
0.06 |
|
Massachusetts |
24,605 |
1,118 |
0.05 |
24,085 |
1,312 |
0.05 |
|
Michigan |
21,035 |
1,208 |
0.06 |
19,370 |
907 |
0.05 |
|
Minnesota |
16,315 |
956 |
0.06 |
14,895 |
1,005 |
0.07 |
|
Mississippi |
3,425 |
472 |
0.14 |
3,315 |
426 |
0.13 |
|
Missouri |
8,280 |
696 |
0.08 |
8,230 |
678 |
0.08 |
|
Montana |
1,060 |
190 |
0.18 |
1,305 |
228 |
0.17 |
|
Nebraska |
4,075 |
477 |
0.12 |
3,785 |
422 |
0.11 |
|
Nevada |
10,925 |
789 |
0.07 |
11,055 |
931 |
0.08 |
|
New Hampshire |
1,995 |
281 |
0.14 |
1,860 |
319 |
0.17 |
|
New Jersey |
36,740 |
1,357 |
0.04 |
36,920 |
1,386 |
0.04 |
|
New Mexico |
6,105 |
588 |
0.10 |
5,265 |
557 |
0.11 |
|
New York |
88,090 |
2,421 |
0.03 |
8,5340 |
2,635 |
0.03 |
|
North Carolina |
25,720 |
1,382 |
0.05 |
23,915 |
1,160 |
0.05 |
|
North Dakota |
1,455 |
270 |
0.19 |
1,300 |
200 |
0.15 |
|
Ohio |
13,595 |
1,006 |
0.07 |
13,660 |
1,013 |
0.07 |
|
Oklahoma |
7,345 |
622 |
0.08 |
6,920 |
687 |
0.10 |
|
Oregon |
11,435 |
921 |
0.08 |
10,615 |
945 |
0.09 |
|
Pennsylvania |
19,500 |
1,315 |
0.07 |
19,725 |
1,095 |
0.06 |
|
Rhode Island |
3,920 |
564 |
0.14 |
3,350 |
483 |
0.14 |
|
South Carolina |
9,950 |
810 |
0.08 |
7,910 |
713 |
0.09 |
|
South Dakota |
1,155 |
300 |
0.26 |
540 |
135 |
0.25 |
The corresponding standard errors are shown in Table 6-5. The percentage shares are the basis for the portion of the Title III allocations based on immigrants. The nine states with the largest shares—Arizona, California, Florida, Georgia, Illinois, New Jersey, New York, Texas, and Washington—together account for more than 70 percent of immigrant youth.
We also calculated the ratio of immigrant children and youth aged 5-18 to all children and youth within each state of that age who are enrolled in public school. This ratio is computed by simply dividing the ACS estimate of immigrant children and youth enrolled in public school by the ACS estimate of all children and youth in public school: see Table 6-6.
Tables 6-3 through 6-6 are based on special tabulations of ACS data provided by the U.S. Census Bureau.
Sensitivity of the Estimates to Variation in Subpopulations
We analyzed how the percentage share of states in the 3-year ACS estimates for 2006-2008 were affected by modifying the statutory criteria (3-21 years old, foreign born, and entered the United States after a particular year) to assess sensitivity of allocations to these criteria. We first limited the count to those aged 5-18 years old, an age range more similar to those reported to the states by local education authorities. We also examined the effect of limiting the count to either only those enrolled in school or only those enrolled in public schools.
Table 6-7 compares allocations with various combinations of these modifications to those under the base (statutory) criteria. Variations in age criteria did not influence the allocation of states very much (mean absolute difference, MAD, of 0.09%). For those aged 3-21, restricting the estimates to enrolled children and youth
TABLE 6-4 Share of Immigrant Children and Youth Aged 3-21, by State (in percentage)
|
State |
ACS 2005 |
ACS 2006 |
ACS 2007 |
ACS 2008 |
ACS 2005-2007 |
ACS 2006-2008 |
|
Alabama |
0.71 |
0.70 |
0.97 |
0.60 |
0.82 |
0.75 |
|
Alaska |
0.09 |
0.17 |
0.25 |
0.12 |
0.20 |
0.18 |
|
Arizona |
3.29 |
3.11 |
3.73 |
2.48 |
3.37 |
3.12 |
|
Arkansas |
0.43 |
0.51 |
0.57 |
0.50 |
0.50 |
0.54 |
|
California |
23.22 |
20.45 |
20.66 |
20.04 |
21.23 |
20.32 |
|
Colorado |
1.56 |
1.28 |
1.34 |
1.43 |
1.39 |
1.36 |
|
Connecticut |
0.99 |
1.08 |
1.10 |
1.13 |
1.08 |
1.13 |
|
Delaware |
0.23 |
0.19 |
0.15 |
0.12 |
0.18 |
0.15 |
|
District of Columbia |
0.12 |
0.39 |
0.14 |
0.18 |
0.22 |
0.22 |
|
Florida |
8.64 |
8.48 |
8.26 |
7.79 |
8.37 |
8.25 |
|
Georgia |
3.41 |
2.98 |
2.61 |
3.18 |
2.95 |
2.80 |
|
Hawaii |
0.61 |
0.81 |
0.51 |
0.87 |
0.61 |
0.72 |
|
Idaho |
0.46 |
0.34 |
0.41 |
0.49 |
0.44 |
0.43 |
|
Illinois |
3.32 |
3.36 |
4.39 |
3.63 |
3.70 |
3.76 |
|
Indiana |
1.11 |
1.07 |
1.06 |
1.02 |
1.08 |
1.02 |
|
Iowa |
0.38 |
0.45 |
0.45 |
0.62 |
0.44 |
0.51 |
|
Kansas |
0.56 |
0.67 |
0.68 |
0.71 |
0.63 |
0.65 |
|
Kentucky |
0.49 |
0.53 |
0.63 |
0.64 |
0.60 |
0.59 |
|
Louisiana |
0.29 |
0.48 |
0.59 |
0.55 |
0.45 |
0.54 |
|
Maine |
0.09 |
0.16 |
0.11 |
0.17 |
0.13 |
0.17 |
|
Maryland |
2.47 |
2.29 |
2.21 |
2.18 |
2.32 |
2.31 |
|
Massachusetts |
2.21 |
2.09 |
2.42 |
2.93 |
2.31 |
2.46 |
|
Michigan |
1.91 |
1.69 |
2.16 |
2.11 |
1.98 |
1.98 |
|
Minnesota |
1.33 |
1.65 |
1.50 |
1.23 |
1.53 |
1.52 |
|
Mississippi |
0.25 |
0.28 |
0.33 |
0.38 |
0.32 |
0.34 |
|
Missouri |
0.68 |
0.70 |
0.80 |
1.00 |
0.78 |
0.84 |
|
Montana |
0.04 |
0.12 |
0.14 |
0.09 |
0.10 |
0.13 |
|
Nebraska |
0.38 |
0.46 |
0.28 |
0.43 |
0.38 |
0.39 |
|
Nevada |
0.87 |
1.14 |
1.13 |
1.07 |
1.03 |
1.13 |
|
New Hampshire |
0.11 |
0.25 |
0.16 |
0.16 |
0.19 |
0.19 |
|
New Jersey |
3.57 |
3.68 |
3.42 |
4.21 |
3.45 |
3.78 |
|
New Mexico |
0.53 |
0.90 |
0.39 |
0.26 |
0.57 |
0.54 |
|
New York |
7.70 |
9.09 |
7.87 |
9.38 |
8.28 |
8.73 |
|
North Carolina |
2.58 |
2.60 |
2.43 |
2.42 |
2.42 |
2.45 |
|
North Dakota |
0.04 |
0.17 |
0.13 |
0.12 |
0.14 |
0.13 |
|
Ohio |
1.25 |
1.12 |
1.25 |
1.83 |
1.28 |
1.40 |
|
Oklahoma |
0.55 |
0.62 |
0.79 |
0.59 |
0.69 |
0.71 |
|
Oregon |
1.01 |
1.19 |
0.94 |
1.10 |
1.07 |
1.09 |
|
Pennsylvania |
1.49 |
1.75 |
2.11 |
2.18 |
1.83 |
2.02 |
|
Rhode Island |
0.43 |
0.33 |
0.34 |
0.36 |
0.37 |
0.34 |
|
South Carolina |
1.10 |
0.67 |
0.96 |
0.64 |
0.94 |
0.81 |
|
South Dakota |
0.17 |
0.07 |
0.07 |
0.02 |
0.11 |
0.06 |
|
Tennessee |
0.91 |
1.04 |
1.18 |
1.13 |
1.08 |
1.09 |
|
Texas |
12.10 |
11.69 |
10.95 |
10.67 |
11.54 |
11.16 |
|
Utah |
0.68 |
0.76 |
0.93 |
0.96 |
0.80 |
0.89 |
|
Vermont |
0.06 |
0.08 |
0.08 |
0.11 |
0.07 |
0.08 |
|
Virginia |
2.39 |
2.54 |
2.36 |
2.48 |
2.41 |
2.39 |
|
Washington |
2.25 |
2.75 |
3.13 |
2.70 |
2.63 |
2.84 |
|
West Virginia |
0.02 |
0.09 |
0.13 |
0.23 |
0.10 |
0.16 |
|
Wisconsin |
0.81 |
0.87 |
0.75 |
0.70 |
0.81 |
0.75 |
|
Wyoming |
0.10 |
0.12 |
0.07 |
0.02 |
0.09 |
0.08 |
|
SOURCE: U.S. Census Bureau Special Tabulations. |
||||||
TABLE 6-5 Standard Errors of Shares of Immigrant Children and Youth Aged 3-21, by State (in percentage)
|
State |
ACS 2005 |
ACS 2006 |
ACS 2007 |
ACS 2008 |
ACS 2005-2007 |
ACS 2006-2008 |
|
Alabama |
0.08 |
0.08 |
0.14 |
0.10 |
0.05 |
0.06 |
|
Alaska |
0.04 |
0.05 |
0.07 |
0.05 |
0.05 |
0.03 |
|
Arizona |
0.26 |
0.27 |
0.31 |
0.27 |
0.19 |
0.16 |
|
Arkansas |
0.09 |
0.08 |
0.10 |
0.10 |
0.05 |
0.06 |
|
California |
0.76 |
0.55 |
0.57 |
0.68 |
0.39 |
0.34 |
|
Colorado |
0.17 |
0.15 |
0.15 |
0.16 |
0.09 |
0.08 |
|
Connecticut |
0.13 |
0.15 |
0.15 |
0.12 |
0.09 |
0.08 |
|
Delaware |
0.05 |
0.07 |
0.05 |
0.05 |
0.03 |
0.04 |
|
District of Columbia |
0.04 |
0.08 |
0.05 |
0.04 |
0.03 |
0.03 |
|
Florida |
0.37 |
0.42 |
0.36 |
0.61 |
0.22 |
0.23 |
|
Georgia |
0.27 |
0.20 |
0.21 |
0.29 |
0.13 |
0.13 |
|
Hawaii |
0.14 |
0.12 |
0.08 |
0.25 |
0.07 |
0.09 |
|
Idaho |
0.12 |
0.08 |
0.07 |
0.08 |
0.07 |
0.05 |
|
Illinois |
0.24 |
0.26 |
0.28 |
0.27 |
0.15 |
0.15 |
|
Indiana |
0.13 |
0.14 |
0.10 |
0.13 |
0.07 |
0.06 |
|
Iowa |
0.07 |
0.07 |
0.08 |
0.09 |
0.04 |
0.05 |
|
Kansas |
0.08 |
0.12 |
0.09 |
0.11 |
0.05 |
0.06 |
|
Kentucky |
0.09 |
0.06 |
0.12 |
0.11 |
0.05 |
0.05 |
|
Louisiana |
0.06 |
0.08 |
0.11 |
0.10 |
0.06 |
0.06 |
|
Maine |
0.05 |
0.04 |
0.04 |
0.05 |
0.03 |
0.04 |
|
Maryland |
0.24 |
0.17 |
0.19 |
0.15 |
0.12 |
0.13 |
|
Massachusetts |
0.17 |
0.17 |
0.21 |
0.25 |
0.10 |
0.13 |
|
Michigan |
0.21 |
0.19 |
0.20 |
0.21 |
0.11 |
0.09 |
|
Minnesota |
0.14 |
0.19 |
0.15 |
0.13 |
0.09 |
0.10 |
|
Mississippi |
0.06 |
0.06 |
0.05 |
0.10 |
0.04 |
0.04 |
|
Missouri |
0.11 |
0.11 |
0.10 |
0.11 |
0.07 |
0.07 |
|
Montana |
0.02 |
0.03 |
0.05 |
0.03 |
0.02 |
0.02 |
|
Nebraska |
0.08 |
0.07 |
0.06 |
0.09 |
0.04 |
0.04 |
|
Nevada |
0.11 |
0.13 |
0.15 |
0.16 |
0.07 |
0.09 |
|
New Hampshire |
0.03 |
0.07 |
0.04 |
0.04 |
0.03 |
0.03 |
|
New Jersey |
0.24 |
0.21 |
0.24 |
0.26 |
0.12 |
0.14 |
|
New Mexico |
0.10 |
0.14 |
0.08 |
0.06 |
0.06 |
0.06 |
|
New York |
0.34 |
0.40 |
0.36 |
0.39 |
0.22 |
0.26 |
|
North Carolina |
0.33 |
0.24 |
0.21 |
0.21 |
0.13 |
0.12 |
|
North Dakota |
0.02 |
0.05 |
0.03 |
0.05 |
0.03 |
0.02 |
|
Ohio |
0.12 |
0.15 |
0.16 |
0.21 |
0.09 |
0.10 |
|
Oklahoma |
0.09 |
0.10 |
0.11 |
0.10 |
0.06 |
0.07 |
|
Oregon |
0.15 |
0.12 |
0.14 |
0.14 |
0.09 |
0.10 |
|
Pennsylvania |
0.13 |
0.18 |
0.21 |
0.16 |
0.12 |
0.11 |
|
Rhode Island |
0.11 |
0.07 |
0.08 |
0.07 |
0.05 |
0.05 |
|
South Carolina |
0.13 |
0.09 |
0.12 |
0.09 |
0.08 |
0.07 |
|
South Dakota |
0.08 |
0.02 |
0.02 |
0.02 |
0.03 |
0.01 |
|
Tennessee |
0.12 |
0.11 |
0.13 |
0.19 |
0.08 |
0.08 |
|
Texas |
0.50 |
0.48 |
0.48 |
0.47 |
0.29 |
0.29 |
|
Utah |
0.11 |
0.10 |
0.11 |
0.17 |
0.08 |
0.08 |
|
Vermont |
0.02 |
0.04 |
0.02 |
0.03 |
0.01 |
0.02 |
|
Virginia |
0.21 |
0.19 |
0.16 |
0.18 |
0.12 |
0.11 |
|
Washington |
0.18 |
0.29 |
0.26 |
0.23 |
0.12 |
0.15 |
|
West Virginia |
0.01 |
0.02 |
0.03 |
0.06 |
0.02 |
0.03 |
|
Wisconsin |
0.10 |
0.10 |
0.09 |
0.11 |
0.06 |
0.05 |
|
Wyoming |
0.04 |
0.03 |
0.03 |
0.01 |
0.02 |
0.02 |
|
SOURCE: U.S. Census Bureau Special Tabulations. |
||||||
TABLE 6-6 Ratio of Immigrant Children Aged 5-18 Enrolled in Public School to All Children Aged 5-18 Enrolled in Public School (in percentage)
|
State |
ACS 2005 |
ACS 2006 |
ACS 2007 |
ACS 2008 |
ACS 2005-2007 |
ACS 2006-2008 |
|
Alabama |
0.32 |
0.29 |
0.38 |
0.28 |
0.36 |
0.35 |
|
Alaska |
0.20 |
0.88 |
1.01 |
0.58 |
0.87 |
0.88 |
|
Arizona |
1.56 |
1.40 |
1.46 |
0.81 |
1.51 |
1.22 |
|
Arkansas |
0.43 |
0.49 |
0.59 |
0.09 |
0.52 |
0.42 |
|
California |
1.81 |
1.45 |
1.45 |
1.27 |
1.57 |
1.39 |
|
Colorado |
0.90 |
0.86 |
0.72 |
0.67 |
0.86 |
0.74 |
|
Connecticut |
0.86 |
1.04 |
0.98 |
0.77 |
0.97 |
0.95 |
|
Delaware |
0.85 |
1.08 |
0.63 |
0.50 |
0.82 |
0.71 |
|
District of Columbia |
0.90 |
1.93 |
1.19 |
0.40 |
1.28 |
1.08 |
|
Florida |
1.77 |
1.58 |
1.52 |
1.29 |
1.64 |
1.46 |
|
Georgia |
0.91 |
0.68 |
0.59 |
0.76 |
0.74 |
0.68 |
|
Hawaii |
2.68 |
3.11 |
1.53 |
2.31 |
2.37 |
2.29 |
|
Idaho |
1.18 |
0.77 |
0.62 |
0.87 |
0.94 |
0.80 |
|
Illinois |
0.78 |
0.69 |
0.90 |
0.68 |
0.80 |
0.75 |
|
Indiana |
0.48 |
0.43 |
0.36 |
0.35 |
0.41 |
0.36 |
|
Iowa |
0.43 |
0.39 |
0.37 |
0.49 |
0.38 |
0.44 |
|
Kansas |
0.84 |
0.58 |
0.53 |
0.50 |
0.67 |
0.54 |
|
Kentucky |
0.42 |
0.32 |
0.38 |
0.43 |
0.39 |
0.38 |
|
Louisiana |
0.21 |
0.16 |
0.32 |
0.30 |
0.23 |
0.23 |
|
Maine |
0.13 |
0.50 |
0.17 |
0.25 |
0.27 |
0.40 |
|
Maryland |
1.76 |
1.40 |
1.36 |
1.18 |
1.50 |
1.36 |
|
Massachusetts |
1.21 |
0.95 |
1.21 |
1.09 |
1.14 |
1.08 |
|
Michigan |
0.62 |
0.57 |
0.67 |
0.62 |
0.62 |
0.61 |
|
Minnesota |
0.98 |
1.15 |
0.93 |
0.65 |
1.04 |
0.96 |
|
Mississippi |
0.09 |
0.18 |
0.09 |
0.35 |
0.16 |
0.26 |
|
Missouri |
0.38 |
0.38 |
0.31 |
0.40 |
0.38 |
0.38 |
|
Montana |
0.12 |
0.52 |
0.21 |
0.21 |
0.34 |
0.45 |
|
Nebraska |
0.35 |
0.66 |
0.47 |
0.65 |
0.54 |
0.57 |
|
Nevada |
0.87 |
0.89 |
0.96 |
1.20 |
0.92 |
1.03 |
|
New Hampshire |
0.31 |
0.55 |
0.18 |
0.19 |
0.36 |
0.28 |
|
New Jersey |
1.22 |
1.26 |
1.22 |
1.52 |
1.23 |
1.37 |
|
New Mexico |
0.74 |
1.29 |
0.72 |
0.19 |
0.89 |
0.72 |
|
New York |
1.42 |
1.45 |
1.26 |
1.35 |
1.37 |
1.34 |
|
North Carolina |
0.99 |
0.65 |
0.74 |
0.57 |
0.78 |
0.68 |
|
North Dakota |
0.12 |
0.56 |
0.36 |
0.63 |
0.40 |
0.45 |
|
Ohio |
0.44 |
0.30 |
0.28 |
0.37 |
0.36 |
0.32 |
|
Oklahoma |
0.28 |
0.38 |
0.60 |
0.28 |
0.43 |
0.45 |
|
Oregon |
0.77 |
0.79 |
0.61 |
0.58 |
0.76 |
0.65 |
|
Pennsylvania |
0.46 |
0.44 |
0.59 |
0.41 |
0.49 |
0.47 |
|
Rhode Island |
1.00 |
1.31 |
1.41 |
0.79 |
1.29 |
1.20 |
|
South Carolina |
0.87 |
0.31 |
0.52 |
0.29 |
0.61 |
0.43 |
|
South Dakota |
0.99 |
0.31 |
0.15 |
0.00 |
0.52 |
0.15 |
|
Tennessee |
0.36 |
0.36 |
0.41 |
0.41 |
0.40 |
0.42 |
|
Texas |
1.54 |
1.26 |
1.20 |
1.01 |
1.35 |
1.17 |
|
Utah |
0.56 |
0.54 |
0.55 |
0.65 |
0.59 |
0.59 |
|
Vermont |
0.09 |
0.66 |
0.28 |
0.42 |
0.28 |
0.37 |
|
Virginia |
0.99 |
0.86 |
0.99 |
0.80 |
0.94 |
0.84 |
|
Washington |
1.12 |
1.48 |
1.65 |
1.10 |
1.41 |
1.41 |
|
West Virginia |
0.04 |
0.14 |
0.09 |
0.47 |
0.08 |
0.23 |
|
Wisconsin |
0.47 |
0.50 |
0.28 |
0.32 |
0.42 |
0.36 |
|
Wyoming |
0.15 |
0.69 |
0.20 |
0.13 |
0.40 |
0.36 |
|
SOURCE: U.S. Census Bureau Special Tabulations. |
||||||
TABLE 6-7 Difference in the Percentage Share of Immigrants Aged 3-21 of States by Age Group, Enrollment Status, and Type of School
causes a larger change in state allocations (MAD of 0.16 percent and MARD [mean absolute relative difference] of 12.46 percent). The estimates of immigrant children and youth are more sensitive to the restriction of enrolled status than the restriction of enrolled in public school. When the criterion is restricted to public school enrolled, the MAD is 0.10 percent and the MARD is 11.84 percent.
Reliability of Estimates of Change
We also assessed the reliability of estimates of change in the ACS ratio (as defined above), by assessing both interyear reliability of estimates of change and the significance of between-year changes in rates. An analysis of the interunit reliability of changes in ratios between consecutive years (following the procedures used to compute this measure in Chapter 2) yields results broadly similar to those in Chapter 2 for ELL estimates. Indeed, a global test of changes in ratio from 2006 to 2007 (using an ANOVA F-test) found that overall the changes were not significant (F < 1). Correspondingly, the estimates’ variance components for interyear change in ratio was zero, indicating that the amount of change observed could be entirely explained by sampling variation. From 2007 to 2008, change was significant (F = .72, p ≈ 0.001), but the reliability of the estimates of changes were generally small, at most 0.62 for any state and less than 0.50 for more than three-quarters of the states. Thus, across the range of state sizes, interyear changes were still largely confounded with sampling variation.
However, there were some outlying state changes in ratio that appeared statistically significant, as assessed by t-tests2 of interyear changes: see Table 6-8. A total of 12 states (Alaska, Arizona, Arkansas, Hawaii, Mississippi, Montana, New Mexico, Oklahoma, South Carolina, Washington, West Virginia, and Wisconsin) had large and significant changes in their immigrant shares (based on 1-year estimates) relative to the previous year. Of these states, Montana is a “minimum” state whose allocation is unaffected by modest changes in immigrant population; Arizona and Washington are both “large” states and had large and significant changes in their immigrant share from 2007 to 2008; the other nine states that had big changes are “medium” or “small” states.
These large changes are most sensitively picked up by 1-year estimates. However, using those estimates gives great weight to interyear changes that in most states are mainly noise. This result supports use of the 3-year estimates on grounds of greater stability.
STATE PROCEDURES FOR DETERMINING IMMIGRANT STATUS
Although the state estimates of the immigrant population start with a standard definition that has been promulgated by the DoEd, the states take different pathways to identifying and reporting this group. The administrative record counts of immigrant students begin in the local school districts. The procedures for each state are established by the state education officials to ensure that reports received from the
TABLE 6-8 Absolute Difference and Absolute Relative Difference in Ratio of Immigrant Children and Youth (in percentage)
|
State |
ACS 2006 versus ACS 2005 |
ACS 2007 versus ACS 2006 |
ACS 2008 versus ACS 2007 |
ACS 2006-2008 versus ACS 2005-2007 |
||||
|
Absolute Difference |
Absolute Relative Difference |
Absolute Difference |
Absolute Relative Difference |
Absolute Difference |
Absolute Relative Difference |
Absolute Difference |
Absolute Relative Difference |
|
|
Alabama |
0.03 |
2.72 |
0.09 |
6.39 |
0.09 |
7.20 |
0.01 |
0.68 |
|
Alaska |
0.68 |
31.17 |
0.13 |
3.48 |
0.44 |
13.78 |
0.01 |
0.24 |
|
Arizona |
0.16 |
2.70 |
0.07 |
1.20 |
0.66 |
14.51 |
0.29 |
5.23 |
|
Arkansas |
0.07 |
3.58 |
0.10 |
4.70 |
0.50 |
36.38 |
0.10 |
5.33 |
|
California |
0.35 |
5.40 |
0.01 |
0.15 |
0.17 |
3.22 |
0.19 |
3.13 |
|
Colorado |
0.04 |
1.08 |
0.14 |
4.51 |
0.04 |
1.56 |
0.12 |
3.67 |
|
Connecticut |
0.18 |
4.75 |
0.06 |
1.53 |
0.21 |
5.90 |
0.02 |
0.54 |
|
Delaware |
0.23 |
6.01 |
0.44 |
12.93 |
0.13 |
5.67 |
0.10 |
3.41 |
|
District of Columbia |
1.03 |
18.17 |
0.74 |
11.92 |
0.79 |
24.91 |
0.20 |
4.18 |
|
Florida |
0.19 |
2.89 |
0.06 |
1.01 |
0.23 |
4.05 |
0.18 |
2.89 |
|
Georgia |
0.23 |
7.18 |
0.09 |
3.36 |
0.16 |
6.08 |
0.06 |
2.10 |
|
Hawaii |
0.43 |
3.68 |
1.58 |
17.05 |
0.78 |
10.20 |
0.09 |
0.93 |
|
Idaho |
0.41 |
10.50 |
0.15 |
5.37 |
0.25 |
8.27 |
0.14 |
4.17 |
|
Illinois |
0.10 |
3.27 |
0.21 |
6.64 |
0.22 |
7.04 |
0.06 |
1.84 |
|
Indiana |
0.05 |
2.55 |
0.07 |
4.36 |
0.01 |
0.53 |
0.04 |
2.70 |
|
Iowa |
0.04 |
2.69 |
0.02 |
1.16 |
0.12 |
7.14 |
0.06 |
3.75 |
|
Kansas |
0.26 |
9.03 |
0.05 |
2.40 |
0.02 |
1.17 |
0.12 |
5.15 |
|
Kentucky |
0.10 |
6.85 |
0.06 |
4.48 |
0.05 |
3.04 |
0.01 |
0.51 |
|
Louisiana |
0.05 |
6.96 |
0.17 |
17.52 |
0.03 |
2.11 |
0.01 |
0.84 |
|
Maine |
0.37 |
28.88 |
0.34 |
25.10 |
0.08 |
10.02 |
0.13 |
9.37 |
|
Maryland |
0.36 |
5.66 |
0.04 |
0.68 |
0.18 |
3.60 |
0.14 |
2.53 |
|
Massachusetts |
0.27 |
6.14 |
0.26 |
6.03 |
0.11 |
2.43 |
0.06 |
1.36 |
|
Michigan |
0.05 |
2.13 |
0.10 |
4.16 |
0.05 |
1.94 |
0.01 |
0.55 |
local school districts within the state are comparable.3 In addition, as mentioned in Chapter 1, states are also required to use up to 15 percent of their Title III allotments for school districts with significant increases in school enrollment of immigrant children and youth.
Although all states use a common definition of immigrant students—students who were born outside the 50 states, the District of Columbia, Puerto Rico, and the Virgin Islands who are between 3 and 21 years of age and were enrolled for the first time in a U.S. school on or after a date 3 years ago—nuances in timing and reporting procedures may affect comparability from state to state. For example, in our review of state procedures we found that timing of the reference and submission periods varied between states. For example, the counts in California are the larger of counts that can be taken on October 7 or March 1, at the option of the local education authority (California Department of Education, 2010a). In Illinois, the counts are supposed to be taken in November and December and reported on January 15 (Illinois State Board of Education, 2009). And in New Jersey, the 2010 count was as of April, to be reported in May (New Jersey Department of Education, 2010).
The counts of immigrant children include both public and private school immigrant students. They are most often collected by local education agencies (LEAs), but, in at least one state, the data for private schools are to be forwarded directly from the private schools to the state education agency (SEA). Because of different reporting procedures, there is considerable uncertainty about the quality and coverage of both the public and private counts, although there is some evidence that state agencies do attempt to standardize the reporting. An example of the effort taken to assure the integrity of these estimates is the form with instructions provided to the local school districts by the Illinois State Board of Education: see Figure 6-1.4 Other states have similar structured processes for determining the counts for immigrant education plans.
In sum, the panel agrees with the assessment of the 2006 U.S. Government Accountability Office (GAO) assessment that, despite documented attempts to standardize the reporting of immigrant student counts in the states, the GAO reported that, “with regard to data states collect on the number of children and youth who are recent immigrants, state officials expressed a lack of confidence in these data” (U.S. Government Accountability Office, 2006b, p. 23).
In part, the problem arose in the process of initially identifying immigrant students who met the definition. The GAO reported that its investigators were told by state officials in some of the 12 study states that “these data were not very reliable because school and school district officials did not ask about immigration
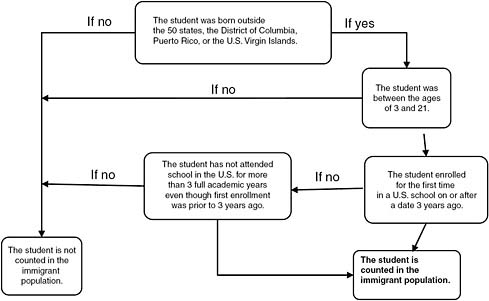
FIGURE 6-1 Rules for determining immigrant education program students in Illinois, 2009-2010 school year.
SOURCE: Illinois State Board of Education (2009, p. 3).
status directly” (U.S. Government Accountability Office, 2006b, p. 23). The GAO found that the school officials who were in charge of identifying recent immigrant students relied on such information as the student’s place of birth and date of entry into the school system rather than taking steps to independently verify the student’s status as a recent immigrant.
It is understandable that local school districts would be reluctant to pry too deeply into immigration status in order to verify eligibility as a recent immigrant student. The Supreme Court has ruled that public schools are prohibited from denying immigrant students access to public education on the basis of their immigrant status (Plyler v. Doe, 457 U.S. 202, 1982). Local school officials are encouraged, “when making inquiries for purposes of determining eligibility, to solicit voluntary information from parents and students or finding alternative ways of identifying and documenting the eligibility of students” (emphasis added) (New Jersey Department of Education, 2010, p. 3). The GAO report noted that officials in one state admitted that, in the absence of documentation, they assumed that students born outside the United States who entered the state’s school system within the last 3 years were recent immigrants (U.S. Government Accountability Office, 2006b, p. 23).
COMPARISON OF ACS AND STATE ESTIMATES
There are important differences in the source, methodology, and results between the estimates of recent immigrant students that come from the ACS and the counts provided by the local school districts through the states. The differences in source and methodology were summarized in the GAO report: see Table 6-9. Not surprisingly, the very different sources and methods used in the two allowable sources result in very different estimates of the recent immigrant student population by state.
One way to depict the differences is to compute the ratio of the state student immigration counts with the ACS estimates of recent immigrant students. This comparison is shown in Table 6-10. In 17 states, the state count was higher than the ACS estimate, while it was lower in the remaining 34 states and the District of Columbia.
These relationships are illustrated graphically in Figure 6-2, which shows the ACS and state-reported counts for each state, together with the regression line through the origin (lower dashed line) and the line of equality (upper dashed line). Dotted lines around each state abbreviation represent 95 percent confidence intervals. Almost every state is below the line of equality, illustrating the generally lower
TABLE 6-9 Key Features of ACS and State-Collected Data on Immigrant Children and Youth
|
Feature |
ACS Dataa |
State-Collected Datab |
|
Measures Provided |
Number of foreign-born persons aged 3 to 21 who arrived in the United States within the 3 years prior to the survey |
Number of (public and private school) students in grades K-12 identified as recent immigrants |
|
How It Is Measured |
Self-report (sample of population) |
States make determinations based on student records or other information. Some states told us that they are not able to directly ask students questions related to their immigration status. |
|
Timing |
Annual average of monthly sample |
Varies |
|
Purpose |
To comply with Immigration Nationality Act and Public Health Service Act requirements; to provide data to set and evaluate immigration policies and laws. |
To comply with the ESEA requirement to assess progress of all limited English proficient children, including immigrant children and youth, to attain English proficiency |
|
(Department of) Education’s Role in Data Collection |
Work with Census to make sure appropriate questions are included. Can propose new questions, if necessary. |
Education collects this number from the states in the Consolidated State Performance Reports. |
|
aThis column refers to data obtained by the U.S. Department of Education from ACS, but ACS collects additional data. bSome states may have data available for children prior to kindergarten. SOURCE: U.S. Government Accountability Office (2006b, p. 23). |
||
TABLE 6-10 Comparison of State Student Immigrant Counts and American Community Survey Estimates of Recent Immigrant Students
|
State |
ACS 3-Year Average, 2006-2008 Estimate |
State 2007-2008 School Year Count |
Ratio of ACS Estimate to State Count |
|
Alabama |
7,295 |
4,142 |
1.761 |
|
Alaska |
1,800 |
880 |
2.045 |
|
Arizona |
30,470 |
15,503 |
1.965 |
|
Arkansas |
5,300 |
4,187 |
1.266 |
|
California |
198,565 |
241,024 |
0.824 |
|
Colorado |
13,305 |
12,940 |
1.028 |
|
Connecticut |
11,040 |
13,571 |
0.813 |
|
Delaware |
1,455 |
1,164 |
1.250 |
|
District of Columbia |
2,165 |
993 |
2.180 |
|
Florida |
80,605 |
142,333 |
0.566 |
|
Georgia |
27,390 |
33,891 |
0.808 |
|
Hawaii |
7,065 |
3,032 |
2.330 |
|
Idaho |
4,195 |
3,188 |
1.316 |
|
Illinois |
36,725 |
43,274 |
0.849 |
|
Indiana |
9,980 |
11,763 |
0.848 |
|
Iowa |
4,935 |
4,122 |
1.197 |
|
Kansas |
6,340 |
11,206 |
0.566 |
|
Kentucky |
5,785 |
7426 |
0.779 |
|
Louisiana |
5,230 |
2,583 |
2.025 |
|
Maine |
1,650 |
431 |
3.828 |
|
Maryland |
22,530 |
16,617 |
1.356 |
|
Massachusetts |
24,085 |
20,458 |
1.177 |
|
Michigan |
19,370 |
11,052 |
1.753 |
|
Minnesota |
14,895 |
15,985 |
0.932 |
|
Mississippi |
3,315 |
6,007 |
0.552 |
|
Missouri |
8,230 |
442 |
18.620 |
|
Montana |
1,305 |
170 |
7.676 |
|
Nebraska |
3,785 |
3,609 |
1.049 |
|
Nevada |
11,055 |
14,694 |
0.752 |
|
New Hampshire |
1,860 |
1,769 |
1.051 |
|
New Jersey |
36,920 |
36,614 |
1.008 |
|
New Mexico |
5,265 |
11,606 |
0.454 |
|
New York |
85,340 |
98,797 |
0.864 |
|
North Carolina |
23,915 |
23,365 |
1.024 |
|
North Dakota |
1,300 |
497 |
2.616 |
|
Ohio |
13,660 |
11,309 |
1.208 |
|
Oklahoma |
6,920 |
4,954 |
1.397 |
|
Oregon |
10,615 |
2,397 |
4.428 |
|
Pennsylvania |
19,725 |
11,387 |
1.732 |
|
Rhode Island |
3,350 |
2,903 |
1.154 |
|
South Carolina |
7,910 |
6,415 |
1.233 |
|
South Dakota |
540 |
197 |
2.741 |
|
State |
ACS 3-Year Average, 2006-2008 Estimate |
State 2007-2008 School Year Count |
Ratio of ACS Estimate to State Count |
|
Tennessee |
10,660 |
1,5815 |
0.674 |
|
Texas |
109,105 |
93,627 |
1.165 |
|
Utah |
8,685 |
7,935 |
1.095 |
|
Vermont |
800 |
556 |
1.439 |
|
Virginia |
23,380 |
29,284 |
0.798 |
|
Washington |
27,800 |
15,142 |
1.836 |
|
West Virginia |
1,520 |
1,599 |
0.951 |
|
Wisconsin |
7,340 |
5,882 |
1.248 |
|
Wyoming |
750 |
391 |
1.918 |
|
United States |
977,220 |
1,029,128 |
0.950 |
|
SOURCE: ACS estimates from U.S. Census Bureau Special Tabulation. State counts from U.S. Department of Education’s EDEN Database. |
|||
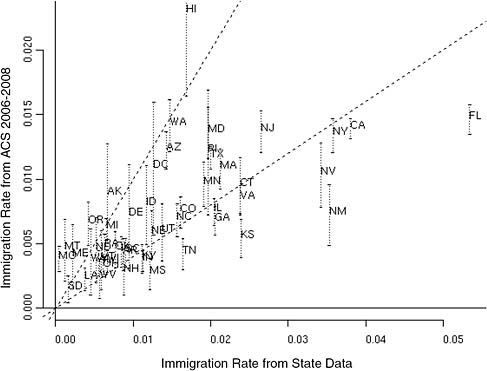
FIGURE 6-2 Immigrant ratio from state counts (2007-2008 academic year) and ACS 3-year estimates (2006-2008).
NOTES: The vertical dashed lines represent 95 percent confidence intervals for ACS estimates. The upper diagonal line is the line of equality; the lower diagonal line is proportional regression (regression through origin).
ACS estimates. States are scattered above and below the regression line, indicating the deviations from proportionality of ACS and state-reported estimates. However, only in some cases are these deviations from proportionality statistically significant (confidence interval does not cross regression line).
TABLE 6-11 Comparison of Volatility in ACS Estimates of Youth Aged 5-18 and Enrolled in Public School and State Counts of Recent Immigrants (in percentage)
|
|
Sum of Absolute Difference in Share of States |
Mean Absolute Relative Difference in Share of States |
|
ACS 2006 to 2007 |
|
|
|
All |
11.68 |
31.66 |
|
Large |
3.83 |
8.98 |
|
Medium |
5.32 |
21.85 |
|
Small |
2.05 |
42.43 |
|
Minimum |
0.48 |
73.09 |
|
ACS 2007 to 2008 |
|
|
|
All |
15.97 |
38.08 |
|
Large |
8.17 |
21.12 |
|
Medium |
4.78 |
24.22 |
|
Small |
2.75 |
53.58 |
|
Minimum |
0.27 |
73.27 |
|
ACS 2005-2007 to 2006-2008 |
|
|
|
All |
6.16 |
14.65 |
|
Large |
3.53 |
6.34 |
|
Medium |
1.71 |
8.22 |
|
Small |
0.73 |
20.90 |
|
Minimum |
0.20 |
34.01 |
|
State 2006-2007 to 2007-2008 |
|
|
|
All |
9.76 |
26.62 |
|
Large |
3.60 |
6.62 |
|
Medium |
4.63 |
19.05 |
|
Small |
0.93 |
20.11 |
|
Minimum |
0.59 |
99.37 |
|
State 2007-2008 to 2008-2009 |
|
|
|
All |
35.45 |
44.35 |
|
Large |
22.92 |
33.61 |
|
Medium |
10.28 |
47.39 |
|
Small |
2.02 |
41.39 |
|
Minimum |
0.23 |
57.20 |
Volatility of State and ACS Estimates
As we did for the analysis of counts of ELL students (in Chapter 2), we report our assessment of changes in shares between consecutive years using several different measures of immigrant children, which are summarized in Table 6-11. Both the absolute and relative year-to-year changes in shares that are based on the 1-year ACS estimates are much greater than those that are based on the 3-year estimates. The 1-year estimates consequently are more volatile than the 3-year estimates, although they are also more responsive to year-to-year changes. In relative terms, the volatility of the ACS estimates increases monotonically from “large” to “small” states, as would be expected with diminished sample size, although in absolute terms the largest part of the share (and hence money moved) is in the “large” states.
The relative changes in share between consecutive 1-year ACS estimates are quite large, in most cases averaging more than 10 percent for all but the “large” states. This observation, with the earlier analysis of reliability of changes—which showed that interyear changes in these estimates are largely noise—together suggest that the volatility of the 1-year estimates outweighs the value of their greater responsiveness.
The interyear changes in shares based on state-provided data are surprisingly large, even though they are based on administrative data and therefore not subject to sampling error. This is especially notable from 2007-2008 to 2008-2009, when the shifts in share across states were even larger than those from single-year ACS estimates. (There seemed to be a substantial, but smaller, shift in single-year ACS estimates at about the same time.) This finding suggests that there might be substantial instability in the way child immigration counts are collected and reported by the states.
CONCLUSION 6-1 Due to greater stability and insensitivity to poorly estimated changes, the American Community Survey(ACS) 3-year estimates of immigrant children are statistically preferable to ACS 1-year estimates and more plausible at present than the state-provided counts.
ACS Data and LEA Reports
To better understand the relationship between ACS estimates and LEA-provided counts (through the states) of immigrant children, we performed an analysis of consistency between these measures across school districts within each state. The methods (correlations adjusted for sampling error and a hierarchical model), data (2006-2008 ACS), and inclusion criteria (districts with at least 20,000 population) are very similar to those presented in the parallel analysis of ELL rates in Chapter 5 and are not repeated here.
Table 6-12 presents summary statistics by state. Rates of immigrant status by school district vary substantially, often dramatically, within each state. ACS estimates are almost always lower than LEA-provided estimates, but the ratio varies greatly from state to state. This table shows that the state immigration rates were
TABLE 6-12 Rates of Immigrant Children by Eligible School District
|
State |
State Counts |
State Immigrant Student Rates |
ACS Overall Rate |
Ratio of ACS/State |
Unadjusted Correlation |
||||
|
School Enrollment |
Number of LEAs |
Overall Rate |
Mean of LEAs |
20th Percentile |
80th Percentile |
||||
|
Alaska |
77,679 |
4 |
1.0 |
0.5 |
0.0 |
1.3 |
1.0 |
0.97 |
0.16 |
|
Arizona |
834,896 |
64 |
1.7 |
1.5 |
0.1 |
3.0 |
1.4 |
0.82 |
0.50 |
|
Arkansas |
217,450 |
28 |
1.6 |
1.1 |
0.1 |
1.7 |
0.6 |
0.38 |
0.60 |
|
California |
5,491,668 |
411 |
4.1 |
3.9 |
2.0 |
5.6 |
1.4 |
0.33 |
0.51 |
|
Colorado |
640,769 |
33 |
1.9 |
2.1 |
0.3 |
3.0 |
0.8 |
0.42 |
0.42 |
|
Connecticut |
378,744 |
56 |
3.2 |
2.5 |
1.1 |
3.7 |
1.2 |
0.38 |
0.75 |
|
Delaware |
102,396 |
13 |
1.1 |
0.9 |
0.5 |
1.1 |
0.7 |
0.62 |
0.09 |
|
District of Columbia |
57,877 |
1 |
1.3 |
1.3 |
1.3 |
1.3 |
1.1 |
0.82 |
NA |
|
Florida |
2,619,362 |
54 |
5.4 |
3.6 |
1.2 |
5.8 |
1.5 |
0.27 |
0.51 |
|
Georgia |
1,412,950 |
91 |
2.3 |
1.2 |
0.3 |
1.8 |
0.7 |
0.32 |
0.66 |
|
Hawaii |
179,897 |
1 |
1.7 |
1.7 |
1.7 |
1.7 |
2.3 |
1.36 |
NA |
|
Indiana |
701,769 |
86 |
1.4 |
1.3 |
0.3 |
2.2 |
0.5 |
0.33 |
0.59 |
|
Iowa |
210,815 |
27 |
1.3 |
1.0 |
0.1 |
1.9 |
0.6 |
0.46 |
0.39 |
|
Kansas |
250,297 |
23 |
4.3 |
2.7 |
0.4 |
2.5 |
0.8 |
0.19 |
–0.05 |
|
Kentucky |
371,406 |
38 |
1.9 |
0.8 |
0.1 |
0.7 |
0.6 |
0.30 |
0.45 |
|
Louisiana |
566,824 |
43 |
0.4 |
0.3 |
0.1 |
0.4 |
0.3 |
0.58 |
0.40 |
|
Maine |
26,010 |
6 |
1.5 |
1.4 |
0.0 |
3.3 |
1.8 |
1.18 |
0.92 |
|
Maryland |
843,426 |
23 |
2.0 |
1.0 |
0.2 |
1.3 |
1.4 |
0.69 |
0.68 |
|
Massachusetts |
590,965 |
97 |
3.2 |
2.4 |
0.2 |
4.2 |
1.4 |
0.45 |
0.64 |
|
Michigan |
445,557 |
46 |
1.9 |
1.9 |
0.3 |
3.0 |
1.0 |
0.53 |
0.60 |
|
Mississippi |
288,725 |
42 |
1.5 |
1.4 |
0.4 |
2.4 |
0.3 |
0.22 |
0.26 |
|
Missouri |
94,131 |
9 |
0.4 |
0.5 |
0.2 |
0.7 |
0.8 |
1.74 |
–0.12 |
|
Montana |
34,686 |
8 |
0.4 |
0.6 |
0.1 |
0.8 |
0.9 |
2.16 |
–0.63 |
|
Nebraska |
169,074 |
15 |
1.7 |
1.4 |
0.4 |
2.5 |
0.8 |
0.47 |
0.27 |
TABLE 6-13 Relationship at the School District Level Between ACS Estimates and State-Provided Estimates of the Rate of Immigrant Children Among Public School Enrollees, in Eligible Districts as Described in Text, for States with at Least 10 Eligible Districts
|
|
Model with Intercept, State Data Rate |
No-Intercept Model |
Ratio of Sigma Estimates |
|||||
|
Intercept Coefficient |
State Coefficient |
Sigma |
Adjusted Correlation |
State Coefficient |
Sigma |
Number of LEAs |
||
|
Arizona |
0.0071 |
0.1461 |
0.0035 |
0.6680 |
0.3562 |
0.0065 |
64 |
1.86 |
|
Arkansas |
0.0028 |
0.1081 |
0.0004 |
0.9802 |
0.2268 |
0.0001 |
28 |
0.22 |
|
California |
0.0033 |
0.1507 |
0.0036 |
0.7168 |
0.2217 |
0.0038 |
411 |
1.06 |
|
Colorado |
0.0031 |
0.1506 |
0.0030 |
0.7115 |
0.2573 |
0.0032 |
33 |
1.05 |
|
Connecticut |
−0.0015 |
0.3513 |
0.0011 |
0.9862 |
0.3003 |
0.0010 |
56 |
0.91 |
|
Delaware |
0.0034 |
0.0030 |
0.0000 |
0.3748 |
0.2115 |
0.0001 |
13 |
1.17 |
|
Florida |
0.0023 |
0.1699 |
0.0039 |
0.8306 |
0.2076 |
0.0038 |
54 |
0.98 |
|
Georgia |
0.0007 |
0.2040 |
0.0016 |
0.8647 |
0.2328 |
0.0016 |
91 |
0.97 |
|
Indiana |
0.0019 |
0.1100 |
0.0008 |
0.8801 |
0.1969 |
0.0011 |
86 |
1.43 |
|
Iowa |
0.0015 |
0.1848 |
0.0007 |
0.9543 |
0.2636 |
0.0006 |
27 |
0.75 |
|
Kansas |
0.0058 |
−0.0015 |
0.0005 |
0.1722 |
0.0271 |
0.0047 |
23 |
8.73 |
|
Kentucky |
0.0021 |
0.1749 |
0.0001 |
0.9993 |
0.2432 |
0.0001 |
38 |
1.08 |
|
Louisiana |
0.0003 |
0.2898 |
0.0003 |
0.9591 |
0.3554 |
0.0001 |
43 |
0.52 |
|
Maryland |
0.0015 |
0.4868 |
0.0031 |
0.8727 |
0.5511 |
0.0032 |
23 |
1.01 |
|
Massachusetts |
0.0031 |
0.2607 |
0.0015 |
0.9825 |
0.3320 |
0.0001 |
97 |
0.09 |
|
Michigan |
0.0028 |
0.2796 |
0.0025 |
0.9454 |
0.3704 |
0.0025 |
46 |
1.00 |
|
Mississippi |
0.0023 |
0.0936 |
0.0001 |
0.9956 |
0.1955 |
0.0001 |
42 |
1.05 |
|
Nebraska |
0.0000 |
0.3624 |
0.0003 |
0.9965 |
0.3657 |
0.0003 |
15 |
0.85 |
|
North Carolina |
−0.0003 |
0.2857 |
0.0013 |
0.9087 |
0.2686 |
0.0013 |
89 |
1.03 |
|
Oklahoma |
0.0045 |
0.0144 |
0.0016 |
0.0836 |
0.2255 |
0.0028 |
23 |
1.76 |
|
Oregon |
0.0023 |
0.8148 |
0.0015 |
0.9321 |
1.1533 |
0.0001 |
43 |
0.06 |
|
Pennsylvania |
0.0041 |
0.0407 |
0.0020 |
0.1765 |
0.2971 |
0.0029 |
101 |
1.48 |
|
|
Model with Intercept, State Data Rate |
No-Intercept Model |
Ratio of Sigma Estimates |
|||||
|
Intercept Coefficient |
State Coefficient |
Sigma |
Adjusted Correlation |
State Coefficient |
Sigma |
Number of LEAs |
||
|
Rhode Island |
0.0016 |
0.4022 |
0.0002 |
0.9997 |
0.4494 |
0.0002 |
19 |
1.01 |
|
South Carolina |
0.0023 |
0.1685 |
0.0015 |
0.5744 |
0.3782 |
0.0018 |
49 |
1.19 |
|
Tennessee |
0.0020 |
0.0785 |
0.0012 |
0.6575 |
0.1358 |
0.0004 |
61 |
0.36 |
|
Texas |
0.0019 |
0.3480 |
0.0031 |
0.8401 |
0.4218 |
0.0031 |
183 |
0.98 |
|
Virginia |
0.0006 |
0.2743 |
0.0015 |
0.9836 |
0.2933 |
0.0014 |
66 |
0.94 |
|
Washington |
0.0009 |
0.3521 |
0.0023 |
0.9128 |
0.3911 |
0.0027 |
60 |
1.15 |
|
West Virginia |
0.0025 |
0.0736 |
0.0001 |
0.9938 |
0.2416 |
0.0001 |
26 |
1.12 |
|
Wisconsin |
0.0024 |
0.0619 |
0.0012 |
0.4047 |
0.1859 |
0.0013 |
49 |
1.09 |
substantially different from the ACS rates in many states. In the most populous state, California, the state reports yielded an immigrant student estimate of 4.1 percent of all students in school year 2007-2008 while the ACS estimate was 1.4 percent. In most, but not all states, the state-reported rates were higher than the ACS rates.
Table 6-12 also summarizes the strength of the association between ACS and state-provided rates within each state, corrected for overfitting due to sampling error. With some exceptions, these correlations tend to be generally quite high, with half of the 30 states included showing adjusted correlations of higher than 0.90. This finding suggests that the measures are usually fairly consistent within each state, holding constant the state procedures and to some extent the immigration patterns (to the extent that they are more consistent within than between states). However, the correlations are considerably weaker in some states, perhaps providing evidence of inconsistent collection of immigration data or of varying patterns of immigration that affect consistency of reporting.
We also tested the relationship at the school district level between ACS estimates and state-provided estimates of rate of immigrant children among public school enrollees. As shown in Table 6-13, the results are mixed, with some states showing a very good consistency between the ACS and state-provided numbers for immigrants, and other states showing a very weak relationship between the series. When compared with the results of this test for the ELL estimates and counts in Chapter 5, these findings suggest that there are perhaps systemic differences between the ACS and state-provided counts at the school district level. The results suggest the possibility of less consistent procedures and criteria within many states than was observed with the within-state counts of ELL students, an indication that caution should be exercised in using the state-provided counts of immigrant children.


