
4
State Procedures for Identifying and Classifying English Language Learners
Although the Elementary and Secondary Education Act (ESEA) provides an official definition of a limited English proficiency (LEP) student, or English language learner (ELL) student, the act leaves it to states to operationalize the definition and to determine procedures for identifying students in need of Title III services. Figure 4-1 provides an overview of the classification and reclassification procedures.
Every state has an initial identification process whereby it identifies the pool of linguistic minority students, assesses their level of English language proficiency (ELP) using either a brief ELP assessment (usually called a “screener” or a “placement test”) or a full-scale proficiency assessment, and determines which linguistic minority students are English language learners and therefore in need of Title III services. All states also have a process by which they annually assess ELL students’ progress in learning English, determine when they no longer need these services, and procedures for reclassifying students as former English language learners.
Each state has developed its own approach, so the criteria for classification into and exit from ELL status, and the specialized services associated with it, vary across states. In addition, some states permit local control with respect to ELL classification and reclassification: the state sets forth general guidelines for ELL classification and exit criteria but allows local school districts to determine some or all of the criteria and performance standards for ELL classification and Title III services. Thus, in these states, the criteria can also vary from district to district.
The criteria that states use for identifying students as ELL and as in need of Title III services ultimately determine the numbers that they report to the U.S. Department of Education (DoEd). Some states have relatively stringent entry criteria and relatively lenient exit criteria, which means they are providing Title III services only for students most in need. Other states have more lenient entry criteria and more
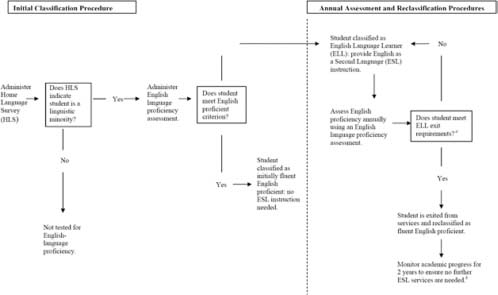
FIGURE 4-1 ELL classification and reclassification procedures.
aSome states use multiple exit criteria (e.g., a proficiency test, an academic achievement test, teacher’s judgment, local assessments, parental input, language team review, etc.). They may be administered or monitored simultaneously or meeting one criterion may be required to sequentially “trigger ” administration or review of others.
bStudents who exit ESL must be followed for 2 years per federal law. On rare occasions, reclassified fluent English proficient students are judged to have been exited prematurely and are returned to ELL status to receive needed linguistic and academic services.
stringent exit criteria, which means they are providing services to many students with English language difficulties and retaining them in the classification until they are ready to function without specialized language and instructional support services. If Title III funding is going to be based on the counts provided by the states, it is important to understand the policies, processes, and practices that lead to these counts and the ways that the policies, processes, and practices differ across the states.
In this chapter, we compare the processes used by the states to classify students as ELL and therefore eligible for Title III services. After first commenting on the panel’s approach to obtaining the information, we discuss states’ procedures for initially classifying a student as an ELL. We then discuss states’ procedures for reclassifying students as “formerly English language learners” and exiting them from the ELL category and its attendant specialized services. In the final section of the chapter we discuss the reporting mechanisms under which the data on ELL students are gathered, assembled, forwarded, and maintained and the effects of those mechanisms.
The committee relied on existing sources for information about state policies, practices, and criteria. The sources included several recent large-scale efforts to gather information on states’ procedures for identifying ELL students:
-
extensive information by Bailey and Kelly (2010) on home language surveys;
-
data from Wolf et al. (2008) on state (including the District of Columbia) policies, procedures, and criteria for the 2006-2007 school year;
-
an in-depth study by Ragan and Lesaux (2006) of the procedures in place during the 2004-2005 school year in 10 states and 10 school districts with high enrollments of ELL students;1 and
-
a study by Porta and Vega (2007) about states’ procedures and their ELP tests.
These studies provided a snapshot of policies and practices prior to 2008-2009. For information about policies, procedures, and criteria in place in 2008-2009, the panel held focused reviews and discussions with officials in seven states: California, Colorado, New York, North Carolina, South Carolina, Texas, and Washington, all of which have high ELL student enrollments. In addition, we conducted a survey of state Title III administrators to update the information about the assessments their states use.
INITIAL CLASSIFICATION OF STUDENTS
Home Language Surveys
The first step toward students’ initial classification as an ELL student, as shown on the left-hand side of Figure 4-1, is administration of a brief questionnaire referred to as the home language survey (HLS). Use of an HLS to identify linguistic minority students originated with the remedies implemented in 1975 after the Supreme Court decision in the Lau v. Nichols discrimination case.2 Although school systems are not required to use an HLS under federal law, Title III does require states to identify students in need of language support services, defining such individuals in terms of coming from “an environment where a language other than English has had a significant impact on the individual’s level of English language proficiency” (Bailey and Kelly, 2010, p. 1). In the absence of federal guidance, all states have recommended, and most have required, the use of an HLS as the first step in identifying students that are potentially in need of language support services.
States and local school districts vary with regard to administering the HLS, beginning with when the questionnaire is administered. In some states, it is routinely administered to all students at the time of enrollment. Typically, the school official that handles new school enrollments asks the questions of the parent(s) or other adult guardian enrolling the child. In other states, the questionnaire is administered only to students who are referred for ELL services: referrals are typically made by parents and teachers. The questionnaires also differ with respect to the phrasing and content of the questions asked and with respect to the state regulations for implementation and interpretation of responses for further screening and assessment (Bailey and Kelly, 2010, p. 4). Further, some states are “local control states” and allow the school district to have final say over the questions used on the HLS.
We asked officials in the seven states that we studied about the questions asked on their HLS and received the information below
California:
California is a local control state. The HLS includes, but is not limited to, the questions listed below. The local school district may add questions.
-
Which language did your child learn when he/she first began to talk?
-
Which language does your child most frequently speak at home?
-
Which language do you (the parents or guardians) most frequently use when speaking with your child?
-
Which language is most often spoken by adults in the home? (parents, guardians, grandparents, or any other adults)
Colorado:
-
Is a language other than English used in the home?
-
Was the student’s first language other than English?
-
Does the student speak a language other than English?
New York:
-
What language does the child understand?
-
What language does the child speak most often?
-
What language does the child read best?
-
What language does the child write best?
North Carolina:
-
What is the first language the student learned to speak?
-
What language does the student speak most often?
-
What language is spoken in the home?
South Carolina:
-
What is the language that your child first learned?
-
What language does the student speak most often?
-
What language is most often spoken in the home?
Texas:
-
What language is spoken in the home most of the time?
-
What language does the child speak most of the time?
Washington:
-
Is a language other than English spoken in the home?
-
Did your child first speak a language other than English?
-
What language did your child first speak?
These examples illustrate the variety of questions used to initially identify students for ELL services in just a few states. (For a more comprehensive listing of state questions, see Bailey and Kelly, 2010.)
In their analysis of the questions, Bailey and Kelly (2010) classify the differences along several dimensions. Some questions focus on the first or native language of the child; other questions focus on where the other language is spoken or what languages other than English are spoken; still others focus on the frequency with which the student speaks English, equating language dominance with proficiency.
State practices for implementing an HLS also vary. In some states, the questions are standardized through a stateside mandated form. In states with local control, each school district determines the questions, often through use of sample question forms provided by the state that local school districts are encouraged to adopt. For
instance, in Colorado and California, which have local control, the questions are recommended, but each district determines the exact questions to ask.
States also differ with respect to follow-up to the HLS. When any response to an HLS suggests that the student may not be a native English speaker, some follow-up action is taken, generally within a prescribed time period of 30 days (Title III law, Part C-General Provisions, SEC. 3302(a)). Typically, the next step is to administer an initial assessment to evaluate the student’s level of English proficiency, although in some states, a parent or student interview may be conducted before deciding whether or not to administer a proficiency assessment.
The validity of classifications based on the HLS has been questioned. For instance, Abedi (2008) noted that parents may not respond accurately because they misunderstand the questions, are worried about providing information that could lead to questions about their citizenship status, or are concerned that the ELL classification will lead to restricted educational opportunities for their child. These factors are likely to be more of an issue with recent immigrants or undocumented immigrants and in states with high populations of either group.
In summary, most states use an HLS as the first step in the ELL classification process—the initial identification of students as linguistic minority and therefore potentially English language learners. However, the number and content of the questions, the administration procedures, and decision rules about the results vary from state to state and, in some states, from district to district.
Initial English Language Proficiency Assessments
The initial assessment of a student’s English language proficiency usually involves administering a test. States use a variety of tests for this purpose, which tends to affect the comparability of the state data. Some administer the full state ELP test that is used for federal annual accountability reporting. Other states use a brief proficiency assessment, often called a “placement test,” or a “screener.” The objective of these tests is to further determine the student’s level of proficiency in four language domains (speaking, listening, reading, and writing) after the initial HLS inquiry of language environment, preference, and use (typically in speaking) has signaled linguistic minority status.
Table 4-1 shows the tests that each state uses for initial classification of students in need of Title III services.
A majority, 27 states, use a screener test. Of these 27, 18 use one of the screener tests developed by the World-Class Instructional Design and Assessment (WID Consortium (the W-APT or the MODEL), 3 use the LAS Links Placement test, 4 use their own screener, 1 uses the LAB-R, and 1 uses the Woodcock Munoz Language Survey.3 Four states use their ELP test for the initial proficiency assessment (Alaska, Arizona, California, and Florida), while two states (Connecticut and Nevada) allow
|
3 |
For the full names of the tests, see Table 4-1. |
TABLE 4-1 Tests Used by the States for Initial Classification of English Language Learners for the 2009-2010 School Year
|
State |
Test Used |
Type of Test |
|
Alabama |
W-APT |
WIDA Screener/placement test |
|
Alaska |
New IDEA Proficiency Test |
ELP test |
|
Arizona |
AZELLA |
ELP test (customized form of the SELP) |
|
Arkansas |
District chosen (LAS II or MAC II) |
Combination |
|
California |
CELDT |
ELP test |
|
Colorado |
CELA Placement test |
Screener/placement test |
|
Connecticut |
LAS Links Placement Test, LAS, or any ELP test |
any Screener/placement test or ELP test |
|
Delaware |
W-APT or MODEL |
WIDA Screener/placement test |
|
DC |
W-APT |
WIDA Screener/placement test |
|
Florida |
CELLA screener, LAS, or other test chosen by the district |
Combination |
|
Georgia |
W-APT |
WIDA Screener/placement test |
|
Hawaii |
LAS Links Placement Test |
Screener/placement test |
|
Idaho |
Idaho English Language Assessment (IELA) |
Screener/placement test |
|
Illinois |
W-APT, MODEL |
WIDA Screener/placement test |
|
Indiana |
LAS Links Placement Test |
Screener/placement test |
|
Iowa |
LAS, IPT (district chosen) |
|
|
Kansas |
KELPA, KEOPA-P, IPT, LAS, LAS Links, or LPTS (district chosen) |
Combination |
|
Kentucky |
W-APT |
WIDA Screener/placement test |
|
Louisiana |
District chosen |
Combination |
|
Maine |
W-APT or MODEL |
WIDA Screener/placement test |
|
Maryland |
LAS Links Placement Test |
Screener/placement test |
|
Massachusetts |
District chosen |
Combination |
|
Michigan |
ELPA Initial Screening |
Screener/placement test |
|
Minnesota |
District chosen |
|
|
Mississippi |
W-APT |
WIDA Screener/placement test |
|
Missouri |
W-APT |
WIDA Screener/placement test |
|
Montana |
District chosen |
Combination |
|
Nebraska |
District chosen |
Combination |
|
Nevada |
Pre-LAS or LAS Links |
Pre-LAS is a screener test; LAS Links is an ELP test |
|
New Hampshire |
W-APT |
WIDA Screener/placement test |
|
New Jersey |
District chosen |
Combination |
|
New Mexico |
W-APT |
WIDA Screener/placement test |
|
New York |
Language Assessment Battery-Revised (LAB-R) |
Screener/placement test |
|
N. Carolina |
W-APT or MODEL |
WIDA Screener/placement test |
|
N. Dakota |
W-APT |
WIDA Screener/placement test |
|
Ohio |
District chosen |
Combination |
|
Oklahoma |
W-APT |
WIDA Screener/placement test |
|
State |
Test Used |
Type of Test |
|
Oregon |
District chosen |
|
|
Pennsylvania |
W-APT |
WIDA Screener/placement test |
|
Rhode Island |
W-APT |
WIDA Screener/placement test |
|
S. Carolina |
District chosen (Woodcock Munoz Language Survey, LAS, IPT) |
Combination |
|
S. Dakota |
W-APT |
WIDA Screener/placement test |
|
Tennessee |
State developed test designed to be aligned with the ELDA |
Screener/placement test |
|
Texas |
District chosen |
Combination |
|
Utah |
District chosen |
Combination |
|
Vermont |
W-APT |
WIDA Screener/placement test |
|
Virginia |
W-APT, or district chosen |
WIDA Screener/placement test |
|
Washington |
WLPT-II Placement |
WLPT Screener/placement test (customized version of the SELP) |
|
W. Virginia |
Woodcock Munoz Language Survey |
Screener/placement test |
|
Wisconsin |
W-APT |
WIDA Screener/placement test |
|
Wyoming |
District chosen (but all used W-APT) |
WIDA Screener/placement test |
|
SOURCE: http://www.ncela.org; data confirmed by state Title III director. |
||
districts to choose between the state ELP test or the screener. In addition, 17 states allow districts to select the language proficiency assessment used for initial classification, though they generally provide a list of tests from which the district can select.
Examples of Initial Classification Procedures
Our discussions with Title III officials of the seven states we studied helped to clarify the steps and decisions involved in the initial classification process. The information is summarized below.
California Students who are identified as having a primary language other than English based on the HLS, must be assessed on the California English Language Development Test (CELDT). The CELDT is the designated state test of English language proficiency. Therefore, pupils must achieve the English proficiency level on the CELDT to be classified as Initially Fluent English Proficient. To achieve the English proficient level on the CELDT, pupils at grades 2 through 12 must have an overall score of Early Advanced or above and all four domains (listening, speaking, reading, and writing) at Intermediate or above. Pupils in Kindergarten and grade 1 (K-1) must have an overall score of Early Advanced or above and listening and speaking domains at Intermediate or above. Students who do not score at this level are classified as ELL students.
Colorado Students who are initially identified through the HLS are given a screener test, called the Colorado English Language Assessment (CELA) placement test. The screener assesses all four modalities (reading, writing, speaking, listening). A score of “Approaching Proficiency” or below indicates that ELL services are needed.
New York A response other than English to any of the questions on the HLS triggers an informal interview conducted in the native language and in English. If the student speaks little or no English, the student is assessed with the Language Assessment Battery-Revised (LAB-R), the state’s screener test. Those who score below the proficient level are classified as ELL students.
North Carolina Staff of the state’s English as a Second Language Program review the responses on the HLS, interview the parent or guardian as necessary, or observe the student to determine the home language. If it is determined that a student’s home language is other than English, the state’s screener test, the WIDA-ACCESS Placement Test (W-APT) is administered. For grades 1-12, those who score a composite of less than 5.0 or less than 5.0 on any of the four domains are identified as LEP students. For the first semester kindergarten W-APT, those who score less than 27 on listening and speaking are identified as LEP students. For the second semester kindergarten W-APT, those who score less than 27 on listening and speaking, less than 14 on reading, or less than 17 on writing are identified as LEP students.
South Carolina If the response to any of the questions on the HLS is a language other than English, the student is further assessed. The state currently allows districts to choose from among the LAS, IPT, or Woodcock-Muñoz assessments. The state plans to adopt the ELDA placement test as an additional screener when the test becomes available.
Texas A response other than English to either of the questions on the HLS triggers additional assessment. The local district is allowed to determine the assessment used for initial identification, provided it is one of the tests approved by the state education agency.4 For pre-K through 1st grade, districts are to use a test of oral language proficiency. For grades 2 and higher, students are given a norm-referenced achievement test in reading and language arts (such as the Iowa Test of Basic Skills). If the student scores below the 40th percentile, the case is sent to a review committee.
Washington A response of “yes” to the second question on the HLS (“Did your child first speak a language other than English?) triggers additional evaluation with the state screener test, which is based on the SELP and called the WLPT-II (Washington Language Proficiency Test-II). Scoring at a level of 3 or below indicates
|
4 |
For a list of agency-approved tests for the 2010-2011 school year, see http://ritter.tea.state.tx.us/curriculum/biling/ListofApprovedTests2010_2011.pdf [December 2010]. |
that the student is in need of ELL services. When responses to the HLS reveal that a language other than English is spoken in the home (first question) but the child speaks only English (second question), districts are required to follow up with the parent or guardian to ensure that the questions were clearly understood. ELL students are generally identified through the HLS, but teachers can also make referrals on the basis of their classroom observations.
In summary, states use either the ELP test or a screener or placement test as the second step in the ELL classification process to determine which linguistic minority students are English language learners. However, the assessments and criteria used for initially classifying students as English language learners vary from state to state. In addition in some states, a variety of other criteria may be considered in the initial classification decisions. And in states that permit local control, the assessments and the criteria used for initially classifying students as English language learners may vary from district to district.
CONCLUSION 4-1 Because of the differing state policies, practices, and criteria for initially identifying students as linguistic minority and for classifying them as an English language learner (ELL), individuals who are classified as ELL students in one state may not be classified as ELL students in another. In states that permit local control, students classified as ELL in one district may not be classified as ELL in another district in that state.
RECLASSIFICATION OF ELL STUDENTS
Criteria Considered
Each year, all ELL students must be reassessed to evaluate their progress in learning English. Typically, students are given an ELP test, and those who score at the level that the state has defined as “English proficient” may be considered eligible for reclassification as a “former ELL” student. The proficiency level that is the threshold for reclassification is determined by the state. This step of the process is shown on the right-hand side of Figure 4-1 (above).
In addition to scoring at the “English proficient” level on the ELP test, states consider a variety of other criteria in the reclassification process, such as performance on content area tests; input from school personnel; input from the parents or guardians; and other such measures as student grades, portfolios of the student’s work, student interviews, and evaluations of classroom performance. In local-control states, these criteria may differ by district within a given state. States use different combinations of these criteria, some using only the ELP test and some using as many as six different types of criteria.
According to the information gathered by Wolf and colleagues (2008) for the 2006-2007 school year, 12 states consider only the ELP test score in reclassification
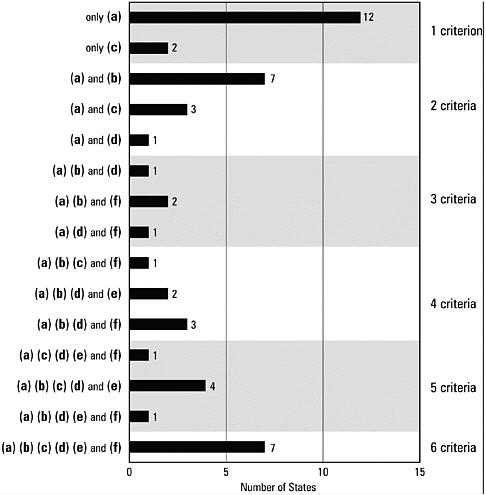
FIGURE 4-2 Number of criteria used by states for ELL reclassification.
NOTES: (a) Proficiency test scores, (b) content scores, (c) district-established criteria, (d) school personnel input, (e) parent or guardian input, (f) other.
SOURCE: Wolf et al. (2008). Figure from Issues in Assessing English Language Learners: English Language Proficiency Measures and Accommodation Uses—Practice Review. National Center for Research on Evaluation, Standards, and Student Testing, University of California, Los Angeles. Copyright ©2008. The Regents of the University of California and supported under the Institute of Education Sciences, U.S. Department of Education. Available: http://www.cse.ucla.edu/products/reports/R732.pdf. Reprinted with permission.
decisions, and 11 consider the ELP test and a second type of criterion—content-area achievement scores (7 states), district-level criteria (3 states), and other criteria (1 state): see Figure 4-2.
Of the remaining states, 26 indicated that they use the ELP test and two other kinds of criteria, and 2 indicated that the criteria are established by districts and thus
vary across the state. It is important to note here that the survey by Wolf and colleagues was conducted prior to the implementation of recent federal regulations and interpretations. The results provide a general sense of the variability across the states, but they are somewhat out of date. Most importantly, current federal regulations require that the results of the ELP test be used in reclassification decisions (Federal Register, 2008, October 17).
Examples of Reclassification Procedures
Our conversations with Title III officials at the seven states we studied helps to clarify the steps and decisions involved in the re-classification process. The information is summarized below.
California California EC 313(d) specifies four criteria that local education agencies (LEAs) at a minimum must use for students to be reclassified as fluent english proficient.5 Based on EC Section 313(d), guidelines for the reclassification of English learners were approved by the State Board of Education (September 2002, updated September 2006, and modified in July 2010). In accordance with EC 313(d), the reclassification procedures developed by the California Department of Education use multiple criteria in determining whether to reclassify a pupil as proficient in English, including, but not limited to, all of the following:
-
performance on the CELDT;
-
comparison of performance in basic skills against an empirically established range of performance in basic skills (e.g., the California Standards Test for English-Language Arts [CST for ELA] or the California Modified Assessment for ELA [CMA for ELA])6;
-
teacher evaluation, including, but not limited to, a review of the pupil’s curriculum mastery; and
-
parental opinion and consultation.
Colorado A body of evidence approach is used for reclassification. An overall score of 5, which corresponds to an advanced level on the Colorado English Language Assessment (CELA), triggers a broader review of the body of evidence available about the student. To be eligible for reclassification, a student must attain scores of 4.5 or higher on the subtests of the CELA and should score at the partially proficient level on the state’s English language arts assessment (the Colorado Student Assessment Program, CSAP). Also considered are district review committee evaluations,
|
5 |
For details, see http://www.cde.ca.gov/ta/tg/el/documents/celdt09astpkt1.pdf [November 2010]. |
|
6 |
On the CST for ELA or the CMA for ELA, to be considered for possible reclassification, a pupil should score in a range from the bottom to the midpoint of the scale score range that defines the “Basic” performance level or higher. |
language samples, observations, district-content specific tests, logs or journals, and other district-determined criteria.
New York Reclassification is based on results from the New York State English as a Second Language Achievement Test (NYSESLAT), the state’s ELP test. Students who score below the proficient level continue to receive ELL services. Students who score at the proficient level enter the general education program. No other criteria are considered.
North Carolina Students are judged to have attained English language proficiency and so exit from LEP status if they have an overall composite score of 4.8, with at least a 4.0 on the reading subtest and at least a 4.0 on the writing subtest, on the state’s proficiency test, ACCESS.
South Carolina To be reclassified, students must score at Level 5 on the English Language Development Assessment (ELDA), the state’s ELP test. For grades 3-12, ELL students must pass with a composite score of 5 or higher. Because the ELDA inventories for grades K-2 do not measure academic English to the extent deemed necessary for ending ESL services, students at those levels cannot be reclassified.
Texas Students who receive ELL services cannot be reclassified before the end of first grade. Below grade 3, reclassification is based on achieving the mastery level on an agency-approved ELP assessment and an agency-approved English language arts norm-referenced test. For grades 3 and higher, the student must meet state standards for passing the state’s English language arts test used for Title I of ESEA. Each district has a local language proficiency assessment committee that makes the final reclassification decision, based on a review of a variety of information available about the student. The review is a deliberative process. The committee gathers information from teachers and parents and assesses the needs of the “whole child.” Passing the state English language arts assessment is a minimum requirement, but students may pass this assessment and still remain in the ELL classification if other information suggests that they still need ESL services. Reclassification (at any grade level) is also based on the results of a subjective teacher evaluation (which may include other assessments, anecdotal records, portfolios, etc.).
Washington Reclassification is based on performance on the Washington Language Proficiency Test (WLPT-II), the state’s ELP test. Students must obtain an overall composite score of 4. Although Washington is a local-control state, the same reclassification standard is used by all school districts.
When a student meets the state (or local) criteria for reclassification, the student is formally “exited” from Title III services. This step in the process is shown on the right-most box on Figure 4-1 (above). These students are then reclassified as
former ELL students, sometimes referred to as “reclassified fluent English proficient students” or “former English language learner” (the label given to these students differs across the states).
Under ESEA, former ELL students are to be monitored for 2 years after exiting ELL status to ensure that they continue to perform well without specialized support services. Students who exhibit academic challenges due to linguistic difficulties may be reevaluated and, in rare cases, may be classified as ELL students and provided Title III services.
In summary, all states use the results of an ELP test to identify students who are English proficient and eligible to be considered for reclassification. However, the proficiency test that is used and the level of performance that defines when a student is considered to be “English proficient” is determined by the state and thus varies from state to state and, in local-control states, may vary from district to district. In addition, some states use other criteria in making reclassification decisions, which may include performance on content-area tests; input from school personnel, parents, or guardians; student grades; portfolios of student work; student interviews; and evaluations of classroom performance. Use of these criteria and decision rules varies from state to state. In states that permit local control, these criteria and rules can vary from district to district within a state.
CONCLUSION 4-2 Because of the wide variety of state policies, practices, and criteria for reclassifying students as former English language learners, and thereby exiting them from Title III services, a given English language learner student may remain in the classification longer in one state than in another state. In local control states, similar variation may exist among districts within the same state.
DATA ON ELL STUDENTS REPORTED TO THE FEDERAL GOVERNMENT
Although the variety of procedures used by states for classifying and reclassifying is wide, it does not mean that the procedures are not well thought out and appropriate for each state. Each state has adopted a process that it believes suits its own needs. Each state is aware of the linguistic demands of its regular curriculum, and it has developed procedures that allow it to ensure that students receive the support and instruction they need until they have adequate English language skills to handle the curriculum.
The classification process in each state is comprehensive and multidimensional. It includes direct assessments of students’ proficiency in English, along with other information about the student’s proficiency in English—such as classroom grades and performance, parental input, and teacher input. Thus, while there may be little cross-state comparability in the ways that the classification decisions are made, there is evidence that states make use of a variety of types of information in making classification decisions. However, our objective in reviewing these state practices was
to determine whether there was sufficient commonality of policies, practices, and criteria to ensure that data on the ELL population from one state would have the same meaning as data from another state if used in an allocation formula.
CONCLUSION 4-3 Each state has developed its own policies, practices, and criteria for determining which students need Title III services. Although these policies, practices, and criteria are intended to address the needs of English language learner (ELL) students in each state, they vary from state to state. And in states that permit local control in making these decisions, they may also vary from district to district. Consequently, counts of ELL students that qualify for Title III funding are based on criteria that can vary across the states, and among districts in some local control states.
The counts of ELL students start with schools and LEAs, which have the primary responsibility for collecting, maintaining, and reporting data on selected student populations they serve, including the number and other characteristics of ELL students they serve. LEAs report these numbers to their respective state education agency (SEA). The SEA aggregates the school and LEA data and provides the information as part of the Consolidated State Performance Report that each state submits to the DoEd.
The student-level data that is reported by schools and LEAs are defined in instructions to the states from the DoEd. The data on LEP (ELL) students consist of four types of counts that are relevant to this report:
-
the unduplicated count of all students in the state who meet the ESEA definition of LEP (see Chapter 1), which includes newly enrolled students and continually enrolled students whether or not they receive Title III services;
-
the unduplicated number of students who received services in Title III language instructional education programs;
-
the number of LEP students who were tested on an annual ELP assessment; and
-
for students who took the annual ELP test in (3), the number who scored at the level the state defines as “English proficient.”
At the DoEd, these data are maintained in the Education Data Exchange Network (EDEN) system, the backbone of which is the EDEN Submission System, an electronic data system to which states submit data on over 100 data groups at the state, district, and local levels. (The EDEN system is the main source of a series of regular reports in EDFacts, a system that centralizes performance data from the states.) Our analysis is based on data for the 2006-2007 school year.7
|
7 |
Although the data have been reported since the 2003-2004 school year, the instructions for the reports have been modified over the past few years, in part because of issues raised in a report from the U.S. Government Accountability Office (see Chapter 1). Similarly, the standard list of EDEN reports |
We obtained data on all four types of counts described above, but we focused our analyses on two of the counts, which we selected for conceptual reasons. The first is the unduplicated count of all students in the state who meet the ESEA definition of LEP (1 above). We judged that this count represented the most all-inclusive ELL estimate available from the states and is defined by law. However, as discussed earlier in this chapter, the law leaves it to states to operationalize this definition, and states’ policies, practices, and criteria affect their counts of students. And in local-control states, these policies, practices, and criteria may not be consistent across the state. We therefore decided to analyze a second count that we judged would provide a relatively objective measure across the states and would be relatively less susceptible to intrastate differences in local-control states: the number of students who were determined to be not proficient in English on a state’s ELP test (derived from 3 and 4 above). We refer to this count as “tested, not proficient.”
As explained in Chapter 3, all states are required to determine a level of performance on the ELP test that defines when a student is “English proficient.” All districts within a state use the same test for this purpose, and the “English proficient” level is consistent throughout that state. When students meet this criterion, they are eligible for consideration for reclassification, although other criteria may come into play, which may differ both within a state and from state to state. So an ELL count based on those scoring proficient on the ELP test provides an estimate that is based on a criterion that is common across the state.8
For the most part, all of these data were available through the EDEN system and were provided to us by the DoEd. For the data that were not yet incorporated into the EDEN system, we obtained them through the Consolidated State Performance Reports (CSPRs), either from staff at the Department or from reports available online. The sources of the data used are indicated in the discussions below.
Counts of all ELL Students
Table 4-2 shows the numbers of ELL students in each state for the 2006-2007, 2007-2008, and 2008-2009 school years, listed in order by the average of these counts across the three school years. It also shows each state’s share of the total U.S. population of ELL students.
Comparison of the data in Table 4-2 shows considerable year-to-year fluctuations in the absolute numbers of ELL students in some states. In Nevada, for example, which had the largest fluctuation, there was a decrease of about 23,000 ELL students, or about one-third, between 2006-2007 and 2007-2008 and a similar-sized increase between 2007-2008 and 2008-2009. Rhode Island also exhibited a fairly
TABLE 4-2 Numbers and Shares of All ELL Students by State: School Years 2006-2007, 2007-2008, and 2008-2009
|
State |
2006-2007 |
2007-2008 |
2008-2009 |
3-Year Average |
|||
|
Number |
Share* |
Number |
Share* |
Number |
Share* |
||
|
California |
1,559,146.0* |
36.4 |
1,553,091.0* |
34.3 |
1,515,082.0 |
33.7 |
1,542,439.7 |
|
Texas |
501,333.0 |
11.7 |
693,031.0 |
15.3 |
718,388.0 |
16.0 |
637,584.0 |
|
Florida |
234,614.0 |
5.5 |
231,403.0 |
5.1 |
226,122.0 |
5.0 |
230,713.0 |
|
New York |
196,153.0 |
4.6 |
210,359.0 |
4.6 |
183,952.0 |
4.1 |
196,821.3 |
|
Illinois |
172,950.0 |
4.0 |
189,926.0 |
4.2 |
204,737.0 |
4.6 |
189,204.3 |
|
Arizona |
152,753.0 |
3.6 |
149,721.0 |
3.3 |
125,636.0 |
2.8 |
142,703.3 |
|
North Carolina |
87,745.0 |
2.0 |
127,449.0 |
2.8 |
113,823.0 |
2.5 |
109,672.3 |
|
Colorado |
89,881.0* |
2.1 |
85,323.0 |
1.9 |
88,907.0 |
2.0 |
88,037.0 |
|
Virginia |
86,392.0 |
2.0 |
84,345.0 |
1.9 |
87,026.0 |
1.9 |
85,921.0 |
|
Washington |
84,761.0 |
2.0 |
80,694.0 |
1.8 |
82,711.0 |
1.8 |
82,722.0 |
|
Georgia |
74,132.0 |
1.7 |
79,987.0 |
1.8 |
80,890.0 |
1.8 |
78,336.3 |
|
Nevada |
70,548.0 |
1.6 |
47,049.0 |
1.0 |
75,952.0 |
1.7 |
64,516.3 |
|
Oregon |
61,914.0 |
1.4 |
62,111.0 |
1.4 |
63,011.0 |
1.4 |
62,345.3 |
|
Minnesota |
63,858.0 |
1.5 |
61,229.0 |
1.4 |
61,486.0 |
1.4 |
62,191.0 |
|
Michigan |
69,705.0 |
1.6 |
51,465.0 |
1.1 |
60,945.0 |
1.4 |
60,705.0 |
|
New Mexico |
60,711.0 |
1.4 |
61,207.0 |
1.4 |
53,970.0 |
1.2 |
58,629.3 |
|
New Jersey |
54,433.0* |
1.3 |
54,503.0* |
1.2 |
54,154.0 |
1.2 |
54,363.3 |
|
Massachusetts |
54,071.0 |
1.3 |
55,730.0 |
1.2 |
49,073.0 |
1.1 |
52,958.0 |
|
Utah |
48,399.0 |
1.1 |
46,770.0 |
1.0 |
44,470.0 |
1.0 |
46,546.3 |
|
Pennsylvania |
45,431.0 |
1.1 |
46,357.0 |
1.0 |
47,672.0 |
1.1 |
46,486.7 |
|
Indiana |
42,536.0 |
1.0 |
46,304.0 |
1.0 |
45,760.0 |
1.0 |
44,866.7 |
|
Wisconsin |
41,312.0 |
1.0 |
43,790.0 |
1.0 |
47,866.0 |
1.1 |
44,322.7 |
|
Maryland |
34,332.0* |
0.8 |
40,421.0 |
0.9 |
40,051.0 |
0.9 |
38,268.0 |
|
Oklahoma |
38,109.0 |
0.9 |
37,744.0 |
0.8 |
38,092.0 |
0.8 |
37,981.7 |
|
Ohio |
29,240.0 |
0.7 |
35,038.0 |
0.8 |
36,376.0 |
0.8 |
33,551.3 |
|
Kansas |
28,915.0 |
0.7 |
31,760.0 |
0.7 |
34,096.0 |
0.8 |
31,590.3 |
|
South Carolina |
30,163.0 |
0.7 |
28,366.0 |
0.6 |
31,450.0 |
0.7 |
29,993.0 |
|
Connecticut |
26,357.0 |
0.6 |
30,033.0 |
0.7 |
29,751.0 |
0.7 |
28,713.7 |
|
Arkansas |
23,651.0 |
0.6 |
25,905.0 |
0.6 |
27,634.0 |
0.6 |
25,730.0 |
|
Tennessee |
23,009.0 |
0.5 |
25,670.0 |
0.6 |
27,428.0 |
0.6 |
25,369.0 |
|
Alabama |
18,358.0 |
0.4 |
20,943.0 |
0.5 |
19,523.0 |
0.4 |
19,608.0 |
|
Iowa |
18,124.0 |
0.4 |
19,442.0 |
0.4 |
20,334.0 |
0.5 |
19,300.0 |
|
Missouri |
22,365.0 |
0.5 |
19,053.0 |
0.4 |
16,338.0 |
0.4 |
19,252.0 |
|
Nebraska |
18,190.0 |
0.4 |
19,128.0 |
0.4 |
18,394.0 |
0.4 |
18,570.7 |
|
Hawaii |
15,660.0 |
0.4 |
18,681.0 |
0.4 |
18,564.0 |
0.4 |
17,635.0 |
|
Idaho |
16,698.0 |
0.4 |
16,671.0 |
0.4 |
17,669.0 |
0.4 |
17,012.7 |
|
Alaska |
20,761.0 |
0.5 |
16,823.0 |
0.4 |
12,030.0 |
0.3 |
16,538.0 |
|
Kentucky |
10,816.0 |
0.3 |
12,896.0 |
0.3 |
14,589.0 |
0.3 |
12,767.0 |
|
Louisiana |
8,629.0 |
0.2 |
11,474.0 |
0.3 |
12,497.0 |
0.3 |
10,866.7 |
|
Rhode Island |
10,034.0 |
0.2 |
7,149.0 |
0.2 |
9,397.0* |
0.2 |
8,860.0 |
|
State |
2006-2007 |
2007-2008 |
2008-2009 |
3-Year Average |
|||
|
Number |
Share* |
Number |
Share* |
Number |
Share* |
||
|
Delaware |
6,648.0 |
0.2 |
7,260.0 |
0.2 |
7,184.0 |
0.2 |
7,030.7 |
|
Montana |
6,983.0 |
0.2 |
6,722.0 |
0.1 |
4,550.0 |
0.1 |
6,085.0 |
|
Mississippi |
4,982.0 |
0.1 |
5,451.0 |
0.1 |
6,543.0 |
0.1 |
5,658.7 |
|
District of Columbia |
4,717.0* |
0.1 |
5,126.0 |
0.1 |
5,854.0 |
0.1 |
5,232.3 |
|
Maine |
3,691.0 |
0.1 |
4,036.0 |
0.1 |
4,215.0 |
0.1 |
3,980.7 |
|
North Dakota |
2,399.0 |
0.1 |
4,648.0 |
0.1 |
4,068.0 |
0.1 |
3,705.0 |
|
South Dakota |
3,291.0 |
0.1 |
4,217.0 |
0.1 |
3,594.0 |
0.1 |
3,700.7 |
|
New Hampshire |
3,149.0 |
0.1 |
3,201.0 |
0.1 |
4,076.0 |
0.1 |
3,475.3 |
|
Wyoming |
3,006.0 |
0.1 |
2,395.0 |
0.1 |
2,277.0 |
0.1 |
2,559.3 |
|
West Virginia |
2,248.0 |
0.1 |
2,336.0 |
0.1 |
1,618.0 |
0.0 |
2,067.3 |
|
Vermont |
1,743.0 |
0.0 |
1,459.0 |
0.0 |
1,495.0 |
0.0 |
1,565.7 |
|
U.S. |
4,289,046 |
100.0 |
4,525,892 |
100.0 |
4,499,072 |
100.0 |
4,438,033.3 |
|
NOTES: States are listed in order by the 3-year average of their reported numbers of ELL students. *The shares represent each state’s share of the total number of ELL students in the country. SOURCE: Data from the U.S. Department of Education, Education Data Exchange Network, except counts noted with an asterisk, which were obtained from the Consolidated State Performance Reports. |
|||||||
large proportional swing, declining by about one-third, from about 10,000 to 7,100 students, between 2006-2007 and 2007-2008.
Yet although the absolute numbers appear to fluctuate, the states tend to rank order quite similarly across the years in terms of their percentage share of the total ELL population in the country. For instance, the 11 states with the highest percentage shares of ELL students are the same across all 3 years. Approximately 75 percent of the nation’s ELL students in the country reside in these 11 states.
Another way to think about the numbers of students served by each state is in relation to the total population of school-age children in the state. In effect, this percentage reflects the burden placed on the state: the percentage of its school-age population that needs Title III services. Table 4-3 shows each state’s count of all ELL students as the percentage of the total number of K-12 students enrolled in the state’s public schools,9 which we refer to as the state ELL rate.
Comparison of these percentages across the 3 years shows that they tend to be
|
9 |
Data on the total number of K-12 students enrolled in the state’s public schools are from the Common Core of Data for the 2006-2007, 2007-2008, and 2008-2009 school years: see http://nces.ed.gov/ccd [November 2010]. |
TABLE 4-3 Rates of All ELL Students by State: School Years 2006-2007, 2007-2008, and 2008-2009
quite stable. However, there are still some fairly substantial changes. For example, Texas experienced an increase of about 5 percentage points in its rate of ELL students over the 3 school years, increasing from 10.9 percent in 2006-2007 to 15.4 percent in 2008-2009. In contract, over the same period, Alaska experienced a decrease of roughly 6 percentage points. The fluctuation in the absolute numbers of ELL students in Nevada also showed up in the data for the state rate, which was 16.6 percent in 2006-2007, 11.0 percent in 2007-2008, and 17.7 percent in 2008-2009.
Counts of Tested, Not Proficient Students
As noted above, states annually report the number of students who take their ELP test and the number of students who scored at the “English proficient” level.10 Because these counts were not available through the EDEN system, staff at the DoEd provided us with the counts for two school years, 2007-2008 and 2008-2009:11 see Table 4-4. The table lists the states in order by the average of the counts across the 2 school years. The table also shows each state’s share of the total population of ELL students in the country who were tested and determined to be not proficient in English.
As with the counts of total ELL students (shown in Table 4-2 above), there were some fairly large differences in the absolute numbers across the 2 years. The largest increase was for Wisconsin, where the numbers more than tripled (from 12,865 students in 2007-2008 to 44,729 in 2008-2009). Colorado, Minnesota, and Virginia also saw fairly large increases, with their 2008-2009 counts roughly 50 percent higher than those for 2007-2008. In contrast, some states experienced decreases, the largest of which was Michigan, with a 31 percent decrease in absolute numbers from 2007-2008 to 2008-2009 (from 56,919 to 38,389).
Despite the fluctuations in absolute numbers, the states tended to rank order quite similarly across the 2 years with regard to their shares of students. Rank orderings of the seven states with the highest shares remained nearly identical across the 2 school years.
Comparison of state shares across the two types of counts (total ELL students and “tested, not proficient” students) also shows considerable similarity in the rank orderings. For instance, as can be seen by comparing Tables 4-2 and 4-4, the 16 states with the highest percentage shares are the same across the two counts; and the rank orderings of these states change only slightly across the two tables. For example, in Table 4-4, New York is ranked third and Florida is ranked fourth, and in Table 4-2,
TABLE 4-4 Numbers and Shares of ELL Students Reported Tested, Not Proficient for 2007-2008 and 2008-2009 School Years
|
State |
2007-2008 |
2008-2009 |
2-Year Average |
||
|
Number |
Sharea |
Number |
Sharea |
||
|
California |
896,521 |
29.37% |
896,521b |
28.63% |
896,521.0 |
|
Texas |
460,680 |
15.09% |
477,611 |
15.25% |
469,145.5 |
|
New York |
170,710 |
5.59% |
166,212 |
5.31% |
168,461.0 |
|
Florida |
165,325 |
5.42% |
161,734 |
5.16% |
163,529.5 |
|
Arizona |
126,675 |
4.15% |
89,555 |
2.86% |
108,115.0 |
|
Illinois |
108,836 |
3.56% |
101,507 |
3.24% |
105,171.5 |
|
North Carolina |
101,645 |
3.33% |
93,150 |
2.97% |
97,397.5 |
|
Colorado |
53,340 |
1.75% |
84,660 |
2.70% |
69,000.0 |
|
Washington |
67,425 |
2.21% |
69,631 |
2.22% |
68,528.0 |
|
Virginia |
52,910 |
1.73% |
83,538 |
2.67% |
68,224.0 |
|
Nevada |
63,642 |
2.08% |
66,330 |
2.12% |
64,986.0 |
|
Georgia |
62,576 |
2.05% |
62,999 |
2.01% |
62,787.5 |
|
Oregon |
55,390 |
1.81% |
55,301 |
1.77% |
55,345.5 |
|
Michigan |
56,919 |
1.86% |
38,389 |
1.23% |
47,654.0 |
|
New Mexico |
44,874 |
1.47% |
43,824 |
1.40% |
44,349.0 |
|
Minnesota |
35,871 |
1.17% |
52,452 |
1.67% |
44,161.5 |
|
Indiana |
38,334 |
1.26% |
41,569 |
1.33% |
39,951.5 |
|
New Jersey |
38,953 |
1.28% |
40,571 |
1.30% |
39,762.0 |
|
Pennsylvania |
36,007 |
1.18% |
31,886 |
1.02% |
33,946.5 |
|
Massachusetts |
26,212 |
0.86% |
36,354 |
1.16% |
31,283.0 |
|
Ohio |
29,584 |
0.97% |
31,267 |
1.00% |
30,425.5 |
|
Oklahoma |
29,484 |
0.97% |
28,477 |
0.91% |
28,980.5 |
|
Wisconsin |
12,865 |
0.42% |
44,729 |
1.43% |
28,797.0 |
|
Kansas |
28,455 |
0.93% |
27,003 |
0.86% |
27,729.0 |
|
Utah |
27,733 |
0.91% |
27,666 |
0.88% |
27,699.5 |
|
South Carolina |
26,147 |
0.86% |
27,937 |
0.89% |
27,042.0 |
|
Maryland |
19,718 |
0.65% |
33,518 |
1.07% |
26,618.0 |
|
Arkansas |
23,612 |
0.77% |
25,104 |
0.80% |
24,358.0 |
|
Tennessee |
19,376 |
0.63% |
18,588 |
0.59% |
18,982.0 |
|
Connecticut |
18,535 |
0.61% |
16,881 |
0.54% |
17,708.0 |
|
Hawaii |
15,085 |
0.49% |
15,649 |
0.50% |
15,367.0 |
|
Alabama |
16,099 |
0.53% |
12,490 |
0.40% |
14,294.5 |
|
Missouri |
12,185 |
0.40% |
16,313 |
0.52% |
14,249.0 |
|
Iowa |
14,203 |
0.47% |
14,197 |
0.45% |
14,200.0 |
|
Alaska |
14,183 |
0.46% |
13,861 |
0.44% |
14,022.0 |
|
Idaho |
14,157 |
0.46% |
10,530 |
0.34% |
12,343.5 |
|
Nebraska |
12,244 |
0.40% |
12,044 |
0.38% |
12,144.0 |
|
Kentucky |
11,493 |
0.38% |
12,771 |
0.41% |
12,132.0 |
|
Louisiana |
11,456 |
0.38% |
10,206 |
0.33% |
10,831.0 |
|
Rhode Island |
5,741 |
0.19% |
6,505 |
0.21% |
6,123.0 |
|
District of Columbia |
4,656 |
0.15% |
4,664 |
0.15% |
4,660.0 |
|
Delaware |
3,089 |
0.10% |
4,999 |
0.16% |
4,044.0 |
|
State |
2007-2008 |
2008-2009 |
2-Year Average |
||
|
Number |
Sharea |
Number |
Sharea |
||
|
Maine |
3,134 |
0.10% |
3,789 |
0.12% |
3,461.5 |
|
Mississippi |
1,159 |
0.04% |
5,645 |
0.18% |
3,402.0 |
|
New Hampshire |
2,840 |
0.09% |
3,348 |
0.11% |
3,094.0 |
|
North Dakota |
4,257 |
0.14% |
1,923 |
0.06% |
3,090.0 |
|
South Dakota |
2,846 |
0.09% |
2,818 |
0.09% |
2,832.0 |
|
Wyoming |
1,872 |
0.06% |
1,856 |
0.06% |
1,864.0 |
|
Montana |
1,572 |
0.05% |
1,052 |
0.03% |
1,312.0 |
|
Vermont |
1,210 |
0.04% |
1,208 |
0.04% |
1,209.0 |
|
West Virginia |
1,148 |
0.04% |
853 |
0.03% |
1,000.5 |
|
United States |
43,052,983 |
3,131,685 |
|||
|
NOTES: The numbers of tested, not proficient students were computed for each state by subtracting the number of all LEP (ELL) students proficient or above on a state’s proficiency test from the number of all LEP (ELL) students tested on the state annual ELP assessment. States are listed in order by the 2-year average of their numbers of ELL students determined to be tested, not proficient. aPercentages represent each state’s share of the tested, not proficient students in the country. bData not available; 2007-2008 count used so that state shares could be estimated. SOURCE: Data from the Consolidated State Performance Reports (CSPR) provided by the U.S. Department of Education. |
|||||
Florida is third and New York is fourth. Similarly, in Table 4-4, Arizona is fifth and Illinois is sixth, and in Table 4-2, Illinois is fifth and Arizona is sixth.
These small differences in shares indicate that allocations based on the counts of all ELL students and allocations based on the counts of tested, not proficient students would be quite similar. The overall correlations between the shares for the two counts were 0.99 for both 2007-2008 and 2008-2009.
Table 4-5 shows the state rates for the counts of tested, not proficient students. The rates in Table 4-5 show the count of tested, not proficient students as a percentage of the total population of school-age children in the state. For the most part, the state rates are similar across the 2 school years, with fluctuations generally in the range of 2-3 percentage points. The largest difference was in Wisconsin, where the increase in absolute numbers across the 2 school years resulted in an increase of the rate from 1.47 percent to 5.12 percent. Comparison of state rates across the two types of counts (Tables 4-3 and 4-5) reveals some differences: the overall correlations between the rates for the two counts were 0.92 for 2007-2008 and 0.95 for 2008-2009.
Effect of Data Reporting Systems on Data Quality
Although we have documented some anomalies in the state-provided counts of ELL students, they seem to be less prevalent in data for the most recent school
TABLE 4-5 Rates of Tested, Not Proficient Students by State, 2007-2008 and 2008-2009 School Years (in percentage*)
|
State |
2007-2008 |
2008-2009 |
|
Alabama |
2.16 |
1.68 |
|
Alaska |
10.82 |
10.61 |
|
Arizona |
11.65 |
8.23 |
|
Arkansas |
4.93 |
5.24 |
|
California |
14.13 |
N/A |
|
Colorado |
6.65 |
10.34 |
|
Connecticut |
3.25 |
2.98 |
|
Delaware |
2.52 |
3.99 |
|
District of Columbia |
5.94 |
6.79 |
|
Florida |
6.20 |
6.15 |
|
Georgia |
3.79 |
3.80 |
|
Hawaii |
8.39 |
8.72 |
|
Idaho |
5.20 |
3.83 |
|
Illinois |
5.15 |
4.79 |
|
Indiana |
3.66 |
3.97 |
|
Iowa |
2.93 |
2.91 |
|
Kansas |
6.08 |
5.73 |
|
Kentucky |
1.73 |
1.91 |
|
Louisiana |
1.68 |
1.49 |
|
Maine |
1.60 |
1.97 |
|
Maryland |
2.33 |
3.97 |
|
Massachusetts |
2.72 |
3.79 |
|
Michigan |
3.36 |
2.31 |
|
Minnesota |
4.28 |
6.27 |
|
Mississippi |
0.23 |
1.15 |
|
Missouri |
1.33 |
1.78 |
|
Montana |
1.10 |
0.74 |
|
Nebraska |
4.20 |
4.12 |
|
Nevada |
14.82 |
15.31 |
|
New Hampshire |
1.41 |
1.69 |
|
New Jersey |
2.82 |
2.94 |
|
New Mexico |
13.64 |
13.27 |
|
New York |
6.17 |
6.06 |
|
North Carolina |
6.82 |
6.26 |
|
North Dakota |
4.48 |
2.03 |
|
Ohio |
1.62 |
1.72 |
|
Oklahoma |
4.59 |
4.41 |
|
Oregon |
9.79 |
9.82 |
|
Pennsylvania |
2.00 |
1.80 |
|
Rhode Island |
3.89 |
4.48 |
|
South Carolina |
3.67 |
3.89 |
|
South Dakota |
2.34 |
2.23 |
|
Tennessee |
2.01 |
1.91 |
year than in prior years. For instance, counts of total ELL students were missing for five states for the 2006-2007 school year but for only one state for the 2008-2009 school year. And for the 2 years we examined, only one state had missing data for the count of tested, not proficient students. The DoEd staff told us that they have worked on refining the instructions and formatting of the CSPRs and on ensuring that the EDEN data are accurate. The department has worked to remediate some of the earlier problems and developed a format for data elements that has been consistent for several years now.
We also note that, in education, as in many other fields, there have been vast improvements in data availability and access in recent years. The local and state education agencies and the DoEd have been particularly driven to improve data to address new accountability provisions of the NCLB.
Other factors have also influenced the recent advances in data availability, access, and quality. Standardization has been enhanced over the years by efforts such as the National Center for Education Statistics initiative to support the National Forum on Education Statistics, which brings together data system specialists from state agencies to focus on common data issues. The attention that has been paid to documenting the EDEN system and clarifying its specifications has also paid dividends. New initiatives—such as efforts to create quality longitudinal databases represented in the work of the Data Quality Campaign and recently augmented by $250 million in American Recovery and Reinvestment Act funding—have also begun to pay dividends in standardization of data elements and the development of sophisticated data systems to capture, analyze, and promulgate student data.
Thus, while we find some issues with the quality and availability of data on ELL students, we recognize the significant improvements that have been made
throughout the system, and are encouraged by new initiatives that continue to focus attention on further improvements.
CONCLUSION 4-4 There are concerns about the accuracy of the compilation and reporting of state data to the Department of Education. However, there have been significant improvements in the collection and reporting of these data over the past several years, and systems show promise for further improvements in the coming years.


