
2
Lessons from Past Warm Worlds
Alfred Wegener’s concept of continental drift, reformulated in the modern theory of plate tectonics, arose in part as a way to explain the geographic distribution of paleoclimate indicators in ancient rocks. Permo-Carboniferous (~300-million-year-old) glacial deposits in distinctly nonpolar regions of present-day Africa, South America, and Australia rectify to polar latitudes when the ancient supercontinent of Gondwana is reconstructed. Continental drift transported them through broad climate belts—humid tropics, arid subtropics, moist and cool temperate zones, and cold and arid polar regions (Box 2.1). Paleoclimate reconstructions, however, reveal that although paleogeography and the plate tectonics that control continental configurations are important, they are not the major determinant of climate change. Global warm climates have prevailed when large continents covered the poles, and deep “snowball Earth” glaciations occurred when there apparently were no polar continents. Instead, it appears that the greenhouse gas content of the atmosphere was the key factor in determining whether a particular interval of Earth’s past was an icehouse or a greenhouse.
Although most deep-time greenhouse climates occurred when there were distinctly different continental configurations, and thus are not direct analogues for the future, past warm climates and abrupt transitions into even hotter states (known as hyperthermal events; Thomas et al., 2000) provide important insights into how physical, biogeochemical, and biological processes operate under warm conditions more analogous to what is anticipated for the future than the moderate and stable climates of the Holocene (past 10,000 years) or the relatively warm interglacials of
BOX 2.1 Continental Drift and Climate
Plate tectonics has been rearranging Earth’s configuration of continents ever since the plates on Earth became rigid approximately 2.5 billion years ago (Figure 2.1). On long (millions of years) timescales, the movement of tectonic plates—and the continents that ride upon them—has strongly influenced Earth’s distribution of solar insolation, ocean and atmospheric circulation, and carbon cycling between the Earth’s deep and shallow reservoirs, thereby profoundly impacting global climate, sea level, and the overall planetary ecology.
The arrangement of the continents through time is most reliable for the past 800 million years, the period for which the chronostratigraphic tools necessary for reconstructions are available. The global views presented in Figure 2.1 show how the continents on Earth’s surface may have appeared during four intervals of time that are noted throughout this report: the unipolar glaciated Pennsylvanian (300 million years ago [Ma]), mid-Cretaceous (105 Ma), Eocene (50 Ma), and mid-Pliocene (3 Ma).
The major transitions between climatic icehouse and greenhouse conditions are ultimately most probably driven by the deep Earth processes of plate tectonics, as a function of the long-term balance between CO2 degassing at spreading centers and the conversion of atmospheric CO2 to mineral carbon through long-term silicate weathering and oceanic carbonate formation (Berner, 2004). For example, the eruptions of large igneous provinces in the mid-Cretaceous and the subduction of the carbonate-rich tropical Tethys Sea in the early Cenozoic are the most likely cause of the high-CO2 equilibrium climates of the Cretaceous and Eocene greenhouses. Conversely, uplift of the Himalayas and Tibetan Plateau associated with “docking” of the Indian subcontinent with Asia (~40 Ma), and the evolution of vascular land plants in the early Paleozoic (~450 Ma), led to the sequestration of atmospheric CO2 through enhanced weathering of silicate minerals (Ruddiman, 2007; Archer, 2009).
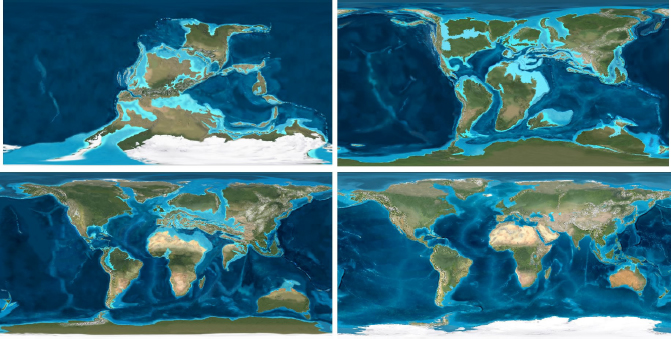
FIGURE 2.1 Continental configurations for the Pennsylvanian (upper left), mid-Cretaceous (upper right), Eocene (lower left), and mid-Pliocene (lower right). Topography was defined on the basis of digital elevation maps of modern Earth from the U.S. Geological Survey; colors portray climate and vegetation distribution based on a synthesis of all geological literature relevant to each time slice.
SOURCE: Courtesy R.C. Blakey, Colorado Plateau Geosystems.
the Pleistocene (past 2 million years). The following sections describe the insights provided by understanding past warm periods, including the role of greenhouse gases in controlling—or “forcing”—global warming; the impact of warming on ice sheet stability, sea level, and oceanic and hydrological processes; and the consequences of global warming for ecosystems and the global biosphere.
CLIMATE SENSITIVITY TO INCREASING CO2 IN A WARMER WORLD
Fundamentally, Earth’s climate results from the balance between absorbed energy from the sun and radiant energy emitted from Earth’s surface, with changes to either component resulting in a forcing of the climate system. The net forcing of the climate system over geological time caused episodes of warming and cooling that are coincident with greenhouse and icehouse climates, respectively. Most projections indicate that, by the end of this century, climate forcing resulting from increased CO2 will be at least of the same magnitude as that experienced in the early Cenozoic (during the late Eocene, ~34 Ma) (Figure 2.1), and possibly analogous to estimates for the Cretaceous Period (~80-120 Ma)—probably one of the times of greatest radiative forcing since the evolution of animals (Hay, 2010).
Climate sensitivity—the equilibrium warming resulting from a doubling of atmospheric carbon dioxide relative to preindustrial levels of CO2—provides a measure of how the climate system responds to external forcing factors and is also used to compare global climate model outputs to understand why different models respond to the same external forcings with different outputs. Climate sensitivity to CO2 strongly influences the magnitude of warming that Earth will experience at any particular time in the future (Box 2.2). The magnitude of climate sensitivity and Earth’s surface temperature are determined by a myriad of short-term (human timescales) and long-term (thousands to tens of thousands) interactions and feedbacks (e.g., water vapor, cloud properties, sea ice albedo, snow albedo, ice sheet and terrestrial biome distribution, ocean-atmosphere CO2 interaction, and silicate weathering).
As noted above, synthesis of the various estimates of Earth’s climate sensitivity for the past 20,000 years has lead to the general conclusion that sensitivity most probably lies in the range of 1.5 to 4.5°C (IPCC, 2007), with some recent projections suggesting that the value may be even as high as 6-8°C (Hansen et al., 2008; Knutti and Hegerl, 2008). However, estimates of equilibrium climate sensitivity averaged over tens to hundreds of millennia (i.e., long term) and extending back for 400 million years are minimally between 3 and 6°C (Royer et al., 2007). For the most recent period of global
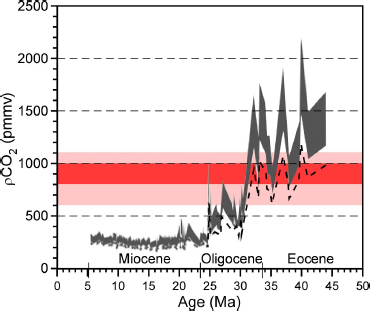
FIGURE 2.2 Estimated atmospheric pCO2 for the past 45 million years (late Eocene through Miocene) calculated using all available stable carbon isotopic values of diunsaturated alkenones in deep-sea sediments. Values of CO2aq were translated to atmospheric pCO2 using Henry’s Law and a range of dissolved phosphate values and sea surface temperatures for each site, and a salinity of 35 parts per thousand. The dark gray shaded region shows the range of maximum to intermediate estimates, and the dashed line represents minimum estimates. The uncertainty in pCO2 estimates ranges from ~20 percent for the Miocene to 30 to 40 percent for the Paleogene. The broad pale red band (pCO2 values of 600-1,100 parts per million by volume) encompasses most of the CO2 concentration range for nonmitigation emission scenarios projected for the end of this century (figure 10.26 in IPCC, 2007); the dark red band (values of 800-1,000 ppmv) corresponds to the Intergovernmental Panel on Climate Change (IPCC) A2 “business-as-usual” scenario.
SOURCE: Modified after Pagani et al. (2005).
warming, the middle Pliocene (~3.0-3.3 Ma), climate sensitivity may have been as high as 7-9.6°C ± 1.4°C per CO2 doubling (Pagani et al., 2010). Such values, which are well above short-term climate sensitivity estimates based on more recent paleoclimate and instrumental records, indicate that long-term feedbacks operating at accelerated timescales (decadal to centennial) promoted by global warming can substantially magnify an initial temperature increase.
As Earth moves toward a warmer climate state, it is important to understand the extent to which climate sensitivity will change due to processes
BOX 2.2 Why Does Climate Sensitivity Matter?
For any particular increase in atmospheric CO2 (and other greenhouse gases), a system with high climate sensitivity to CO2 will warm more in the future than a world with low climate sensitivity. Thus, if the climate sensitivity is high, restricting future global warming will require a larger reduction in future CO2 emissions than if climate sensitivity is lower. Comparison of emission scenarios for the period until 2100, calculated for a range of CO2 stabilization targets (Figure 2.3A) and the corresponding equilibrium global average temperature increases (Figure 2.3B; IPCC, 2007), based on the Intergovernmental Panel on Climate Change (IPCC) range of climate sensitivities (2 to 4.5°C), illustrates the impact of fossil carbon emissions on future surface temperatures and the extent of reductions required to limit the warming to ≤2°C relative to preindustrial conditions.
Even if anthropogenic carbon emissions to the atmosphere are reduced, CO2 levels will continue to increase for a century or more because the removal of CO2 from the atmosphere by natural processes of carbon sequestration (e.g., CO2 absorption by the surface ocean, CO2 fertilization of terrestrial vegetation) is slow (Archer et al., 2009). Consequently, temperature increases may continue for several centuries until equilibrium temperatures are reached, especially for higher CO2 stabilization targets. However, even if climate sensitivity is at the lower end of the possible range, global temperature increases of ≥2°C will be reached with CO2 stabilization levels of 450-550 parts per million by volume. Given that equilibrium temperature increases may be protracted, emissions could continue to increase into the middle of this century (Figure 2.3; Caldeira et al., 2003). However, if the climate sensitivity is 4.5°C or greater, then a significant and immediate reduction in CO2 emissions—to levels ultimately below those of the present day—is required to stay below a target warming of 2°C.
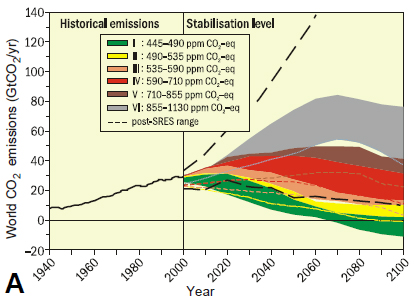
FIGURE 2.3 Global CO2 emissions and equilibrium global average temperature increases for a range of target CO2 stabilization levels. (A) Measured (1940 to 2000) and projected (colored shading; 10th to 90th percentile) global CO2 emissions for the range of IPCC emission scenarios and associated stabilization CO2 levels indicated by roman numerals (ppm CO2-eq). (B) Corresponding relationship between the different
that have not operated in recent icehouse climate regimes. One simple example is to consider a warm world with no sea ice at either pole—as CO2 increases, the sea ice albedo feedback is removed and therefore this negative feedback’s contribution to climate sensitivity is absent. In addition, it is important to determine the potential for nonlinear responses that are specific to a greenhouse or transitional world, and whether such responses would enhance climate sensitivity. For example, the destabilization of continental ice sheets resulting from warming of polar regions can potentially lead to a decrease in deep-water formation, thereby affecting global ocean circulation, stratification, and carbon cycling, leading to higher climate sensitivity than indicated by present estimates. In sufficiently warm climates, even water vapor has a nonlinear dependence on temperature, and this can introduce new and potentially rapid feedbacks, operating at a subdecadal scale, into the climate system. Destabilization of methane and its release
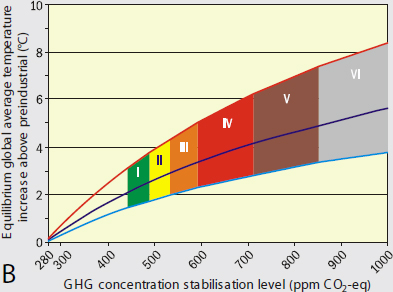
CO2 stabilization targets shown in (A) and equilibrium global average temperature increase above preindustrial levels. Colored regions for each stabilization target were calculated for a range of climate sensitivity (2–4.5°C) and “best estimate” climate sensitivity of 3°C (blue solid line in middle of shaded area).
SOURCE: IPCC (2007, Figure 5.1, page 66).
into the atmosphere in response to warming— through either the melting of terrestrial permafrost reservoirs or the dissolution of subseafloor clathrate deposits—would dramatically increase greenhouse gas contents in the atmosphere. Hence, an initial warming from greenhouse gases released by burning fossil fuels could end up releasing even more greenhouse gases from natural sources, exacerbating the original warming of the atmosphere.
TROPICAL AND POLAR CLIMATE STABILITY AND LATITUDINAL TEMPERATURE GRADIENTS IN A WARMER WORLD
With more than half of Earth’s surface lying within 30° latitude of the equator, the response of tropical climates to increased greenhouse gas forcing is critically important. Modern observational data (Ramanathan and
Collins, 1991) suggest that western tropical Pacific sea surface temperatures rarely exceed ~30-32°C, and this has led to speculation that the Earth’s tropics have a “thermostat” that limits maximum sea surface temperatures. Explanations about how such a thermostat might work have included the buildup of clouds that reflect heat back into space (Ramanathan and Collins, 1991), evaporative cooling (Hartmann and Michelsen, 1993; Pierrehumbert, 1995), winds, or an increase in transport of heat out of the tropics by ocean currents (Clement et al., 1996; Sun and Liu, 1996). Most of these studies have used present-day data to explain surface temperature regulation, although there are artifacts in these datasets that call into question the robustness of the observed trends (Clement et al., 2010). Paleoclimate reconstructions of tropical temperatures during past greenhouse times, however, document sea surface temperatures that were much warmer than modern tropical maxima—possibly as high as 42°C—and thus were probably not thermostatically “regulated” (Bice et al., 2006; Came et al., 2007; Pearson et al., 2007; Trotter et al., 2008; Kozdon et al., 2009).
The discovery of a giant Paleocene snake fossil in South America (Head et al., 2009; Huber, 2009; although see discussions by Makarieva et al., 2009; Sniderman, 2009), as well as other terrestrial paleotemperature indicators such as paleoflora leaf-margin analysis and stable isotope compositions of biogenic apatites and soil minerals (Fricke and Wing, 2004; Tabor and Montañez, 2005; Passey et al., 2010), further suggests anomalously high continental temperatures (~30-34°C) for the terrestrial tropics of past warmer worlds. Additionally, coupled climate model simulations with large radiative forcings and/or paleoclimate simulations for elevated greenhouse gases do not produce a thermostatic regulation of tropical temperatures (e.g., Boer et al., 2005; Poulsen et al., 2007b; Cherchi et al., 2008), suggesting that the tropical warming in response to greenhouse gas forcing is neither moderated nor local in its impacts (Xie et al., 2010). Such deep-time paleoclimate studies have documented that tropical surface temperatures during past greenhouse periods were not thermostatically regulated by the negative feedback processes that operate in the current icehouse climate system, further illustrating how knowledge of deep-time warm periods is fundamental to understanding Earth’s climate system.
There is also abundant evidence for anomalous polar warmth during past greenhouse periods (e.g., middle Cretaceous to Eocene, Pliocene; see Figure 2.4) associated with reduced equator-to-pole temperature gradients (e.g., Huber et al., 1995; Crowley and Zachos, 2000; Hay, 2010; Miller et al., 2010). To date, climate models have not been able to simulate this warmth without invoking greenhouse gas concentrations that are notably higher than proxy estimates (Figure 2.4; Bice et al., 2006). This has prompted modeling efforts to explain high-latitude warmth through vegetation (DeConto et al., 1999), clouds (Sloan and Pollard, 1998; Abbot and Tziperman, 2008;
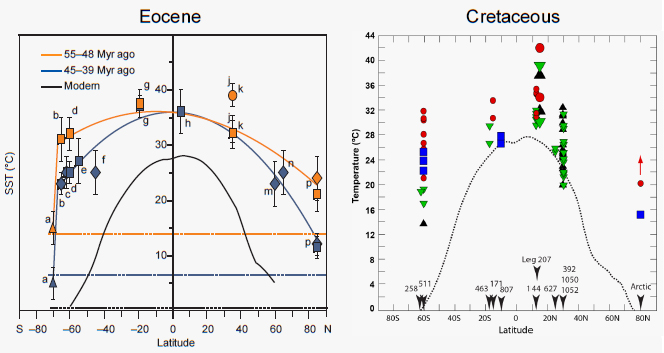
FIGURE 2.4 Zonal mean surface temperature (°C) as a function of latitude for the Eocene and Cretaceous. For the Eocene, the solid lines represent second-order polynomials excluding triangle data, with error bars representing the range of variation. Dashed lines represent deep-sea temperatures. For the Cretaceous, the dotted line is the modern observed zonal surface temperature, while the symbols indicate a compilation of empirical data for specific periods.
SOURCES: Eocene—modified from Bijl et al. (2009), reprinted by permission of Macmillan Publishers Ltd.; Cretaceous—courtesy K. Bice, personal communication, 2010.
Kump and Pollard, 2008), intensified heat transport by the oceans (Barron et al., 1995; Korty et al., 2008), and increased tropical cyclone activity (Sriver and Huber, 2007; Fedorov et al., 2010). The ability to successfully model a reduced latitudinal temperature gradient state, including anomalous polar warmth, presents a first-order check on the efficacy of climate models as the basis for predicting future greenhouse conditions.
Since significant changes in tropical and polar surface temperatures and pole-to-equator temperature gradients occurred in the past, and could occur in a future warmer world, it is imperative to understand the mechanisms and feedbacks that lead to such changes and their consequences for atmospheric and oceanic circulation (Hay, 2008). The fundamental mismatch between model outputs, modern observations, and paleoclimate proxy records discussed above, however, may indicate some very important deficiencies in scientific knowledge of climate and the construction of climate models (e.g., Huber, 2008). Resolution of this disparity, as well as an improved understanding of the anthropogenic signal in observational data, can likely be obtained by analysis of paleoclimate records from past warm worlds.
HYDROLOGICAL PROCESSES AND THE GLOBAL WATER CYCLE IN A WARMER WORLD
Earth’s hydrological processes—including precipitation, evaporation, and surface runoff—are susceptible to, and play a critical role in, both past and future climate change (Pierrehumbert, 2002). Large-scale atmospheric processes determine the general position of climate zones and the intensity of precipitation and storms; the intertropical convergence zone is a region of significant rainfall, while large regions of atmospheric subsidence lead to dry desert regions. Regional hydroclimates, such as the Southwest Indian and the East Asian summer monsoons, which affect nearly half of Earth’s human population, are highly sensitive to distal climate changes and to mean warming (Sinha et al., 2005; Wang et al., 2005) via teleconnections (e.g., changes in high-latitude surface temperatures or Arctic sea ice extent impact lower-latitude climate through atmospheric processes). Overall, the vapor-holding capacity of the atmosphere increases substantially with increased global mean temperatures if there is no change in the relative humidity. Consequently, climate models for global warming predict an intensified hydrological cycle and, on a global scale, enhanced precipitation (IPCC, 2007).
Observations over the past few decades indicate that precipitation has increased faster (~7 percent per degree of surface warming; Wentz et al., 2007) than that predicted by models (1-3 percent per degree of surface warming; Zhang et al., 2007). Although the reasons for this substantial
discrepancy are not understood, one possibility is that the observational data trends are too short to detect long-period changes in evaporation (Wentz et al., 2007). Moreover, analyses of future global warming model simulations (IPCC, 2007) predict that the atmosphere will hold more water as the latitudinal extent of the Hadley cell expands (Held and Soden, 2006; Lu et al., 2007).1 Warming will also enhance precipitation in the tropics and midlatitudes and will expand subtropical desert regions.
Small changes in tropical sea surface temperatures can impart large changes in global climate patterns, affecting wind strength, relative rates of precipitation versus evaporation, and surface temperatures (Cane, 1998). With evidence from deep-time records for warmer tropical oceans during past periods of global warming, the sensitivity of the climate system to such change is of critical importance for projecting how regional and global climate patterns may change in the future. For example, the Pacific ocean-atmosphere system and its coupled instability, El Niño-Southern Oscillation (ENSO), are maintained by dynamic feedbacks that are sensitive to external forcings (Huber and Caballero, 2003; Cane, 2005). Perturbation of this regional system with continued warming could modulate global climate change, including a shift toward a permanent rather than intermittent El Niño-like state. Climate simulations of future transient global warming, however, offer inconsistent and uncertain projections regarding ENSO behavior (Cane, 2005; Collins, 2005), although predictions of the Intergovernmental Panel on Climate Change (IPCC, 2007) include a change in tropical climate to an El Niño-dominated state. Existing observational data of global warming over the last century are too short term to resolve the relative importance of ocean versus atmospheric feedbacks (Vecchi et al., 2008). In contrast, proxy time series of sufficient continuity, together with complementary climate models of past sustained warm periods illustrate that small, long-term changes in Pacific sea surface temperatures can have a substantial effect on ENSO phenomena, as well as planetary albedo, regional rainfall, and increased atmospheric levels of water vapor—a powerful greenhouse gas (see Box 2.3). If the IPCC (2007) predictions of a long-term increase in El Niño frequency and intensity with continued warming are correct, then the climate impacts could be far-reaching and include amplification of global mean temperatures, in particular in the extratropical regions, as well as widespread drought in some regions coincident with catastrophic flooding in others. The geological records from warm periods, such as the Pliocene, will be key elements for testing these predictions.
Deep-time paleoclimate studies provide a critical perspective, docu-
________________________
1 The Hadley cell is the circulation cell dominating the tropical atmosphere, with rising motion near the equator, poleward flow 10-15 km above the surface, descending motion in the subtropics, and equatorward flow near the surface.
BOX 2.3 Persistent El Niño-like Conditions of the Early Pliocene Warming
The early Pliocene (4.5 to 3 Ma) was characterized by atmospheric pCO2 levels that were elevated in comparison to preindustrial times, but similar to those of the present day (Pagani et al., 2010; Seki et al., 2010). Globally averaged temperatures were ~3°C higher (Figure 2.5), the northern polar region was ice-free, and a mean state resembling El Niño-like conditions persisted in the Pacific (Wara et al., 2005; Fedorov et al., 2006; Ravelo et al., 2006). This permanent El Niño-like state contributed significantly to overall warming and major changes in the hydrological cycle, including effects in distal regions such as eastern equatorial Africa where perturbations in rainfall patterns may have influenced the evolution of hominins and other vertebrates (deMenocal, 1995; NRC, 2010). Recent deep-time modeling studies have shown that such El Niño-like mean conditions in the Pliocene had far-reaching effects, influencing climate well outside of the tropics (e.g., Shukla et al., 2009).
The persistent El Niño conditions led to weaker Walker circulation, the east-west directed zonal atmospheric circulation. As temperatures in the eastern equatorial region cooled gradually after ~2 Ma, the equatorial sea surface temperature gradient increased dramatically (post-1.8 Ma on Figure 2.6), ultimately establishing strong Walker circulation and the present-day ENSO
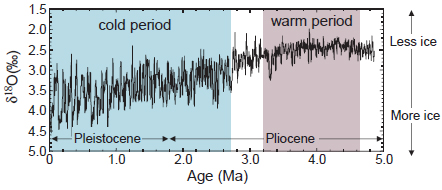
FIGURE 2.5 Benthic foraminifer δ18O record of high-latitude climate (primarily ice volume) from Ocean Drilling Program (ODP) cores, showing the relative warmth during the early Pliocene, followed by the transition into the cooler later Pliocene and Pleistocene. SOURCE: Ravelo and Wara (2004).
state. Ocean-atmosphere coupled model simulations for the Pliocene have not successfully reproduced the observed persistent El Niño mean state, with close to modern temperatures in the west and warmer than modern in the east. Furthermore, climate simulations and paleoclimate data for the Eocene greenhouse period indicate that despite much higher global temperatures, El Niño variability was comparable to that of the present day (Huber and Caballero, 2003).
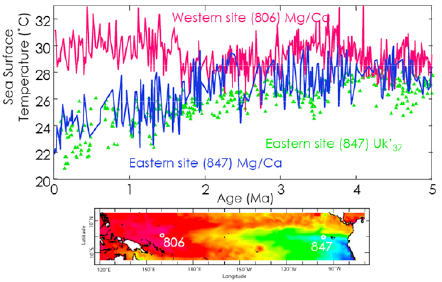
FIGURE 2.6 Changes in equatorial sea surface temperature gradients over time. The top panel shows time series of paleo-sea surface temperatures reconstructed for the western equatorial Pacific (ODP Site 806) using foraminiferal Mg/Ca ratio measurements of Globigerinoides sacculifer, and for the eastern equatorial Pacific (ODP Site 847) using Mg/Ca ratios of G. sacculifer as well as the biomarker Uk’37 index. Note the reduced sea surface gradient from 5 to 3 Ma, a gradual diversion of the records after that time, and a relatively strong gradient established after about 1.7 Ma. For comparison, the lower panel shows the present-day equatorial sea surface temperature gradient and the location of the eastern (Site 847) and western (Site 806) deep-sea coring sites.
SOURCES: Compiled from Wara et al. (2005) and Dekens et al. (2008).
menting shifts in the position of climate zones and precipitation during past warm periods characterized by elevated atmospheric CO2. For example, paleosol mineralogy and geochemistry, as well as stable isotope compositions (δ18O and δD) of soil-formed minerals, fossil plants, and biogenic apatites, have been used to document substantial spatial and temporal changes in paleoprecipitation for periods spanning the past 400 million years. These proxies have documented, in particular for past warm periods, humidity and precipitation patterns substantially different from current patterns (e.g., Fricke et al., 1998; Stiles et al., 2001; Jahren and Sternberg, 2002; Sheldon et al., 2002; Tabor et al., 2002; Driese et al., 2005). Lacustrine sediments have been used to document changes in regional precipitation by using geochemical and mineralogical records to identify open flow and evaporative phases (e.g., Olsen, 1986). Quantitative assessment of relative humidity has been successfully carried out using the stable isotope compositions of Eocene cellulose (e.g., Jahren and Sternberg, 2003; Jahren et al., 2009) and leaf wax n-alkanes, which have a higher potential for preservation and show promise as a paleo-aridity proxy that can be used back to the Devonian (Liu and Huang, 2005; Pagani et al., 2006; Smith and Freeman, 2006).
Mass balance models of soil-formed carbonate (calcite and sphaerosiderite) using oxygen isotopes document increased precipitation rates in response to intensified hydrological cycling during the middle Cretaceous and Eocene greenhouse periods (e.g., White et al., 2001; Ufnar et al., 2002, 2004; Bowen et al., 2004; Jahren et al., 2009). For example, increased atmospheric water vapor, together with increased rainout suggested by stable isotope proxy records (Ludvigson et al., 1998), would have had the effect of enhancing the transfer of latent heat from the tropics to the high latitudes, thereby sustaining polar warmth and reinforcing greenhouse conditions (Hay and DeConto, 1999). Recent modeling studies document the additional role of high-latitude cloud feedbacks—with intensified hydrological cycling—in setting up anomalous polar warmth and maintaining depressed latitudinal temperature gradients (Abbot and Emanuel, 2007; Abbot and Tziperman 2008). Accordingly, deep-time data-model comparisons of past warm and transitional periods provide the ultimate test of science’s ability to forecast the geographic patterns of hydrological response to CO2-forced global warming and associated precipitation, evaporation, and latent heat fluxes.
SEA LEVEL AND ICE SHEET FLUCTUATIONS IN A WARMER WORLD
Rising sea level is one of the most highly visible results of a warming world and a primary concern for society (Figure 2.7). Sea level changes
are dominated by changes in ocean water volume governed by the growth and decay of continental ice sheets, although other factors can contribute to smaller-magnitude fluctuations (e.g., thermal expansion of the ocean, variations in groundwater and lake storage; Miller et al., 2005). Sea level is projected to rise between ~0.4 and 1 m by the end of this century, with long-term projections of up to 7 m if the Greenland or West Antarctic ice sheets were to collapse (Alley et al., 2005; IPCC, 2007). Melting mountain glaciers could contribute another 0.5 m of sea level rise.
The present rate of sea level rise (~3 mm per year) can be expected to continue to accelerate because of positive feedbacks that act to significantly increase the warming response times and ice melting rates (Joughin et al., 2008; van de Wal et al., 2008). Currently, there is no clear consensus on the potential rate and magnitude of future ice sheet melting and sea level rise because of uncertainties in the theoretical understanding of ice sheet dynamics (Alley et al., 2005), and because strong feedbacks in response to warming (e.g., albedo, vegetation, and carbon cycling)—illustrated by the past few glacial-interglacial cycles—are not evident from historical records (Thompson and Goldstein, 2005; Carlson et al., 2008; Rohling et al., 2009). During the last interglacial (~110,000 years ago [ka])—an interval slightly warmer than today but with CO2 at preindustrial levels—sea level was 4 to 6 m higher than at present (Rohling et al., 2008), indicating that there was deglaciation of most of Greenland (Cuffey and Marshall, 2000) and probably also a contribution from Antarctica. Notably, rates of sea level change during glacial terminations and interglacial periods in the past few 100,000 years were substantially faster, between >1 and ~5 cm per year (Carlson et al., 2008; Rohling et al., 2009) than recent rates of rise (~3 mm per year).
Moreover, the deep-time sedimentary record contains evidence of past sea level changes at rates an order of magnitude or more higher than the current observed rate of rise (Miller et al., 2005). Because reconstructions of paleoeustasy are typically based on passive margin stratigraphic records or indirect geochemical records such as the oxygen isotope composition of marine sediments and microfauna, such estimates come with uncertainties. However, because positive feedbacks to warming are explicitly not considered in current projections (e.g., IPCC, 2007) and sea level can change at rates and magnitudes greater than typically considered, there is an obvious need to better understand how passive margin successions record past glacioeustasic sea level changes and their relationship to variations in atmospheric pCO2 and surface temperatures.
Despite such uncertainty, the geological record is the only repository that can place constraints on the sensitivity of ice sheets and equilibrium sea level to rapid (millennia or less) climate change during past warmings that led to collapse of ice sheets of the scale of, or larger than, the Greenland or Antarctic ice sheets. During the Middle Pliocene warming (3.5-3.0 Ma),
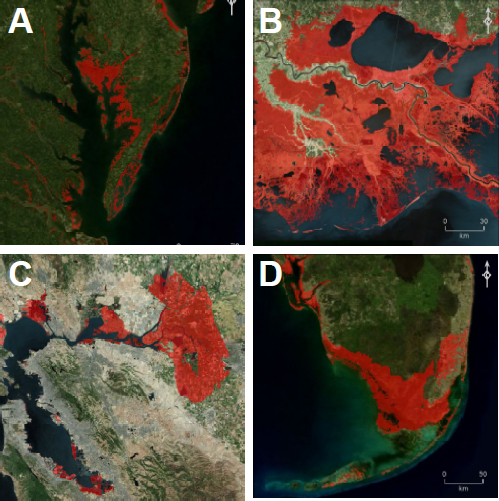
FIGURE 2.7 Effects of a 1-m rise in sea level (inundated areas with connectivity to the sea shown in red; see Weiss et al., 2011)—in the absence of human intercession—for four areas of the U.S. coastline: (A) Chesapeake Bay area; (B) New Orleans area; (C) San Francisco Bay area, and (D) South Florida. Because of the time needed for atmospheric CO2 and surface warming to reach equilibrium, this amount of sea level rise might be anticipated even if anthropogenic sources of CO2 were to cease today. In addition to local effects, inundation of the San Francisco Bay area and south Florida would have substantial impacts on water resources in both California and Florida. SOURCE: Images courtesy Jeremy Weiss and Jonathan Overpeck, University of Arizona.
when CO2 levels were slightly higher than at present (330 to 415 parts per million by volume; Pagani et al., 2010) and comparable to projections for the coming decade, sea level is estimated to have been 15-25 ± 5 m, and possibly up to 36 m, above the present level (Wardlaw and Quinn, 1991; Shackleton et al., 1995; Naish et al., 2009). It is clear that equilibrium sea level in response to current warming may be substantially higher than projected by IPCC models given that they do not include dynamic processes that were operative in past warm periods (Rohling et al., 2009). Therefore, even with stabilization of atmospheric CO2 at current levels, it is likely that sea level will continue to rise over the next few centuries at much faster rates—up to three to four times faster than at present—than has hitherto been considered by long-term projections.
Evidence for continental ice sheets during past long-lived greenhouse periods defines a “climate-glaciation paradox” which in turn provides an opportunity to uniquely address two issues that cannot be tested in studies of the more recent glacial-interglacial fluctuations of the Cenozoic. First, the geological records of glacial events during past greenhouse warm periods illustrate ice sheet stability and long-term equilibrium sea level change during times of substantially elevated atmospheric pCO2, major climate perturbations, and in many cases, complete deglaciation. For example, geological records offer sedimentological (Alley and Frakes, 2003), stratigraphic (Gale et al., 2002, 2008; Miller et al., 2003, 2004; Plint and Kreitner, 2007), and geochemical (Stoll and Schrag, 1996, 2000; Bornemann et al., 2008) evidence—albeit indirect—for moderate to high-magnitude (<25 m) sea level fluctuations and, if ice-driven, the possible existence of continental ice during the protracted greenhouse periods of the Cretaceous and early Eocene. The development of ephemeral (<200,000 years) and small to moderate ice sheets in Antarctica (Figure 2.8; Miller et al., 2005; Miller, 2009) documents the climate mechanisms and feedbacks that permitted the repeated development of glaciations during otherwise hothouse climates (Bornemann et al., 2008). We can also use the geological record to investigate the dynamics of ice-driven sea level change and deglaciation from such records of ice during times of anomalously warm tropical oceans (up to 35°C) and forested poles.
Major variations in the expansion and contraction of ice sheets throughout the Late Paleozoic Ice Age (Fielding et al., 2008; Rygel et al., 2008; Bishop et al., 2009) may have involved expansion of continental ice into the tropics (Soreghan et al., 2008), followed by protracted periods of minimal glaciation that were likely CO2 forced (DiMichele et al., 2009). Data-model comparisons for this ice age (Poulsen et al., 2007a; Peyser and Poulsen, 2008; Horton et al., 2010) indicate the influence of high-latitude vegetation-climate feedbacks and the need for pCO2 changes of much greater magnitude than those associated with more recent interglacial-
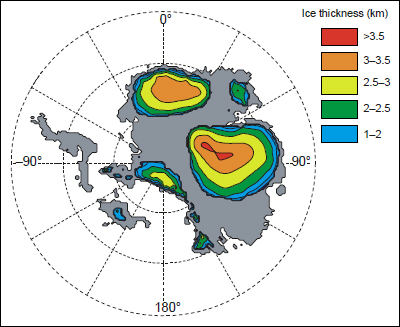
FIGURE 2.8 Modeled distribution of greenhouse ice sheets on Antarctica. Relatively small (~25 m) fluctuations in sea level have been associated with Antarctic ice (Galeotti et al., 2009), which would likely have built up in areas of high topography or near coastal moisture. SOURCE: DeConto and Pollard (2003), reprinted by permission of Macmillan Publishers Ltd.
glacial cycles, and highlight the large-scale reorganization of atmospheric circulation and regional precipitation patterns between periods of extensive glaciation and the warmer “interglacial” periods with greatly diminished continental ice. This late Paleozoic icehouse, which is calibrated to the orbital timescale (Strasser et al., 2006; Davydov et al., 2010), terminated with the full collapse of expansive southern hemisphere ice sheets, thereby serving as the only “vegetated” analogue for an icehouse-to-greenhouse transition (Montañez et al., 2007).
The second issue that can be assessed uniquely in deep-time records is an improved understanding of the origins of short-term (10,000 years to <2 million years) sea level fluctuations. Some of these sea level changes could reflect the development of small ice sheets, where direct evidence for ice from glacial sediments or oxygen isotope excursions is often lacking or ambiguous (Miller et al., 2005; Haq and Schutter, 2008). Rapid sea level changes during past warm periods also raise the question of whether ephemeral ice sheets were common to all past warm periods.
Short glacial advances are known to be associated with rare alignments of the orbital obliquity and eccentricity cycles (Zachos et al., 2001a; Pälike et al., 2006a,b), suggesting that orbital configuration may predispose the climate system to glaciation and produce short sea level falls. It is also possible that there are nonglacioeustatic—and perhaps nonclimatic—causal mechanisms that could influence ice sheet dynamics and sea level response with continued warming.
EXPANSION OF OCEANIC HYPOXIA IN A WARMER WORLD
One forecast consequence of global warming is the widespread expansion of oceanic hypoxia. Projections anticipate a decline in ocean O2 by as much as 30 percent in the next several centuries, with the potential to expand the area of hypoxic seas from the current ~9.1 percent to as much as 61 percent of the total ocean (Shaffer et al., 2009; Keeling et al., 2010). Excess nutrient loading from river runoff, in combination with warming waters and increasing pCO2, presently results in annual or permanent expanses of hypoxia or anoxia on continental shelves and estuaries—well-publicized examples are Chesapeake Bay (Adelson et al., 2001) and the northern Gulf of Mexico (Malakoff, 1998). Globally, more than 400 “oceanic dead zones”—so named because of their inability to support marine animal life (Diaz and Rosenberg, 2008; Rabalais et al., 2009)—have been identified, most of which have appeared within the last 50 years and now cover a cumulative area of ~245,000 km2 (Malakoff, 1998; Diaz and Rosenberg, 2008). Models suggest that hypoxic and anoxic zones will continue to increase in response to warming and increasing pCO2, making this one of the important risks associated with current warming (Stramma et al., 2008; Shaffer et al., 2009). The extent and rate at which they will increase in the coming century, however, are unknown.
Periods of anoxia in the ancient record provide models for understanding the biological and environmental consequences of widespread hypoxia (Gooday et al., 2009). In each past case, the combined effects of increased surface ocean temperatures and reduced vigor of overturning circulation—effects anticipated with the current global warming—led to dramatically lower levels of dissolved oxygen throughout the water column (Broecker, 1999). In the geological past, episodes of widespread marine hypoxia have been associated with biotic crises of aerobic marine organisms (Sepkoski, 1996), such as the Middle-Late Devonian crises, the Permian-Triassic extinction—the largest mass extinction of the past half billion years, and repeated oceanic anoxic events throughout the mid to late Cretaceous. These ancient examples provide an invaluable archive of triggers, thresholds, rates of onset and recovery, and the spatial distribution of oxygen deficiency in the oceans.
Inferred widespread oxygen depletion in latest Permian to earliest Triassic oceans (Wignall, 2007) provides an example of oceanic hypoxia that developed in multiple ocean basins. Oxygen deficiency in these paleo-oceans developed to a degree sufficient for free hydrogen sulfide to accumulate in the upper mixed layer of the surface ocean (Kump et al., 2005; Meyer et al., 2008). Although the intensity of oxygen depletion varied regionally, evidence for hydrogen sulfide, a compound that is toxic to most marine organisms at even relatively low concentrations (~100 μmol), has been found in all contemporary Permo-Triassic oceans (the Tethys and Panthalassa; Isozaki, 1997; Grice et al., 2005; Algeo et al., 2008). Although the exact cause of this nearly global anoxic episode remains under debate, there is little doubt that greenhouse gas-induced global warming played an important role (Box 2.4; Korte et al., 2005; Kearsey et al., 2008). Warming of deep-water source regions (Hotinski et al., 2001) potentially reduced the vigor of oceanic circulation (Isozaki, 1997; Kiehl and Shields, 2005) and elevated the nutrient flux to the oceans in response to increasing mean temperatures. In turn, this may have provided the trigger for an oceanic anoxic event of this enormity (Winguth and Maier-Reimer, 2005; Meyer et al., 2008; Algeo et al., 2010).
Mid-to-late Mesozoic marine successions document repeated expansions of anoxia, with the majority occurring during protracted periods of “supergreenhouse” conditions (Jenkyns, 1988; Sageman et al., 2006; Hesselbo et al., 2007). These events were associated with the turnover of oceanic biota, including major evolutionary bursts in planktonic foraminifera and the extinction of several nannoplankton groups (Leckie et al., 2002). These geological-scale “anoxic events” (Box 2.5)—with their attendant changes in surface temperatures and continental weathering (i.e., phosphorus fluxes to the ocean)—have been linked to increased levels of atmospheric greenhouse gases brought on relatively slowly through volcanism or by more rapid release following magmatic intrusion into organic-rich sediments (Tejada et al., 2002; Svensen et al., 2004; Turgeon and Creaser, 2008; Barclay et al., 2010). The increased weathering led to substantially increased nutrient fluxes to the oceans (Hochuli et al., 1999; Weissert and Erba, 2004; Tsandev and Slomp, 2009; Adams et al., 2010), analogous to the present-day flux of agricultural fertilizers to the oceans (Rabalais et al., 2009).
The dynamics of ancient anoxic intervals are particularly well studied in the Mediterranean basin. There, the hypoxic sediment record began about 14 million years ago (Mourik et al., 2010) and became more pronounced in the Plio-Pleistocene (Figure 2.11), particularly during the past 2 million years (Emeis and Weissert, 2009). Hypoxia is associated with organic-rich sediments (up to 30 weight percent organic carbon) as well as evidence for surface ocean warming, freshwater inputs that shut down basin overturning, and the regeneration of nutrients into the surface
BOX 2.4 A Literal Smoking Gun for the End-Permian Extinction
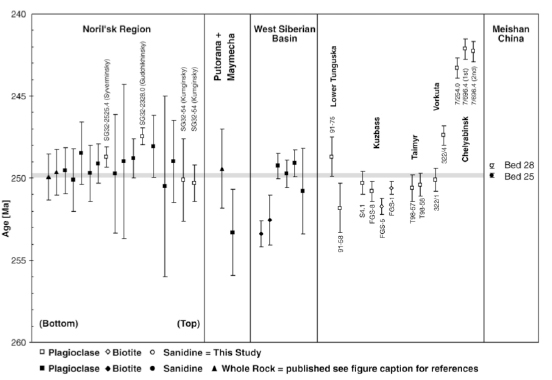
In the minds of most scientists, the case of what killed the dinosaurs is closed. The culprit was an impact by a 10-km-wide asteroid, with the consequent heat and chemical modifications of the atmosphere causing environmental disturbance that affected both land and marine flora and fauna and in some cases resulted in extinctions. In contrast, what caused the largest of all mass extinctions—at the end of the Permian at 252 Ma—is a “cold case” that has only recently received new information that might ultimately lead to the “killer.” A key piece of evidence is the remarkable correspondence in ages (Figure 2.9) between this event and vast eruptions of the Siberian Traps volcanoes, one of the largest volcanic eruptions in Earth history (Reichow et al., 2009). Volatiles released from the magma may themselves have created a sizable environmental disturbance, but the key to the deadliness of the Siberian Traps eruptions seems to be magma penetration through thick sequences of limestone, evaporite, and coal (Svensen et al., 2009), baking these materials and releasing immense quantities of sulfur dioxide and gaseous halides that cooled the climate and disrupted the ozone layer on short timescales (Beerling et al., 2007), yet warmed it on longer (multimillennial) timescales by the release of large amounts of CO2 that boosted atmospheric CO2 levels.
The abrupt and prolonged global warming would have been stressful to biota by itself, but for marine organisms the resulting reduction in oxygen solubility and reduced oxygen delivery to the deep ocean led to widespread seafloor anoxia and permitted the accumulation of toxic substances, including hydrogen sulfide, in the deep ocean (Meyer et al., 2008). Upwelling of hydrogen sulfide into surface waters poisoned oxygen-dependent organisms and encouraged sulfur-metabolizing organisms to thrive. Environmental recovery apparently was quite slow—carbonate rocks with anomalous marine cements and microbial reefs (Woods et al., 2007) that are similar to those of the Proterozoic (Grotzinger and Knoll, 1995) characterize the first few million years of the Triassic, as do depauperate faunas of small bivalves. Full recovery did not occur for several million years, with the composition of subsequent Mesozoic communities reflecting the complex dynamics of recovery and diversification and large perturbations in global biogeochemical cycling (Payne et al., 2004). The nature of the biotic recovery, however, remains poorly understood and will require interdisciplinary studies of physicochemical and biological processes integrated with quantitative models of diversification dynamics and global climate and biogeochemistry.
BOX 2.5 Triggering of Oceanic Anoxic Events
Widespread, recurrent intervals of oxygen-deficient conditions in the water column (referred to as oceanic anoxic events, or OAEs) were a common phenomenon during the Mesozoic (Arthur et al., 1990; Hochuli et al., 1999; Hesselbo et al., 2007). Positive δ13C isotope excursions persisting over tens to hundreds of thousands of years are characteristic of most of these organic-rich OAEs, interpreted as resulting from increased burial of 12C-enriched sediments (Scholle and Arthur, 1980; Weissert, 1989; Menegatti et al., 1998). Some of these anoxic events (notably OAE 1b and 1d) appear to be ancient analogues of the well-studied Mediterranean sapropels that were produced by the hydrological suppression of ocean overturning in a marginal silled basin (Erbacher et al., 2001; Wilson and Norris, 2001). Other events (e.g., OAE 1a and 2) were global events whose origin is not clearly tied to tectonic preconditions. Still other brief periods of widespread anoxia may have an origin in greenhouse gas-driven warming. Indeed, the more recent discovery of large-magnitude but much shorter-lived (103 to 104 years) negative isotope excursions at the onset of several of these Mesozoic OAEs is compelling evidence for greenhouse gas forcing of these abrupt climate events, possibly by methane release from seafloor gas hydrates (Menegatti et al., 1998; Hesselbo et al., 2000; Jahren et al., 2001), methane release by magmatic intrusion into organic-rich sediments (e.g., coals; Svensen et al., 2004; McElwain et al., 2005), or other greenhouse gas sources such as volcanism (Svensen et al., 2007; Hermoso et al., 2009).
Nested within the longer-term positive carbon isotope excursion, some Cretaceous black shales show a striking cyclicity over submeter thicknesses, which is interpreted to record oceanic hypoxia responding to minor climate effects caused by orbitally driven changes in atmospheric circulation. For example, mid-Cretaceous black shales from paleotropical West Africa at ODP Site 959 provide evidence in their total organic carbon content (2-12 percent), clay mineralogy, biomarkers indicative of euxinia, and elemental ratios for coupled, centennial timescale changes in atmospheric circulation and marine circulation coincident with strengthening of the African monsoon (Wagner et al., 2004; Beckmann et al., 2005) (Figure 2.10). The rapid response and strong variability recorded by these Cretaceous OAE intervals demonstrates the sensitivity of oceanic conditions to perturbation of atmospheric circulation and continental weathering brought on by global warming.
Can the deep-time record tell us more about an inherent instability of climate over short timescales (decadal to centennial) if it is analyzed at appropriate resolution? These examples would suggest so and emphasize the enormous potential for unlocking the lessons about warm-Earth climate states that are recorded solely in the deep-time geological archive.
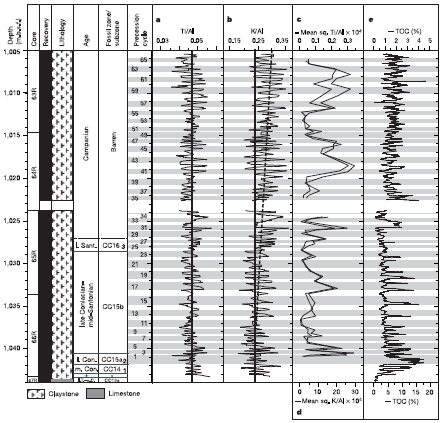
FIGURE 2.10 High-resolution plots showing multiple precessional cycles during Cretaceous OAE 3 (~85 Ma) from Ocean Drilling Program Site 959 in the eastern equatorial Atlantic. There is abrupt and high-frequency variation in total organic carbon, with higher values indicating anoxia. These cycles have been interpreted as resulting from changes in the Cretaceous intertropical convergence zone that caused variations in river discharge from tropical western Africa. SOURCE: Beckmann et al. (2005).
waters that trigger massive blooms of bacteria and diatoms (Bianchi et al., 2006; Capozzi et al., 2006; Rohling et al., 2006; Gallego-Torres et al., 2007; Emeis and Weissert, 2009). The Mediterranean record appears to have parallels with some Cretaceous events, particularly those developed in the narrow proto-North Atlantic (Erbacher et al., 2001).
BIOTIC RESPONSE TO A WARMER WORLD
Although Earth’s biota contributes to, and is affected by, a variety of important climatic feedbacks that are incompletely understood in terms of process and magnitude, there is little doubt within the scientific community that anthropogenic climate change is having a large and sustained impact on Earth’s ecosystems (Parmesan and Yohe, 2003; Rosenzweig et al., 2008). Changes in the distribution and ecological composition of vegetative land cover (e.g., replacement of evergreen forests by deciduous forests) can lead to changes in mean global and regional albedos, altering both the total amount of incoming solar radiation absorbed at the Earth’s surface and its spatial distribution (Baldocchi et al., 2000; Marland et al., 2003). Ecosystem changes have already accompanied the rapid loss of snowfields and sea ice, with consequent decrease in surface albedo in high-latitude regions, as a result of the global warming of the past century (ACIA, 2004; Chapin et al., 2005). Changes in terrestrial vegetation also lead to changes in evapotranspiration and soil moisture content and, in turn, cloud cover and water vapor mass in the atmosphere (Hennessy et al., 1997; Alpert et al., 2006). In the marine environment, changes in upwelling and nutrient availability have the potential to influence the rate of dimethyl sulfide production by phytoplankton, thereby altering the concentration of cloud condensation nuclei and changing the albedo and other optical properties of stratus clouds over oceans (Boucher and Lohmann, 1995; Schult et al., 1997; Kump and Pollard, 2008). Vegetation-climate feedbacks, however, involve complex, nonlinear interactions with competing effects, resulting in an uncertain net response to climatic forcing. Nevertheless, general circulation models incorporating vegetation-climate feedbacks generally yield higher climate sensitivities (up to 5.5°C per CO2 doubling; Cox et al., 2000) relative to models lacking such feedbacks, reflecting the direct influence that vegetation has on radiation fluxes, water cycling, and latent heat transport on Earth’s surface.
The Pleistocene paleoclimate record provides well-documented examples of the impact on, and influence of, vegetation on climate shifts associated with the gentle glacial-interglacial oscillations in atmospheric CO2 over the past few hundred thousand years (Peteet and Mann, 1994; Kneller and Peteet, 1999; Gillespie et al., 2004). The relative importance of such feedbacks, however, is likely to change as atmospheric CO2 concentrations
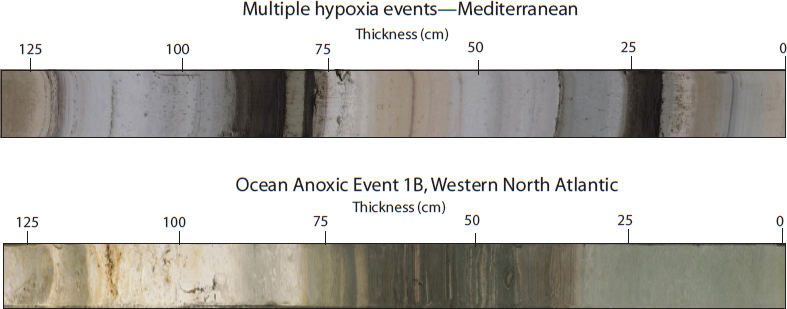
FIGURE 2.11 Examples of ancient hypoxic episodes in a Plio-Pleistocene drill core from the Mediterranean. Black bands in the upper photo (from Ocean Drilling Program Site 964) are “sapropels”—layers rich in organic carbon—formed when the surface waters of the Mediterranean abruptly warmed, became fresher, and ceased to circulate as they do today. Warming and high nutrient supply led to blooms of algae and bacteria, preserved as a layer of organic carbon on the seafloor. Lower photo shows a core from the western North Atlantic (from ODP Site 1049) in which a similar layer rich in organic carbon was deposited during an event 112 million years ago that was broadly analogous to the Mediterranean hypoxic events.
SOURCE: Images courtesy Integrated Ocean Drilling Program Science Services.
continue to increase well above the levels of the Pleistocene interglacials and as the geographic distributions of climate zones change. For example, higher CO2 levels are expected to saturate the CO2 fertilization effect, resulting in a shift of the terrestrial biosphere from a net sink to a net source of carbon sometime within this century (Cao and Woodward, 1998; Cox et al., 2000). Furthermore, as the surface oceans warm and become less alkaline with increasing atmospheric CO2, carbonate-bearing animals will be strongly impacted (e.g., see Box 2.6), further perturbing biota-climate feedbacks compared with those reconstructed from the recent past.
The deep-time geological record, in particular the record of warm periods of higher atmospheric pCO2 and including the transitions into and out of these periods, has the potential to yield unique insights into the nature and rate of biotic response to climate perturbation as well as into the biota-climate feedbacks accompanying global warming. For example, the mid-Paleozoic “greening” of continents, marked by the evolution and spread of vascular land plants (Gensel and Andrews, 1987; Beerbower et al., 1992), records a large-scale natural experiment in the climatic effects of vegetation—reflecting the contrast between a largely unvegetated pre-Devonian world compared with one that was heavily vegetated—that has been linked to major changes in atmospheric CO2 and a vastly different hydrological regime (Algeo et al., 1995, 2001). Another example of the potential of the deep-time record is provided by the repeated major restructuring and turnover within terrestrial floral communities that occurred in step with recurrent shifts in surface temperature, precipitation levels, seasonality, and soil moisture during the demise of the Late Paleozoic Ice Age at ~295-260 Ma, the vegetated Earth’s only analogue of a CO2-forced icehouse-to-greenhouse transition (see Box 2.7).
More recently, the gradual but extreme warming (perhaps up to >30 to 42°C in the tropics) of the early Eocene greenhouse (Box 2.8) may have triggered a major tropical vegetation die-off, with substantial changes in evapotranspiration fluxes, precipitation, albedo, surface temperature, and carbon feedbacks (Huber, 2008). During the transient global warming and short-term aridity of the Paleocene-Eocene Thermal Maximum (PETM) major restructuring among terrestrial biomes resulted in expansion in the latitudinal range of subtropical and tropical rainforests (Wing et al., 2005). Oxidation of the terrestrial biosphere at the Paleocene-Eocene boundary may have released several gigatons of carbon into the atmosphere, substantially amplifying the existing greenhouse warming and its climate effects (Kurtz et al., 2003).
The potential vulnerability of modern biotic communities to catastrophic disruption (Jackson et al., 2001; Chase and Leibold, 2003) is an issue designated as one of the “grand challenges” in the environmental sciences (NRC, 2001). Globally, current extinction rates are estimated to
BOX 2.6 Impact of Past and Future Climate Change on Coral Reefs
Healthy coral reef ecosystems develop under a relatively narrow range of ocean temperatures and chemistry (Kleypas et al., 1999) and are therefore sensitive indicators of environmental conditions. Global change models predict that reef systems, with their abundant biodiversity, will be exposed to higher ocean temperatures and increasingly more acidic waters in the next century (Hoegh-Guldberg et al., 2007; see Figure 2.12). Indeed, research suggests that global climate change has already caused steep declines in coral growth on reef systems around the world (Hoegh-Guldberg, 1999). Culturing experiments with corals in acidified waters show that skeleton growth drops as acidity increases and, in extreme cases, coral colonies can lose their skeletons completely and grow as soft-bodied anemone-like animals (Fine and Tchenov, 2007). In fact, ocean acidification may vie with global warming as the most severe threat to marine ecosystems (Hoegh-Guldberg et al., 2007; De’ath et al., 2009). Reef systems, however, are intrinsically complex structurally and ecologically, making it difficult to evaluate the likely impact of future global change on modern reefs based solely on studies of present-day systems. The geologic record of fossil reef evolution provides opportunities to study the response of reef ecosystems to past episodes of increased global temperatures and ocean acidification.
The coral reef crisis occurring in modern oceans may be the sixth such major reef crisis recorded in the past 500 million years of marine metazoan evolution. Four of the previous five metazoan reef crises appear to have been driven by greenhouse gas-forced global warming that was probably associated with ocean acidification (Veron, 2008; Kiessling and Simpson, 2010). At least three of these reef crises were associated with massive release of greenhouse gases into the oceans and atmosphere, leading to pCO2 increases analogous to—or perhaps even greater than—those anticipated for Earth’s future. For example, major reef crises during the Early Jurassic and during the Cretaceous were associated with massive releases of volcanic CO2 to the atmosphere that led to global warming, oceanic anoxia, and quite likely ocean acidification (Knoll et al., 1996; Svensen et al., 2007; Hermoso et al., 2009). One of the major reef crises occurred at the same time as the best-documented case of greenhouse gas-induced ocean acidification in the geological record, the Paleocene-Eocene Thermal Maximum (PETM) of 56 Ma (described in more detail in the next chapter). Although coral-algal reefs began to decline throughout the Tethyan region in the early Eocene due to the development of very warm (~30-35°C) tropical sea surface temperatures (Scheibner and Speijer, 2008) (Figure 2.13), PETM extinction rates indicate that ocean acidification must have been a major
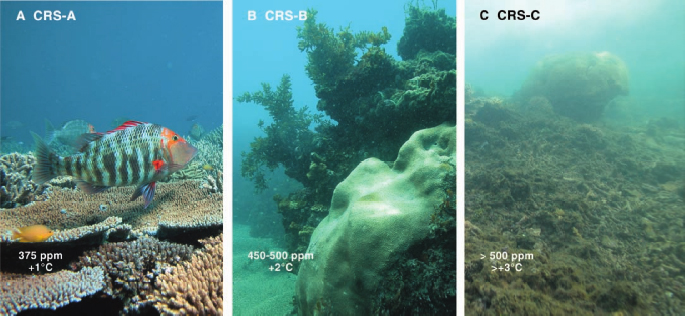
FIGURE 2.12 Extant examples of reefs from the Great Barrier Reef that are used as analogues for the ecological structures anticipated for atmospheric CO2 values of (A) 380 ppmv, (B) 450-500 ppmv, and (C) >500 ppmv (Hoegh-Guldberg et al., 2007). Scenario C corresponds to a +2°C increase in sea temperature. The atmospheric CO2 and temperature increases shown are those for the scenarios and do not refer to the particular locations photographed.
SOURCE: Photographs by and with permission of Ove Hoegh-Guldberg, Global Change Institute, University of Queensland.
causative factor along with global warming (Kiessling and Simpson, 2010). Notably, the deep-time record of this major reef crisis uniquely captures the consequences on larger-scale marine ecosystems that might be anticipated with the future loss of reefs.
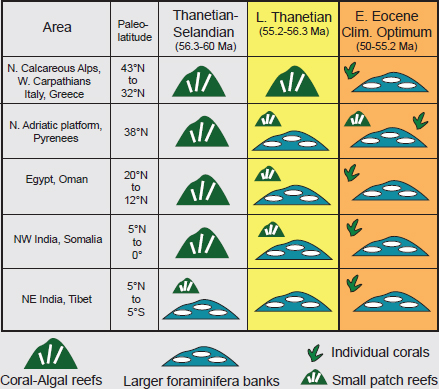
FIGURE 2.13 Paleogene reef history from the Mediterranean area and southern Asia. Coral-algal reefs that are widespread in the early Paleogene largely disappeared during the peak of greenhouse warming in the Early Eocene Climatic Optimum, and were replaced by carbonate mounds formed by larger benthic foraminifera (nummulite banks).
SOURCE: Modified from Scheibner and Speijer (2008).
BOX 2.7 Climate-Driven Restructuring of Late Paleozoic Tropical Forests
Integration of climate proxy records with tropical paleobotanical archives from the Late Paleozoic shows repeated climate-driven ecosystem restructuring of paleotropical flora in step with climate and pCO2 shifts, illustrating the biotic impact associated with past CO2-forced turnover to a permanent ice-free world (Montañez et al., 2007; DiMichele et al., 2009). Wetland flora—consisting of ferns and pteridosperms, sphenopsids, and lycopsids—was rapidly replaced in the earliest Permian by dryland flora that diversified in the now seasonally dry habitats created by an abrupt shift from ever-wet to semiarid conditions. Tree and fern-rich floras reappeared during wetter, cooler conditions of the subsequent glaciation at ~285 Ma characterized by lowered pCO2 (Figure 2.14). Such dramatic floristic changes occurred with each climate transition during the final stage of the Late Paleozoic Ice Age.
The fact that these temporally successive floras tracked climatic conditions and contained progressively more evolutionarily advanced lineages suggests that evolutionary innovation occurred in extrabasinal areas and was revealed by climate-driven floral migration into lowland basins. One such scenario occurred during the return to cold conditions at the close of the Early Permian when unique seed-plant assemblages, not observed again until the Late Permian (conifers) and Mesozoic (cycads), migrated into lowland basins. Climate transitions drove macroevolution in the oceans as well, including significant changes in marine invertebrate biodiversity coincident with the appearance of a diverse array of early terrestrial vertebrate lineages and major restructuring of floral biomes (Clapham and James, 2007).
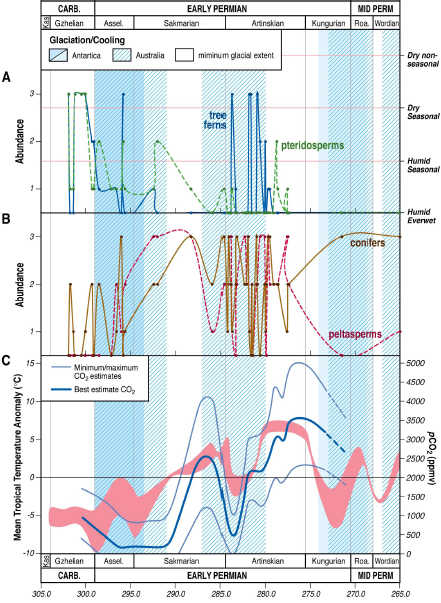
FIGURE 2.14 Floral abundance patterns (A and B) in the paleotropics during the latest Pennsylvanian through Middle Permian, plotted against (C) estimated pCO2 (blue line) and paleo-sea surface temperatures (red band). Periods of glaciation or widespread cooling in the high southern latitudes are shown by blue bars. Top panel (A) shows the temporal distribution of typical latest Carboniferous wetland floras (ferns and pteridosperms, sphenopsids, and lycopsids). The middle panel (B) illustrates the temporal distribution of dryland floras (conifers, callipterids and other seed plants) that diversified in seasonally dry habitats. The short-term intercalation of the two floras—at the likely millennial scale—occurred with the return of wetland floras in the mid Early Permian transient glaciation under cooler and wetter conditions brought on by significantly lowered pCO2 and renewed glaciation.
SOURCE: Modified after Montañez et al. (2007).
BOX 2.8 Biome Distributions in the Cretaceous-Early Eocene Hothouse
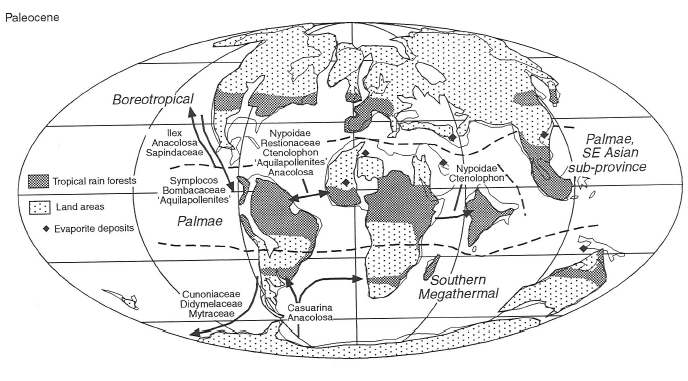
The discovery more than a century ago of coal seams, fossil forests, and fossil leaves of warm temperate trees above the Arctic Circle on the west coast of Greenland, more than 1,000 km north of the modern tree line, was an early indicator of anomalous warmth at high latitudes in the past. That arctic regions more than 50 Ma had been forested as far north as there was land, despite a continental configuration similar to that of the present day, became increasingly more apparent with the discovery of hundreds of similar sites on arctic islands and across arctic Asia and North America (Spicer et al., 2008). Northern hemisphere Cretaceous-early Eocene polar forests were fundamentally different from present-day boreal forests, which do not grow north of the Arctic Circle, as they are dominated by deciduous conifers related to the bald cypress and dawn redwood and by a variety of deciduous broadleaf trees. Leaf margin analysis of Paleocene-Eocene floras from arctic Canada on Axel Heiberg Island (at 78ºN) yield mean annual temperatures of 10º ± 2ºC (Basinger et al., 1994), in striking contrast to the modern mean annual temperatures of minus 30ºC. The fossil floral record indicates that in this warmer world, both subtropical and tropical rainforests had greatly expanded latitudinal ranges (Figure 2.15).
Subtropical conditions in the polar Arctic are further indicated by the occurrence of early Eocene crocodiles, turtles, and snakes on Ellesmere Island at 80ºN at this time (Dawson et al., 1976; Markwick, 2007). Subsequent discovery of fossil mammals and plants, related to contemporary biotas in France and Wyoming, confirmed the hypothesis that Arctic Canada at this time was part of a warm temperate land connection between Europe and North America (Hickey et al., 1983). The recent and surprising discovery of the aquatic fern Azolla in 47 Ma Eocene sediments in an ACEX Integrated Ocean Drilling Program (IODP) core in the middle of the Arctic Ocean (Brinkhuis et al., 2006) adds an almost surreal element to this vignette of crocodile-infested subtropical swamp forests on the shores of a warm, fresh arctic ocean covered with floating aquatic plants. Studies of such ice-free, high-latitude, deep-time analogues are important scientific windows into how the Arctic ecosystem might operate in the absence of permanent sea ice or in fully deglaciated conditions.
In a world with forested poles and tropical midlatitudes, the nature of the equatorial realm is a serious question. Recent estimates of sea surface temperatures for the Late Cretaceous to Eocene tropics, based on well-preserved marine microfossils, suggest that temperatures may have exceeded 35-40ºC (Huber, 2002; Norris et al., 2002; Pearson et al., 2007)—the absence of equatorial coral reefs may have been because seawater was too hot. Ample evidence from equator to pole shows that the last greenhouse was a very different place from today, and that the composition and distribution of biomes were wholly different from the present—it was not just a warmer world, but rather a completely different world from the present day.
be at least two orders of magnitude higher than the long-term average (Hassan et al., 2005), a rate potentially commensurate with the largest mass extinctions of the geological past (Sepkoski, 1996; Bambach, 2006). Modeling future biodiversity losses and their effects on the Earth’s ecosystems and climate, however, is inherently difficult (Botkin et al., 2007), making it imperative to assess the outcome of equivalent “natural experiments” in the geological record (NRC, 1995; Myers and Knoll, 2001). The five major, and dozens of minor, mass extinctions of the past half-billion years (Sepkoski, 1996; Bambach, 2006) offer unique insights regarding ecosystem susceptibility and response to environmental stress, the potential for ecological collapse, and the mechanisms of ecosystem recovery (Benton and Twitchett, 2003; Bottjer et al., 2008). Furthermore, the integration of paleontologic, stratigraphic, and geochemical records for many intervals of the past half-billion years have revealed the variable character of past biotic turnovers and mass extinction events (e.g., Boxes 2.4, 2.6, 2.7, 2.8), which differ in regard not only to severity but also to duration, selectivity, and the nature of environmental stresses (e.g., the transition out of supergreenhouse conditions into Ordovician glaciation [Trotter et al., 2008]; the Early to Middle Triassic radiations [Payne et al., 2004]; the nannoplankton crisis and foraminiferal turnovers of the Cretaceous ocean anoxic events [Leckie et al., 2002]; Eocene-Oligocene faunal extinction and immigration [Kobashi et al., 2001; Ivany et al., 2004]). Most importantly, the geological record uniquely captures past climate-ecological interactions that are fully played out and thereby archive the impact, response, interaction, and recovery from past global warming and major climate transitions.


