
The Medicare system adjusts fee-for-service payment rates for hospitals and practitioners1 according to the geographic location in which providers practice, recognizing that certain costs beyond the providers’ control vary between metropolitan and nonmetropolitan areas and also differ by region. The fundamental rationale for geographic adjustment is to create a payment structure that adjusts payments for the input price differences, such as employee compensation, that providers face when they provide care.
Although Medicare is a national program, policy makers and researchers working to develop and implement its payment systems have long recognized that health care delivery is local and that payment amounts must be adjusted to reflect input price differences across geographic areas of the United States. The two geographic adjustments applied to Medicare payments for care provided by hospitals and practitioners are the hospital wage index (HWI) and three geographic practice cost indexes (GPCIs). In broad terms, an index compares differences in price or quantity for a group of goods and services relative to an average value derived from a standard baseline geographic area or time period (see Box 1-1).
Geographic adjustments are intended to ensure that the Medicare program does not over-pay hospitals and practitioners in certain areas and underpay in others as a result of geographic differences in prices for resources such as clinical and administrative staff salaries and benefits, office or hospital space (rent), malpractice insurance (premiums), and other resources that are part of the cost of providing care. As a result, Medicare’s Inpatient Prospective Payment System (IPPS), other institutional prospective payment systems (other PPSs), and the Medicare Physician Fee Schedule (PFS, or fee schedule) all employ geographic adjustment factors (GAFs).
Although there is widespread agreement about the importance of varying payments to providers to reflect differences in input prices across areas, there is disagreement in the provider community and among policy makers about how to make the geographic adjustments most
___________
1 Unless otherwise specified, the term “practitioners” is used to describe both physicians and other eligible clinical providers that are permitted to furnish services and bill Medicare under the Physician Fee Schedule (see Box 4-2 in Chapter 4 for a detailed list) (CMS, 2009).
An index compares differences in price or quantity for a group of goods or services relative to an average value derived from a standard or baseline geographic area or time period. The data used to derive the index can come from a variety of sources, such as employer or consumer surveys, hospital reports related to staff salaries and benefits, and many others.
A price index is a statistic that is designed to compare how the price for a defined group of goods and services varies as a whole over time or between geographic areas compared with an average. This is distinct from a cost index, which measures variation in actual expenditures, such as wages and benefits.
accurately. Critics of the existing geographic adjusters identify a number of questions and concerns. Among these are problems and inconsistencies with the definitions of payment areas and labor markets and the discreteness of the borders between them; concerns about the appropriateness of the source data for determining wages and other input prices prevailing in an area; questions about how and to what extent variations in the occupational mix used to provide care should be reflected in the hospital wage and physician practice expense adjustments; and the lack of transparency in the construction of indexes and the data used to compute them.
These and other concerns regarding the current system of geographic adjustments are conceptually complex, widely disputed, and often contentious—largely because of the magnitude of the payments distributed by use of the indexes and because of the lack of a definitive measure of accuracy. With a goal of improving this system, the U.S. Department of Health and Human Services (HHS) and the U.S. Congress sought advice from the Institute of Medicine (IOM) on how best to address concerns about the appropriateness of the data sources and the transparency of the methods used for making the geographic adjustments in payments to providers. The IOM was also asked to assess the impact of geographic adjustment on the workforce in metropolitan and nonmetropolitan areas, beneficiaries’ access to care, and the ability of providers to provide high-value, high-quality care.
To assist with the analysis of data accuracy and methodological questions and to model the impact analysis, the IOM engaged RTI International to be consultants to the committee because of its extensive previous work on the HWI and the GPCIs.
The overall goal of this study is to provide recommendations that increase the likelihood that the geographic adjustments reflect reasonably accurate2 measures of input price differences and are consistent with national policy goals of creating a payment system that rewards high-value and high-quality health care.
This is the first of two reports to the Secretary of HHS and the U.S. Congress, which commissioned a 2-year IOM study to assess the accuracy of the adjustment factors and the meth-
___________
2 Throughout this report, the term “accuracy” is used to refer to the degree of closeness of measurement to the true value of whatever is being measured.
odology used to determine them, including an evaluation of the sources of data and the extent to which these sources reflect true price inputs for providers.
This first report focuses primarily on accuracy in measuring input prices for fee-for-service Medicare Part A and Part B payment systems. It includes a technical assessment of the data sources used for the HWI and the GPCIs, and for defining the payment areas used for each index, but it does not include a review of the accuracy of payments to facilities other than short-term acute care hospitals, such as skilled nursing facilities (SNFs) or home health agencies (HHAs), due to time and resource constraints.3 The details of the HWI are discussed in Chapter 3, and the GPCIs are addressed in detail in Chapter 5.
In its phase 2 report, scheduled to be released in the spring of 2012, the committee will evaluate the effects of the adjustment factors on such matters as the distribution of the health care workforce and the ability of providers to produce high-value, high-quality health care. The phase 2 report will consider such issues as policy adjustments that affect the level and distribution of the health care workforce in metropolitan and nonmetropolitan areas, and the effect of the adjustment factors on population health and quality of care, as well as additional considerations to promote geographic equity in Medicare payments and beneficiaries’ access to high-quality care.
The statement of task for the study was developed by the IOM and the Centers for Medicare and Medicaid Services (CMS) on behalf of the Secretary of HHS (see Box 1-2). For reasons that are explained later in this chapter, the language in the statement of task is taken directly from Section 1157 of the U.S. House of Representatives health reform bill, The Affordable Health Care for America Act (House Resolution 3962) (see later section on congressional perspectives).
During the first meeting of the committee, CMS provided additional guidance and context to the committee by requesting an impact analysis to better understand the consequences of the committee’s recommendations for various providers (see Box 1-3).
GEOGRAPHIC ADJUSTMENTS TO MEDICARE PAYMENT
Medicare is the largest single payer of health care services in the United States, representing 30 percent—nearly one-third—of total spending on hospital care and 20 percent of total spending on physician services (CMS, 2010e).4 Medicare covers 47 million Americans, including 39 million individuals who are 65 years of age and older and 8 million nonelderly people with permanent disabilities or end-stage renal disease. More than one-third of Medicare beneficiaries have three or more chronic medical conditions, and about half live at or below 200 percent of the federal poverty line, which in 2006 was an annual income of $19,600 for a single person and an annual income of $26,400 for a couple (CMS, 2006; HHS, 2006).
Medicare payments in 2010 are estimated to reach more than $500 billion (CBO, 2010; CMS, 2010e). Total Medicare spending, however, is not evenly distributed across the country. Although Medicare beneficiaries make up about 15 percent of the total population of the United States, their share of the population varies within each state (CMS, 2010b).
CMS adjusts Medicare fee-for-service payments to practitioners and hospitals according to the geographic location in which the provider practices, recognizing that some costs are
___________
3 The committee recognizes that the HWI needs further refinement in order to be an accurate adjustment for non-acute care facilities, and it addresses those refinements in the supporting language for Recommendation 3-4.
4 These figures reflect the proportion of national personal health expenditures on hospital and physician services that are paid for by Medicare.
An ad hoc committee will conduct a comprehensive empirical study on the accuracy of the geographic adjustment factors established under Sections 1848(e) and 1886(d)(3)(E) of Title XVIII of the Social Security Act and used to ensure that Medicare payment fees and rates reflect differences in input costs across geographic areas.
Specifically, the committee will
- Evaluate the accuracy of the adjustment factors;
- Evaluate the methodology used to determine the adjustment factors; and
- Evaluate the measures used for the adjustment factors for timeliness and frequency of revisions, for sources of data and the degree to which such data are representative of costs, and for operational costs of providers who participate in Medicare.
Within the context of the U.S. health care marketplace, the committee will also evaluate and consider:
- The effect of the adjustment factors on the level and distribution of the health care workforce and resources, including recruitment and retention, taking into account mobility between urban and rural areas; ability of hospitals and other facilities to maintain an adequate and skilled workforce; and patient access to providers and needed medical technologies;
- The effect of adjustment factors on population health and quality of care; and
- The effect of the adjustment factors on the ability of providers to furnish efficient, high-value care.
A first report will address the issues surrounding the adjustment factors themselves, and then a second report that evaluates the possible effects of the adjustment factors will follow. The reports, containing findings and recommendations, will be submitted to the Secretary, U.S. Department of Health and Human Services (HHS), and the U.S. Congress.
beyond the providers’ control. Medicare’s IPPS, other institutional PPSs, and the Medicare PFS all employ GAFs (CMS, 2010c, 2010d).
Separate and distinct from the geographic adjustments, other payment adjustments are made to serve policy purposes such as helping to offset expenses for caring for uninsured patients or to encourage practitioners to serve patients in medically underserved areas. Although such policy adjustments are not the primary focus of this report, the committee recognizes the critical importance of these payments and their contribution to the debate over equitable payments for Medicare services among policy makers and providers. These topics will be addressed as part of the committee’s phase 2 report.
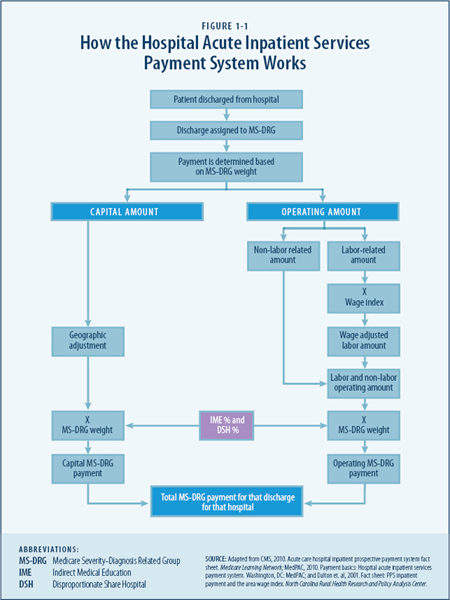
The IPPS pays hospitals a predetermined, fixed amount for each category of inpatient stay regardless of the actual costs incurred by providing that care. Figure 1-1 presents a diagram
CMS has made various proposals to revise the geographic adjusters, but stakeholder feedback indicates that many believe that there are flaws in data methodology, and that the adjuster arrangement is unfair. This committee should bring together an independent consensus report on geographic adjustment factors. CMS is willing to provide the committee with any technical assistance and data that might be useful for the study.
The goal of this study is to help influence and improve the CMS rule-making processes by making actionable recommendations. This goal and the timeline of this report were designed with CMS rule-making in mind. CMS and the Institute of Medicine (IOM) have agreed on a schedule that would result in IOM producing a report in time for the rule-making cycle for physician fee schedule rates on January 1, 2012. The IOM study timeline is fixed with the 2012 rule-making cycle.
While the IOM study is aimed to help improve CMS processes, CMS also has legislative limitations. If the IOM committee’s recommendations go beyond the authority of CMS, then CMS will be limited in the recommendations that it can adopt. We want the IOM to make independent recommendations, but CMS looks forward to recommendations that can be implemented under its current legislative authorities.
When the committee develops its recommendations, we ask that you consider the long-term objective in the Patient Protection and Affordable Care Act of creating a payment system that reflects value and efficiency of services and provides incentives to reward efficiency.
CMS requests that an impact analysis on the recommendations provided will be included to better understand the specific impacts the changes in the geographic adjustment factors will have on various health care providers. For CMS to consider rapid implementation of any recommendation, a thorough understanding of the impacts on all communities is necessary.
CMS has the responsibility to ensure that payments are accurate, provide incentives for physicians, and ensure access to care. The long-term goal is to create a payment system that promotes value of care, not volume of care. CMS understands that many have criticisms of the data and proxies we currently use to adjust payments. We seek concrete recommendations on alternative data sources if the IOM panel were to make any recommendations in this area. We need more general consensus on geographic Medicare adjustment factors.
Jonathan Blum, Director, Centers for Medicare and Medicaid Services
September 16, 2010
of the Medicare payment formula. Although the fixed payment amount is based on national average costs for patients in each Medicare Severity-Diagnosis Related Group (MS-DRG), Medicare’s Part A hospital and other institutional payment systems also adjust the payment rates according to the HWI (CMS, 2010c). This index reflects how the average hourly hospital wages in a specified geographic area (a proxy for the local labor market) compare to average hourly hospital wages nationally.
The wage index is intended to reflect geographic differences in the price, not the cost, of labor faced by each hospital within its labor market. The price of labor is indicated by the prevailing wage for a given occupation in each labor market, while the cost of labor reflects
business decisions regarding employee compensation and occupational mix. The adjustment for differences in price, rather than costs actually incurred, helps to hold hospitals accountable for efficient use of labor.
The numerical value of the wage index for any given labor market is the ratio of the average hourly hospital wage in that area and the national average hourly hospital wage. The hourly wages used to construct the wage index include all salaries and benefits for acute care hospital staff, including contract staff for selected clinical and administrative positions.
To define the labor markets used in these computations, Medicare currently classifies hospitals according to their location in 1 of 365 metropolitan statistical areas (MSAs), with the balance of nonmetropolitan counties grouped into rest-of-state areas (non-MSAs), making a total of approximately 441 hospital labor markets (CMS, 2010d).
In general, hospitals in metropolitan areas tend to face higher wages than those in nonmetropolitan areas, resulting in a higher wage index and higher hospital payments. Conversely, hospitals in nonmetropolitan and rest-of-state areas tend to have lower wages relative to metropolitan areas in their regions, generating a lower wage index adjustment and lower payments. According to the Agency for Healthcare Research and Quality (AHRQ), almost half of nonmetropolitan hospitals’ total inpatient stays are paid for by Medicare (Stranges et al., 2010),5 yet many nonmetropolitan health providers and some policy experts believe their payments are disproportionately low compared with actual input price (wage) differences (Kitchell, 2010; Reding, 2010).6
Average hospital wages vary not only because hospitals pay different wages for similar personnel but also because they employ different mixes of occupations. Although in some instances this may be a function of discretionary business choices, in others it may be a result of factors beyond the control of hospital employers. For example, a hospital is paid for more expensive labor if their patients require specialized care due to particularly severe or complex conditions. This is accounted for by the MS-DRG adjustment to payment, as shown in Figure 1-1. There are also state statutes that govern nurse staffing ratios, shortages of various types of ancillary or allied health personnel in some areas, or prevailing community practices.
In general, hospitals in metropolitan areas tend to employ a more highly trained and more expensive mix of employees than do hospitals in nonmetropolitan areas. For example, many facilities located in MSAs report a higher proportion of registered nurses (RNs) relative to nursing aides and licensed practical nurses (LPNs) (see Table 3-5). Because the HWI is intended to reflect differences in the price of labor but not in the labor mix, an “occupational mix adjustment” (OMA) is also made to each hospital’s average wages before the index values are computed to factor out the effect of hospitals’ own decisions about the mix of occupations (RNs, LPNs, nurse-aides, and medical assistants) they hire before computing index values (CMS, 2010c). Other hospital personnel, such as administrative staff, are not included in the OMA (see Chapter 3).
___________
5 AHRQ used data from the Healthcare Cost Utilization Project 2007 nationwide inpatient sample, which includes more than 5,000 metropolitan and nonmetropolitan hospitals. Medicare paid for 35 percent of the stays in metropolitan hospitals.
6 More than 1,000 nonmetropolitan hospitals designated Critical Access Hospitals are not paid under the IPPS discussed in this report, so the issues under discussion are not relevant to all hospitals in nonmetropolitan areas.
Exceptions and Reclassifications
Under the current methodology, each hospital paid through the IPPS is assigned to a given payment area on the basis of its geographic location (see Chapter 2). As a result, there can be substantial differences in the hospital wage indexes among neighboring hospitals located in different payment areas that may compete in the same labor market.
Perceived inequities in the wage index, as well as other policy objectives, have led to a number of ad hoc legislative changes. For example, since the late 1980s, the U.S. Congress has created several exceptions to the methodology used to determine the locations of IPPS hospitals for payment purposes. These include provisions in the Balanced Budget Act of 1997 (P.L. 105-33) and the Medicare Modernization Act of 2003 (MMA) (P.L. 108-173) that serve to minimize the differences in Medicare payments among neighboring hospitals that may compete in the same local market. More recently, in 2010 the U.S. Congress added a provision in the Patient Protection and Affordable Care Act (ACA) (P.L. 111-148) that established a HWI floor for hospitals located in a frontier state.7
By statute, a system of exceptions and reclassifications8 allows hospitals that are paid under the main IPPS rules to request reclassification to a neighboring labor market if they meet certain criteria related to the level of their wages in their initial market and the neighboring market. No similar system for providing exceptions or reclassifications for other facilities paid under prospective payment systems exists, but they still use the HWI to adjust payments on a geographic basis.
Figure 1-2 shows the 2011 HWI for each hospital payment area, including the five frontier states identified in the ACA (P.L. 111-148). The ACA also established a permanent 1.0 floor for the practice expense GPCI for those states.
There are other HWI adjustments. In the MMA, the U.S. Congress created an “outmigration adjustment” to increase the wage index for hospitals located in counties where a significant percentage of hospital employees who reside in those counties commute to neighboring MSAs with higher wage indexes for work.
Because the MSAs serve as proxies for actual labor markets, they may not adequately or consistently define hospital labor markets. According to RTI analyses of CMS data for this study, almost 40 percent of all IPPS hospitals have been reclassified—that is, they are paid according to a wage index other than the one that applies to the geographic area in which they are located (see Figure 1-3). While reclassifications are conscientiously done, they nevertheless demonstrate that MSAs may not consistently or adequately reflect actual hospital labor markets (see Chapter 5).
Although the HWI is also used to adjust PPS payments to other health care settings,9 no mechanism is currently available to allow SNFs or HHAs to request reclassification from the labor market in which they are located (CMS, 2011). The wage index for facilities other than short-term acute care hospitals is discussed briefly in Chapter 3.
___________
7 A frontier state is any state in which 50 percent of counties have a population per square mile of less than 6. Five states are currently frontier states: Montana, Nevada, North Dakota, South Dakota, and Wyoming.
8 A hospital may apply to the Medicare Geographic Classification Review Board to request reclassification to another payment area (labor market) if it meets criteria related to proximity, if its hourly wages are above average for its market area, and if its wages are comparable to those in the requested area. (See MedPAC Payment Basics, Hospital Acute Inpatient Services Payment System, Footnote 4. http://www.medpac.gov/documents/MedPAC_Payment_Basics_07_hospital.pdf.)
9 These include hospital outpatient services, ambulatory surgical centers, inpatient rehabilitation facilities, skilled nursing facilities, inpatient psychiatric facilities, long-term acute care hospitals, home health agencies, and hospice facilities (MedPAC, 2010).
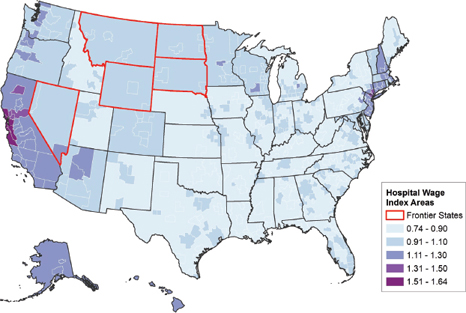
FIGURE 1-2 Hospital wage index by wage area, FY 2011.
SOURCE: CMS, 2010c.
GEOGRAPHIC PRACTICE COST INDEXES
Medicare Practitioner Payments
The concepts and methods of physician payment were enacted in the Omnibus Budget Reconciliation Act of 1989 (OBRA). Since 1992, Medicare has paid for physicians’ services and those of other eligible Medicare practitioners/suppliers under Section 1848 of the Social Security Act, which requires that payments be based on national uniform relative value units (RVUs) that are based on the relative resources typically used in providing a service (CMS, 2010d).
The standard process for billing professional services under fee-for-service medicine is based on submission of a claim using one or more procedural codes. CMS uses Healthcare Common Procedure Coding System (HCPCS) codes based on the Current Procedural Terminology (CPT®) codes, whose nomenclature was developed by and whose intellectual property rights are held by the American Medical Association (AMA) (2010). Physician services include office visits, surgical procedures, and a broad range of other services provided in a variety of settings, including offices, hospitals, clinics, and post-acute care settings (MedPAC, 2008).
Medicare payments to physicians and certain other clinical practitioners, including nurse practitioners, physician assistants, and physical therapists, are set by the PFS, a CMS payment system used to pay for more than 7,000 distinct services (CMS, 2010d; MedPAC, 2008). For
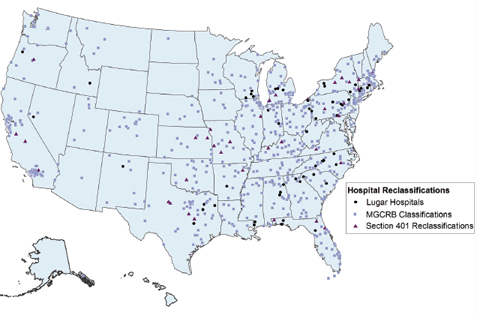
FIGURE 1-3 Reclassified Inpatient Prospective Payment System (IPPS) hospitals, FY 2011.
SOURCE: CMS, 2010c.
NOTE: The total number of IPPS hospitals is 3,518.a Of those IPPS hospitals, 1,313, or 37 percent, have qualified for reclassification or for an exception.
Medicare Geographic Classification Review Board (MGCRB) reclassifications apply to hospitals that requested reclassification to another payment area from the MGCRB and have met the board’s criteria (773 hospitals, or 22 percent).
Lugar county reclassifications apply to hospitals in nonmetropolitan areas near metropolitan areas that are reimbursed at the same rates as nearby metropolitan hospitals (55 hospitals, or 2 percent).
Section 401 reclassified hospitals are those in metropolitan areas that are classified as nonmetropolitan in order to qualify for sole community hospital status, Medicare dependent status, or rural referral center status (37 hospitals, or 1 percent) (Hartstein, 2010).
An additional 14 percent of hospitals qualify for an exception such as an outmigration adjustment, a rural floor adjustment, or a frontier state adjustment.b
___________
a This figure comes from the FY 2011 Final Rule Impact File, CMS.
b The percentages do not add up to 37 percent because a hospital may qualify for more than one exception category.
most physician services, Medicare pays the provider 80 percent of the fee schedule amount and the Medicare beneficiary is responsible for the remaining 20 percent (MedPAC, 2008). The beneficiary’s share is often paid by supplemental coverage such as a Medigap plan or Medicaid.
Depending on state scope of practice laws and with some restrictions in the Medicare statute and regulations, nurse practitioners, physician assistants, physical and occupational therapists, and certain other licensed clinicians can independently bill Medicare and are reimbursed at 85 percent of the physician rate (MedPAC, 2002). However, when clinical practitioners other than physicians provide a service identified as “incident to” or under the direct supervision of a physician (e.g., provide an injection), Medicare pays the fee schedule amount as if the physician had personally provided it, and the non-physician practitioner is not allowed to bill Medicare separately (CMS, 2009, 2010a; MedPAC, 2002).
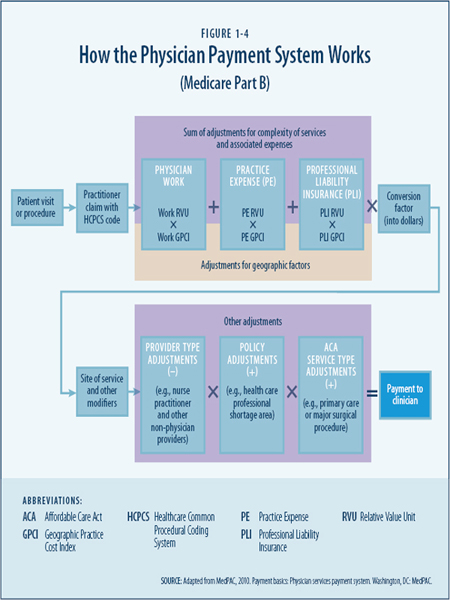
The Medicare PFS adjusts payments according to geographic differences in the costs of operating a private medical practice. Although the PFS geographic adjustments are known collectively as the GAF, technically there are three independent adjusters called GPCIs. GPCIs are used to help standardize the differences in resource costs incurred across geographic areas when those costs are compared with the national average costs for the physician work, practice expense, and malpractice insurance components of the fee schedule (CMS, 2010d). Specifically, the three adjustments are provided for the following:
- Physician work reflects the time, skill, effort, judgment, and stress associated with providing one service relative to other services according to the HCPCS codes. On average, as of 2011, work accounted for 52.5 percent of the geographic adjustment factor within the fee schedule (CMS, 2010d).
- Practice expense (PE) considers certain prices for maintaining a clinical practice, including salaries and benefits for administrative and clinical employees, rent, equipment, and supplies. Practice expenses associated with supplies and equipment are not adjusted geographically because they are purchased in a national market in which prices are similar across the country. On average, as of 2011, the PE GPCI accounted for 43.7 percent of the geographic adjustment (CMS, 2010d) (see Chapter 4).
- Professional liability insurance (PLI) represents payment for professional liability (malpractice) expenses and, on average, accounts for 3.9 percent of the geographic adjustment (CMS, 2010d).
CMS will address the cost-share weights again in the CY 2012 PFS Proposed Rule (CMS, 2010d).
To provide relative comparisons of the practitioner resources required to provide the service, each HCPCS code has an assigned work RVU with an associated payment amount. For example, an office visit for an upper respiratory infection is considered under the current system to be less resource-intensive than a cataract removal or a colonoscopy.
Each CPT® code also has an assigned practice expense RVU that is intended to reflect the relative differences in typical office or other practice-related costs. Some practice expense RVUs vary according to the “site of service” and adjust payments for services delivered in non-office settings, such as an outpatient clinic, hospital, or hospice (CMS, 2010d). A third RVU is assigned for malpractice. This RVU is adjusted according to the risk factors associated with various procedure codes and also for geographic differences in the price of PLI premiums (CMS, 2010d).
To pay for a service after it has been provided, each of the three RVUs for that service is adjusted for geographic differences in resource costs by use of the three GPCIs. Then, the sum of the adjusted RVUs for a particular code in a particular geographic area is multiplied by the conversion factor, which produces a Medicare fee for that HCPCS code in that area (see Figure 1-4).
Physician Payment Areas
The GPCIs geographically adjust physician fees across 89 geographic localities (see Figure 1-5). Some comprise large metropolitan areas, whereas 34 are statewide and combine metropolitan and nonmetropolitan areas. Practice costs may vary substantially within the payment areas, particularly for the statewide areas that are both metropolitan and nonmetropolitan. A congressionally requested Government Accountability Office (GAO) (2007) study found that more than half of the payment areas contained at least one county where there was a difference of 5 percent or more between the Medicare adjustment and the actual relative level of physician practice costs. This represented 14 percent of all counties nationwide.
As will be discussed in Chapter 4, the Medicare approach to geographic adjustment of physician payment has been subject to substantial criticism. Extensive public comments on the proposed revisions to the PFS rules in 2010 (CMS, 2010d) revealed a variety of concerns among stakeholders about approaches to geographic adjustment and perceived shortcomings of the current payment system, including whether physician work should be considered to be operating in a national market or whether there is sufficient evidence that the market value of physician work varies by region or by metropolitan or nonmetropolitan locations. Other public comments on the proposed rule related to whether the occupational mix used for practice
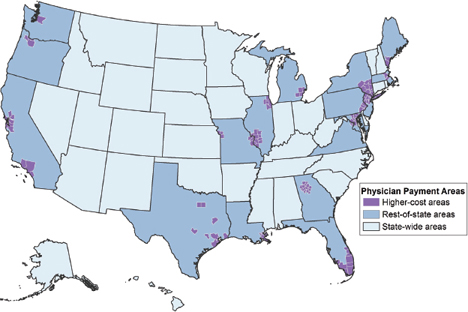
FIGURE 1-5 Physician payment areas, CY 2011.
SOURCE: CMS CY 2011 Final Rules (November 2010).
expense adjustments is an accurate reflection of clinical or business considerations about how many and what type of clinical and support staff are employed in different geographic areas.
The committee heard testimony from stakeholders (see Box 1-4 and Box 1-5) who believe that only actual cost data from clinical practices should be used for the GPCIs, although a number also expressed concern about the burden on clinicians who develop these individual cost reports but do not receive reimbursement for the extra administrative work (Kitchell, 2010). The committee also heard testimony from the American Academy for Family Physicians about the inaccuracy of the work adjustment because of flaws in the relative values that historically undervalue primary care services relative to the procedure-based services as part of the system for making these adjustments (Goertz, 2011).
These are only a few examples of the concerns about the accuracy of the geographic adjustments that stakeholders have expressed. Other examples and further discussion are included in Chapter 4.
BOX 1-4
Statement from Representative Bruce Braley, D-Iowa
One of the things we are trying to do with this study is to give you the incentive to look at the validity of some of the adjustments that are currently being made and determine whether there is better data that can more accurately reflect what is going on. We want you to look at the adjusters that are being used and try to decide whether they are accurate and if they need to be changed to reflect real world data, not just proxies. Unless these accuracy issues are addressed, there will be an impact on delivery and access to patient care in my district, and that is why this is so important to the people that I represent.
September 16, 2010
BOX 1-5
Senator Charles Grassley’s (R-Iowa) Written Testimony to the Committee
The existing inaccurate geographic adjustments by the Centers for Medicare and Medicaid Services (CMS) result in unwarranted and unduly low rural reimbursement rates. More current, relevant, and accurate data sources exist and should be used by CMS to make geographic adjustments to Medicare payments, especially in the area of physician practice expense. The current geographic disparities in payment are not based on actual or reliable data, and they put rural Medicare beneficiaries at risk. I urge the committee to recommend that CMS use actual practice cost data rather than the current inaccurate proxies to ensure that Medicare payment reflects true geographic differences in physician practice costs.
January 5, 2011
BUDGET NEUTRALITY AND PROVIDER IMPACT
From a policy perspective, adjustments for geographic variation in input prices can be viewed as an acknowledgment of geographic differences in the prices associated with doing business in various regions. By definition, a geographic index adjusts some values up and some down, but these indexes generally determine only the distribution of payments across providers in different areas and not the total amount of payments in aggregate. This budget neutrality of geographic adjustments to Medicare payments is imposed by statute, with the exception of the outmigration adjustment to the HWI as stated in Section 505 of the MMA.
From the provider perspective, the budget neutrality requirement forces a zero-sum situation in which any upward adjustment (such as one resulting from a reclassification) or any adjustment in payments for one area (such as an index floor) must be paid for by a downward adjustment to other providers or areas. The perception of a competitive advantage to providers in metropolitan versus nonmetropolitan areas or to one provider in a geographic area compared with others in the same area or neighboring areas is a source of considerable debate among providers, members of the U.S. Congress, and other policy makers.
A major source of disagreement between providers in metropolitan and nonmetropolitan areas is reflected in discussions about whether these geographic adjustments should also serve as a policy lever to help address perceived provider shortages, particularly in nonmetropolitan areas. These dynamics further complicate the ability to make changes in a contentious political environment with the distribution of hundreds of billions of dollars in annual Medicare payments at stake.
PAYMENT EQUITY CONCERNS AND RATIONALE FOR THIS STUDY
After months of congressional negotiations about how to transform the delivery of the nation’s health care by improving health care access and quality, reforming payment systems, increasing efficiency, and slowing growth in health care expenditures, the U.S. House of Representatives passed a health care reform bill on November 7, 2009. The Affordable Health Care for America Act (House Resolution 3962) included consumer protections for preexisting medical conditions, a national health insurance exchange, a public option for expanding insurance coverage, workforce incentives to promote primary care, and other provisions.
In addition, Section 1157 of the House bill called for an IOM study to make recommendations for improving the accuracy of the adjustments made to physician and hospital payments to account for geographic variation in input prices, such as salaries and benefits for clinical and administrative staff (see Box 1-6). A wide array of provider groups have criticized the geographic adjustment factors for undervaluing the contributions of providers in low-cost areas, especially nonmetropolitan areas, as well as for not recognizing actual costs in the high-cost metropolitan areas. A different section of the House bill, Section 1159, called for a separate IOM study of geographic variation in health care spending that focused on Medicare spending per beneficiary and differences in utilization patterns across the country.
On December 24, 2009, the U.S. Senate passed its version of the health care bill without the public health insurance option, and congressional leadership began amending the Senate bill through the reconciliation process. The ACA was signed into law on March 23, 2010, and the compromise bill, the Health Care and Education Reconciliation Act of 2010 (HCERA) (P.L. 111-152), was signed into law on March 30, 2010, a week after the ACA.
BOX 1-6
Statement from Representative Allyson Schwartz, D-Pennsylvania
This study has its origins in a provision of the health care reform legislation that was not included in the final legislation: the public option. When the public option was under consideration in House Bill 3200, its rates were to be based on Medicare payment rates, and this linkage raised concerns from a number of Members, particularly those representing rural areas. The purpose of the geographic adjustment factors is to help ensure that Medicare’s payment is accurate and appropriate in all areas. Congress and the administration are seeking your expertise and help in designing a methodology that best reflects this purpose, to raise or lower Medicare rates and fees depending on whether the local costs are above or below the national average.
September 16, 2010
Provisions for the two IOM studies (Sections 1157 and 1159) were not included in the final version of the ACA. As a condition of supporting the final bill, 30 House Democrats negotiated with HHS officials and White House staff to restore the IOM studies of geographic variation and address “geographic disparities” in Medicare payment. On March 20, 2010, HHS Secretary Kathleen Sebelius sent a letter to these members, who came to be known as the House Quality Care Coalition, with a commitment to commission the IOM to conduct the two geographic variation studies. The letter also committed HHS to convene a National Summit on Geographic Variation, Cost, Access, and Value in Health Care, which took place in Washington, DC, in early October 2010 (Sebelius, 2010).
Separate IOM consensus committees were appointed to conduct the two Medicare geographic variation studies. The work and charge for each committee are related, but the two studies are distinct and should not be confused. The present study, known as the 1157/1158 study on geographic adjustment in Medicare payment, reflects congressional concerns and hopes for remedial recommendations regarding the accuracy, methods, and workforce impacts of the geographic adjustment system for Medicare Part A and Part B payments as defined in the statement of task (see Box 1-2).
The other IOM study, the 1159/1160 study on Medicare geographic variation in health care spending, addresses congressional interest in lessons that might be learned through analyses of factors responsible for geographic variation in Medicare service cost and intensity, such as patient population demographics, patient preferences, insurance status, and physician discretion and practice patterns, among others. The statement of task for that report required recommendations for changes in Medicare Part A and Part B payments on the basis of these analyses and on the basis of an additional assessment of whether Medicare payment systems should provide incentives for high value care. The findings of the Dartmouth Atlas Project (Fisher et al., 2003a, 2003b, 2009) have provided, in large part, the foundation for this congressional interest (Schwartz, 2010) and work to be undertaken as part of this very different and separate study.
The committee began its deliberations by reviewing the statement of task and discussing its responsibilities in detail. Committee members made an early commitment to focus first on the committee’s charge to study the accuracy of the geographic adjustment established under Sections 1848(e) and 1886(d)(3)(E) of Title XVIII of the Social Security Act.
To help guide its review and deliberations, the committee developed the following general principles.
1. Evidence for adjustment. The continued use of geographic adjustment factors in Medicare payment is warranted to reflect geographic variations in input prices.
Public testimony and written comments to this committee, along with extensive public comment to the Centers for Medicare and Medicaid Services on the proposed revisions to the PFS Rules in 2010, revealed clear differences of opinion about how the study should be conducted and what the committee should recommend. However, one area of agreement among stakeholders was the need to rebuild the system and to improve the accuracy of the data sources and methods used in making geographic adjustments. The committee began its deliberations by examining the extent of geographic variation in input prices faced by hospitals and practitioners.
Although the availability of sufficient representative data on practitioner compensation and practice expenses was particularly problematic and the data sources available for determining wages for the HWI had certain shortcomings, the committee agreed that the overall evidence and rationale for geographic adjustment were strong enough to warrant its continuation. To help improve the current system, the committee focused on ways to improve the data sources and methods used.
2. Accuracy. Geographic adjustment for input price differences is intended to reflect the input prices faced by providers, not the costs incurred by providers.
“Accuracy” of data sources can be defined as the degree of closeness of measurements to the true value of whatever is being measured. The committee recognizes that stakeholders have different perspectives about the accuracy of data sources, and it supports moving toward a more systematic process of geographic adjustment that more accurately reflects differences in input prices across labor markets. Although the committee recognizes that every currently available data source has certain deficiencies, the committee agrees that data sources can be improved by holding the data producers to standards of accountability and accuracy in sampling, analysis, and reporting, and by making the data and data collection methods more transparent to users.
The committee heard testimony from hospital administrators and clinical practitioners who believe that hospital cost reports or actual practice expense data are both more understandable and more transparent to the provider community and a more accurate reflection of their actual business costs than the proxy data sources currently proposed or in use. However, the committee generally concluded that independent data that reflect market input prices faced by providers are conceptually more appropriate than are data on costs paid by the providers, given that actual costs also reflect local business decisions or requirements that do not necessarily reflect input prices across labor markets.
3. Local labor markets. Geographic adjustment, where possible, should reflect area-wide input prices for labor faced by all employers operating in the same local market and should not be drawn exclusively from data on the prices paid by hospitals or health care practitioners.
To improve accuracy and reflect market prices faced by providers, geographic adjustment should reflect the local labor markets in which providers operate and compete for employees. The committee recognized that such competition may exist between like entities (e.g., hospitals versus hospitals) and across different entities (e.g., hospitals versus ambulatory surgery centers). The committee concluded that broadening the employers whose employees would be included in calculating a wage index would be especially worthwhile in areas with few health care providers (e.g., single-hospital markets).
On balance, the committee agreed that labor market data should not be drawn exclusively from hospital and provider sources, yet it also recognized that some categories of personnel are employed primarily in health care settings (e.g., nurses). In addition, the committee was concerned that certain employees in health care and other employment settings may not be identical according to their training and scope of service.
In developing recommendations about data sources for the HWI and GPCIs, the committee members compared an independent source of wage data for all-industry, health care sector, and hospital-specific wages for several occupational categories and found a very high degree of correlation between health care sector wages and wages from the other two data sources. As a result, the committee found a strong conceptual rationale for using health sector data rather than industry-wide data to help improve accuracy in adjustments and to respond to concerns expressed by stakeholders.
4. Consistent criteria. Consistent criteria should be used for determining the payment areas, data sources, and methods that are used in making the geographic adjustment for hospitals and practitioners.
Currently, Medicare payment to hospitals is based on their location in 1 of 441 labor markets (365 MSAs and 76 statewide non-MSAs). In contrast, physician and other practitioner payments are adjusted across 89 payment areas, with 34 statewide areas having both metropolitan and nonmetropolitan areas and the remainder being centered on large metropolitan areas. The committee understands the history leading to these geographic designations, yet it found little compelling evidence that the actual labor markets for physicians and hospitals are different.
Because hospitals, physicians, and other practitioners in a given geographic area tend to function within the same local labor markets, the committee sees benefits to using the same defined payment areas for both hospitals and practitioners. In view of market and policy trends toward increasing degrees of coordination and integration between hospital and ambulatory care, this appears to be both reasonable and timely.
5. Sound rationale. Changes in the current system of geographic adjustment should be based on a clear and logical rationale.
Throughout its deliberations, the committee sought to make internally consistent decisions that were logically valid, clearly supported by empirical evidence, and understandable to non-
technical audiences. The HWI and the GPCIs have been subject to many changes since they were first introduced, yet they have traditionally been considered separately both in statute and in implementation. There have been many previous recommendations for improvements to both indexes over several years. The committee noted that a number of improvements could be made to both indexes through a similar strategy or data source.
6. Transparency. The geographic adjustment process should provide sufficient information to allow transparency and empirical review of the data and methods used to make the adjustments.
The committee worked to develop recommendations to improve the accuracy of the current data sources and methodologies and provide a clear explanation of its reasoning for recommending selected data sources and methodologies to improve accuracy. Whenever possible, the committee sought to simplify the methodologies used for geographic adjustment, to use clear language to explain complex technical formulas and concepts, and to promote a reasonable and objective selection of data sources that maximize accuracy.
7. Policy adjustments. Medicare payment adjustments related to national policy goals should only be made through a separate and distinct adjustment mechanism, and not through geographic adjustment.
Medicare provider payments should be adjusted on the basis of the services that they provide and the prices that they face. The committee responded to its charge for this report by focusing first on the accuracy of payments based on the market conditions and input prices that providers face in fee-for-service settings.
The statement of task also asks the committee to consider the impact on stakeholders of any recommendations to change the current system of geographic adjustment. The committee heard testimony from practitioners and policy makers who view geographic adjustments in fee-for-service Medicare payment as a way to help address provider shortages and achieve other policy goals. Throughout their deliberations, committee members also recognized that even the most accurate geographic adjustment factors will not resolve all problems associated with the fee-for-service payment system as they relate to issues such as access to care, provider shortages, and provider mix. The committee recognizes the importance of these issues and will examine policy adjustments and their impact on stakeholders further in its phase 2 report.
RESEARCH FRAMEWORK FOR THE STUDY
After evaluating its charge, the committee developed an empirical framework with a series of research questions to help guide its work and decision-making. Understanding that its recommendations must be objective, well-supported by empirical evidence, and understandable to stakeholders, the committee undertook a systematic review of current and alternative methods of adjusting for geographic price differences, and using alternative data sources to make the adjustments. The process included:
- Reviewing the existing data sources and methods used to calculate the HWI and the GPCIs, as well as considering recommendations in previous studies that have proposed changes in data sources or methods;
- Examining the conceptual foundation for the geographic areas used in the HWI and GPCI adjustment process;
- Considering previous recommendations about the accuracy of alternative data sources through a series of statistical comparisons of those data with the data currently being used;
- Assessing the nature and extent of geographic variation in the prices for each input;
- Conducting a series of simulations to determine the impact on stakeholders of using different data sources and methods for computing the indexes;
- Evaluating the cost shares for both indexes; and
- Choosing the most appropriate and best available data source and method for each input and each index.
AMA (American Medical Association). 2010. About CPT. http://www.ama-assn.org/ama/pub/physician-resources/solutions-managing-your-practice/coding-billing-insurance/cpt/about-cpt.shtml (accessed January 7, 2011).
CBO (Congressional Budget Office). 2010. The budget and economic outlook: An update. Washington, DC: CBO.
CMS (Centers for Medicare and Medicaid Services). 2006. Medicare current beneficiary survey cost and use file, 2006. Washington, DC: Centers for Medicare and Medicaid Services.
______. 2009. Medicare physician guide: A resource for residents, practicing physicians, and other health care professionals. Washington, DC: Centers for Medicare and Medicaid Services.
______. 2010a. Covered medical and other health services. http://www.cms.gov/Manuals/IOM/itemdetail.asp?itemID=CMS012673 (accessed February 9, 2011).
______. 2010b. Medicare Advantage state/county penetration file. Washington, DC: Centers for Medicare and Medicaid Services.
______. 2010c. Medicare program: hospital inpatient prospective payment systems for acute care hospitals and the long term care hospital Prospective Payment System changes and FY2011 rates; provider agreements and supplier approvals; and hospital conditions of participation for rehabilitation and respiratory care services; Medicaid program: Accreditation for providers of inpatient psychiatric services; Final Rule. Federal Register 75(157):50042–50677.
______. 2010d. Medicare program; payment policies under the Physician Fee Schedule and other revisions for Part B for CY 2011. Federal Register 75(228):73170–73860.
______. 2010e. National health expenditure projections 2009–2019. Washington, DC: Centers for Medicare and Medicaid Services, Office of the Actuary.
______. 2011. Acute IPPS wage index. Washington, DC: Centers for Medicare and Medicaid Services. http://www.cms.gov/AcuteInpatientPPS/03_wageindex.asp#TopOfPage (accessed January 7, 2011).
Fisher, E. S., D. E. Wennberg, T. A. Stukel, D. J. Gottlieb, F. L. Lucas, and E. L. Pinder. 2003a. The implications of regional variations in Medicare spending. Part 1. The content, quality, and accessibility of care. Annals of Internal Medicine 138(4):273–287.
______. 2003b. The implications of regional variations in Medicare spending. Part 2. Health outcomes and satisfaction with care. Annals of Internal Medicine 138(4):288–298.
Fisher, E. S., J. P. Bynum, and J. S. Skinner. 2009. Health care 2009: Slowing the growth of health care costs—lessons from regional variation. New England Journal of Medicine 360(9):849–852.
GAO (Government Accountability Office). 2007. Medicare: Geographic areas used to adjust physician payments for variation in practice costs should be revised. Washington, DC: GAO.
Goertz, R. 2011. Testimony to the IOM Committee on Geographic Adjustment Factors in Medicare Payment on behalf of the American Academy of Family Physicians.
Hartstein, M. 2010. Presentation to the Commitee on Geographic Adjustment Factors in Medicare Payment: Geographic adjustment factors under Medicare: Current law and policy. Washington DC: Hospital and Ambulatory Policy Group, Centers for Medicare and Medicaid Services.
HHS (U.S. Department of Health and Human Services). 2006. The 2006 HHS poverty guidelines one version of the US federal poverty measure. Washington, DC: HHS. http://aspe.hhs.gov/poverty/06poverty.shtml (accessed January 8, 2011).
Kitchell, M. 2010. Testimony to the IOM Committee on Geographic Adjustment Factors: Geographic differences in Medicare payment to physicians—GPCIs.
MedPAC (Medicare Payment Advisory Commission). 2002. Report to Congress: Medicare payment to advanced practice nurses and physician assistants. Washington, DC: MedPAC.
______. 2008. Payment basics: Physician services payment system. Washington, DC: MedPAC.
______. 2010. Payment basics: Hospital acute inpatient services payment system. Washington, DC: MedPAC. Reding, D. J. 2010. Testimony to the IOM Commmittee on Geographic Adjustment Factors in Medicare Payment on behalf of the Healthcare Quality Coalition: Geographic Adjustment Factors in Medicare Payment.
Schwartz, A. 2010. Testimony of U.S. Representative Allyson Schwartz to the IOM Commitee on Gegraphic Adjustment Factors in Medicare Payment.
Sebelius, K. 2010. Letter—to the Quality Care Coalition. Washington, DC: U.S. Department of Health and Human Services. http://mccollum.house.gov/images/stories/Statements2010/sebelius%20letter.pdf (accessed January 7, 2011).
Stranges, E., L. Homquist, and R. M. Andrews. 2010. Inpatient stays in rural hospitals, 2007. HCUP statistical brief #85. Rockville, MD: Agency for Healthcare Research and Quality.


