
Labor Markets and Payment Areas
Physicians and hospitals play a critical role in society, ensuring the health of the population and caring for individuals when they are the most vulnerable. At the same time that physicians and hospitals contribute to social welfare, they are also businesses that must tend to the bottom line. Whether their tax status is for profit or not-for-profit, they operate within markets not only to sell health care services but also to buy the goods and services needed in the production of health care.
The goods and services that physicians and hospitals purchase are known to economists as production inputs or production factors. The prices of some of these inputs vary geographically; the Medicare program recognizes and reflects this variation in differential payment to physicians and hospitals, which is partially adjusted by geography. The first issue in geographic adjustment is how to conceptualize and operationalize the definition of geographic areas to most accurately reflect input price differences. Labor constitutes the primary input for which the Centers for Medicare and Medicaid Services (CMS) adjust payment on the basis of geography. Because of this, the committee considers local labor markets to be the conceptual and empirical foundation of geographic adjustment.
This chapter provides a brief overview of labor markets: what they are and how they work. It then explains the committee’s findings on how well existing payment areas perform in differentiating providers on the basis of prevailing wages. Finally, the chapter lays out alternative market designations that the committee considered and explains the committee’s recommendation for using metropolitan statistical areas (MSAs) and statewide non-MSAs as the basis for labor markets for both physicians and hospitals.
Labor, land, and capital are the major factors of production (Mankiw, 2008). For health care providers, labor includes nurses, radiologic technicians, secretaries, janitors, and individuals in dozens of other occupations. Land refers to office rents and to the opportunity costs—that
is, the value derived from putting the land to other uses—of the acres on which hospitals are built. Capital consists of the vast array of equipment in use at both hospitals and physician practices. Labor is the most important input both in the overall economy and for doctors and hospitals. Labor comprises 68.8 percent of the total cost of inputs that hospitals use to produce health care (CMS, 2010a) and 71.2 percent of the cost of physician inputs (CMS, 2010b).1
The costs of some inputs used in the production of health care vary geographically, whereas others do not. The price of the medical equipment that hospitals and physicians use is generally the same across all areas, and CMS does not adjust hospital or physician payment for any geographic differences in equipment costs (MaCurdy et al., 2011). For example, it costs a hospital in Des Moines, Iowa, about the same amount to purchase a computed tomography (CT) scanner as it does for a hospital in San Diego, California, and it costs a physician in Boise, Idaho, about the same amount to purchase a blood pressure monitor as it costs a doctor in New York City.
Prices for land and labor do vary from place to place, however. Per square foot, the cost of land in Boston, Massachusetts, is greater than the cost of the same type of land in Charlotte, North Carolina. Rent reflects the price of land, as well as the cost of construction. Rent per square foot of commercial space—the type of space that a physician practice might use—costs $28.72 in Boston and $17.60 in Charlotte (REIS unpublished data, 2010). Wages represent the price of labor. Per hour, the wage of a registered nurse (RN) in San Francisco, California, is greater than the wage of an RN in Springfield, Missouri—$48 in San Francisco and $25 in Springfield (RTI unpublished analysis of Bureau of Labor Statistics [BLS] data released in May 2010). CMS adjusts payments to both hospitals and physicians for geographic differences in the price of labor and it adjusts physician payment for differences in office rent. CMS also adjusts hospital payment for capital expenditures and depreciation, using the hospital wage index (HWI).
Because labor accounts for the majority of input costs for both hospitals and physicians, the committee uses the price of labor to define geographic boundaries for input markets. Moreover, because hospitals and physicians use the same types of labor inputs drawn from all employers in a similar geographic area, the committee proposes the use of one labor market definition for both sets of providers. The physical boundaries of these markets define the extent of geographic variations in input prices so that the same adjustment can be made to the payment made to all hospitals and physicians within the market boundaries (see Box 2-1 for an explanation of how the geographic adjustments work). Thus, payment areas should group together those providers facing comparable labor prices.
When geographic adjustments to payment are considered, an important question arises: how should Medicare recognize variations in the dollar value of inputs? Should Medicare adjust provider payments for the input costs that providers actually incur, or for the prevailing market price of inputs? When Medicare began in 1966, hospitals were reimbursed on the basis of their costs after they were incurred (retrospective cost reimbursement). In 1983, the program began a move to prospective payment. Hospitals were paid a set amount for similarly sick patients; no longer was payment tied to actual hospital costs. The goal was to hold down costs by encouraging hospitals to operate more efficiently (Mayes, 2006).
Subsequently, CMS has explained in the rules governing hospital payment (the Inpatient Prospective Payment System [IPPS]) that geographic adjustment is meant to reflect differences in input prices (CMS, 2010a). If CMS or the U.S. Congress meant geographic adjustment to reflect cost variation rather than input price variation, each hospital could be assigned its own
___________
1 For hospitals with a wage index less than the national average, the labor-related share of input costs is set at 62 percent. For physicians, 18.7 percent of total input costs are office labor and 52.5 percent physician labor.
BOX 2-1
How Do the Geographic Adjustment Factors Work?
For Hospitals: For each payment area, the Centers for Medicare and Medicaid Services (CMS) collects wage data from the hospitals in the market to develop the hospital wage index (HWI). The index is a ratio centered on the value of 1 that compares average wages in each labor market with average national wages. The index is applied to a national standardized payment rate that is case-mix adjusted for each type of patient. For hospitals located in labor markets with low index values, payments are reduced; for hospitals in labor markets with high index values, payments are increased. See Chapter 3 for a full discussion of how the HWI is constructed and applied to Medicare payments.
For Physicians and Other Practitioners: Three indexes are used to adjust practitioner payments for geographic differences. These indexes are known collectively as the geographic adjustment factor (GAF), a weighted average of the geographic practice cost indexes, or GPCIs. The practice expense GPCI adjusts for price differences in physician office labor and rent; the work GPCI adjusts for geographic differences in the value of physician labor; and the malpractice GPCI adjusts for geographic differences malpractice insurance premiums. Each index works in a similar fashion to the HWI. That is, data are collected from each physician payment area, and a ratio of area costs to national costs is applied to physician payment. See Chapter 4 for more details on the GAF.
SOURCES: CMS, 2010a, 2010b.
wage index reflecting its own costs and there would have been no need to group hospitals geographically by labor market. Given this context, the precedent of prospective payment, competitive forces in the health care market for non-Medicare patients, and pressures on public budgets, the committee has concluded that Medicare payments should adjust for geographic variation in market prices of inputs and not for variation in expenditures on inputs by individual hospitals and physicians. Several important implications follow from this conclusion.
The implication for operationalizing payment areas is that providers facing similar labor input prices should be grouped together within labor markets and receive the same adjustment, based on the prevailing wages in those markets. There is also an implication for determining which industries’ wage data should be used to calculate the wage index. Currently, the HWI is calculated from wages actually paid by hospitals, as stated on the cost reports that hospitals submit to CMS each year. However, using a price index requires that wage data come from all industries in which hospitals and physicians compete for workers.
Finally, there is an implication for the types of occupations and the quantity of each occupation to be included in the indexes. This is known as occupational mix. A labor cost index reflects variation in the wages associated with any occupational mix selected by hospitals or physicians. For example, a hospital that chooses to hire all RNs and no licensed practical nurses (LPNs) would be paid for the higher wages of RNs. In contrast, a price index for wages typically reflects variation in the wages associated with a fixed quantity of personnel in each occupation, such as the national average quantity. If the average hospital uses 75 percent RNs and 25 percent LPNs, the hospital mentioned above would be reimbursed only for variation in
the wage costs associated with a 75 percent/25 percent mix2 (this issue is discussed in more detail in Chapter 3).
In general, a market is a group of buyers and sellers who make transactions for a particular good or service. A market can be global, as in the case of Internet transactions, or located in a physical place, as in the case of a shopping mall. A labor market is a type of market in which workers compete for a common set of jobs and employers compete for a common set of workers. Labor markets can be defined across many dimensions, such as occupation, industry, geography, and sector. In the case of hospitals and physician offices, where nurses, doctors, medical technicians, food service workers, janitors, and other types of employees come together in a physical location to provide personal health care services, it makes sense to define the labor market geographically.
The two major actors in any labor market are workers, who supply labor, and employers, who demand it. Upon entering a labor market, workers face many decisions, such as how much of their time to spend in activities other than work, what skills to acquire, which occupations to enter, and how much effort to apply to a job (Borjas, 2010). Workers make decisions that maximize their individual well-being; thus, each seeks a job with an optimal combination of wages, workplace amenities (such as health insurance benefits, pension generosity, on-site child care, workplace safety), and locality amenities (such as weather, recreational amenities, and leisure and cultural opportunities). These worker decisions are reflected in the labor supply. Employers also face choices and make decisions, such as which workers to hire, what wages to offer, what occupations and skill levels to employ, and how to structure a work environment. These decisions by employers reflect labor demand. Employers also seek to maximize well-being, either through the maximization of profits or, in the case of nonprofit employers, through cost minimization and achievement of mission-oriented goals. Workers and firms enter the labor market with conflicting interests. With all else being equal, workers are willing to supply more of their services when wages are high. Firms want to hire more labor when wages are low. Workers and firms effectively bid compensation up and down until a level acceptable to both parties is achieved (Borjas, 2010).
HOW AND WHY HEALTH CARE WAGES DIFFER GEOGRAPHICALLY
Geographic differences in hourly wages for workers in the same occupation can be traced to a number of factors. These include differences in productivity, ability, and experience; unionization; race and gender; the cost of living; and amenities in an area (Borjas, 2010; Ehrenberg and Smith, 1988; Moretti, 2010). Geographic differences in hourly wages, controlling for worker characteristics, have increased over time (Moretti, 2010).
___________
2 Some states have laws that dictate specific nurse-to-patient ratios and limit the scope of practice of less-skilled and lower-paid nurses. This may result in hospital costs that are not fully captured by the wage index, even though they are beyond a hospital’s control. As a federal program, Medicare’s responsibility is to purchase quality services efficiently. A price index should not accommodate state and local decisions such as staffing ratios and scope of practice laws. To do so would give states an incentive to mandate specific input quantities because the costs would be reimbursed by the federal government.
A major factor driving geographic differences in wages is the cost of housing. Expenditures on housing accounted for 41 percent of income in the year 2000. Indeed, across metropolitan areas, although there is a 41 percent difference in the nominal wages of college graduates between the 10th and 90th percentiles of the cross-metropolitan average wage distribution, this difference shrinks to 22 percent when nominal wages are deflated by a local consumer price index that reflects geographic differences in housing costs (Moretti, 2010). More generally, in an econometric analysis of the relationship between nominal wages and the cost of housing, Moretti finds further evidence that housing costs are responsible for a significant portion of geographic wage differentials for all groups of workers.
In addition to housing and the other wage determinants described above, the amenities available in a particular area may influence wages. This concept is derived from the theory of compensating wage differentials (Black, unpublished presentation to IOM Geographic Adjustment Committee, 2010; Rosen, 1986). Area amenities include good schools, sports and recreation opportunities, and theaters and museums. These amenities compensate for the high cost of living in certain areas; without such amenities, wages would need to increase to achieve equilibrium in the local labor market, holding the cost of living constant. For example, wages do not fully compensate a nurse for the cost of living in Boston. He or she is also “paid” by access to the availability of the Boston Red Sox and the Boston Symphony Orchestra. Similar to area amenities, job amenities, such as health insurance, workout rooms, and onsite child care, may compensate for a portion of wages, offsetting differences. The reverse also applies: jobs in remote areas, such as northern Alaska, pay higher wages to compensate for the remoteness and the cold temperatures in winter, and dangerous or dirty jobs pay more to compensate for risk and discomfort.
Having demonstrated how and why wages differ geographically, the discussion now turns to defining labor markets that group together those employers competing for the same workers. It is acknowledged that it is impossible to define physical boundaries with complete accuracy, and steps to address this problem are addressed in Chapter 5. The purpose of the following discussion is to understand the concept of delineating the best practicable approximation of labor market boundaries.
If markets are defined too broadly, boundaries will include hospitals and physician practices that do not compete against each other for labor and, therefore, pay different wages for the same types of workers. When boundaries are defined too broadly, hospitals and physician practices are assigned to the same labor market for the purposes of making wage adjustments, although in reality they face different wage rates for the same types of labor. A large, overly broad labor market definition will fail to identify differences in the prevailing wages faced by hospitals and physician practices, and it will contain providers with true wage indexes that vary widely.
In contrast, markets that are drawn too narrowly will separate providers that do compete for the same workers and pay the same wages for a given occupation. In this case, providers in different labor markets may actually face the same market wages. Variation of geographic index values across markets will be indistinguishable from variation of indexes within markets. Many pairs of hospitals are located near each other but are separated by a labor market boundary defined by CMS. These hospitals sometimes have significantly different wage indexes because
they are classified in separate labor markets. These differentials have become known colloquially in the health care financing literature as “wage cliffs.” Recent reports on these differentials have labeled differences of 5 to 10 percent to be small and differences of 10 percent or more to be large (Dalton, 2007; MaCurdy et al., 2010; MedPAC, 2007).
An example of a wage cliff is found in upstate New York. Northern Dutchess Hospital in Rhinebeck, New York, and Kingston Hospital in Kingston, New York, are 4 miles apart, and although their close geographic proximity should mean that they compete against each other for labor, they have different wage indexes because they are classified as operating in different labor markets. The index for Northern Dutchess Hospital is 1.14, whereas the index for Kingston Hospital is 0.91.3
Of course, any set of administrative market boundaries, especially boundaries set according to a national formula, will be imperfect. To the extent that they are observable and definable, true labor market boundaries are both irregular and fluid. As compensation levels change, so will theoretical market boundaries. Moreover, at some wage levels, workers can be enticed to commute across market “boundaries” to work at hospitals in other labor markets. Such decisions will change as personal preferences change—for example, the desire to spend more time with children—and as the cost of commuting changes because of technology and infrastructure development. For these reasons, the committee views drawing labor market boundaries as an exercise in approximation.
A related dimension of market definition has to do with the industries from which wage data are drawn to construct geographic adjustment indexes. In principle, to accurately reflect the prevailing wages faced by hospitals and physicians in a given area, the wage data used to create the adjusters should come from all employers that compete for the types of labor used in hospitals and physician practices. Given that hospitals and physicians employ a broad spectrum of workers—from food service workers to accountants—all industries contribute information to the prevailing wages faced by hospitals and physicians.
Hospital Payment Areas
The labor markets4 used for the current HWI come from the set of statistical areas designed by the president’s Office of Management and Budget (OMB) for the purpose of collecting federal statistics. Other agencies and organizations commonly use these statistical areas for economic purposes because they reflect the economic integration of a set of geographic areas. OMB statistical areas include MSAs and micropolitan statistical areas (microSAs) (see Figure 2-1). Each is a collection of one or more central metropolitan areas connected to outlying counties based on commuting for employment between the central area and outer counties.
To construct payment areas for hospitals, CMS divides the country geographically into MSAs and statewide non-MSAs.5 CMS includes microSAs as part of statewide non-MSA payment areas. Each of the payment areas is assigned a wage index value. There are currently 441
___________
3 These wage indexes are computed on the basis of FY 2011 HWI data (downloaded from the CMS website) before reclassification and other adjustments and are normalized to account for the index data and construction.
4 Throughout the chapter, the terms “labor market” and “payment area” may be used interchangeably.
5 This report refers to an area within a state that is not encompassed within an MSA as a residual statewide area, a non-MSA, a “rest-of-state” area, or a “balance-of-state” area.
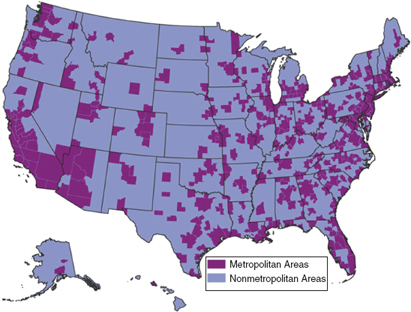
FIGURE 2-1 Metropolitan and nonmetropolitan areas in the United States.
SOURCE: RTI analysis of data from ESRI, California, USA. This map uses U.S. Core Based Statistical Areas (CBSAs) to represent metropolitan areas. CBSAs are geographic entities, defined by the U.S. Office of Management and Budget for use by federal statistical agencies, based on the concept of a core area with a large population nucleus, plus adjacent communities having a high degree of economic and social integration with that core. All other areas on the map are considered nonmetropolitan.
wage index payment areas—392 MSAs (or metropolitan divisions) and 49 statewide non-MSAs6 (see Box 2-2).
Physician Payment Localities
Currently, the geographic adjustment factor (GAF) applied to physician payments is based on a completely different set of geographic definitions called “physician payment areas.” There are 89 areas, including 34 statewide areas (see Figure 1-5, in Chapter 1). The current set of payment areas is a consolidation of the 240 areas designed by Medicare carriers (health plans that contracted with Medicare to process claims) at the inception of Medicare in 1966. These areas came out of the carriers’ knowledge of local medical practice and charge-based billing
___________
6 CMS produces a county-to-MSA crosswalk file each year as part of its wage index documentation. The current version of this file identifies 392 MSAs, including Puerto Rico but no other territories (Wage Index and Capital Geographic Adjustment Factor [GAF] for Acute Care Hospitals in Urban Areas by CBSA and by State—FY 2011). In some analyses and tables in this report, the number of MSA payment areas differs from 441 if the analysis excludes payment areas without Inpatient Prospective Payment System (IPPS) hospitals.
BOX 2-2
Metropolitan and Micropolitan Statistical Areas
Statistical areas are geographic delineations of population centers designed by the federal government for the purpose of collecting federal statistics. They were created 60 years ago by the Bureau of the Budget to standardize the metropolitan areas for which various federal agencies collect statistics. Metropolitan statistical areas (MSAs) and micropolitan statistical areas (microSAs) are two types of statistical areas. Because MSAs and microSAs reflect economic integration, they have been adopted for purposes other than the collection of statistics, such as funding federal programs.
Since Medicare moved from cost-based to prospective payment in 1983, the Centers for Medicare and Medicaid Services (CMS) has used MSAs and statewide non-MSAs to delineate areas whereby Medicare payment to hospitals should be adjusted for geographic differences in wages. CMS classifies microSAs with statewide non-MSA payment areas. Statewide non-MSAs include all areas within a given state that are not categorized as MSAs.
Conceptually, an MSA is an area containing a large population nucleus and adjacent counties that have a high degree of integration with the nucleus. A microSA is similar to an MSA but has a smaller nucleus. The nucleus of an MSA has a population of at least 50,000. The nucleus of a microSA has a population of 10,000 to 49,999. The collective term to describe MSAs and microSAs is “core-based statistical area” (CBSA).
CBSAs are composed of counties. The central county or counties are defined by the nucleus. An outlying county qualifies as part of a CBSA by meeting one of two criteria: (1) at least 25 percent of the outlying county’s working residents commute to the central county, or (2) at least 25 percent of the outlying county’s workforce commutes in from the central county.
Other types of statistical areas are defined by the Office of Management and Budget (OMB):
- In New England, CBSAs are called New England City and Town Areas (NECTAs) because they are built around towns and cities, rather than counties. In this chapter, the term MSA includes NECTAs.
- Eleven MSAs are so large that they are divided into metropolitan divisions, and CMS uses the divisions as wage index payment areas.
- Adjacent CBSAs can be grouped into combined statistical areas (CSAs) on the basis of commuting between the CBSAs.
Standards for defining statistical areas are revised every 10 years, and OMB announces delineations of areas on the basis of the new standards several years later. OMB last revised the definitional standards for statistical areas in 2010 and plans to announce new delineations of statistical areas in 2013. Although definitional standards change only once a decade, the delineation of counties into statistical areas can change annually with changes in population and employment patterns.
SOURCES: CMS, 2010a; OMB, 2010.
patterns (GAO, 2007), but they were created using different geographic delineations, including zip codes, MSAs, cities, towns, and states (CMS, 1993). The original 240 physician payment areas included 16 statewide areas. The number of payment areas was reduced to 210 in the early 1990s, when CMS allowed state medical associations to merge multiple payment areas into single statewide areas if they demonstrated overwhelming statewide physician support.
This increased the number of statewide areas to 22. In 1997, CMS reduced the total number of payment areas to the current 89, increasing the number of statewide areas to the current 34 (see Figure 1-5, in Chapter 1).
At the inception of Medicare, CMS did not attempt to design these areas as representations of labor markets or even wholly on the basis of provider cost variation. Rather, the agency allowed carriers to use their existing payment areas. When CMS set about to redesign areas in the 1990s, it cited inconsistencies in the carrier-based methodology (CMS, 1996) but proceeded to use three different methodologies to consolidate areas: consolidation within statewide areas, consolidation of existing areas, and abolishment and creation of new areas (GAO, 2007).
Consolidation Within Statewide Areas
CMS consolidated payment areas within a state into one statewide area if state medical associations could demonstrate overwhelming support among physicians. Payment areas in six states were consolidated this way (GAO, 2007). Statewide areas generally increase the GAF for physicians in non-MSAs and decrease it for physicians in MSAs. To consider a request for consolidation of multiple payment areas in a state, CMS required the following: a formal request for change from the state medical society, including a recently adopted resolution requesting the change; the number of licensed physicians in the state who were members of the association, and the total number of licensed physicians in the state; the number of state medical association members in each county medical society; and letters from the local medical societies where consolidation decreased payment indicating the level of support for the change. CMS also said it would not set specific numerical levels of support because each state area structure was unique, and discretion was needed (CMS, 1994).
Consolidation of Existing Areas
CMS consolidated areas in 25 states with multiple areas by using an iterative ranking methodology. In each of these states, the carrier areas were ranked on the basis of their GAFs. The GAF of the highest-cost area was compared with the weighted average GAF of the remaining areas, and if the difference was greater than 5 percent, the highest-cost area remained a separate payment area. The process was repeated for the second costliest area, and so on, until the difference fell below 5 percent. At this point, the areas that had not been pulled out were grouped into a rest-of-state payment area. Areas in 12 states were made into statewide payment areas because no areas exceeded the 5 percent threshold.
Abolishment and Creation of New Areas
CMS created new, county-based areas in three states with multiple areas, stating that the consolidation methodology created inaccurate results. These states were Massachusetts, Missouri, and Pennsylvania. Generally, to create the new payment areas, central counties within an MSA were grouped into separate areas and the remaining counties were assigned to a rest-of-state area (GAO, 2007).
In addition to the use of inconsistent methodologies, the Government Accountability Office (GAO) criticized CMS for failures of evaluation. GAO (2007) faulted the agency for not evaluating the accuracy of payment areas in states with multiple areas before rolling them
into consolidated counties, and for using inconsistent criteria for assessing the accuracy of the newly created areas against consolidated areas. To assess accuracy, CMS examined the absolute difference between the average GAF of each county and the average GAF of the county’s payment area. By using the consolidation methodology, the average payment differences in the three states in which new areas were created would have ranged from 3.16 to 3.90. However, two states in which areas were consolidated, Kansas and Virginia, had average payment inaccuracies within the same range. GAO (2007) also noted the absence of a policy to regularly update the payment areas, meaning some had not been changed for 40 years.
COMMITTEE ASSESSMENT OF EXISTING PAYMENT AREAS
Hospital Payment Areas
The MSA geographic classification system is a reasonable method for determining hospital labor markets because MSAs are defined according to where people work. The definition has inherent logic for the challenging task of drawing geographic labor market boundaries. However, the methodology may perform better for hospitals in MSAs than for hospitals in non-MSAs.
The general concept of an MSA is that of a core area of counties containing a substantial population nucleus, together with adjacent counties having a high degree of economic and social integration with that core (OMB, 2010). Specifically, an outlying county qualifies as part of an MSA if 25 percent of the outlying county’s working residents commute to the core of the MSA, or if 25 percent of the outlying county’s workers commute from the core (OMB, 2010). Commuting into the core is a reflection of employers in the core of a metropolitan area drawing labor at least partially from outlying counties. Likewise, commuting from the core reflects the fact that employers in the outer counties draw workers from the metropolitan core. Thus, an MSA represents a group of employers and employees transacting employment relationships and is a reasonable proxy for a labor market.
In addition to the inherent logic of using the MSA as a labor market proxy, many federal agencies and other entities have used MSAs for many years for a wide range of economic purposes. For example, the OMB uses MSAs to define pay areas for federal employees, and the U.S. Department of Housing and Urban Development (HUD) uses MSAs, in part, to determine the eligibility of city and county governments to receive Community Development Block Grant funding (GAO, 2004). Because MSAs are already in widespread use for statistical summaries and economic purposes, using MSAs, rather than a designation unique to CMS, provides a basis for comparison with other uses.
The committee used a number of measures to assess how well MSA-based and other systems perform in grouping together hospitals that face similar prevailing wages. One of these measures is the number of markets created by a classification system. A larger number of smaller markets can distinguish wage differences better than a smaller number of larger areas can. However, a larger number of markets also means more borders and, therefore, the potential for boundary problems. The MSA/statewide non-MSA system includes 441 markets, intermediate in number among labor market alternatives, as seen in Table 2-1.
Another way to assess the overall ability of a classification system to group hospitals that operate in the same labor market is to assess the relative ability of classification systems to differentiate hospitals on the basis of their existing wage indexes. It is important to note that this
TABLE 2-1 Percent of Variation in Hospital Wages Explained by Alternative Wage Area
|
|
||||
| Labor Market Area | Number of Hospitals | Number of Areas | Number of Hospitals Per Area | % of Variation Explained (R2) |
|
|
||||
| State | 3,413 | 53 | 64.4 | 0.581 |
| MSA/statewide non-MSA | 3,413 | 438 | 7.8 | 0.829 |
| CBSA/statewide non-CBSA Area | 3,413 | 922 | 3.7 | 0.843 |
| County | 3,413 | 1,596 | 2.1 | 0.873 |
| 2-digit zip code | 3,413 | 99 | 34.5 | 0.751 |
| 3-digit zip code | 3,413 | 825 | 4.1 | 0.862 |
| 4-digit zip code | 3,413 | 2,341 | 1.5 | 0.942 |
| 5-digit zip code | 3,413 | 3,100 | 1.1 | 0.984 |
| Hospital referral region | 3,363 | 306 | 11.0 | 0.787 |
| Hospital service area | 3,363 | 2,148 | 1.6 | 0.908 |
|
|
||||
NOTE: CBSA = Core-Based Statistical Area, an umbrella term that includes MSAs and MicroSAs. MSA = Metropolitan Statistical Area. Statewide/non-MSA includes Micropolitan Statistical Areas (MicroSAs).
SOURCE: RTI analysis of CMS Hospital Wage Index Files.
is only an approximate way of assessing the classification system because existing wage indexes for hospitals are based on costs actually incurred rather than prevailing market wages.
Table 2-1 shows that of the total variation in hospital wages in the current HWI, 83 percent is explained by variation across MSAs. The remaining 17 percent of variation is explained by factors within labor market boundaries.
A third way to assess the accuracy of the MSA-based classification system is to examine the resulting wage index differentials, or wage cliffs. Hospitals on both sides of an MSA border that creates wage cliffs are likely to compete for the same workers but receive very different wage indexes. Wage cliffs can occur at the borders of MSAs and statewide non-MSAs and at borders where two MSAs meet. The latter is the case for the upstate New York hospitals cited in the example above. Northern Dutchess Hospital is located in Rhinebeck, New York, and is part of the Poughkeepsie MSA, and Kingston Hospital lies in the adjacent Kingston MSA.
Table 2-2 shows the number of hospitals that experience all types of wage cliffs. More than 1,709 hospital pairs are located within 25 miles of each other but have wage index differences of at least 0.10, which is considered a large difference. More than 2,500 hospital pairs have wage index differences of at least 0.05, including both small and large differences.7
The converse to the problem of wage cliffs is the problem of wage gradients within a single payment area. This situation occurs when the wage index assigned to a payment area does not adequately reflect the fact that multiple true labor markets lie within the payment area. Single statewide labor markets are likely to contain wage gradients, particularly in large western states where hospitals within the same statewide area can be separated by hundreds of miles yet receive the same wage index. Within an MSA, hospitals in core metropolitan areas
___________
7 These wage indexes are on the basis of FY 2011 HWI data (downloaded from the CMS website) before reclassification and other adjustments and are normalized to account for the index data and construction.
TABLE 2-2 Number of Hospital Pairs with Small and Large Wage Differences
|
|
|||
| Distance Between Hospitals (Miles) |
Small Wage Differences (0.05-0.10) |
Large Wage Differences (>0.10) |
Total |
|
|
|||
| 1 | 0 | 0 | 0 |
| 5 | 7 | 23 | 30 |
| 10 | 93 | 152 | 245 |
| 25 | 1,761 | 1,709 | 2,570 |
|
|
|||
NOTE: Wage indexes are constructed without reclassification and other adjustments and normalized to account for the index data and construction.
SOURCE: Committee analysis of CMS FY 2011 Hospital Wage Index files.
may compete for different workers than suburban hospitals do, yet all hospitals in the MSA have the same wage index.
These labor market definitional problems are not new. Throughout the 1980s and early 1990s, the Prospective Payment Assessment Commission (ProPAC) (since integrated into the Medicare Payment Advisory Commission) issued numerous reports criticizing the labor markets for reasons similar to those described above (Dalton, 2007; ProPAC, 1985, 1986, 1987, 1993; Wellever et al., 1994; Williams et al., 1990). A number of changes were proposed, but none was ever adopted (see Box 2-3).
Some of these labor market definitional problems have been attenuated since the U.S. Congress allowed hospitals to appeal their labor market classifications beginning in 1988, when hospitals in non-MSAs were allowed to reclassify. Two-thirds of these hospitals appealed their classifications immediately. CMS allowed all hospitals to appeal for reclassification beginning in 1992, with the creation of the Medicare Geographic Classification Review Board (MGCRB). Any hospital that demonstrates that it meets a predetermined set of criteria is granted reclassification. The criteria require geographic proximity to the payment area to which reclassification is sought and comparability of wages with the hospital wages in the new payment area.
Subsequent to providing for reclassification, Congress instituted other ways in which hospitals could change the wage indexes that they received as a result of their labor market classification. Because the total amount of Medicare expenditures must remain constant by law, the costs of these reclassifications and exceptions are effectively paid for by other hospitals. Box 2-4 lists the specific criteria for reclassification and other exceptions.
Wage Data
So far, discussion of labor market definitions has focused on the geographic component. The selection of industries from which wage data are used to construct each area’s wage index is also critical to the definition of a labor market and its performance.8 To properly reflect the prevailing wages faced by hospitals in an area, the wage data used to create the HWI should come from all employers that compete for hospital workers. As stated above, the current HWI is constructed using wage data only from hospitals, yet hospitals recruit employees—both skilled health care professionals and nonskilled workers—from beyond their own walls. An RN
___________
8 In addition to the choice of industries from which to draw data, an index requires weights with which to assign relative importance to occupations. This is discussed in Chapter 3.
In 1987, the Prospective Payment Assessment Commission (ProPAC) proposed creating additional market areas in both metropolitan statistical areas (MSAs) and statewide non-MSA statewide areas. Within MSAs, metropolitan areas would be separated from outlying counties; in non-MSA rest-of-state areas, urbanized counties (those with a city or town having a population of at least 25,000) would be separated from nonmetropolitan counties. This proposal was based on a report by ProPAC stating that hospitals in MSA core areas paid 16 percent more in wages than hospitals in MSA suburban areas did and that hospitals in urbanized non-MSA counties paid 8.5 percent more in wages than did hospitals in other non-MSA counties (Schmitz, 1987). In a report for CMS, Cromwell and colleagues (1986) showed that hospitals in non-MSA counties adjacent to MSAs paid, on average, 2.4 percent more wages than did hospitals in other non-MSA counties. About 20 percent of the variation in wages was explained by housing costs, and another 20 percent was explained by hospital characteristics for which other index or payment formula adjustments now account (e.g., differences in occupational mix, part-time versus full-time employment, case mix, and teaching status). The remaining 60 percent of wage variation was unexplained (Wellever et al., 1994).
In 1990, Wright and Marlor proposed testing the product markets and labor markets developed by the U.S. Department of Agriculture for Inpatient Prospective Payment System (IPPS) use (Wright and Marlor, 1990). In 1993, ProPAC recommended assigning to each hospital a specific wage index, based on the wages of surrounding hospitals. This was known as the “nearest-neighbor” approach. The surrounding hospitals could be chosen on the basis of a predetermined number of hospitals, those hospitals within a fixed radius on the basis of air miles, or a hybrid approach (ProPAC, 1993).
In response to the above and other proposals, CMS concluded that alternative market definitions performed no better than did MSAs and statewide non-MSAs in segregating hospitals with comparable wages (MaCurdy et al., 2010). In response to the nearest-neighbor proposal, CMS said in its IPPS proposed rule for 1994 that legislation was required for implementation and that although the proposal held promise, “careful analysis of its impact on hospitals is necessary before proposing to adopt such a significant change” (CMS, 1993). The rule asked for comments on aspects of the nearest neighbor proposal and related proposals, and CMS published an analysis of nine alternative market proposals in the next year’s rule (CMS, 1994). These included several approaches devised by CMS: two hybrid approaches that combine the nearest-neighbor approach with MSAs and a state labor markets option (SLMO), in which hospitals within a state could design their own markets. The SLMO was based on a belief that “hospitals within a state may have better information regarding market conditions than HCFA [Health Care Financing Administration]” (Wellever et al., 1994). (HCFA is now CMS.) The agency reviewed the proposals on the basis of the degree of wage conformity within markets and across market boundaries and on the basis of redistributional impact and concluded that none of the alternatives was an improvement over the current MSA/statewide non-MSA system. CMS also said that it could not redefine market areas without congressional authority (Wellever et al., 1994).
BOX 2-4
Reclassifications and Exceptions
Methods of computing the current wage index may lead to large differences (known as “wage cliffs”) in Medicare payments among neighboring hospitals that compete in the same labor market. Several reclassifications and exceptions attempt to minimize wage cliffs by increasing payments to hospitals that meet specific criteria:
Medicare Geographic Classification Review Board (MGCRB): MGCRB evaluates applications from hospitals that seek reclassification. Hospitals must meet proximity and wage comparability criteria established by the Omnibus Budget Reconciliation Act of 1989 (P.L. 101-239).
Section 508 of the Medicare Modernization Act of 2003 (MMA): Section 508 of the MMA allows MGCRB to grant a one-time reclassification on the basis of criteria defined by the Secretary of the U.S. Department of Health and Human Services (P.L. 108-173).
Section 505 of MMA: Section 505 of the MMA authorizes an upward wage index adjustment for nonreclassified hospitals located in counties where at least 10 percent of hospital workers commute into higher wage index areas to work (P.L. 108-173).
Lugar County: This provision allows an upward adjustment to a hospital’s HWI if it is near more than one MSA and more than 25 percent of its residents commute to and work in those MSAs (P.L. 100-203).
Rural Floor: The Balanced Budget Act of 1997 declares that the wage index for urban hospitals in a state cannot be less than that state’s rural wage index (P.L. 105-33).
Urban to Rural Reclassification: An urban hospital can be considered rural if it is located in a rural census tract and/or qualifies as a “special hospital” (P.L. 106-113).
1109 Qualifying Hospitals: 1109 qualifying hospitals will have received $400 million in fiscal years 2011 and 2012 if they are located in counties that spend the least amount of money on benefits (under Medicare Parts A and B), taking into account the age, sex, and race demographics of each county (House Resolution 3590).
Floor for Frontier States: The wage index cannot be lower than 1.0 for all frontier states, which include Montana, Nevada, North Dakota, South Dakota, and Wyoming (CMS, 2010a).
might work for a school or a manufacturing firm, for example, as well as a physician practice or a hospital. An orderly or a janitor can work in nearly any industry. Thus, the wages paid by hospitals in each area are determined by the wages paid by all industries in the area.
In addition to respecting the fundamental definition of a labor market, use of data from non-hospital workers helps to solve the practical problems of volatility and circularity in the HWI. “Volatility” is the term used to describe sharp year-to-year fluctuations in the wage index after, for example, a sudden change in the local supply of certain occupations or hospital adoption of a new union contract that raises wages significantly. “Circularity” is defined as the ability of hospitals to have undue influence over their own wage indexes. When wage source data are
restricted to hospitals, volatility and circularity are particularly problematic in markets having only one or two hospitals.
Physician Payment Areas
The system of physician payment areas currently used by CMS has fundamental conceptual problems that reach back to the beginning of Medicare. First, the areas are based on a system that reflects physician charges rather than geographic differences in the prices of inputs faced by physicians. Second, the statewide areas bear little, if any, resemblance to input price markets. States are geopolitical units where, in many cases, geographically defined differences in input prices clearly exist across areas within states and where, in other cases, geographic input price markets cross state lines. Third, the payment areas are constructed on the basis of inconsistent methodologies.
As with hospitals, physician payment areas should group physician practices that face similar input prices. Analyses to examine how well a geographic classification system performs are complicated by two factors: (1) physicians do not report their costs to CMS as hospitals do, and (2) there are many more physician practices than hospitals. One method that has been used to measure accuracy is to compute a GAF for each county and compare the county GAF to the payment area GAF to which this county is assigned.
GAO performed this analysis and found significant intra-area variation in practice costs (GAO, 2007). In more than half of the payment areas, costs in at least one constituent county differed from the payment area average by more than 5 percent (which GAO labeled a “large payment difference”). Overall, 447 counties, representing 14 percent of all counties, had large payment differences.9 Counties with large differences were located across the United States, but 60 percent were located in five states: California, Georgia, Minnesota, Ohio, and Virginia.
GAO (2007) attributed these large differences in the GAFs between counties and the payment areas to which they belong to the mixed methods used by CMS in developing physician payment areas and the agency’s preference for statewide areas, as described above. The differences occur because many physician payment areas combine counties with very different input costs (GAO, 2007).
On the basis of the evidence presented above, the committee concludes that geographic practic cost index (GPCI) payment areas are conceptually and empirically problematic. The payment areas began as a mixture of geographic areas more closely related to product than to labor markets and were further consolidated on the basis of several different rationales that did not emphasize accuracy in payment. This has resulted in the inaccuracies cited above, and it led this committee to propose a set of areas that are consistent with hospital markets, increasing the number of physician payment areas from the current 89 to 441 (the number of hospital payment areas).
___________
9 The finding is based on a computation of relative GAFs using 2000 data from the Bureau of the Census, FY 2006 U.S. Department of Housing and Urban Development data, and 2005 CMS data to calculate county-specific GAFs using the same methodology that CMS used in its 2005 update to the GPCIs.
ALTERNATIVE LABOR MARKET OPTIONS CONSIDERED BY THE COMMITTEE
Options for the Hospital Wage Index
The committee examined previously developed hospital labor market definitions, keeping in mind how these definitions would also work for physician practices. In general, the array of potential hospital market definitions can be classified as either (1) geopolitical units or variants thereof or (2) markets specific to individual hospitals. The first category includes single geopolitical units (e.g., counties), geopolitical units aggregated on the basis of economic measures (e.g., MSAs), and geopolitical units aggregated on the basis of the consumption of health care products (e.g., hospital service areas [HSAs]). The second category refers to a system in which a health care market is defined for each individual hospital on the basis of the hospital’s characteristics. These definitions have been used for a number of purposes: government agencies use them to distribute payments, courts use them to decide antitrust issues in hospital merger cases, and economists use them to test economic theory (MaCurdy et al., 2010).
Because single geopolitical units, such as counties and states, have no intrinsic relationship to labor markets, the committee eliminated them from consideration as viable payment areas. The committee discussed the use of aggregated geopolitical units defined by input markets or by consumer consumption of health care and ways of defining labor markets using hospital-specific factors. The alternatives were assessed on the basis of various criteria: the number of payment areas created (a greater number of payment areas may increase not only accuracy but also the number of boundaries and the opportunity for wage cliffs); the number of hospitals within each area; and the percentage of variation in wages reported by hospitals that is explained by each alternative classification system.
Beginning with the hospital-specific category, the committee discussed the concept of assigning a specific wage index to each hospital. This approach is similar to the “nearest-neighbor” approach discussed above but is based on spatial correlations between hospitals computed using geographic information system (GIS) technology. This method essentially improves the accuracy and flexibility of the nearest-neighbor method. The committee decided against this approach because it would not be widely understood. Creating as many payment areas as hospitals would result in thousands of payment areas, which would be a burdensome and impractical system. The spatial adjustment approach would mean reliance on a mathematical system rather than actual market data, creating many opportunities for challenges. The spatial adjustment approach would be particularly impractical for defining physician practice labor markets.
The committee also examined the use of two product markets: HSAs and hospital referral regions (HRRs). HSAs, developed by the Dartmouth Atlas Project, are a collection of zip codes based on consumption of hospital care. HRRs are aggregates of HSAs based on consumption of cardiac and neurosurgical services (Dartmouth, 2011). As illustrated in Table 2-1, HSAs account for 91 percent of the total variation in reported hospital costs, but there are more than 2,000 HSAs and only 1.6 hospitals in each, on average. HRRs are fewer in total number (n = 306) each with an average of 11 hospitals (Dartmouth, 2011). HRRs explain 78 percent of the variation in hospital costs, which is less than the percentages for other viable alternatives. Also, HSAs and HRRs define product markets, which may not correspond well with actual labor markets. Another product market developed by Dartmouth is the Primary Care Service Area (PCSA), which the committee did not evaluate. There are 6,542 PCSAs, which are collections of zip codes that reflect where Medicare patients receive primary care (Dartmouth, 2007).
The committee also discussed the use of geopolitical units based on economic measures, specifically MSAs. The committee favored their use as labor market proxies because they are easy to understand, widely used, and based on labor market activity, as embodied in commuting patterns (OMB, 2010). The committee concluded that the number of MSA-based labor markets (n = 441) is manageable and that they contain enough hospitals, on average (7.8), to largely address problems of volatility and circularity, especially in combination with extending the source of wage data to other health care providers. In addition, the MSA/statewide non-MSA classification system explains a reasonable amount of variation in hospital wages (83 percent) compared with other systems.
The committee acknowledges problems with using the rest-of-state areas as labor market proxies, particularly in areas adjacent to MSAs; county-based smoothing methods based on cross-MSA commuting of hospital workers, as discussed in Chapter 4, are designed to resolve many of these issues. County-based smoothing would raise the wage index for hospitals in rest-of-state counties that compete for workers living in adjacent counties located within an MSA. The committee also discussed the use of labor market areas (LMAs) as a solution. LMAs are the geographic divisions used by the BLS for collecting employment statistics in statewide non-MSAs. The advantage of LMAs is that they cross the same state boundaries that commercial centers do, similar to MSAs. However, LMA design methodology varies from state to state (IOM meeting with BLS, February 11, 2011). In the time allotted to prepare this report, the committee was not able to compare the strengths and weaknesses of LMAs relative to statewide non-MSAs, but such a comparison would be useful.
The committee discussed the issue of wage gradients within MSAs and the related incentive for hospitals to move from urban to suburban areas where they might pay lower wages but retain the same level of payment. The committee considered smoothing of wage index values (discussed in Chapter 4) as a potential solution. (Investigation of hospital relocation was not specifically part of the committee’s scope of task or feasible within the report’s time frame.)
If smoothing were applied so that both positive and negative index adjustments were made based on commuting patterns, wage indexes in suburban counties would decline in some suburban MSA counties where hospital workers commute into non-MSA counties. This would address within-MSA wage variation—namely, hospitals in core metropolitan areas that face higher wages than suburban hospitals located in different counties but within the same MSA—by resulting in a wage index that is higher in the core metropolitan county and lower in the suburban county. The committee acknowledges that intra-county wage variation could remain a problem in MSA counties where there are significant differences between core metropolitan and suburban wage levels.
Options for Physician Payment Areas
The committee considered several criteria in evaluating input markets for physician payment areas, including: consistency across the hospital and physician markets, the administrative burden posed by the classification system, and the economic integration represented by the system.
Given the requirements for functional labor markets described above—to identify the areas in which hospitals and physicians compete for workers—the committee could find little justification for defining physician labor markets differently from hospital labor markets since hospitals and physicians draw labor from essentially the same pool of workers.
The occupations used by hospitals and physician offices have substantial overlap, as shown in Table 2-3. The top 10 occupations used by physician offices are also used by hospitals, with RNs and LPNs comprising a significant share of each workforce.
Moreover, wages across hospitals and physician offices are similar, particularly for RNs. Table 2-4 shows that, on average nationally, RNs make $32.57 in hospitals and $32.35 in physician offices. In occupations where slight differences exist, shorter commutes, lower work intensity, and other job characteristics likely explain the wage differentials. Although some workers might prefer working for one provider versus another at a given wage, the facts above suggest that hospitals, physicians, and their employees transact employment relationships in the same geographic labor markets. Indeed, the labor market for hospital and physician practice
TABLE 2-3 Overlap in Occupations Used in Physician Practices and Hospitals
|
|
||
| Top 10 Occupations in Physician Practices | Share of Physician Office Labor (%) |
Share of Hospital Labor (%) |
|
|
||
| Medical assistants | 16.5 | 1.2 |
| Registered nurses | 12.0 | 30.1 |
| Receptionists and information clerks | 9.7 | 0.8 |
| Medical secretaries | 9.5 | 2.3 |
| Billing and posting clerks and machine operators | 4.8 | 0.9 |
| Licensed practical and vocational nurses | 4.8 | 3.2 |
| First line supervisors/managers of office and admin. support workers | 4.0 | 0.8 |
| Office clerks, general | 3.9 | 2.0 |
| Secretaries, except legal, medical and executive | 2.9 | 1.3 |
| Radiologic technologists and technicians | 2.4 | 2.6 |
|
|
||
NOTE: Occupation titles come from the Standard Occupational Classification System used by the Bureau of Labor
SOURCE: RTI analysis of BLS Occupational Employment Series data released in 2010.
TABLE 2-4 National Average Hourly Wage (dollars) by Health Sector
|
|
|||||||
| Occupations | All Employer Mean Hourly Wage | Health Sector Mean Hourly Wage | Hospitals | Physician Offices | Ambulatory Care (all settings) |
Nursing Facilities | Home Health |
|
|
|||||||
|
Registered nurses |
31.99 | 32.02 | 32.57 | 32.35 | 31.63 | 28.52 | 30.43 |
|
Licensed vocational nurses |
19.66 | 19.58 | 19.25 | 17.68 | 18.88 | 20.34 | 20.33 |
|
Nursing aides, orderlies |
12.01 | 11.89 | 12.74 | 12.36 | 11.69 | 11.58 | 11.09 |
|
Radiologic technologists and technicians |
26.05 | 25.99 | 26.36 | 24.45 | 25.33 | 23.11 | 23.05 |
|
Medical record and health information specialists |
16.29 | 15.77 | 17.24 | 13.69 | 14.05 | 15.92 | 15.40 |
|
Medical secretaries |
15.12 | 15.11 | 15.19 | 14.64 | 15.10 | 14.52 | 14.31 |
|
Bill and account collectors |
15.65 | 15.89 | 15.50 | 15.87 | 15.99 | 18.22 | 16.65 |
|
|
|||||||
SOURCE: RTI analysis of BLS tabulations of Occupational Employment Series data released in 2010.
|
|
||||
| Amount of Difference | ||||
| Payment Area GAF | >5% | >10% | ||
|
|
||||
| MSA GAFa (without congressional mandates) | 108 | 14 | ||
| Current area GAFb (without congressional mandates) | 475 | 6 | ||
| Current area GAFc (with congressional mandates) | 1,809 | 106 | ||
|
|
||||
NOTE: MSA = metropolitan statistical area. The county level, the locality level, and MSA actual geographic adjustment factors (GAFs) were derived from county level 2012 fully transitioned geographic practice cost indexes (GPCIs) that were calculated by the Centers for Medicare and Medicaid Services (CMS) and Acumen. The 2010 GAF contains a 1.0 work GPCI floor, reflects one-half the rent and employee compensation components of the practice expense GPCI, and a 1.5 work GPCI floor in Alaska.
a Created from actual county-level GPCIs and GAFs.
b Created from actual county-level GPCIs and GAFs.
c From July 2010 Federal Register GAFs.
SOURCE: RTI analysis of CMS and Acumen data.
employees extends beyond hospitals and physicians. As seen in Table 2-4, wages for health sector employees and all employees are nearly identical.
One way to assess the ability of MSAs to group physicians facing similar wages is to compare the difference in the current adjustment factor between each county and the MSA/non-MSA labor market in which the county is located, similar to what was done in the GAO analysis described above. RTI performed this analysis for the committee with data published by CMS to be used for the calculation of the 2010 GAF. As shown in Table 2-5, the difference between the GAF computed at the county level and the GAF computed at the MSA/non-MSA level is greater than 5 percent for only 108 counties, whereas the number is 475 counties under the existing payment area system.10 When GAFs are computed for current payment areas that account for congressionally mandated restrictions on GAF variation,11 the number of counties at or above the 5 percent threshold difference is 1,809 under the current payment area system (RTI analysis for the IOM, 2010).
The use of MSAs instead of the current areas increases the number of physician payment areas from the current 89 to 441: 392 MSAs and 49 rest-of-state areas (see Table 2-6). The increase in the number of payment areas is due to the recognition of all MSAs as labor markets and to the decomposition of current statewide areas into MSA and statewide non-MSA payment areas. For example, the San Diego, California MSA becomes its own labor market instead of being grouped with the California rest-of-state area, and North Carolina, now a statewide area, is divided into 15 MSAs and one residual state area.
The committee was concerned about the potential for increased administrative burden posed by a larger number of physician localities. It is difficult to determine if a larger number of areas would create an additional burden. A larger number of areas increases the number of boundaries, which increases the potential for complaints about boundary differences that CMS
___________
10 Computed without congressionally mandated floors of work and practice expense GPCIs. County-level, locality-level, and MSA actual GAFs were derived by RTI from county-level GAFs that were calculated by CMS and Acumen.
11 Computed with congressionally mandated work and practice expense floors. Data obtained from Addendum D (pages 40643–40645) of the Proposed Rule (Federal Register Vol. 75, No. 133, July 13, 2010).
| Basis of Payment Areas | Number of Payment Areas | |
| Current Areas | ||
| Total | 89 | |
| Statewide non-MSA | 36 | |
| Defined | 37 | |
| Rest of State | 16 | |
| MSA | ||
| Total | 442 | |
| MSA | 392 | |
| Statewide non-MSA | 49 | |
| Statewide | 1 | |
| Ranked iterative MSA (3% threshold) | ||
| Total | 180 | |
| MSA | 130 | |
| Statewide non-MSA | 41 | |
| Rest of State | 9 | |
NOTE: The county level, the locality level, and MSA actual geographic adjustment factors (GAFs) were derived from county level 2012 fully transitioned geographic practice cost indexes (GPCIs) that were calculated by the Centers for Medicare and Medicaid Services (CMS) and Acumen. Under the current system of physician payment areas, Puerto Rico and the Virgin Islands are classified as statewide, and the District of Columbia area includes counties in Maryland, Virginia, and West Virginia, as well as the District of Columbia itself. In MSA-based methods, the Virgin Islands MSA is statewide, Puerto Rico has several MSAs, and the DC MSA includes counties in other states. The MSA total in this table differs from the total of 441 cited in the text. The total in the table includes the Virgin Islands as a statewide MSA payment area, while the total cited in the text does not.
SOURCE: RTI analysis of CMS and Acumen data.
might have to address. However, any potential increase in administrative burden might be mitigated by having consistency across hospital and physician payment areas.
For comparative purposes, the committee examined an adapted MSA-based approach in which high-cost MSAs are pulled out of existing states and made separate. This adapted approach used an iterative method, similar to the method CMS used in the mid-1990s to consolidate the number of physician payment areas. The iterative approach (using a 3 percent threshold) creates 180 physician payment areas: 130 MSAs, 41 statewide non-MSAs, and 9 statewide areas. In terms of the number of payment areas and metropolitan-nonmetropolitan redistribution, these iterative methods are a compromise between the current areas—rooted in the historical emphasis on larger, fewer markets and protecting nonmetropolitan areas—and MSAs/statewide non-MSAs. Similar methods were investigated by the health policy research firm Acumen in its 2008 report to CMS and by GAO in its 2007 report to the U.S. Congress.
Because the current physician payment areas were partly designed to attract providers in nonmetropolitan areas through payment (GAO, 2007), any refinement of the current payment areas on the basis of labor market principles will redistribute Medicare payment away from nonmetropolitan areas. Changing the 89 existing payment areas to a system of 441 MSAs and statewide non-MSAs would increase payments in large metropolitan areas by about 1 percent, decrease payments in small metropolitan areas by slightly more than 1 percent, and decrease payments in nonmetropolitan areas by about 3 percent (see Table 2-7). Adopting the 3 percent iterated MSA option would increase payments in large metropolitan areas by less than 1 percent,
| Urbanicity Categorya | Number of Counties | Locality GAFsb |
MSA GAFs |
MSA Ranked Iterated 3% GAFs |
|
| Metropolitan counties | |||||
| >1 million population | 414 | 1.039 | 1.049 | 1.046 | |
| 250,000–1,000,000 population | 325 | 0.972 | 0.973 | 0.970 | |
| <250,000 population | 351 | 0.951 | 0.938 | 0.939 | |
| Nonmetropolitan counties | |||||
| Adjacent to a metropolitan county | 1,062 | 0.950 | 0.918 | 0.932 | |
| Not adjacent to a metropolitan county | 990 | 0.933 | 0.903 | 0.913 | |
NOTE: The county level, the locality level, and metropolitan statistical area (MSA) actual GAFs were derived from county level 2012 fully transitioned geographic practice cost indexes (GPCIs) that were calculated by the Centers for Medicare and Medicaid Services (CMS) and Acumen.
a Urbanicity categories are based on 2003 Rural/Urban Continuum Codes. Does not include Yellowstone, Montana, the Virgin Islands, and 78 Puerto Rican counties.
b Locality GAFs were calculated from the county-level GPCIs that would have been used in the absence of congressionally mandated floors for Alaska’s work GPCI and the frontier states’ practice expense GPCIs.
SOURCE: RTI Analysis of CMS and Acumen data.
decrease payments in small metropolitan areas by slightly more than 1 percent, and decrease payments in nonmetropolitan areas by about 2 percent.12
Considering the information presented above, both the MSA/statewide non-MSA system and the iterated MSA-based approach create more accurate payment areas than the current system does. Because hospitals and physician practices essentially compete for labor in the same markets and industries, the committee favors using the same system for both sets of providers. The committee acknowledges the redistributional impact on physicians in nonmetropolitan areas of dividing 89 large payment areas into 441 labor markets. To some degree, this is a reversal of a historical income redistribution that resulted from the consolidation of payment areas in deference to the policy goal of recruiting physicians to nonmetropolitan areas. The committee’s phase 2 report will address the impact of geographic adjustment on patients’ access to physicians in nonmetropolitan and metropolitan areas.
Recommendation 2-1: The same labor market definition should be used for both the hospital wage index and the physician geographic adjustment factor. Metropolitan statistical areas and statewide nonmetropolitan statistical areas should serve as the basis for defining these labor markets.
Since hospitals and physicians draw labor from essentially the same pool, the same labor markets should be used for both the hospital wage index and the geographic adjustment factor. There is little economic justification for using the 89 current physician payment areas. In fact, the
___________
12 The analysis was performed using data published by CMS for the 2012 GPCIs. The effects of the congressionally mandated floors for Alaska’s work GPCI and the frontier states’ practice expense GPCIs were removed to isolate the effects of the payment area change from the effects of the floors.
current areas are inaccurate compared with the 441 MSAs. They fail to differentiate geographic areas within payment areas where physicians face significant variation in their wages. Moreover, consistency across both hospitals and physician practices makes administrative sense and may reduce the administrative burden for the Centers for Medicare and Medicaid Services (CMS). In addition, metropolitan statistical areas (MSAs), by definition, are economically integrated, as reflected by commuters in all occupations and industries going both directions across county borders to work.
The committee acknowledges that moving from 89 to 441 physician payment areas could result in some areas with small sample sizes, affecting the reliability of payment calculations. If small sample sizes affect the accuracy of calculations, additional data could be collected, areas or years of data could be combined, or methods that borrow strength from surrounding regions could be used.
Use of the same labor market definition for hospitals and physician practices is in line with increasing integration of hospital and physician care settings and the movement toward more accountable and coordinated health care across both settings. Although the extent and permanence of integration is not clear, hospitals and physicians often provide related services in locations that are in close proximity and within similar commuting distances to population centers. Whether they are providing substitute, complementary, or even non-related services, both hospitals and physicians compete for similar types of labor at similar wage rates within similar areas.
The intent of the provisions for accountable care organizations in the 2010 Accountable Care Act (P.L. 111-148) is for physicians, hospitals, and other providers to be jointly responsible for care delivery, care transitions across settings, and outcomes for their patients, with success reflected in joint savings. On the basis of current trends, the future may bring physicians and hospitals closer together in both the delivery of and the payment for health care. Given the potential for increased interdependence in payment, it makes sense to use the same labor markets for hospitals and physicians for geographic adjustment of payment.
There is an advantage to using already established definitions that are in widespread use. Although the metropolitan statistical area is not a perfect definition of a labor market, with smoothing improvements (described in Chapter 5), it can serve as an effective and equitable approximation. Grounded in information on where people live and work, it reflects the very decisions made by employers and employees that define geographic labor markets. The metropolitan statistical area also does a reasonable job of grouping together hospitals facing similar wage rates.
In addition, metropolitan statistical area definitions and the county-based delineation of metropolitan statistical areas are regularly updated by the Office of Management and Budget and modified as employment patterns change. This ensures that labor markets are updated and relieves CMS of the administrative burden of redefining labor markets in response to claims that they are outdated.
Recommendation 2-2: The data used to construct the hospital wage index and the physician geographic adjustment factor should come from all health care employers.
A corollary to the first recommendation is that the labor market for employees of hospitals and physician practices extends beyond their existing employers to the health care sector and
beyond. This has implications for the source of wage data used to construct the geographic adjustment indexes.
A central principle of geographic adjustment is that it should reflect payment for the prices of labor faced by employers rather than the costs of labor paid by employers. To accurately reflect the prevailing wages faced by hospitals and physicians in a given area, the wage data used to create geographic adjusters should come from all employers that compete for employees in hospitals and physician practices. These employees come from occupations both in and out of the health care professions, ranging from nurses to cafeteria workers. Empirically, these occupations are employed in all industries, not just health care industries. Moreover, the Centers for Medicare and Medicaid Services (CMS) already uses wage data from all industries for the office labor portion of the physician geographic adjustment factor. Although a case can be made for using wage data from all employers, the committee recommends that wage data come from all health care employers and not simply hospitals and physician practices. This recommendation is an acknowledgment that health care employers may differ from the universe of all employers in terms of the percentage of compensation paid in benefits, in the likelihood of unionization, and in other ways that might affect compensation rates for some types of employees.
Using data from the industries in which employers compete for workers and workers compete for jobs is fundamental to the definition of labor markets for the geographic adjustment of Medicare payment. Wage data are discussed in more detail in Chapter 3.
Black, D. 2010 (unpublished). Adjusting compensation for geographical differences. Presentation to IOM Committee on Geographic Adjustment Factors in Medicare Payment. Washington, DC: University of Chicago.
Borjas, G. 2010. Labor economics. 5th ed. Boston, MA: McGraw-Hill.
CMS (Centers for Medicare and Medicaid Services). 1993. Hospital inpatient prospective payment systems and 1994 FY rates. Federal Register 58(100):30101–30964.
______. 1994. Hospital inpatient prospective payment systems and FY 1995 rates. Federal Register 59(102):27708–27930.
______. 1996. Physician Fee Schedule (1997 CY): Payment policies: Revisions. Federal Register 61(128):34614–34622.
______. 2010a. Medicare program; hospital inpatient prospective payment systems for acute care hospitals and the long term care Hospital Prospective Payment System changes and FY 2011 rates; provider agreements and supplier approvals; and hospital conditions of participation for rehabilitation and respiratory care services; Medicaid program: Accreditation for providers of inpatient psychiatric services; final rule. Federal Register 75(157):50042–50677.
______. 2010b. Medicare program; payment policies under the physician fee schedule and other revisions for Part B for CY 2010. Federal Register 75(228):73170–73860.
Cromwell, J., A. Henricks, and G.C. Pope. 1986. Report on geographic (urban–rural) refinements to PPS payment adjustment. Washington, DC: Health Care Financing Administration.
Dalton, K. 2007. Potential refinements to Medicare’s wage indexes for hospitals and other sectors final report. MedPAC Contract Research Series 07-3. Washington, DC: MedPAC. http://purl.access.gpo.gov/GPO/LPS89118 (accessed November 2010).
Dartmouth. 2007. The primary care service area project. Hanover, NH: Dartmouth. http://pcsa.dartmouth.edu/index.html (accessed April 14, 2011).
______. 2011. The Dartmouth Atlas of Health Care: About our regions. Hanover, NH: Dartmouth. http://www.dartmouthatlas.org/data/region/ (accessed February 7, 2011).
Ehrenberg, R. G., and R. S. Smith. 1988. Modern labor economics theory and public policy. Student workbook. 3rd ed. Glenview, IL: Scott Foresman.
GAO (Government Accountability Office). 2004. Metropolitan statistical areas new standards and their impact on selected federal programs. Washington, DC: GAO.
______. 2007. Geographic areas used to adjust physician payments for variation in practice costs should be revised. Washington, DC: GAO.
MaCurdy, T., T. DeLeire, K. de Nava, P. Kamenecka, Y. Tan, and S. McClellan. 2010. Revision of Medicare wage index: Final report part 2. Burlingame, CA: Acumen, LLC.
MaCurdy, T., J. Shafrin, and M. Bounds. 2011. Proposed revisions to the Sixth Update of the Geographic Practice Cost Index. Burlingame, CA: Acumen, LLC.
Mankiw, G. 2008. Principles of economics. Mason, OH: Thompson Southwestern.
Mayes, R. 2006. Medicare prospective payment and the shaping of U.S. health care. Baltimore, MD: The Johns Hopkins University Press.
MedPAC (Medicare Payment Advisory Commission). 2007. Report to Congress: Promoting greater efficiency in Medicare. Washington, DC: MedPAC.
Moretti, E. 2010. Working paper: Local labor markets. Cambridge, MA: National Bureau of Economic Research.
OMB (Office of Management and Budget). 2010. Standards for delineating metropolitan and micropolitan statistical areas. Federal Register 75(123):37246–39052.
ProPAC (Prospective Payment Assessment Commission). 1985. Report and recommendations to the Secretary, U.S. Department of Health and Human Services. Washington, DC: ProPAC.
______. 1986. Technical appendixes to the report and recommendations to the Secretary, U.S. Department of Health and Human Services. Washington, DC: ProPAC.
______. 1987. Technical appendixes to the report and recommendations to the Secretary, U.S. Department of Health and Human Services. Washington, DC: ProPAC.
______. 1993. Report and recommendations to the Congress, March 1, 1993 : Including appendixes, Medicare and Medicaid guide no. 738, pt. 2. Chicago, IL: Commerce Clearing House.
Rosen, S. 1986. Theory of equalizing differences. In Handbook of labor economics. New York: Elsevier Science Publishers.
Schmitz, R. M., 1987. Improving the definition of hospital labor market areas and wage indexes. Washington, DC: ProPAC.
Wellever, A. L., Kansas Rural Health Options Project, and Kansas Health Foundation. 1994. The community health organization: An integrated health services system. Topeka, KS: Kansas Rural Health Project, Office of Local and Rural Health Systems. Kansas Department of Health and Environment.
Williams, D., J. Pettengill, and C. Lisk. 1990. Adjusting a wage index for geographic differences in occupational mix. Washington, DC: ProPAC.
Wright, G., and F. Marlor. 1990. Alternative market area definitions. Washington, DC: ProPAC.


