
Cancer is the second-leading cause of death in the United States. Among men 50–64 years old, the group that includes most Vietnam veterans (see Table 7-1), however, the risk of dying from cancer exceeds the risk of dying from heart disease, the leading cause of death in the United States, and does not fall to second place until after the age of 75 years (Heron et al., 2009). About 570,000 Americans of all ages were expected to die from cancer in 2010—more than 1,500 per day. In the United States, one-fourth of all deaths are from cancer (Jemal et al., 2010).
This chapter summarizes and presents conclusions about the strength of the evidence from epidemiologic studies regarding associations between exposure to
|
|
||||
| Vietnam Era | Vietnam Theater | |||
|
|
|
|||
| Age Group (Years) | n | (%) | n | (%) |
|
|
||||
| All ages | 7,805 | 3,816 | ||
| ≤ 54 | 133 | (1.8) | 32 | (0.9) |
| 55-59 | 1,109 | (15.1) | 369 | (10.4) |
| 60-64 | 3,031 | (41.3) | 1,676 | (47.0) |
| 65-69 | 2,301 | (31.3) | 1,090 | (30.6) |
| 70-74 | 675 | (9.2) | 280 | (7.9) |
| 75-84 | 511 | (6.9) | 322 | (9.0) |
| ≥ 85 | 178 | (2.4) | 83 | (2.4) |
|
|
||||
SOURCE: IOM, 1994, Table 3-3, updated by 20 years.
the chemicals of interest—2,4-dichlorophenoxyacetic acid (2,4-D), 2,4,5-trichlorophenoxyacetic acid (2,4,5-T) and its contaminant 2,3,7,8-tetrachlorodibenzo-p-dioxin (TCDD), picloram, and cacodylic acid—and various types of cancer. The committee also considers studies of exposure to polychlorinated biphenyls (PCBs) and other dioxin-like chemicals (DLCs) informative if their results were reported in terms of TCDD toxic equivalents (TEQs) or concentrations of specific congeners of DLCs. If a new study reported on only a single type of cancer and did not revisit a previously studied population, its design information is summarized here with its results; design information on all other new studies can be found in Chapter 5.
The objective of this chapter is assessment of whether the occurrence of various cancers in Vietnam veterans themselves may be associated with exposure they may have received during military service. Therefore, studies of childhood cancers in relation to parental exposure to the chemicals of interest are discussed in Chapter 8, which addresses possible adverse effects in the veterans’ offspring. Studies that consider only childhood exposure are not considered relevant to the committee’s charge.
In an evaluation of a possible connection between herbicide exposure and risk of cancer, the approach used to assess the exposure of study subjects is of critical importance in determining the overall relevance and usefulness of findings. As noted in Chapters 3 and 5, there is great variety in detail and accuracy of exposure assessment among studies. A few studies used biologic markers of exposure, such as the presence of a chemical in serum or tissues; some developed an index of exposure from employment or activity records; and some used other surrogate measures of exposure, such as presence in a locale when herbicides were used. As noted in Chapter 2, inaccurate assessment of exposure can obscure the relationship between exposure and disease.
Each section on a type of cancer opens with background information, including data on its incidence in the general US population and known or suspected risk factors. Cancer-incidence data on the general US population are included in the background material to provide a context for consideration of cancer risk in Vietnam veterans; the figures presented are estimates of incidence in the entire US population, not predictions for the Vietnam-veteran cohort. The data reported are for 2004–2008 and are from the most recent dataset available (NCI, 2010). Incidence data are given for all races combined and separately for blacks and whites. The age range of 55–69 years now includes about 80% of Vietnam-era veterans, and incidences are presented for three 5-year age groups: 55–59 years, 60–64 years, and 65–69 years. The data were collected for the Surveillance, Epidemiology, and End Results (SEER) program of the National Cancer Institute and are categorized by sex, age, and race, all of which can have profound effects on risk. For example, the incidence of prostate cancer is about 2.6 times as high in men who are 65–69 years old as in men 55–59 years old and almost twice as high in blacks 55–64 years old as in whites in the same age group (NCI, 2010).
Many other factors can influence cancer incidence, including screening methods, tobacco and alcohol use, diet, genetic predisposition, and medical history. Those factors can make someone more or less likely than the average to contract a given kind of cancer; they also need to be taken into account in epidemiologic studies of the possible contributions of the chemicals of interest.
Each section of this chapter pertaining to a specific type of cancer includes a summary of the findings described in the previous Agent Orange reports: Veterans and Agent Orange: Health Effects of Herbicides Used in Vietnam, hereafter referred to as VAO (IOM, 1994); Veterans and Agent Orange: Update 1996, referred to as Update 1996 (IOM, 1996); Update 1998 (IOM, 1999); Update 2000 (IOM, 2001); Update 2002 (IOM, 2003); Update 2004 (IOM, 2005); Update 2006 (IOM, 2007); and Update 2008 (IOM, 2009). That is followed by a discussion of the most recent scientific literature, a discussion of biologic plausibility, and a synthesis of the material reviewed. When it is appropriate, the literature is discussed by exposure type (service in Vietnam, occupational exposure, or environmental exposure). Each section ends with the committee’s conclusion regarding the strength of the evidence from epidemiologic studies. The categories of association and the committee’s approach to categorizing the health outcomes are discussed in Chapters 1 and 2.
Biologic plausibility corresponds to the third element of the committee’s congressionally mandated statement of task. In fact, the degree of biologic plausibility itself influences whether the committee perceives positive findings to be indicative of an association or the product of statistical fluctuations (chance) or bias.
Information on biologic mechanisms by which exposure to TCDD could contribute to the generic (rather than tissue-specific or organ-specific) carcinogenic potential of the chemicals of interest is summarized in Chapter 4. It distills toxicologic information concerning the mechanisms by which TCDD affects the basic process of carcinogenesis; such information, of course, applies to all the cancer sites discussed individually in this chapter. When biologic plausibility is discussed in this chapter’s sections on particular cancer types, the generic information is implicit, and only experimental data peculiar to carcinogenesis at the site in question are presented. It is of note that in this update we have explicitly included an examination of the contribution of epigenetic mechanisms in assessing the carcinogenicity of TCDD. A large literature indicates that carcinogenesis is a process that involves not only genetic changes but also epigenetic changes (Johnstone and Baylin, 2010). There is emerging evidence that TCDD and the chemicals of interest may disturb epigenetic processes (see Chapter 4), and reference to this evidence, as it applies to cancers is included where it exists, by cancer site.
Considerable uncertainty remains about the magnitude of risk posed by exposure to the chemicals of interest. Many of the veteran, occupational, and environmental studies reviewed by the committee did not control fully for important
confounders. There is not enough information about the exposure experience of individual Vietnam veterans to permit combining exposure estimates for them with any potency estimates that might be derived from scientific research studies to quantify risk. The committee therefore cannot accurately estimate the risk to Vietnam veterans that is attributable to exposure to the chemicals of interest. The (at least currently) insurmountable problems in deriving useful quantitative estimates of the risks of various health outcomes in Vietnam veterans are explained in Chapter 1 and the summary of this report, but the point is not reiterated for every health outcome addressed.
For Update 2006, a system for addressing cancer types was described to clarify how specific cancer diagnoses were grouped for evaluation by the committee and to ensure that the full array of cancer types would be considered. The organization of cancer groups follows major and minor categories of cause of death related to cancer sites established by the National Institute for Occupational Safety and Health (NIOSH). The NIOSH groups map the full range of International Classification of Diseases, Revision 9 (ICD-9) codes for malignant neoplasms (140–208). The ICD system is used by physicians and researchers to group related diseases and procedures in a standard form for statistical evaluation. Revision 10 (ICD-10) came into use in 1999 and constitutes a marked change from the previous four revisions that evolved into the ninth ICD-9. ICD-9 was in effect from 1979 to 1998; because ICD-9 is the version most prominent in the research reviewed in this series, it has been used when codes are given for a specific health outcome. Appendix B describes the correspondence between the NIOSH cause-of-death groupings and ICD-9 codes (Table B-1); the groupings for mortality are largely congruent with those of the SEER program for cancer incidence (see Table B-2, which presents equivalences between the ICD-9 and ICD-10 systems). For the present update, the committee gave more attention to the World Health Organization’s classification for lymphohematopoietic neoplasms (WHO, 2008), which stresses partitioning of these disorders first according to the lymphoid or myeloid lineage of the transformed cells rather than into lymphomas and leukemias.
The system of organization used by the committee simplifies the process for locating a particular cancer for readers and facilitated the committee’s identification of ICD codes for malignancies that had not been explicitly addressed in previous updates. VAO reports’ default category for any health outcome on which no epidemiologic research findings have been recovered has always been “inadequate evidence” of association, which in principle is applicable to specific cancers. Failure to review a specific cancer or other condition separately reflects the paucity of information, so there is indeed inadequate or insufficient information to categorize such a disease outcome.
The studies considered with respect to the biologic plausibility of associations between exposure to the chemicals of interest and human cancers have been performed primarily in laboratory animals (rats, mice, hamsters, and monkeys) or cultured cells. Collectively, the evidence obtained from studies of TCDD indicates that a connection between human exposure to this chemical and cancers is biologically plausible, as will be discussed more fully in a generic sense below and more specifically in the biologic-plausibility sections on individual cancers. Recent reviews have affirmed the now well-established mechanistic roles of the aryl hydrocarbon receptor (AHR) in cancer (Androutsopoulos et al., 2009; Barouki and Coumoul, 2010; Dietrich and Kaina, 2010; Ray and Swanson, 2009), and the data have firmly established the biologic plausibility of an association between TCDD exposure and cancer.
With respect to 2,4-D, 2,4,5-T, and picloram, several studies have been performed in laboratory animals. In general, the results were negative although some would not meet current standards for cancer bioassays; for instance, there is some question of whether the highest doses (generally 30–50 mg/kg) in some of these studies reached a maximum tolerated dose (MTD). It is not possible to have absolute confidence that these chemicals have no carcinogenic potential. Further evidence of a lack of carcinogenic potential is provided, however, by negative findings on genotoxic effects in assays conducted primarily in vitro. The evidence indicates that 2,4-D is genotoxic only at very high concentrations. Although 2,4,5-T was shown to increase the formation of DNA adducts by cytochrome P450–derived metabolites of benzo[a]pyrene, most available evidence indicates that 2,4,5-T is genotoxic only at high concentrations. Recently, Hernández et al. (2009) have reviewed the mechanisms of action of nongenotoxic carcinogens, including TCDD in this category
There is some evidence that cacodylic acid is carcinogenic. Studies performed in laboratory animals have shown that it can induce neoplasms of the kidney (Yamamoto et al., 1995) and bladder (Arnold et al., 2006; Wei et al., 2002). In the lung, treatment with cacodylic acid induced formation of neoplasms when administered to mouse strains that are genetically susceptible to them (Hayashi et al., 1998). Other studies have used the two-stage model of carcinogenesis in which animals are exposed first to a known genotoxic agent and then to a suspected tumor-promoting agent. With that model, cacodylic acid has been shown to act as a tumor-promoter with respect to lung cancer (Yamanaka et al., 1996).
Studies in laboratory animals in which only TCDD has been administered have reported that it can increase the incidence of a number of neoplasms, most notably of the liver, lungs, thyroid, and oral mucosa (Kociba et al., 1978; NTP, 2006). Some studies have used the two-stage model of carcinogenesis and shown that TCDD can act as a tumor-promoter and increase the incidence of ovarian cancer (Davis et al., 2000), liver cancer (Beebe et al., 1995), and skin cancers
(Wyde et al., 2004). As to the mechanisms by which TCDD exerts its carcinogenic effects, it is thought to act primarily as a tumor-promoter. In many of the animal studies reviewed, treatment with TCDD has resulted in hyperplasia or metaplasia of epithelial tissues. In addition, in both laboratory animals and cultured cells, TCDD has been shown to exhibit a wide array of effects on growth regulation, hormone systems, and other factors associated with the regulation of cellular processes that involve growth, maturation, and differentiation. Thus, it may be that TCDD increases the incidence or progression of human cancers through an interplay between multiple cellular factors. Tissue-specific protective cellular mechanisms may also affect the response to TCDD and complicate our understanding of its site-specific carcinogenic effects.
As shown with long-term bioassays in both sexes of several strains of rats, mice, hamsters, and fish, there is adequate evidence that TCDD is a carcinogen in laboratory animals, increasing the incidence of tumors at sites distant from the site of treatment at doses well below the maximum tolerated. On the basis of animal studies, TCDD has been characterized as a nongenotoxic carcinogen because it does not have obvious DNA-damaging potential, but it is a potent “promoter” and a weak initiator in two-stage initiation–promotion models for liver, skin, and lung. Early studies demonstrated that TCDD is 2 orders of magnitude more potent than the “classic” promoter tetradecanoyl phorbol acetate and that TCDD skin-tumor promotion depends on the AHR. For many years, it has been known that TCDD is a potent tumor-promoter. Recent evidence has shown that AHR activation by TCDD in human breast and endocervical cell lines induces sustained high concentrations of the interleukin-6 (IL-6) cytokine, which has tumor-promoting effects in numerous tissues—including breast, prostate, ovary, and malignant cholangiocytes—and opens up the possibility that TCDD would promote carcinogenesis in these and possibly other tissues (Hollingshead et al., 2008). TCDD has been shown to downregulate reduced folate carrier (Rfc1) mRNA and protein in rat liver, which is essential in maintaining folate homeostasis (Halwachs et al., 2010). Reduced Rfc1 activity and a functional folate deficiency may contribute to the risk of carcinogenesis posed by TCDD exposure.
Mechanisms by which TCDD induces G1 arrest in hepatic cells (Mitchell et al., 2006; Weiss et al., 2008) and decreases viability of endometrial endothelial cells (Bredhult et al., 2007), insulinsecreting beta cells (Piaggi et al., 2007), peripheral T cells (Singh et al., 2008), and neuronal cells (Bredhult et al., 2007) have recently been identified, and these results suggest possible carcinogenic mechanisms. TCDD may contribute to tumor progression by inhibiting p53 regulation (phosphorylation and acetylation) triggered by genotoxicants via the increased expression of the metastasis marker AGR2 (Ambolet-Camoit et al., 2010) and through a functional interaction between the AHR and FHL2 (“four and a half LIM protein 2,” where the LIM domain is a highly conserved protein structure) (Kollara and Brown, 2009). Borlak and Jenke (2008) demonstrated that the AHR is a major regulator of c-raf and proposed that there is cross-talk
between the AHR and the mitogen-activated protein kinase signaling pathway in chemically induced hepatocarcinogenesis. TCDD inhibits ultraviolet-C (UV-C) radiation-induced apoptosis in primary rat hepatocytes and Huh-7 human hepatoma cells, and this supports the hypothesis that TCDD acts as a tumor-promoter by preventing initiated cells from undergoing apoptosis (Chopra et al., 2009). Additional in vitro work with mouse hepatoma cells has shown that activation of the AHR results in increased concentrations of 8-hydroxy-2’-deoxyguanosine (8-OHdG), a product of DNA-base oxidation and later excision repair and a marker of DNA damage. Induction of cytochrome P4501A1 (CYP1A1) by TCDD or indolo(3,2-b)carbazole is associated with oxidative DNA damage (Park et al., 1996). In vivo experiments in mice corroborated those findings by showing that TCDD caused a sustained oxidative stress, as determined by measurements of urinary 8-hydroxydeoxyguanosine (Shertzer et al., 2002), involving AHR-dependent uncoupling of mitochondrial respiration (Senft et al., 2002). Mitochondrial reactive-oxygen production depends on the AHR.
Electronics-dismantling workers, experiencing complex exposures including polychlorinated dibenzo-p-dioxins and dibenzofurans (PCDD/Fs), had elevated levels of urinary 8-OHdG indicative of oxidative stress and genotoxicity; this cannot, however, be ascribed directly to the dioxin-like chemicals (DLCs) (Wen et al., 2008). In a study of New Zealand Vietnam War veterans (Rowland et al., 2007), clastogenic genetic disturbances arising as a consequence of confirmed exposure to Agent Orange were determined by analyzing sister-chromatid exchanges (SCEs) in lymphocytes from a group of 24 New Zealand Vietnam War veterans and 23 control volunteers. The results showed a highly significant difference (p < 0.001) in mean SCE frequency between the experimental group and the control group. The Vietnam War veterans also had a much higher proportion of cells with SCE frequencies above the 95th percentile than the controls (11.0 and 0.07%, respectively).
The weight of evidence that TCDD and dioxin-like PCBs make up a group of chemicals with carcinogenic potential includes unequivocal animal carcinogenesis and biologic plausibility based on mode-of-action data. Although the specific mechanisms by which dioxin causes cancer remain to be established, the intracellular factors and mechanistic pathways involved in dioxin’s cancer-promotion mode of action all have parallels in animals and humans. No qualitative differences have been reported to indicate that humans should be considered as fundamentally different from the multiple animal species in which bioassays have demonstrated dioxin-induced neoplasia.
Thus, the toxicologic evidence indicates that a connection of TCDD and perhaps cacodylic acid with cancer in humans is, in general, biologically plausible, but (as discussed below) it must be determined case by case whether such potential is realized in a given tissue. Experiments with 2,4-D, 2,4,5-T, and picloram in animals and cells have not provided a strong biologic basis of the presence or absence of carcinogenic effects.
THE COMMITTEE’S VIEW OF “GENERAL” HUMAN CARCINOGENS
To address its charge, the committee weighed the scientific evidence linking the chemicals of interest to specific individual cancer sites. That was appropriate given the different susceptibilities of various tissues and organs to cancer and the various genetic and environmental factors that can influence the occurrence of a particular type of cancer. Before considering each site in turn, however, it is important to address the concept that cancers share some characteristics among organ sites and to clarify the committee’s view regarding the implications of a chemical’s being a “general” human carcinogen. All cancers share phenotypic characteristics: uncontrolled cell proliferation, increased cell survival, invasion outside normal tissue boundaries, and eventually metastasis. The current understanding of cancer development holds that a cell or group of cells must acquire a series of sufficient genetic mutations to progress and that particular epigenetic events (events that affect gene function but do not involve a change in gene coding sequence) must occur to accelerate the mutational process and provide growth advantages for the more aggressive clones of cells. That means that a carcinogen can stimulate the process of cancer development by either genetic (mutational) or epigenetic (nonmutational) activities.
In classic experiments based on the induction of cancer in mouse skin that were conducted over 40 years ago, carcinogens were categorized as initiators, those capable of causing an initial genetic insult to the target tissue, and promoters, those capable of promoting the growth of initiated tumor cells, generally through nonmutational events. Some carcinogens, such as those found in tobacco smoke, were considered “whole carcinogens;” that is, they were capable of both initiation and promotion. Today, cancer researchers recognize that the acquisition of important mutations is a continuing process in tumors and that promoters, or epigenetic processes that favor cancer growth, enhance the accumulation of genotoxic damage, which traditionally would be regarded as initiating activity.
As discussed above and in Chapter 4, 2,4-D, 2,4,5-T, and picloram have shown little evidence of genotoxicity in laboratory studies, except at very high doses, and little ability to facilitate cancer growth in laboratory animals. However, cacodylic acid and TCDD have shown the capacity to increase cancer development in animal experiments, particularly as promoters rather than as pure genotoxic agents. Extrapolating organ-specific results from animal experiments to humans is problematic because of important differences between species in overall susceptibility of various organs to cancer development and in organ-specific responses to particular putative carcinogens. Therefore, judgments about the “general” carcinogenicity of a compound in humans are based heavily on the results of epidemiologic studies, particularly on the question of whether there is evidence of excess cancer risk at multiple organ sites. As the evaluations of particular types of cancer in the remainder of this chapter indicate, the committee finds that TCDD in particular appears to be
a multisite carcinogen. That finding is in agreement with the International Agency for Research on Cancer (IARC), which has determined that TCDD is a category 1 “known human carcinogen,” and with the US Environmental Protection Agency (EPA), which has concluded that TCDD is “likely to be carcinogenic to humans.” It is important to emphasize that the goals and methods of IARC and EPA in making their determinations were different from those of the present committee; the missions of those organizations focus on evaluating risk to minimize future exposure, whereas this committee focuses on risk after exposure. Furthermore, recognition that TCDD and cacodylic acid are multisite carcinogens does not imply that they cause human cancer at every organ site.
The distinction between general carcinogen and site-specific carcinogen is more difficult to grasp in light of the common practice of beginning analyses of epidemiologic cohorts with a category of “all malignant neoplasms,” which is a routine first screen for any unusual cancer activity in the study population rather than a test of a biologically based hypothesis. When the distribution of cancers among anatomic sites is lacking in the report of a cohort study, a statistical test for an increase in all cancers is not meaningless, but it is usually less scientifically supportable than analyses based on specific sites, for which more substantial biologically based hypotheses can be developed. The size of a cohort and the length of the observation period often constrain the number of cases of cancer types observed and the extent to which specific types can be analyzed. For instance, the present update includes an analysis of cumulative results on diabetes and cancer from a report of the prospective Air Force Health Study (Michalek and Pavuk, 2008). For the fairly common condition of diabetes, that publication presents important information summarizing previous findings, but the cancer analysis does not go beyond “all cancers.” The committee does not accept those findings as an indication that exposure to Agent Orange increases the risk of every variety of cancer. It acknowledges that the highly stratified analyses conducted suggest that some increase in the incidence of some cancers did occur in the Ranch Hand subjects, but it views the “all cancers” results as a conglomeration of information on specific cancers—most important, melanoma and prostate cancer, on which provocative results have been published (Akhtar et al., 2004; Pavuk et al., 2006) and which merit individual longitudinal analysis to resolve outstanding questions.
The remainder of this chapter deals with the committee’s review of the evidence on each individual cancer site in accordance with its charge to evaluate the statistical association between exposure and cancer occurrence, the biologic plausibility and potential causal nature of the association, and the relevance to US veterans of the Vietnam War.
ORAL, NASAL, AND PHARYNGEAL CANCER
Oral, nasal, and pharyngeal cancers are found in many anatomic sites, including the structures of the mouth (inside lining of the lips, cheeks, gums, tongue,
and hard and soft palate) (ICD-9 140–145), oropharynx (ICD-9 146), nasopharynx (ICD-9 147), hypopharynx (ICD-9 148), other buccal cavity and pharynx (ICD-9 149), and nasal cavity and paranasal sinuses (ICD-9 160). Until recently, cancers that occur in the oral cavity and pharynx have been thought to be similar in descriptive epidemiology and risk factors, whereas cancer of the nasopharynx is known to have a different epidemiologic profile. However, we now recognize that human papilloma virus (HPV) is an important risk factor for squamous-cell carcinoma of the head and neck, with the risk estimates being highest for the base of the tongue and tonsils (Marur et al., 2010).
The American Cancer Society (ACS) estimated that about 36,540 men and women would receive diagnoses of oral, nasal, or pharyngeal cancer in the United States in 2010 and that 7,880 men and women would die from these diseases (Jemal et al., 2010). Almost 91% of those cancers originate in the oral cavity or oropharynx. Most oral, nasal, and pharyngeal cancers are squamous-cell carcinomas. Nasopharyngeal carcinoma (NPC) is the most common malignant epithelial tumor of the nasopharynx although it is relatively rare in the United States. There are three types of NPC: keratinizing squamous-cell carcinoma, nonkeratinizing carcinoma, and undifferentiated carcinoma.
The average annual incidences reported in Table 7-2 show that men are at greater risk than women for those cancers and that the incidences increase with age—although there are few cases, and care should be exercised in interpreting the numbers. Tobacco and alcohol use are established risk factors for oral and pharyngeal cancers. Reported risk factors for nasal cancer include occupational exposure to nickel and chromium compounds (d’Errico et al., 2009; Feron et al., 2001; Grimsrud and Peto, 2000), wood dust (d’Errico et al., 2009), leather dust (Bonneterre et al., 2007), and high doses of formaldehyde (Nielsen and Wolkoff, 2010).
Conclusions from VAO and Previous Updates
The committee responsible for VAO concluded that there was inadequate or insufficient information to determine whether there is an association between exposure to the chemicals of interest and oral, nasal, and pharyngeal cancers. Additional information available to the committees responsible for Update 1996, Update 1998, Update 2000, Update 2002, Update 2004, Update 2006, and Update 2008 did not change that conclusion.
In Update 2006 at the request of the the Department of Veterans Affairs (VA), the committee attempted to evaluate tonsil-cancer cases separately, but it was able to identify only three cohort studies that provided the number of tonsil-cancer cases in their study populations and concluded that these studies did not provide sufficient evidence to determine whether an association existed between exposure to the chemicals of interest and tonsil cancer. Since then, no studies have offered any important additional insight into this question. The committee
TABLE 7-2 Average Annual Incidence (per 100,000) of Nasal, Nasopharyngeal, Oral-Cavity and Pharyngeal, and Oropharyngeal Cancers in United Statesa
| 55-59 Years Old | 60-64 Years Old | 65-69 Years Old | |||||||
| All Races | While | Black | All Races | While | Black | All Races | While | Black | |
| Nose, Nasal Caviiy, and Middle Ear: | |||||||||
| Men | 1.3 | 2.4 | 2.2 | 1.8 | 4.0 | 2.7 | 2.4 | 3.5 | 4.3 |
| Women | I.I | 0.9 | 1.0 | 1.0 | 1.6 | 2.0 | 2.3 | 1.3 | |
| Nasopharynx: | |||||||||
| Men | 25 | 1.4 | 2.6 | 1.9 | 1.3 | 0.8 | 3.2 | I.S | 2.3 |
| Women | 1.1 | 0.6 | 0.4 | 0.8 | 0.7 | 0.3 | 1.1 | 1.0 | 0.4 |
| Oral Caviiy and Pharynx: | |||||||||
| Men | 42.1 | 42.7 | 44.9 | 50.2 | 52.1 | 46.8 | 55.9 | 55.9 | 64.5 |
| Women | 12.7 | 12.8 | 11.9 | 15.1 | 15.8 | 14.2 | 20.7 | 21.8 | 18.2 |
| Oropharynx: | |||||||||
| Men | 1.9 | 1.7 | 4.2 | 1.9 | 1.8 | 4.0 | 2.4 | 2.2 | 3.5 |
| Women | 0.3 | 0.3 | 0.2 | 0.6 | 0.6 | 1.0 | 0.4 | 0.5 | 0.0 |
aSurveillance, Epidemiology, and End Results program, nine standard registries, crude age-specific rates, 2004–2008 (NCI, 2010).
responsible for Update 2006 recommended that VA evaluate the possibility of studying health outcomes, including tonsil cancer, in Vietnam-era veterans by using existing administrative and health-services databases. Anecdotal evidence provided to that committee suggested a potential association between the exposures in Vietnam and tonsil cancer. The new evidence indicating that cancer of the tonsils can have a viral (HPV) etiology underscores a reasonable mechanistic hypothesis for an excess of cancers in Vietnam-era veterans exposed to Agent Orange; as a result of immune alterations associated with exposure, veterans may be susceptible to HPV infection in the oral cavity and tonsils. The present committee strongly reiterates the 2006 and 2008 recommendation that VA develop a strategy that uses existing databases to evaluate tonsil cancer in Vietnam-era veterans.
Studies evaluated previously and in the present report are summarized in Table 7-3.
Update of the Epidemiologic Literature
Vietnam-Veteran Studies
Cypel and Kang (2010) updated the study of Vietnam-era Army Chemical Corps (ACC) veterans, comparing mortality through 2005 among ACC veterans by Vietnam service. They reported six cases of oral-cavity and pharyngeal cancer in the deployed cohort compared with two cases in the nondeployed cohort for an
TABLE 7-3 Selected Epidemiologic Studies—Oral, Nasal, and Pharyngeal Cancer
| Reference | Study Populationa | (Exposed Casesb |
Exposure of Interest/Estimated Risk (95% CI)b |
| VIETNAM VETERANS | |||
| United States | |||
| Air Force Health Study—Ranch Hand veterans vs SEA veterans (unless otherwise noted) |
All COIs | ||
| While AMIS subjects vs national rates (buccal cavity) | |||
| Ranch Hand veterans | |||
| Incidence | 6 | 0.9 (0.4-1.9) | |
| With tours in 1966-1970 | 6 | 1.1 (0.5-2.3) | |
| Mortality | 0 | 0.0 (nr) | |
| Comparison veterans | |||
| Incidence | 5 | 0.6 (0.2-1.2) | |
| With tours in 1966-1970 | 4 | 0.6 (0.2-1.4) | |
| Mortality | 1 | 0.5 (nr) | |
| Participants in 1997 examination cycle. Ranch | 4 | 0.6 (0.2-2.4) | |
| Hands vs comparisons (oral cavity, pharynx, and larynx), incidence |
|||
| US Cohort of Army Chemical Corp | All COIs | ||
| Cypel and Kang et al., 2010 | ACC—deployed vs nondeployed and vs US men (Vietnam-service status through 2005) |
||
| Oral cavity and pharyngeal cancer | |||
| Deployed vs nondeployed | 6 vs 2 | 17 (0.3-8.7) | |
| ACC vs US men | |||
| Vietnam cohort | 6 | 1.5 (0.6-3.3) | |
| Non-Vietnam cohort | 2 | 0.8 (0.1-2.8) | |
| US CDC Vietnam Experience Study | All COIs | ||
| Follow-up of CDC VIS cohort (ICD-9 140-149) | 6 | nr | |
| US Centers for Disease Control and Prevention | All COIs | ||
| Case-control study of US males born 1929-1953 89 nasopharyngeal carcinomas |
|||
| Vietnam service | 3 | 0.5 (0.2-1.8) | |
| 62 nasal carcinomas | |||
| Vietnam service | 2 | 0.7 (0.2-2.9) | |
| State Studies of US Vietnam Veterans | All COIs | ||
| PM study of deaths (1974-1989) of Michigan Vietnam-era veterans—deployed vs nondeployed |
|||
| Lip, oral cavity, and pharynx | 12 | 1.0 (0.5-1.8) | |
| Australian Vietnam Veterans vs Australian Population | All COIs | ||
| Follow-up 1982-2000—incidence | |||
| Head and neck | 247 | 1.5 (1.3-1.6) | |
| Navy | 56 | 1.6 (1.1-2.0) | |
| Army | 174 | 1.6 (1.3-1.8) | |
| Air Force | 17 | 0.9 (0.5-1.5) | |
| Reference | Study Populationa | (Exposed Casesb |
Exposure of Interest/Estimated Risk (95% CI)b |
| Follow-up through 2001 | |||
| Head and neck | 101 | 1.4 (1.2-1.7) | |
| Navy | 22 | 1.5 (0.9-2.1) | |
| Army | 69 | 1.5 (1.1-1.8) | |
| Air Force | 9 | 1.1 (0.5-2.0) | |
| Nasal | 3 | 0.8 (0.2-2.2) | |
| Follow-up 1980-1994 | |||
| Lip (ICD-9 140) | 0 | nr | |
| Nasopharyngeal cancer (ICD-9 147) | 2 | 0.5 (0.1-1.7) | |
| Nasal cavities (ICD-9 160) | 2 | 1.2 (0.1-4.1) | |
| Australian Conscripted Army National Service Vietnam-EraVeterans deployed vs nondeployed) | All COIs | ||
| Follow-up | |||
| Head and neck | |||
| Incidence (1982-2000) | u | 2.0 (1.2-3.4) | |
| Mortality (1966-2001) | 16 | 1.8 (0.8-4.3) | |
| Nasal | |||
| Mortality (1966-2001) | 0 | 0.0 (0.0-48.2) | |
| Follow-up (1980-1994) | |||
| Nasopharyngeal cancer (ICD-9 147) | 1 | 1.3 (0.0- > 10) | |
| Nasal cavities (ICD-9 160) | 0 | 0.0 (0.0- > 10) | |
| OCCUPATIONAL | |||
| IARC Phenoxy Herbicide Cohorl (mortality vs national mortality rates) | Dioxin, phenoxy herbicides | ||
| Kogevinas | IARC cohort, male and female workers exposed | ||
| Oral cavity, pharynx cancer (ICD-9 140-149) | 26 | 1.1 (0.7-1.6) | |
| Exposed to highly chlorinated PCDDs | 22 | 1.3 (0.8-2.0) | |
| Not exposed to highly chlorinated PCDDs | 3 | 0.5 (0.1-1.3) | |
| Nose, nasal sinus cancer (ICD-9 160) | 3 | 1.6 (0.3-4.7) | |
| Exposed to highly chlorinated PCDDs | 0 | 0.0 (0.0-3.5) | |
| Not exposed to highly chlorinated PCDDs | 3 | 3.8 (0.8-11.1) | |
| IARC cohort—exposed subcohort (males. | |||
| females)—updated to 1987 | |||
| Buccal cavity, pharynx HCD-8 140-149) | 11 | 1.2 (0.6-2.1) | |
| Nose, nasal cavities (ICD-8 160) | 3 | 2.9 (0.6-8.5) | |
| BASF Production Workers (included in IARC cohort) | Dioxin, phenoxy herbicides | ||
| BASF Aktiengesellschaft accident cohort—33 | |||
| cancers in 247 workers at 34-yr follow-up | |||
| Squamous-cell carcinoma of tonsil | 1 | nr | |
| Reference | Study Populationa | (Exposed Casesb |
Exposure of Interest/Estimated Risk (95% CI)b |
| Dutch Production Workers (included in IARC cohort) | Dioxin, Phenoxy Herbicides | ||
| Dutch chemical production workers (lip, oral cavity, pharynx) | |||
| All working any time in 1955-1985 | 1 | 2.3 (0.1-12.4) | |
| Cleaned up 1963 explosion | 1 | 7.1 (0.2-39.6) | |
| German Production Workers (included in IARC cohort) | Dioxin, Phenoxy Herbicides | ||
| German phenoxy herbicide or chlorophenol production workers | |||
| Buccal cavity, pharynx (ICD-9 140-149) | 9 | 3.0 (1.4-5.6) | |
| Tongue | 3 | nr | |
| Moor of mouth | 2 | nr | |
| Tonsil | 2 | nr | |
| Pharynx | 2 | nr | |
| New Zealand Production Workers—Dow plant in Plymouth, NZ (included in IARC cohort) | Dioxin, Phenoxy Herbicides | ||
| 1,599 production workers (male and female) vs national rates—mortality 1969 through 2004 | |||
| Buccal cavity and pharynx | |||
| Ever-ex posed workers | 3 | 2.6 (0.5-7.6) | |
| 't Mannetje et al., 2005 | New Zealand phenoxy herbicide producers (men and women) (ICD-9 140-149) | 2 | 2.8 (0.3-9.9) |
| Lip (ICD-9 140) | 0 | nr | |
| Mouth (ICD-9 141-145) | 2 | 5.4 (0.7-20) | |
| Oropharynx (ICD-9 146) | 0 | nr | |
| Nasopharynx I ICD-9 147) | 0 | 0.0 (0.0-42) | |
| Hypopharynx, other (ICD-9 148-149) | 0 | nr | |
| Phenoxy herbicide sprayers (> 99,& men) | |||
| (ICD-9 140-149) | 1 | 1.0 (0.0-5.7) | |
| Lip (ICD-9 140) | 0 | nr | |
| Mouth (ICD-9 141-145) | 0 | 0.0 (0.0-7.5) | |
| Oropharynx (ICD-9 146) | 0 | nr | |
| Nasopharynx I ICD-9 147) | 1 | 8.3 (0.2-46) | |
| Hypopharynx, other (ICD-9 148-149) | 0 | nr | |
| United Kingdom Production Workers (included in IARC cohort | Dioxin, Phenoxy Herbicides | ||
| British MCPA production workers | |||
| Lip (ICD-9 140) | 0 | nr | |
| Tongue (ICD-9 141) | 1 | 1.1 (0.0-6.2) | |
| Pharynx (ICD-9 146-149) | 1 | 0.5 (0.0-3.0) | |
| Nose (ICD-9 160) | 3 | 4.9 (1.0-14.4) | |
| Reference | Study Populationa | (Exposed Casesb |
Exposure of Interest/Estimated Risk (95% CI)b |
| Agricultural Health Study | Herbicides | ||
| US AHS—incidence (buccal cavity) | |||
| Private applicators (men and women) | 66 | 0.7 (0.5-0.8) | |
| Lip | 25 | 1.4 (0.9-2.1) | |
| Spouses of private applicators (> 99% women) | 14 | 0.7 (0.4-1.2) | |
| Lip | 2 | 1.4 (0.2-5.1) | |
| Commercial applicators (men and women) | 5 | 0.9 (0.3-2.2) | |
| Lip | 3 | 2.7 (0.6-8.0) | |
| US AHS (buccal caviiy and pharynx) | |||
| Private applicators (men and women) | 5 | 0.3 (0.1-0.7) | |
| Spouses of private applicators (> 99% women) | 0 | 0.0 (0.0-25.4) | |
| Other Agricultural Workers | Herbicides | ||
| Danish gardeners—incidence | |||
| (buccal caviiy and pharynx, ICD-7 140-148) | |||
| 10-year follow-up (1975-1984) reported in | 6 | 1.1 (0.4-2.5) | |
| 25-year follow-up (1975-2001) | |||
| Born before 1915 (high exposure) | 3 | 0.7 (0.2-2.3) | |
| Born 1915-1934 (medium exposure) | 6 | 0.7 (0.3-1.4) | |
| Born after 1934 (low exposure) | 0 | 0.0 (0.0-1.0) | |
| Norwegian farmers born 1925–1971—incidence, | |||
| lip | |||
| Reported pesticide use | nr | 0.7 (0.4-1.0) | |
| White male farmers in 23 states—deaths | |||
| 1984-1988 | |||
| Lip | 21 | 2.3 (1.4-3.5) | |
| Italian farmers (lip. tongue, salivary glands. mouth, pharynx)—mortality | |||
| Self-employed | 13 | 0.9 (nr) | |
| Employees Danish self-employed farmers—incidence |
4 | 0.5 (nr) | |
| Lip | 182 | 1.8 (p 0.05) | |
| Tongue | 9 | 0.6 (nr) | |
| Salivary glands | 13 | 0.9 (nr) | |
| Mouth | 14 | (0.5 < p 0.05) | |
| Pharynx | 13 | (0.3 p < 0.05) | |
| Nasal cavities, sinuses Danish farming employees—incidence |
11 | 0.6 (nr) | |
| Lip | 43 | (2. Lip < 0.05) | |
| Tongue | 2 | 0.6 (nr) | |
| Salivary glands | 0 | 0.0 (nr) | |
| Mouth | 0 | 0.0 (p < 0.05) | |
| Pharynx | 9 | 1.1 (nr) | |
| Nasal cavities and sinuses | 5 | 1.3 (nr) | |
| Reference | Study Populationa | (Exposed Casesb |
Exposure of Interest/Estimated Risk (95% CI)b |
| Swedish male and female agricultural workers—incidence | 99% CI | ||
| Lip | 508 | 1.8 (1.6-2.1) | |
| Tongue | 32 | 0.4 (0.2-0.6) | |
| Salivary glands | 68 | 1.0 (0.7-1.4) | |
| Mouth | 70 | 0.6 (0.5-0.8) | |
| Throat | 84 | 0.5 (0.4-0.7) | |
| Nose, nasal sinuses | 64 | 0.8 (0.6-1.2) | |
| Burmeisler, 1981 | Iowa farmers—deaths in 1971-1978 | ||
| Lip | 20 | 2.1 (p<0.0l) | |
| Forestry Workers | Herbicides | ||
| New Zealand forestry workers—incidence | |||
| Buccal cavity | 3 | 0.7 (0.2-2.2) | |
| Nasopharynx | 2 | 5.6 (1.6-19.5) | |
| Other Herbicide and Pesticide Applicators | Herbicides | ||
| Dutch licensed herbicide applicators | |||
| Nose | 0 | — | |
| Mouth, pharynx | 0 | — | |
| Case-control study of US males born 1929- | |||
| 1953, all 70 nasal cancers (carcinomas, 11 lymphomas, 5 sarcomas) in |
|||
| Selected landscaping, forestry occupations | 26 | 1.8 (1.1-3.1) | |
| Living, working on farm | 23 | 0.5 (0.3-0.8) | |
| Herbicides, pesticides | 19 | 0.7 (0.4-1.3) | |
| Phenoxy herbicides | 5 | 1.2 (0.4-3.3) | |
| Finnish herbicide applicators | |||
| Buccal, pharynx (ICD-8 140-149) | |||
| Incidence | 5 | 1.0 (0.3-2.3) | |
| Mortality | 0 | 0.0 (0.0-3.0) | |
| "Other respiratory" (ICD-8 160, 161,163)— | |||
| Incidence | 4 | 1.1 (0.3-2.7) | |
| Mortality | 1 | 0.5 (0.0-2.9) | |
| Italian licensed pesticide users | |||
| Buccal cavity, pharynx Licensed Swedish pesticide applicators—incidence |
18 | 0.3 (0.2-0.5) | |
| Lip | 14 | 1.8 (1.0-2.9) | |
| Reference | Study Populationa | (Exposed Casesb |
Exposure of Interest/Estimated Risk (95% CI)b |
| Paper and Pulp Workers | Dioxin | ||
| IARC cohort of pulp and paper workers Exposure to nonvolatile organochlorine | |||
| compounds (oral cavity, and pharynx) | |||
| Never | 33 | 0.9 (0.6-1.3) | |
| Ever | 15 | 0.5 (0.3-0.9) | |
| Danish male, female paper-mill workers | |||
| Buccal cavity (ICD-7 140-144) | |||
| Men | 24 | 1.0 (0.7-1.5) | |
| Women | 4 | 1.5 (0.4-3.8) | |
| Pharynx (ICD-7 145-149) | |||
| Men | 15 | 2.0 (1.1-3.3) | |
| Women | 2 | 2.1 (0.2-7.6) | |
| Tonsil cancers among pharyngeal cancers | 11 | nr | |
| Northwestern US paper and pulp workers | 90%CI | ||
| Buccal cavity, pharynx (ICD-7 140-148) | 1 | 0.1 (0.0-0.7) | |
| Nasal (ICD-7 160) | 0 | nr | |
| ENVIRONMENTAL | |||
| Seveso, Italy Residential Cohort | TCDD | ||
| Seveso residents—10-yr follow-up—incidence | |||
| Buccal cavity (ICD-9 140-149) | |||
| Zone B—Men | 6 | 1.7 (0.8-3.9) | |
| Women | 0 | nr | |
| Zone R—Men | 28 | 1.2 (0.8-1.7) | |
| Women | 0 | nr | |
| Nose, nasal cavities (ICD-9 160) | |||
| Zone R—Men | 0 | nr | |
| Women | 2 | 2.6 (0.5-13.3) | |
| Other Environmental Studies | |||
| Residents of northern Sweden (44 nasal, 27 | Phenoxy acid, | ||
| nasopharyngeal cancers) | chlorophenols | ||
| Phenoxy acid exposure | 8 | 2.1 (0.9-4.7) | |
| Chlorophenol exposure | 9 | 6.7 (2.8-16.2) | |
ABBREVIATIONS: ACC, Army Chemical Corps; AFHS, Air Force Health Study; AHS, Agricultural Health Study; CDC, Centers for Disease Control and Prevention; CI, confidence interval; COI, chemical of interest; IARC, International Agency for Research on Cancer; ICD, International Classification of Diseases; MCPA, 2 methyl-4-chlorophenoxyacetic acid; nr, not reported; NZ, New Zealand; PCDD, polychlorinated dibenzo-p-dioxins (highly chlorinated, if four or more chlorines); PM, proportionate mortality; SEA, Southeast Asia; TCDD, 2,3,7,8-tetrachlorodibenzo-p-dioxin; VES, Vietnam Experience Study.
aSubjects are male, and outcome is mortality unless otherwise noted.
bGiven when available; results other than estimated risk explained individually.
increased but nonsignificant adjusted relative risk (RR) of 1.68 (95% confidence interval [CI] 0.33–8.73). In the prior report on mortality through 1991 (Dalager and Kang, 1997), they had observed three cases in the Vietnam cohort and no cases in the non-Vietnam cohort.
Occupational Studies
McBride et al. (2009a,b) reported on the mortality experience through 2004 of the New Zealand cohort of 1,599 workers who had been employed in manufacturing phenoxy herbicides from trichlorophenol (TCP); picloram was also produced in the plant. In their analysis (McBride et al., 2009a), there were three deaths from buccal cavity and pharyngeal cancer in the ever-exposed group and no deaths in the smaller never-exposed group, for a nonsignificant excess standardized mortality ratio (SMR) of 2.6 (95% CI 0.5–7.6). No deaths from nasopharyngeal cancer were observed in either group. The small numbers of cases limit interpretation of the data. The results in McBride et al. (2009b) have not been included, because they were diluted by inclusion of a set of workers who had no possible opportunity for TCDD exposure and no observed deaths.
Environmental Studies
There have been no environmental studies of oral, nasal, or pharyngeal cancers and exposure to the chemicals of interest since Update 2008.
Biologic Plausibility
As noted above, there is now accepted evidence that HPV contributes causally to cancers of the head and neck (Marur et al., 2010; Szentirmay et al., 2005) and to tonsil cancers in particular (Gillison and Shah, 2001). It is unknown whether Agent Orange exposure contributes to a susceptibility to viral infection or action, but it warrants further exploration. The sparseness of data on the specific tumor site and a general lack of information on smoking, drinking, and viral exposure status in the few available epidemiologic studies preclude exploration of this hypothesis in the literature today.
Long-term animal studies have examined the effect of exposure to the chemicals of interest on tumor incidences (Charles et al., 1996; Stott et al., 1990; Walker et al., 2006; Wanibuchi et al., 2004). The National Toxicology Program study (Yoshizawa et al., 2005a) has also reported an increase in the incidence of gingival squamous-cell carcinoma in female rats treated orally (by gavage) with TCDD at 100 ng/kg 5 days/week for 104 weeks. The incidences of gingival squamous-cell hyperplasia was significantly increased in all groups treated at 3–46 ng/kg. In addition, squamous-cell carcinoma of the oral mucosa of the palate was increased. Increased neoplasms of the oral mucosa were previously
observed and described as carcinomas of the hard palate and nasal turbinates (Kociba et al., 1978). Kociba et al. (1978) also reported a small increase in the incidence of tongue squamous-cell carcinoma. A similar 2-year study performed in female rats failed to reveal a pathologic effect of TCDD on nasal tissues (Nyska et al., 2005).
The biologic plausibility of the carcinogenicity of the chemicals of interest is discussed in general at the beginning of this chapter.
Synthesis
The new studies of oral, nasal, and pharyngeal cancers reported small, nonsignificant excesses in mortality from oral and pharyngeal cancers with very small numbers of cases. These data are not sufficient, taken in combination with the previously reviewed literature, to suggest an association with the herbicides sprayed in Vietnam.
Conclusion
On the basis of the evidence reviewed here and in previous VAO reports, the committee concludes that there is inadequate or insufficient evidence to determine whether there is an association between exposure to the chemicals of interest and oral, nasal, or pharyngeal cancers.
CANCERS OF THE DIGESTIVE ORGANS
Until Update 2006, VAO committees had reviewed “gastrointestinal tract tumors” as a group consisting of stomach, colorectal, and pancreatic cancers, with esophageal cancer being formally factored in only since Update 2002. With more evidence from occupational studies available, VAO updates now address cancers of the digestive organs individually. Findings on cancers of the digestive organs as a group (ICD-9 150–159) are too broad for useful etiologic analysis and will no longer be considered.
Esophageal cancer (ICD-9 150), stomach cancer (ICD-9 151), colon cancer (ICD-9 153), rectal cancer (ICD-9 154), and pancreatic cancer (ICD-9 157) are among the most common cancers. ACS estimated that about 223,350 people would receive diagnoses of those cancers in the United States in 2010 and that 113,240 people would die from them (Jemal et al., 2010). When other digestive cancers (for example, small intestine, anal, and hepatobiliary cancers) were included, the 2010 estimates for the United States were about 274,330 new diagnoses and 139,580 deaths (Jemal et al., 2010). Collectively, tumors of the digestive organs were expected to account for 19% of new cancer diagnoses and 24% of cancer deaths in 2010. The average annual incidences of gastrointestinal cancers are presented in Table 7-4.
TABLE 7-4 Average Annual Incidence (per 100,000) of Selected Gastrointestinal Cancers in United Statesa
| 55-59 Years Old | 60-64 Years Old | 65-69 Years Old | ||||||||||
| All Races | White | Black | All Races | White | Black | All Races | White | Black | ||||
| Stomach: | ||||||||||||
| Men | 153 | 13.7 | 22.4 | 23.3 | 21.2 | 38.5 | 37.9 | 32.6 | 72.7 | |||
| Women | 7.1 | 5.5 | 11.7 | 8.9 | 7.1 | 14.5 | 15.5 | 12.8 | 23.1 | |||
| Esophagus: | ||||||||||||
| Men | 16.5 | 16.5 | 21.4 | 24.6 | 25.0 | 31.0 | 343 | 36.1 | 36.0 | |||
| Women | 3.0 | 2.7 | 6.4 | 3.8 | 3.7 | 7.0 | 83 | 7.5 | 14.6 | |||
| Colon (excluding rectum): | ||||||||||||
| Men | 53.5 | 50.2 | 85.1 | 81.7 | 77.9 | 128.6 | 129.6 | 126.0 | 1813 | |||
| Women | 41.5 | 37.6 | 66.4 | 61.7 | 57.8 | 95.1 | 104.2 | 101.6 | 140.1 | |||
| Rectum and rectosigmoid junction: | ||||||||||||
| Men | 32.1 | 30.2 | 34.7 | 42.7 | 41.4 | 41.3 | 62.0 | 59.7 | 67.4 | |||
| Women | 19.3 | IS.2 | 22.1 | 23.5 | 23.1 | 28.4 | 31.8 | 29.9 | 39.9 | |||
| Liver and intrahepatic bile duct: | ||||||||||||
| Men | 32.6 | 25.2 | 78.8 | 31.6 | 24.8 | 67.1 | 34.5 | 263 | 48.8 | |||
| Women | 8.1 | 6.4 | 14.5 | 8.1 | 6.0 | 13.6 | 12.7 | 103 | 13.6 | |||
| Pancreas: | ||||||||||||
| Men | 22.6 | 21.7 | 33.9 | 36.5 | 35.2 | 58.4 | 53.6 | 52.7 | 79.6 | |||
| Women | 15.6 | 15.1 | 21.7 | 25.0 | 23.8 | 40.1 | 36.7 | 34.7 | 563 | |||
| Small intestine: | ||||||||||||
| Men | 53 | 5.4 | 6.8 | 6.6 | 6.6 | 9.9 | 9.2 | 8.8 | 14.5 | |||
| Women | 3.6 | 3.4 | 7.0 | 4.2 | 3.9 | 8.5 | 6.1 | 6.1 | II.1 | |||
| Anus, anal canal, and anorectum: | ||||||||||||
| Men | 33 | 3.4 | 4.7 | 3.2 | 3.5 | 2.8 | 4.0 | 4.4 | 4.1 | |||
| Women | 4.5 | 4.8 | 4.9 | 4.6 | 5.0 | 3.5 | 5.4 | 5.8 | 6.2 | |||
| Other digestive organs: | ||||||||||||
| Men | 1.1 | 0.8 | 3.4 | 1.3 | 1.4 | 1.6 | 2.2 | 2.4 | 1.2 | |||
| Women | 0.6 | 0.5 | 0.9 | 1.4 | 1.4 | 1.3 | 1.4 | 1.2 | 3.1 | |||
| Gallbladder | ||||||||||||
| Men | 1.0 | 0.8 | 1.6 | 1.4 | 13 | 2.0 | 2.9 | 2.4 | 3.5 | |||
| Women | 2.2 | 1.8 | 4.9 | 2.5 | 23 | 3.5 | 4.9 | 4.6 | 6.2 | |||
| Other biliary: | ||||||||||||
| Men | 25 | 2.1 | 5.0 | 5.4 | 5.1 | 5.2 | 7.0 | 6.8 | 4.7 | |||
| Women | 1.8 | 1.8 | 0.9 | 2.7 | 2.5 | 4.1 | 5.1 | 4.8 | 4.9 | |||
aSurveillance, Epidemiology, and End Results program, nine standard registries, crude age-specific rates, 2004–2008 (NCI, 2010).
The incidences of stomach, colon, rectal, and pancreatic cancers increase with age. In general, the incidences are higher in men than in women and higher in blacks than in whites. Other risk factors for the cancers vary but always include family history of the same form of cancer, some diseases of the affected organ, and diet. Tobacco use is a risk factor for pancreatic cancer and possibly stomach cancer (Miller et al., 1996). Infection with the bacterium Helicobacter
pylori increases the risk of stomach cancer. Type 2 diabetes is associated with an increased risk of cancers of the colon and pancreas (ACS, 2006).
It is noteworthy that there has been one report of Vietnam veterans that included all gastrointestinal cancers collectively. Cypel and Kang (2010) published an update on the disease-related mortality experience of ACC veterans who handled or sprayed herbicides in Vietnam in comparison with their non-Vietnam veteran peers or US men. Vital status was determined through December 31, 2005. In the analyses, the site-specific rates for digestive cancers were not examined. No statistically significant excess mortality from all cancers of the digestive tract was found in ACC Vietnam veterans compared with non-Vietnam veterans (adjusted RR = 1.01, 95% CI 0.56–1.83).
Epithelial tumors of the esophagus (squamous-cell carcinomas and adeno-carcinomas) are responsible for more than 95% of all esophageal cancers (ICD-9 150); 16,640 newly diagnosed cases and 14,500 deaths were estimated for 2010 (Jemal et al., 2010). The considerable geographic variation in the incidence of esophageal tumors suggests a multifactorial etiology. Rates of esophageal cancer have been increasing in the last 2 decades. Adenocarcinoma of the esophagus has slowly replaced squamous-cell carcinoma as the most common type of esophageal malignancy in the United States and western Europe (Blot and McLaughlin, 1999). Squamous-cell esophageal carcinoma rates are higher in blacks than in whites and higher in men than in women. Smoking and alcohol ingestion are associated with the development of squamous-cell carcinoma; these risk factors have been less thoroughly studied for esophageal adenocarcinoma, but they appear to be associated. The rapid increase in obesity in the United States has been linked to increasing rates of gastroesophageal reflux disease (GERD), and the resulting rise in chronic inflammation has been hypothesized as explaining the link between GERD and esophageal adenocarcinoma. The average annual incidence of esophageal cancers is shown in Table 7-4.
Conclusions from VAO and Previous Updates
The committee responsible for VAO explicitly excluded esophageal cancer from the group of gastrointestinal tract tumors, for which it was concluded that there was limited or suggestive evidence of no association with exposure to the herbicides used by the US military in Vietnam. Esophageal cancers were not separately evaluated and were not categorized with this group until Update 2004. The committee responsible for Update 2006 concluded that there was not enough evidence on each of the chemicals of interest to sustain that negative conclusion for any of the cancers in the gastrointestinal group and that, because these various types of cancer are generally regarded as separate disease entities, the evidence
on each should be evaluated separately. Esophageal cancer was thus reclassified into the default category of inadequate or insufficient evidence to determine whether there is an association. No additional studies reporting on esophageal cancer were reviewed in Update 2008. Table 7-5 summarizes the results of the relevant studies concerning esophageal cancer.
Update of the Epidemiologic Literature
Vietnam-Veteran Studies There have been no published studies of esophageal cancer in Vietnam veterans since the last VAO update in 2008.
Occupational Studies Four occupational cohort studies have been published since the last VAO update in 2008. Collins et al. (2008, 2009a,b) published a series of papers examining the mortality experience of TCP and pentachlorophenol (PCP) workers employed in a Dow Chemical Company in Midland, Michigan, from 1937 to 1980. The TCP workers constitute the Dow cohort in the NIOSH cohort. Serum dioxin evaluation to estimate exposures to five dioxins was used in a subgroup of 98 workers (Collins et al., 2008). Although the serum dioxin, furan, and PCB concentrations were measured many years after exposure, distinct patterns of dioxin congeners among workers with different chlorophenol exposures were found.
The mortality experience of Dow chemical TCP workers in Midland potentially exposed to TCDD was reported by Collins et al. (2009a). Their study followed 1,615 workers who worked at least 1 day in a department with potential TCDD exposure. Follow-up ended on December 31, 2003, and the mean duration of follow-up was 36.4 years. Cause of death was determined by death certificates and SMRs were calculated by using national mortality figures. Some 17% of the sample (280) had serum TCDD evaluations that indicated higher concentrations than those of unexposed workers (Collins et al., 2007). Five esophageal-cancer deaths were observed, for an SMR of 1.0 (95% CI 0.3–2.2). None of the five people had had concurrent PCP exposure.
The second report on the Dow Midland cohort (Collins et al., 2009b) described the mortality experience of 773 PCP workers who were exposed to chlorinated dioxins not including TCDD. Of the cohort, 75% had been followed for more than 27 years. SMRs were calculated by comparing the PCP workers with the general US population and with that of Michigan. There were two observed deaths from esophageal cancer (SMR = 0.8, 95% CI 0.1–2.9).
McBride et al. (2009a,b) published two reports on a mortality follow-up of the workers in the Dow AgroSciences plant in New Plymouth, New Zealand, who were potentially exposed to TCDD. In McBride et al. (2009a), the SMR of ever-exposed workers was compared with that of never-exposed workers. The SMR for esophageal-cancer deaths in exposed workers was 2.5 (95% CI 0.7–6.4) compared with an SMR of 2.1 (95% CI 0.1–12.2) in the never-exposed group. The
TABLE 7-5 Selected Epidemiologic Studies—Esophageal Cancer
| Reference | Study Populationa | Exposed Casesb |
Exposure of Interest/ Estimated Risk (95% CI)b |
| VIETNAM VETERANS | |||
| US Centers for Disease Control and Prevention | All COIs | ||
| Follow-up of CDC VES cohort ICD-9 140-149) | 6 | 1.2 (0.4-4.0) | |
| State Studies of US Vietnam Veterans | All COIs | ||
| PM study of deaths (1974-1989) of Michigan | 9 | 0.9 (0.4-1.6) | |
| Vietnam-era veterans—deployed vs nondeployed | |||
| Australian Vietnam Veterans vs Australian Population | All COIs | ||
| Australian male Vietnam veterans vs Australian | 70 | 1.2 (0.9-1.5) | |
| population—incidence | |||
| Navy | 19 | 1.6 (0.9-2.4) | |
| Army | 40 | 1.1 (0.7-1.4) | |
| Air Force | 11 | 1.5 (0.8-2.8) | |
| Australian male Vietnam veterans vs Australian | 67 | 1.1 (0.8-1.3) | |
| population—mortality | |||
| Navy | 13 | 1.0 (0.5-1.7) | |
| Army | 42 | 1.0 (0.7-1.3) | |
| Air Force | 12 | 1.5 (0.8-2.6) | |
| Australian military Vietnam veterans | 23 | 1.2 (0.7-1.7) | |
| Australian Conscripted Army National Service Vietnam-Era (deployed vs nondeployed) Veterans | All COIs | ||
| Australian male conscripted Army National | |||
| Service Vietnam-era veterans: deployed vs nondeployed | |||
| Incidence | 9 | 1.9 (0.6-6.6) | |
| Mortality | 10 | 1.3 (0.5-3.6) | |
| Australian National Service Vietnam veterans | 1 | 1.3 (0.0- > 10) | |
| OCCUPATIONAL | |||
| IARC Phenoxy Herbicide Cohort(mortality vs national mortalityrates) | Dioxin, Phenoxy Herbicides | ||
| IARC cohort, male and female workers exposed | 28 | 1.010.7-1.4) | |
| to any phenoxy herbicide or chlorophenol | |||
| Exposed to highly chlorinated PCDDs | 20 | 1.3 (0.8-1.9) | |
| Not exposed to highly chlorinated PCDDs | 6 | 0.5 (0.2-1.1) | |
| IARC cohort—exposed subcohort (men and | 8 | 0.6 (0.3-1.2) | |
| (women) | |||
| Dow Chemical Company—Midland. MI (included in IARC and (NIOSH cohorts) | Dioxin, Phenoxy Herbicides | ||
| Trichlorophenol workers | 5 | 1.0 (0.3-2.2) | |
| Pentachlorophenol workers | 2 | 0.8 (0.1-2.9) | |
| Reference | Study Populationa | Exposed Casesb |
Exposure of Interest/ Estimated Risk (95% CI)b |
| New Zealand Production Workers—Dow plant in Plymouth, NZ (included ini IARC cohort) | Dioxin. Phenoxy Herbicides |
||
| Mc Bride et al, 2009a | 1,599 production workers (male and female) vs national rates—mortality 1969 through 2004 | ||
| Ever exposed | 4 | 2.5 (0.7-6.4) | |
| Never exposed | 1 | 2.1(0.1-12.2) | |
| ’t Mannetje et aL, 2005 | New Zealand phenoxy herbicide producers (men and women) | 2 | 2.0(0.2-7.0) |
| Phenoxy herbicide sprayers (> 99% men) | 1 | 0.7 (0.0-4.0) | |
| United Kingdom Production Workers (included in IARC cohort | Dioxin. Phenoxy Herbicides |
||
| Coggon et al., 1986 | British MCPA production workers | 8 | 0.9(0.4-1.9) |
| Agricultural Health Study | Herbicides | ||
| Blair et al.. | US AHS | ||
| 2005a | Private applicators (men and women) | 16 | 0.5 (0.3-0.9) |
| Spouses of private applicators (> 99% women) | 1 | 0.3(0.1-1.9) | |
| Other Agricultural Workers | Herbicides | ||
| Lee et al.. | Population-based case-control—agricultural | 137 | |
| 2004a | pesticide use and adenocarcinoma of the esophagus | ||
| Insecticides | 0.7(0.4-1.1) | ||
| Herbicides | 0.7(0.4-1.2) | ||
| Ronco | Danish farm workers—incidence | ||
| etal.. 1992 | Male—Self-employed | 32 | 0.4 (p <0.05) |
| Employee | 13 | 0.9 (nr) | |
| Female—Self-employed | 1 | 1.4 (nr) | |
| Family worker | 2 | 0.4 (nr) | |
| Wiklund, | Swedish male and female agricultural | 99% a | |
| 1983 | workers—incidence | 169 | 0.6 (0.5-0.7) |
| Other Studies of Herbicide and Pesticide Applicators | Herbicides | ||
| Magnani | UK case—control | ||
| etal.. 1987 | Herbicides | nr | 1.6(0.7-3.6) |
| Chlorophenols | nr | 1.2(0.7-2.2) | |
| Asp et al.. | Finnish herbicide applicators—incidence | 3 | 1.6(0.3-4.6) |
| 1994 | Finnish herbicide applicators—mortality | 2 | 1.3(0.2-4.7) |
| Forestry Workers | |||
| Reif et al.. | New Zealand forestry workers—nested case- | 4 | 1.8(0.7-4.8) |
| 1989 | control (incidence) correspondence | ||
| Paper and Pulp Workers | Dioxins | ||
| McLean | IARC cohort of pulp and paper workers | ||
| Et al.. 2006 | Never | 27 | 0.7(0.4-1.0) |
| Ever | 26 | 0.8(0.5-1.2) | |
| Reference | Study Populationa | Exposed Casesb |
Exposure of Interest/ Estimated Risk (95% CI)b |
| ENVIRONMENTAL Seveso, Italy Residential Cohort |
TCDD |
||
| Pesalori el al, 2009 |
Seveso—20-yr follow-up to 19%—incidence (men and women, combined) |
||
| Zone A | 0 | ||
| ZoneB | 1 | 0.3(0.0-1.9) | |
| ZoneR | 35 | 1.3(0.9-1.9) | |
ABBREVIATIONS: AHS, Agricultural Health Study; CDC, Centers for Disease Control and Prevention; CI, confidence interval; COI, chemical of interest; IARC, International Agency for Research on Cancer; ICD, International Classification of Diseases; MCPA, 2-methyl-4-chlorophenoxyacetic acid; MI, Michigan; NIOSH, National Institute for Occupational Safety and Health; nr, not reported; NZ, New Zealand; PCDD, polychlorinated dibenzo-p-dioxin (highly chlorinated, if four or more chlorines); PM, proportionate mortality; TCDD, 2,3,7,8-tetrachlorodibenzo-p-dioxin; VES, Vietnam Experience Study.
aSubjects are male, and outcome is mortality unless otherwise noted.
bGiven when available; results other than estimated risk explained individually.
SMR for esophageal cancer according to estimated effective cumulative exposure to TCDD was not calculated. The results in McBride et al. (2009b) have not been included, because they were diluted by inclusion of a set of workers who had no opportunity for TCDD exposure and no observed deaths.
Environmental Studies Esophageal-cancer cases were reported in the cancer-incidence study of the population (males and females combined) exposed to dioxin after the Seveso accident in 1976 (Pesatori et al., 2009). No esophageal cancers were observed in Zone A (high exposure). Only one esophageal-cancer case was found in residents of Zone B (medium exposure area) (RR = 0.26, 95% CI 0.04–1.91). Some 35 esophageal-cancer cases were reported in Zone R (low exposure) (RR = 1.33, 95% CI 0.92–1.92).
Biologic Plausibility
Long-term animal studies have examined the effect of exposure to the chemicals of interest on tumor incidence (Charles et al., 1996; Stott et al., 1990; Walker et al., 2006; Wanibuchi et al., 2004), and no increase in the incidence of esophageal cancer has been reported in laboratory animals after exposure to them. A recent biomarker study analyzed esophageal-cell samples from patients who had been exposed to indoor air pollution of different magnitudes and did or did not have high-grade squamous–cell dysplasia or a family history of upper gas-
trointestinal tract (UGI) cancer (Roth et al., 2009). AHR expression was higher in patients with a family history of UGI cancer, whereas indoor air pollution, esophageal squamous-cell dysplasia category, age, sex, and smoking were not associated with AHR expression. The results suggest that enhanced expression of the AHR in patients who had a family history of UGI cancer may contribute to UGI-cancer risk associated with AHR ligands, such as polycyclic aromatic hydrocarbons, which are found in cigarette smoke, and with TCDD.
The biologic plausibility of the carcinogenicity of the chemicals of interest is discussed in general at the beginning of this chapter.
Synthesis
The studies reviewed previously did not provide sufficient evidence to determine whether there is an association between exposure to the chemicals of interest and esophageal cancer, and no new additional information that would alter this judgment was found by the present committee. No toxicologic studies provide evidence of the biologic plausibility of an association between the chemicals of interest and tumors of the esophagus.
Conclusion
On the basis of the evidence reviewed here and in previous VAO reports, the committee concludes that there is inadequate or insufficient evidence to determine whether there is an association between exposure to the chemicals of interest and esophageal cancer.
The incidence of stomach cancer (ICD-9 151) increases in people 50–64 years old. ACS estimated that 12,730 men and 8,270 women would receive diagnoses of stomach cancer in the United States in 2010 and that 6,350 men and 4,220 women would die from it (Jemal et al., 2010). In general, the incidence is higher in men than in women and higher in blacks than in whites. Other risk factors include family history of this cancer, some diseases of the stomach, and diet. Infection with the bacterium Helicobacter pylori increases the risk of stomach cancer. Tobacco use and consumption of nitrite- and salt-preserved food may also increase the risk of stomach cancer (Brenner et al., 2009; Key et al., 2004; Miller et al., 1996). The average annual incidence of stomach cancer is shown in Table 7-4.
Conclusions from VAO and Previous Updates
Update 2006 considered stomach cancer independently for the first time. Prior updates developed a table of results for stomach cancer, but conclusions about the adequacy of the evidence of its association with herbicide exposure
had been reached in the context of gastrointestinal tract cancers. The committee responsible for VAO concluded that there was limited or suggestive evidence of no association between exposure to the herbicides used by the US military in Vietnam and gastrointestinal tract tumors, including stomach cancer. The committee responsible for Update 2006 concluded that there was not enough evidence on each of the chemicals of interest to sustain this negative conclusion for any of the cancers in the gastrointestinal group and that, because these various types of cancer are generally regarded as separate disease entities, the evidence on each should be evaluated separately. Stomach cancer was thus reclassified into the default category of inadequate or insufficient evidence to determine whether there was an association.
Positive findings of an association with phenoxy herbicide exposure from a well-conducted nested case–control study of stomach cancer in the United Farm Workers of America cohort (Mills and Yang, 2007) led the committee responsible for Update 2008 to reconsider the results of several earlier studies. Reif et al. (1989) reported a significant relationship between stomach cancer and the nonspecific exposure of being a forestry worker. Cocco et al. (1999) had found an association with herbicide exposure but had not analyzed specific chemicals, and Ekström et al. (1999) found significant associations between the occurrence of stomach cancer and exposure to phenoxy herbicides in general and to several specific phenoxy herbicide products. In updated mortality findings from Seveso concerning TCDD exposure, Consonni et al. (2008) found no increases in deaths from stomach cancer. In the absence of supportive findings from studies of Vietnam-veteran cohorts or IARC cohorts or from the US Agricultural Health Study (AHS), that committee retained stomach cancer in the inadequate or insufficient category.
Table 7-6 summarizes the results of the relevant studies concerning stomach cancer.
Update of the Epidemiologic Literature
Vietnam-Veteran Studies No studies of exposure to the chemicals of interest and stomach cancer in Vietnam veterans have been published since Update 2008.
Occupational Studies Three occupational-cohort studies have been published since Update 2008. Collins et al. (2008, 2009a,b) published a series of papers examining the mortality experience of workers employed by the Dow Chemical Company in Midland, Michigan, from 1937 to 1980. Serum dioxin was evaluated to estimate exposures to five dioxins in a group of 98 workers (Collins et al., 2008). Although serum dioxin, furan, and PCB concentrations were measured many years after exposure, distinct patterns of dioxin congeners in workers who had different chlorophenol exposures were found. Collins et al. (2009a) described the mortality experience of 1,615 workers who had been exposed to TCP production. The mean duration of follow-up was 36.4 years. Eight cases of stomach
TABLE 7-6 Selected Epidemiologic Studies—Stomach Cancer
| Reference | Study Populationa | Exposed Casesb |
Exposure of Interest/ Estimated Risk (95% CI)b |
| VIETNAM VETERANS | |||
| US Air Force Health Study—Ranch Hands veterans vs SEA veterans (unless otherwise noted |
All COIs | ||
| Comparison subjects only from AFHS (digestive system)—incidence |
|||
| Serum TCDD (pg/g) based on model with exposure variable loge(TCDD) | |||
| Per unit increase of -Ioge(TCDD) (pg/g) | 24 | 1.8 (0.8-3.9) | |
| 0.4-2.6 | 4 | nr | |
| 2.6-3.8 | 3 | 1.0 (0.2-4.8) | |
| 3.8-5.2 | 7 | 2.0 (0.5-8.2) | |
| > 5.2 | 10 | 3.3 (0.9-12.5) | |
| Number of years served in SEA Per year of service Quartiles (years in SEA) |
24 | 1.2 (1.0-1.4) | |
| 0.8-13 | 4 | nr | |
| 1.3-2.1 | 4 | 1.0 (0.2-3.8) | |
| 2.1-3.7 | 5 | 1.1 (0.3-4.2) | |
| 3.7-16.4 | 11 | 2.1 (0.6-7.3) | |
| White AFIIS subjects vs national rates | |||
| (digestive system) Ranch Hand veterans |
|||
| Incidence | 16 | 0.6 (0.4-1.0) | |
| Tours 1966-1970 | 14 | 0.6 (0.4-1.1) | |
| Mortality | 6 | 0.4 (0.2-0.9) | |
| Comparison veterans | |||
| Incidence | 31 | 0.9 (0.6-1.2) | |
| Tours 1966-1970 | 24 | 0.9 (0.6-1.3) | |
| Mortality | 14 | 0.7 (0.4-1.1) | |
| US CDC Vietnam Experience Study | All COIs | ||
| Follow-up of CDC VES (stomach) | 5 | nr | |
| US VA Mortality Study of Army and Navy Veterans—Ground Troops | All COIs | ||
| Serving July 4, 1965-March 1, 1973 | |||
| Breslin et al., 1988 | Army Vietnam veterans | 88 | 1.1 (0.9-1.5) |
| Marine Vietnam veterans | 17 | 0.8 (0.4-1.6) | |
| State Studies of US Vietnam Veterans | All COIs | ||
| Anderson et al., 1986 | Wisconsin Vietnam veterans | 1 | nr |
| Australian Vietnam Veterans vs Australian Population | All COIs | ||
| Australian male Vietnam veterans vs Australian | 104 | 0.9 (0.7-1.1) | |
| population—incidence | |||
| Navy | 28 | 1.1 (0.7-1.6) | |
| Army | 66 | 0.9 (0.7-1.1) | |
| Air Force | 10 | 0.7 (0.3-1.3) | |
| Reference | Study Populationa | Exposed Casesb |
Exposure of Interest/ Estimated Risk (95% CI)b |
| Australian male Vietnam veterans vs Australian | 76 | 0.9 (0.7-1.21 | |
| population—mortality | |||
| Navy | 22 | 1.3 (0.8-1.81 | |
| Army | 50 | 0.9 (0.7-1.2) | |
| Air Force | 4 | 0.4 (0.1-1.0) | |
| Australian military Vietnam veterans | 32 | 1.1 (0.7-1.4) | |
| Australian Conscripted Army National Service Vietnam-Era Veterans (deployed vs nondeployed) | All COIs | ||
| Australian male conscripted Army National | |||
| Service Vietnam-era veterans: deployed vs nondeployed | |||
| Incidence | 11 | 0.6 (0.2-1.2) | |
| Mortality | 7 | 0.7 (0.2-2.0) | |
| Australian National Service Vietnam veterans | 4 | 1.7 (0.3- > 10) | |
| OCCUPATIONAL | |||
| IARC Phenoxy Herbicide Cohort (mortality vs national mortalityrates) | Dioxin, phenoxy herbicides | ||
| IARC cohort, male and female workers exposed | 72 | 0.9 (0.7-1.1) | |
| to any phenoxy herbicide or chlorophenol | |||
| Exposed to highly chlorinated PCDDs | 42 | 0.9 (0.7-1.2) | |
| Not exposed to highly chlorinated PCDDs | 30 | 0.9 (0.6-1.3) | |
| IARC cohort—women | 1 | 1.4 (nr) | |
| Saracci | IARC cohort—exposed subcohort (men and | 40 | 0.9 (0.6-1.2) |
| NIOSH Mortality Cohort (12 US plants, production 1942-1984) (included inIARC cohort) |
Dioxin, Phenoxy Herbicides |
||
| US chemical production workers | 13 | 1.0 (0.6-1.81 | |
| NIOSH—entire cohort | 10 | 1.0 (0.5-1.9) | |
| ≥ 1-year exposure, ≥ 20-year latency | 4 | 1.4 (0.4-3.5) | |
| Monsanto Plant in Nitro. WV (included in IARC and KIOSH cohorts | Dioxin, Phenoxy Herbicides |
||
| Collins | Monsanto Company workers | 0 | 0.0 (0.0-1.1) |
| Dow Chemical Company—Midland, MI (included in IARC and NIOSH cohorts) | Dioxin, Phenoxy Herbicides |
||
| Trichlorophenol workers | 8 | 1.4 (0.6-2.7) | |
| Pcntachlorophenol workers | 4 | 1.2 (0.3-3.1) | |
| Dow production workers | nr | 1.5 (0.7-2.7) | |
| Reference | Study Populationa | Exposed Casesb |
Exposure of Interest/ Estimated Risk (95% CI)b |
| Dow 2,4-D production worker | |||
| Digestive organs, peritoneum | 16 | 0.7 (0.4-1.2) | |
| Dow pentachlorophenol production workers | |||
| 0-yr latency | 4 | 1.7 (0.5-4.3) | |
| 15-yr latency | 3 | 1.8 (0.4-5.2) | |
| Dow 2.4-D production workers | 0 | nr (0.0-3.7) | |
| BASF Cohort (included in IARC cohort) | Dioxin, Phenoxy Herbicides |
||
| BASF employees—incidence | 3 | 1.0 (0.2-2.9) | |
| TCDD < 0.1 µg/kg of body weight | 0 | 0.0 (0.0-3.4) | |
| TCDD 0.1-0.99 µg/kg of body weight | 1 | 1.3 (0.0-7.0) | |
| TCDD ≥ 1 µg/kg of body weight | 2 | 1.7 (0.2-6.2) | |
| BASF employees—basic cohort | 90% CI | ||
| 3 | 3.0 (0.8-7.7) | ||
| Danish Production Workers (included in IARC cohort) | Dioxin, Phenoxy Herbicides |
||
| Danish production workers—incidence | |||
| Men | 12 | 1.3 (nr) | |
| Women | 1 | 0.7 (nr) | |
| Dutch Production Workers (included in IARC cohort) | Dioxin, Phenoxy Herbicides |
||
| Dutch chlorophenoxy workers | |||
| Factory A | 5 | 2.2 (0.4-13.2) | |
| Factory B | 4 | 1.2 (0.3-4.7) | |
| Dutch chemical production workers | 3 | 1.0 (0.2-2.9) | |
| Bueno de | Dutch phenoxy herbicide workers | 2 | 0.7 (0.1-2.7) |
| Mcsquita et al., 1993 | |||
| German Production Workers (included in IARC cohort) | Dioxin, Phenoxy Herbicides |
||
| German production workers | |||
| Plant I | 12 | 1.3 (0.7-2.2) | |
| Plant II | 0 | nr | |
| Plant 111 | 0 | nr | |
| Plant IV | 2 | 0.6 (0.1-2.3) | |
| German production workers—men, women | |||
| Men | 12 | 1.2 (0.6-2.1) | |
| New Zealand Production Workers—Dow plant in Plymouth, NZ (included in IARC cohort) | Dioxin, Phenoxy Herbicides |
||
| 1.599 production workers (male and female) vs national rates—mortality 1969 through 2004 |
|||
| Ever exposed | 4 | 14 (0.4-3.6) | |
| Never exposed | 2 | 2.3 (0.3-8.4) | |
| Reference | Study Populationa | Exposed Casesb |
Exposure of Interest/ Estimated Risk (95% CI)b |
| New Zealand phenoxy herbicide producers (men and women) | 2 | 1.1 (0.1-4.0) | |
| Phenoxy herbicide sprayers ( > 99% men) | 3 | 1.4 (0.3-4.0) | |
| United Kingdom Production Workers (included in IARC cohort) | Dioxin, Phenoxy Herbicides |
||
| British MCPA production workers | 26 | 0.9 (0.6-1.3) | |
| Agricultural Health Study | Herbicides | ||
| AHS—incidence (all digestive cancers) | |||
| Private applicators (men and women) | 462 | 0.8 (0.8-0.9) | |
| Spouses of private applicators (> 99% women) | 161 | 0.9 (0.7-1.0) | |
| Commercial applicators (men and women) | 24 | 1.0 (0.6-1.4) | |
| AHS (stomach cancers) | |||
| Private applicators (men and women) | 10 | 0.5 (0.2-1.0) | |
| Spouses of private applicators ( > 99% women) | 4 | 1.1 (0.3-2.8) | |
| Other Agricultural Workers | Herbicides | ||
| Mills and Yang. 2007 | Nested case-control study of agricultural | ||
| Ever worked in area where 2.4-D used Quartile of lifetime exposure to 2,4-D (lb) |
42 | 1.9 (1.1-3.3) | |
| 0 | 58 | 1.0 | |
| 1-14 | 17 | 2.2 (1.0-4.6) | |
| 15-85 | 14 | 1.6 (0.7-3.5) | |
| 86-1.950 | 11 | 2.1 (0.9-5.1) | |
| Population-based case—control—agricultural | 170 | ||
| pesticide use and adenocarcinoma of stomach | |||
| Insecticides | 0.9 (0.6-1.4) | ||
| Herbicides | 0.9 (0.5-1.4) | ||
| Ekström et al., 1999 | Case—control study of Swedish residents with gastric adenocarcinoma |
||
| All occupational herbicide exposure | 75 | 1.6 (1.1-2.2) | |
| Phenoxyacetic acid exposure | 62 | 1.8 (1.3-2.6) | |
| Hormoslyr (2,4-D and 2,4,5-T) | 48 | 1.7 (1.2-2.6) | |
| 2,4-D only | 3 | nr (vs 0 controls) | |
| MCPA | 11 | 1.8 (0.8-4.1) | |
| Duration of exposure | |||
| Nonexposed to all herbicides | 490 | 1.0 | |
| < 1 month | 11 | 1.6 (0.7-3.5) | |
| 1-6 months | 30 | 1.9 (1.1-3.2) | |
| 7-12 months | 7 | 1.7 (0.6-4.7) | |
| > 1 year | 13 | 1.4 (0.6-3.0) | |
| Other herbicide exposure | 13 | 1.0 (0.5-1.9) | |
| Reference | Study Populationa | Exposed Casesb |
Exposure of Interest/ Estimated Risk (95% CI)b |
| Italian rice growers | 39 | 1.0 (0.7-1.3) | |
| US farmers in 23 slates | |||
| While men | 657 | 1.0 (1.0-1.1) | |
| While women | 12 | 1.2 (0.6-2.0) | |
| Danish farm workers—incidence | |||
| Men | 286 | 0.9 (nr) | |
| Women | 5 | 1.0 (nr) | |
| Canadian farmers | 246 | 0.9 (0.8-1.0) | |
| USDA agricultural extension agents | in | 0.7 (0.4-1.4) | |
| Burmeisler et al., 1983 | Iowa residents—farming exposures | 1,812 | 1.3 (p < 0.05) |
| Swedish male and female agricultural | 99% CI | ||
| workers—incidence | 2,599 | 1.1 (1.0-1.2) | |
| Iowa farmers | 338 | l.l(p < 0.0l) | |
| Other Studies of Herbicide and Pesticide Applicators | Herbicides | ||
| Italian licensed pesticide users | 126 | 0.7 (0.6-0.9) | |
| Dutch licensed herbicide applicators | |||
| Stomach and small intestine | 3 | 0.4 (0.1-1.3) | |
| Dutch licensed herbicide applicators Stomach and small intestine |
|||
| 1 | 0.5 (0.0-2.7) | ||
| Florida pesticide applicators | Expected exposed cases | ||
| 4 | 3.3 | ||
| Forestry Workers | Herbicides | ||
| USDA forest, soil conservationists | 9 | 0.7 (0.3-1.3) | |
| New Zealand forestry workers—nested case-control (incidence) | 13 | 2.2 (1.3-3.9) | |
| Paper and Pulp Workers | Dioxins | ||
| IARC cohort of pulp and paper workers Exposure to nonvolatile organochlorine compounds |
|||
| Never | 146 | 0.9 (0.8-1.1) | |
| Ever | 98 | 0.9 (0.7-1.1) | |
| Danish paper-mill workers—incidence | |||
| Men | 48 | 1.1 (0.8-1.4) | |
| Women | 7 | 1.0 (0.4-2.1) | |
| New Hampshire pulp and paper workers | 5 | 1.2 (0.4-2.8) | |
| Northwestern US paper and pulp workers | 90% CI | ||
| 17 | 1.2 (0.8-1.9) | ||
| Reference | Study Populationa | Exposed Casesb |
Exposure of Interest/ Estimated Risk (95% CI)b |
| US paper and pulp workers | 1 | 0.5 (0.1-3.0) | |
| Other Environmental Studies | Dioxin, 2,4.5-T/ | ||
| US flavor and fragrance chemical plant workers | Expected exposed cases | ||
| 6 | 4.2 | ||
| Swedish railroad workers—tolal exposure to herbicides | Phenoxy acids | ||
| 3 | 2.2 (nr) | ||
| ENVIRONMENTAL Seveso, Italy Residential Cohort |
TCDD | ||
| Seveso residents—25-yr follow-up—men, women | |||
| Zone A | 3 | 0.7 (0.2-2.0) | |
| Zone B | 24 | 0.8 (0.5-1.2) | |
| Zone R | 212 | 1.0 (0.8-1.1) | |
| Seveso—20-yr follow-up to 1996—incidence (men and women, combined) |
|||
| Zone A | 3 | 0.9 (0.3-2.7) | |
| Zone B | 19 | 0.9 (0.6-1.4) | |
| Zone R | 131 | 0.8 (0.7 1.0) | |
| Seveso residents—20-yr follow-up Zones A, B—men |
16 | 0.9 (0.5-1.5) | |
| women | 11 | 1.0 (0.6-1.9) | |
| Seveso residents—15-yr follow-up Zone A—women |
1 | 0.9 (0.0-5.3) | |
| Zone B—men | 10 | 0.8 (0.4-1.5) | |
| women | 7 | 1.0 (0.4-2.1) | |
| Zone R—men | 76 | 0.9 (0.7-1.1) | |
| women | 58 | 1.0 (0.8-1.3) | |
| Seveso residents—10-yr follow-up—incidence Zone B—men |
7 | 1.0 (0.5-2.1) | |
| women | 2 | 0.6 (0.2-2.5) | |
| Zone R—men | 45 | 0.9 (0.7-1.2) | |
| women | Sadzn | 1.0 (0.6-1.5) | |
| Seveso residents—incidence Zones A, B—men |
7 | 0.9 (0.4-1.8) | |
| women | 3 | 0.8 (0.3-2.5) | |
| Seveso residents—10-yr follow-up Zones A, B, R—men |
40 | 0.8 (0.6-1.2) | |
| women | 22 | 1.0 (0.6-1.5) | |
| Seveso residents—10-yr follow-up Zone B—men |
7 | 1.2 (0.6-2.6) | |
| Reference | Study Populationa | Exposed Casesb |
Exposure of Interest/ Estimated Risk (95% CI)b |
| Chapaevsk, Russia Cohort | |||
| Residents of Chapaevsk, Russia Men |
59 |
1.7 (1.3-2.2) |
|
| Women | 45 | 0.7 (0.5-0.9) | |
| Other Environmental Studies | Serum dioxin | ||
| Finnish fishermen and spouses Fishermen |
16 |
0.8 (0.5-1.3) |
|
| Spouses | 2 | 0.3 (0.0-1.1) | |
| Residents of Japanese municipalities with and without waste-incineration plants |
Dioxin emissions/ Age-adjusted mortality (per 100,000)(p = 0.92) |
||
| Men | |||
| With | 38.2±7.8 vs | ||
| Without | 39.0 ± 8.8 (p = 0.29) | ||
| Women | |||
| With | 20.7 ± 5.0 vs | ||
| Wiihout | 20.7 ± 5.8 (p = 0.92) | ||
| Swedish fishermen—mortality (men and women) |
Organochlorine compounds | ||
| East coast | 17 | 1.4 (0.8-2.2) | |
| West coast | 63 | 0.9 (0.7-1.2) | |
| Swedish fishermen—incidence (men and women) | |||
| East coast | 24 | 1.6 (1.0-2.4) | |
| West coast | 71 | 0.9 (0.7-1.2) | |
ABBREVIATIONS: 2,4-D, 2,4-dichlorophenoxyacetic acid; 2,4,5-T, 2,4,5-trichlorophenoxyacetic acid; AFHS, Air Force Health Study; AHS, Agricultural Health Study; CDC, Centers for Disease Control and Prevention; CI, confidence interval; COI, chemical of interest; IARC, International Agency for Research on Cancer; MCPA, 2-methyl-4-chlorophenoxyacetic acid; MI, Michigan; NIOSH, National Institute for Occupational Safety and Health; nr, not reported; NZ, New Zealand; PCDD, polychlorinated dibenzo-p-dioxin (highly chlorinated, if four or more chlorines); SEA, Southeast Asia; TCDD, 2,3,7,8-tetrachlorodibenzo-p-dioxin; UFW, United Farm Workers of America; USDA, US Department of Agriculture; VA, US Department of Veterans Affairs; VES, Vietnam Experience Study; WV, West Virginia.
aSubjects are male, and outcome is mortality unless otherwise noted.
bGiven when available; results other than estimated risk explained individually.
cancer were observed (SMR = 1.4, 95% CI 0.6–2.7). The later Collins et al. report (2009b) described the mortality experience of 773 workers who were exposed to chlorinated dioxins in the production of PCP. SMRs were calculated to compare the PCP workers with the general US population and with that of Michigan. There were four observed deaths from stomach cancer (SMR = 1.2, 95% CI 0.3–3.1).
McBride et al. (2009a,b) published two reports on a mortality follow-up of the workers in the Dow AgroSciences plant in New Plymouth, New Zealand, who were potentially exposed to TCDD. The first report (2009a) compared the SMR for stomach cancer in ever-exposed workers with that in never-exposed workers. The SMR for stomach-cancer deaths was 1.4 (95% CI 0.4–3.6) in exposed workers and 2.3 (95% CI 0.3–8.4) in the never-exposed group. The results in the second report (2009b) have not been included here, because they were diluted by inclusion of a set of workers who had no opportunity for TCDD exposure and no observed deaths.
Boers et al. (2010) published the third follow-up results of a retrospective cohort study of two Dutch chlorophenoxy herbicide manufacturing factories that produced mainly 2,4,5-T (factory A) and 2-methyl-4-chlorophenoxyacetic acid (MCPA), 2-methyl-4-chlorophenoxy propanoic acid (MCPP), and 2,4-D (factory B). The cohort consisted of all persons who worked in the factories during 1955–1985 (factory A) or 1965–1986 (factory B). No increases in stomach-cancer deaths were observed. The SMR was 2.23 (95% CI 0.38–13.2) in factory A and 1.21 (95% CI 0.31–4.65) in factory B.
Environmental Studies Stomach-cancer cases were reported in the cancer-incidence study of the population (males and females combined) exposed to dioxin after the Seveso accident in 1976 (Pesatori et al., 2009). Three stomach cancers were observed in Zone A (high exposure) (RR = 0.86, 95% CI 0.28–2.69); 19 in residents of Zone B (medium exposure) (RR = 0.87, 95% CI 0.55–1.37), and 131 in Zone R (the low exposure) (RR = 0.84, 95% CI 0.70–1.01).
A second environmental study was published by Turunen et al. (2008), who assessed the mortality experience of fishermen (registered since 1980) and fishermen’s wives in Finland, presuming that their mortality would reflect their high consumption of contaminated fish. SMRs for the 6,410 fishermen and 4,260 wives were calculated on the basis of national mortality figures. The investigators had previously compared fish consumption and serum dioxin in fishermen and wives with those in control populations and found that consumption of fish and serum dioxin concentrations were higher in the fishermen and their wives. The fishermen and their wives were also more likely to be obese. Mortality rates from stomach cancer were found to be elevated in the study cohort (SMR = 0.82, 95% CI 0.47–1.33 in fishermen and SMR = 0.30, 95% CI 0.04–1.08 in their wives).
Biologic Plausibility
Long-term animal studies have examined the effect of exposure to the chemicals of interest (2,4-D and TCDD) on tumor incidence (Charles et al., 1996; Stott et al., 1990; Walker et al., 2006; Wanibuchi et al., 2004). No increase in the incidence of gastrointestinal cancer has been reported in laboratory animals. However, studies performed in laboratory animals have observed dose-dependent
increases in the incidence of squamous-cell hyperplasia of the forestomach or fundus of the stomach after administration of TCDD (Hebert et al., 1990; Walker et al., 2006). Similarly, in a long-term TCDD-treatment study in monkeys, hypertrophy, hyperplasia, and metaplasia were observed in the gastric epithelium (Allen et al., 1977). A transgenic mouse bearing a constitutively active form of the AHR has been shown to develop stomach tumors (Andersson et al., 2002a); the tumors are neither dysplastic nor metaplastic but are indicative of both squamous-cell and intestinal-cell metaplasia (Andersson et al., 2005). The validity of the transgenic-animal model is indicated by the similarities in the pheno-type of the transgenic animal (increased relative weight of the liver and heart, decreased weight of the thymus, and increased expression of the AHR target gene CYP1A1) and animals treated with TCDD (Brunnberg et al., 2006).
In a biomarker study of cancer patients, AHR expression and nuclear translocation were significantly higher in gastric-cancer tissue than in precancerous tissue (Peng et al., 2009a). The results suggest that the AHR plays an important role in gastric carcinogenesis. AHR activation in a gastric-cancer cell line (AGS) has also been shown to enhance gastric-cancer cell invasiveness potentially through a c-Jun-dependent induction of matrix metalloproteinase-9 (Peng et al., 2009b).
The biologic plausibility of the carcinogenicity of the chemicals of interest is discussed in general at the beginning of this chapter.
Synthesis
The committee responsible for Update 2008 noted several studies reporting evidence of association of stomach cancer with herbicides and with phenoxy herbicides in particular: two well-done occupational studies (Ekström et al., 1999; Mills and Yang, 2007) and a case–control study (Cocco et al., 1999) that indicated a relationship with herbicide exposure but was not specific as to type of herbicide. There was no suggestion of an association between TCDD and mortality from stomach cancer in the 25-year update of the Seveso population (Consonni et al., 2008). That committee noted that there had been no suggestion of an association between the chemicals of interest and stomach cancer in the studies of Vietnam-veteran cohorts, the IARC cohort studies, or the AHS. The several additional studies reviewed for the current update provided no new evidence of an association between the chemicals of interest and stomach cancer.
There is some evidence of biologic plausibility in animal models, but overall the epidemiologic studies do not support an association between exposure to the chemicals of interest and stomach cancer.
Conclusion
On the basis of the evidence reviewed here and in previous VAO reports, the committee concludes that there is inadequate or insufficient evidence to
determine whether there is an association between exposure to the chemicals of interest and stomach cancer.
Colorectal cancers include malignancies of the colon (ICD-9 153) and of the rectum and anus (ICD-9 154); less prevalent tumors of the small intestine (ICD-9 152) are often included. Findings on cancers of the retroperitoneum and other unspecified digestive organs (ICD-9 159) are considered in this category. Colorectal cancers account for about 55% of digestive tumors; ACS estimated that 154,790 people would receive diagnoses of colorectal cancer in the United States in 2010 and that 53,190 would die from it (Jemal et al., 2010). Excluding basal-cell and squamous-cell skin cancers, colorectal cancer is the third-most common form of cancer both in men and in women. The average annual incidence of colorectal cancers is shown in Table 7-4.
The incidence of colorectal cancer increases with age; it is higher in men than in women and higher in blacks than in whites. Because it is recommended that all persons over 50 years old receive colon-cancer screening, screening can affect the incidence. Other risk factors include family history of this form of cancer, some diseases of the intestines, and diet. Type 2 diabetes is associated with an increased risk of cancer of the colon (ACS, 2007a).
Conclusions from VAO and Previous Updates
Update 2006 considered colorectal cancer independently for the first time. Prior updates developed tables of results on colon and rectal cancer, but conclusions about the adequacy of the evidence of their association with herbicide exposure had been reached only in the context of gastrointestinal tract cancers. The committee responsible for VAO concluded that there was limited or suggestive evidence of no association between exposure to the herbicides used by the US military in Vietnam and gastrointestinal tract tumors, including colorectal cancer. The committee responsible for Update 2006 concluded that there was not enough evidence on each of the chemicals of interest to sustain that negative conclusion for any of the cancers in the gastrointestinal group and that, because these various types of cancer are generally regarded as separate disease entities, the evidence on each should be evaluated separately. Colorectal cancer was thus reclassified into the default category of inadequate or insufficient evidence to determine whether there is an association. The information considered in Update 2008 did not provide evidence to support moving colorectal cancers out of the category of inadequate or insufficient evidence.
Table 7-7 summarizes the results of the relevant studies concerning colon and rectal cancers.
TABLE 7-7 Selected Epidemiologic Studies—Colon and Rectal Cancer
| Reference | Study Populationa | Exposed Casesb |
Exposure of Interest/ (95% CI)b |
| VIETNAM VETERANS | |||
| US Air Force Health Study | All COIs | ||
| AFHS, 2000 | Ranch Hand veterans from AFHS—mortality | ||
| Colon, rectum combined | 7 | 1.5(0.4-5.5) | |
| US CDC Vietnam Experience Study | All COIs | ||
| Boehmer | Follow-up of CDC Vietnam Experience | ||
| et aL, 2004 | Cohort—mortality (1965-2000) | ||
| Colon, rectum, and anus | 9 | 1.0(0.4-2.6) | |
| US VA Mortality Study of Army and Marine Veterans—Ground troops serving July 4,1965-March 1,1973 | All COIs | ||
| Breslin | Army and Marine Vietnam veterans—mortality | ||
| etal.. 1988 | Army Vietnam veterans | ||
| Colon, other gastrointestinal (ICD-8 | 209 | 1.0(0.7-1.3) | |
| 152-154, 158, 159) | |||
| Marine Vietnam veterans | |||
| Colon, other gastrointestinal (ICD-8 | 33 | 1.3(0.7-2.2) | |
| 152-154, 158, 159) | |||
| US VA Cohort of Female Vietnam Veterans | All COIs | ||
| Cypel and | US female Vietnam Veterans—mortality | ||
| Rang, 2008 | through 2004 | ||
| US Vietnam veterans | 11 | 0.5(0.2-1.0) | |
| Vietnam-veteran nurses | 9 | 0.6(0.2-1.4) | |
| Dalager | US female Vietnam Veterans—mortality | ||
| etal., 1995 | through 1991 US Vietnam veterans | ||
| Colon | 4 | 0.4(0.1-1.2) | |
| Vietnam-veteran nurses | |||
| Colon | 4 | 0.5(0.2-1.7) | |
| State Studies of US Vietnam Veterans | All COIs | ||
| Anderson etal.. 1986 | Wisconsin Vietnam veterans—mortality | ||
| Colon | 6 | 1.0(0.4-2.2) | |
| Rectum | 1 | nr | |
| Australian Vietnam Veterans vs Australian Population | All COIs | ||
| ADVA,2005a | Australian male Vietnam veterans vs Australian population | ||
| Colon—incidence | 376 | 1.1(1.0-1.2) | |
| Navy | 91 | 1.3(1.0-1.5) | |
| Army | 239 | 1.1(0.9-1.2) | |
| Air Force | 47 | 1.1(0.8-1.5) | |
| Rectum—incidence | |||
| Navy | 54 | 1.1(0.8-1.4) | |
| Army | 152 | 1.0(0.8-1.1) | |
| Air Force | 28 | 1.0(0.6-1.4) | |
| Reference | Study Populationa | Exposed Casesb |
Exposure of Interest/ (95% CI)b |
| Australian male Vietnam veterans vs Australian population |
|||
| Colon—mortality | 176 | 1.0 (0.8-1.1) | |
| Navy | 49 | 1.3 (0.9-1.6) | |
| Army | 107 | 0.9 (0.7-1.0) | |
| Air Force | 21 | 0.9 (0.5-1.3) | |
| Rectum—mortality | |||
| Navy | 13 | 0.8 (0.4-1.4) | |
| Army | 44 | 0.9 (0.6-1.1) | |
| Air Force | 12 | 1.3 (0.6-2.2) | |
| Australian Vietnam veterans (men)—incidence | Expected number of exposed cases (95% CI) | ||
| Colorectal cancer | 188 | 221 (191-251) | |
| Australian Vietnam veterans (men)—incidence | |||
| Self-reported colon cancer | 405 | 117 (96-138) | |
| Australian Vietnam veterans (women)— | |||
| incidence | |||
| Self-reported colon cancer | 1 | 1 (0-5) | |
| Australian military Vietnam veterans—mortality | |||
| Colon | 78 | 1.2 (0.9-1.5) | |
| Rectum | 16 | 0.6 (0.4-1.0) | |
| Australian Conscripted Army National Service (deployed vs nondeployed) | All COIs | ||
| Australian male conscripted Army National | |||
| Service Vietnam-era veterans: deployed vs nondeployed Colon | |||
| Incidence | 54 | 0.9 (0.7-1.4) | |
| Mortality | 29 | 0.8 (0.5-1.3) | |
| Rectum | |||
| Incidence | 46 | 1.4 (0.9-2.2) | |
| Mortality | 10 | 1.8 (0.6-5.6) | |
| Australian National Service Vietnam | |||
| veterans—mortality | |||
| Colon | 6 | 0.6 (0.2-1.5) | |
| Rectum | 3 | 0.7 (0.2-9.5) | |
| Reference | Study Populationa | Exposed Casesb |
Exposure of Interest/ (95% CI)b |
| OCCUPATIONAL IARC Phenoxy Herbicide Cohort (mortality vs national mortality rates) |
Dioxin, Phenoxy Herbicides |
||
| IARC cohort, male and female workers exposed to any phenoxy herbicide or chlorophenol |
|||
| Colon | 86 | 1.1 (0.9-1.3) | |
| Rectum | 44 | 1.1 (0.8-1.4) | |
| Exposed to highly chlorinated PCDDs | |||
| Colon | 52 | 1.0 (0.8-1.3) | |
| Rectum | 29 | 1.3 (0.9-1.9) | |
| IARC cohort—exposed subcohort (men and women)—mortality | |||
| Colon (except rectum) | 41 | 1.1 (0.8-1.5) | |
| Rectum | 24 | 1.1 (0.7-1.6) | |
| NIOSH Mortality Cohort (12 US plants, production 1942-1984) (included in IARC cohort) | Dioxin, Phenoxy Herbicides | ||
| Steenlan et al., 1999 | US chemical production workers | ||
| Small intestine and colon | 34 | 1.2 (0.8-1.6) | |
| Rectum | 6 | 0.9 (0.3-1.9) | |
| NK iSH cohort—mortality | |||
| Entire NIOSH cohort | |||
| Small intestine, colon | 25 | 1.2 (0.8-1.8) | |
| Rectum | 5 | 0.9 (0.3-2.1) | |
| ≥ l-yr exposure, ≥ 20-yr latency | |||
| Small intestine, colon | 13 | 1.8 (1.0-3.0) | |
| Rectum | 2 | 1.2 (0.1-4.2) | |
| Monsanto Plant in Nitro, WV (included in IARC and KIOSH cohorts) | Dioxin, phenoxy herbicides | ||
| Collins | Monsanto Company workers—mortality | ||
| Colon | 3 | 0.5 (0.1-1.3) | |
| Dow Chemical Company—Midland, MI (included in IARC and NIOSH cohorts) | Dioxin, Phenoxy Herbicides |
||
| Trichlorophenol workers | |||
| Large intestine | 18 | 1.2 (0.7-1.8) | |
| Rectum | 2 | 0.6 (0.1-2.1) | |
| Pentachlorophenol workers | |||
| Large intestine | 10 | 1.2 (0.6-2.3) | |
| Rectum | 1 | 0.5 (0.0-2.9) | |
| Dow pentachlorophenol production workers—mortality | |||
| 0-yr latency | |||
| Colon | 4 | 0.8 (0.2-2.1) | |
| Rectum 15-yr latency |
0 | nr | |
| Colon | 4 | 1.0 (0.3-2.6) | |
| Rectum | 0 | nr | |
| Reference | Study Populationa | Exposed Casesb |
Exposure of Interest/ (95% CI)b |
| Dow 2,4-D production workers—mortality Colon |
4 | 2.1 (0.6-5.4) | |
| Rectum | 1 | 1.7 (0.0-9.3) | |
| BASF Production Workers (included in IARC cohort) | Dioxin, Phenoxy Herbicides |
||
| Oil and Zober. 1996 | BASF employees—colorectal—incidence | 5 | 1.0 (0.3-2.3) |
| TCDD < 0.1 μg/kg of body weight | 2 | 1.1 (0.1-3.9) | |
| TCDD 0.1-0.99 μg/kg of body weight | 2 | 1.4 (0.2-5.1) | |
| TCDD ≥ 1 μg/kg of body weight | 1 | 0.5 (0.0-3.0) | |
| BASF employees—basic cohort—mortality | |||
| Colon, rectum | 2 | 2.5 (0.4-7.8) | |
| Thiess et al., 1982 | BASF production workers—mortality Colon |
1 | 0.4 (nr) |
| Danish Production Workers (included in IARC cohort) | Dioxin, Phenoxy Herbicides |
||
| Lynge, 1985 | Danish production workers—incidence | ||
| Men | |||
| Colon | 10 | 1.0 (nr) | |
| Rectum | 14 | 1.4 (nr) | |
| Women | |||
| Colon | 1 | 0.3 (nr) | |
| Rectum | 2 | 1.0 (nr) | |
| Dutch Production Workers (included in IARC cohort) | Dioxin, Phenoxy Herbicides |
||
| Dutch chemical production workers | |||
| Intestine (except rectum) | 3 | 1.4 (0.3-4.0) | |
| Rectum | 1 | 1.0 (0.0-5.6) | |
| Bueno de Mcsquita et al., 1993 | Dutch phenoxy herbicide workers—mortality Colon |
3 | 1.8 (0.4-5.4) |
| Rectum | 0 | nr | |
| German Production Workers (included in IARC cohort) | Dioxin, Phenoxy Herbicides |
||
| German production workers—mortality | |||
| Plant I | |||
| Colon | 2 | 0.4 (0.1-1.4) | |
| Rectum | 6 | 1.9 (0.7-4.0) | |
| Plant II | |||
| Colon | 0 | nr | |
| Rectum | 0 | nr | |
| Plant III | |||
| Colon | 1 | 2.2 (0.1-2.2) | |
| Rectum | 0 | nr | |
| Plant IV | |||
| Colon | 0 | nr | |
| Rectum | 1 | 0.9 (0.0-4.9) | |
| Reference | Study Populationa | Exposed Casesb |
Exposure of Interest/ (95% CI)b |
| German production workers—mortality Colon | 8 | 0.9 (0.4-1.8) | |
| New Zealand Production Workers—Dow plant in Plymouth, NZ (included in IARC cohort) | Dioxin, Phenoxy Herbicides |
||
| 1,599 production workers (male and female) vs national rates—mortality 1969 through 2004 Large intestine |
|||
| Ever | 3 | 0.6 (0.1-1.7) | |
| Never | 0 | 0.0 (0.0-2.0) | |
| Rectum | |||
| Ever | 6 | 2.0 (0.7-4.4) | |
| Never | 2 | 2.1 (0.3-7.7) | |
| New Zealand phenoxy herbicide producers, | |||
| sprayers—mortality Phenoxy herbicide producers (men and women) |
|||
| Colon | 2 | 0.6 (0.0-2.3) | |
| Rectum, rectosigmoid junction, anus | 5 | 2.5 (0.8-5.7) | |
| Phenoxy herbicide sprayers ( > 99% men) | |||
| Colon | 8 | 1.9 (0.8-3.8) | |
| Rectum, rectosigmoid junction, anus | 4 | 1.5 (0.4-3.8) | |
| United Kingdom Production Workers (included in IARC cohort) | Dioxin, Phenoxy Herbicides |
||
| British MCPA production workers—mortality | |||
| Colon | 19 | 1.0 (0.6-1.6) | |
| Rectum | 8 | 0.6 (0.3-1.2) | |
| Agricultural Health Study | Herbicides | ||
| Lee WJ et al., 2007 | Pesticide applicators (men and women) in AHS—colorectal-cancer incidence (enrollment–2002) and any use before enrollment of: | ||
| 2,4-D | 204 | 0.7 (0.5-0.9) | |
| 2,4,5-T | 65 | 0.9 (0.7-1.2) | |
| 2,4,5-TP | 24 | 0.8 (0.5-1.2) | |
| Dicamba | 110 | 0.9 (0.7-1.2) | |
| Reference | Study Populationa | Exposed Casesb |
Exposure of Interest/ (95% CI)b |
| Pesticide applicators in AHS—colon-cancer incidence (lenrolImenl-2002) Dicamba—days of use |
|||
| None | 76 | 1.0 | |
| l- < 20 | 9 | 0.4 (0.2-0.9) | |
| 20-< 56 | 20 | 0.9 (0.5-1.5) | |
| 56- < 116 | 13 | 0.8 (0.4-1.5) | |
| ≥ 116 | 17 | 1.4 (0.8-2.9) p-trend = 0.10 |
|
| Dicamba—intensity-weighted quartiles | |||
| None | 76 | 1.0 | |
| Lowest | 16 | 0.6 (0.4-1.1) | |
| Second | 17 | 0.7 (0.4-1.2) | |
| Third | 6 | 0.5 (0.2-1.2) | |
| Highest | 20 | 1.8 (1.0-3.1) p-trend = 0.02 |
|
| Alavanja el al., 2005 | US AHS—incidence | ||
| Colon | |||
| Private applicators (men and women) | 208 | 0.9 (0.8-1.0) | |
| Spouses of private applicators ( > 99% women) | 87 | 0.9 (0.7-1.1) | |
| Commercial applicators (men and women) | 12 | 1.2 (0.6-2.1) | |
| Rectum | |||
| Private applicators (men and women) | 94 | 0.8 (0.7-1.0) | |
| Spouses of private applicators ( > 99% women) | 23 | 0.6 (0.4-0.9) | |
| Commercial applicators (men and women) | 7 | 1.3 (0.5-2.6) | |
| US AHS—mortality | |||
| Colon | |||
| Private applicators (men and women) | 56 | 0.7 (0.6-1.0) | |
| Spouses of private applicators ( > 99% women) | 31 | 1.2 (0.8-1.6) | |
| Rectum | |||
| Private applicators (men and women) | nr | nr | |
| Spouses of private applicators ( > 99% women) | nr | nr | |
| Reference | Study Populationa | Exposed Casesb |
Exposure of Interest/ (95% CI)b |
| Other Agricultural Workers | Herbicides | ||
| Italian rice growers—mortality | |||
| Intestines | 27 | 1.1 (0.7-1.6) | |
| US farmers in 23 slates—mortality | |||
| White men | |||
| Colon | 2,291 | 1.0 (0.9-1.0) | |
| Rectum | 367 | 1.0 (0.9-1.1) | |
| White women | |||
| Colon | 59 | 1.0 (0.8-1.3) | |
| Rectum | 4 | 0.5 (0.1-1.3) | |
| Danish workers—incidence | |||
| Men—self-employed | |||
| Colon | 277 | 0.7 (p < 0.05) | |
| Rectum | 309 | 0.8 (p< 0.05) | |
| Men—employees | |||
| Colon | 45 | 0.6 p< 0.05) | |
| Rectum | 55 | 0.8 (nr) | |
| Women—self-employ ed | |||
| Colon | 14 | 0.9 (nr) | |
| Rectum | 5 | 0.6 (nr) | |
| Women—employees | |||
| Colon | 112 | 0.9 (nr) | |
| Rectum | 55 | 0.8 (nr) | |
| Women—family worker | |||
| Colon | 2 | 0.2 p< 0.05) | |
| Rectum | 2 | 0.4 (nr) | |
| USDA agricultural extension agents—mortality | |||
| Colon | 41 | 1.0 (0.7-1.5) | |
| Rectum | 5 | nr | |
| Swedish male and female agricultural workers— | |||
| Colon | 1.332 | 99% CI |
|
| Rectum | 1,083 | 0.8 (0.7-0.8) | |
| Iowa farmers—mortality | |||
| Colon | 1,064 | 0.9 (0.9-1.0) | |
| Other Studies of Herbicide and Pesticide Applicators | Herbicides | ||
| Dutch licensed herbicide applicators—mortality | |||
| Colon | 7 | 1.0 (0.4-2.1) | |
| Rectum | 5 | 2.1 (0.7-4.8) | |
| Italian licensed pesticide users—mortality | |||
| Colon | 84 | 0.6 (0.5-0.7) | |
| Rectum | nr | nr | |
| Dutch licensed herbicide applicators—mortality | |||
| Colon | 4 | 2.6 (0.7-6.5) | |
| Reference | Study Populationa | Exposed Casesb |
Exposure of Interest/ (95% CI)b |
| Florida pesticide applicators—mortality | |||
| Colon | 5 | 0.8 (nr) | |
| Rectum | 2 | nr | |
| Forestry Workers | Herbicides | ||
| USDA forest or soil conservationists—mortality | |||
| Colon | 44 | 1.5 (1.1-2.0) | |
| Rectum | 9 | 1.0 (0.5-1.9) | |
| New Zealand forestry workers—nested case-control (incidence) | |||
| Colon | 7 | 0.5 (0.2-1.1) | |
| Small intestine | 2 | 5.2 (1.4-18.9) | |
| Rectum | 10 | 1.2 (0.6-2.3) | |
| Paper and Pulp Workers | Dioxins | ||
| IARC cohort of pulp and paper workers— | |||
| mortality Ever exposed to nonvolatile organochlorine compounds |
|||
| Colon | 62 | 0.7 (0.6-1.0) | |
| Rectum | 11 | 0.9 (0.7-1.1) | |
| Danish paper-mill workers—incidence | |||
| Men | |||
| Colon | 58 | 1.0 (0.7-1.2) | |
| Rectum | 43 | 0.9 (0.6-1.2) | |
| Women | |||
| Colon | 23 | 1.1 (0.7-1.7) | |
| Rectum | 15 | 1.5 (0.8-2.4) | |
| New Hampshire pulp and paper workers—mortality | |||
| Colon | 9 | 1.0 (0.5-2.0) | |
| Rectum | 1 | 0.4 (0.0-2.1) | |
| US pulp and paper workers—mortality | |||
| Colon | 7 | 1.5 (0.6-3.0) | |
| Northwestern US pulp and paper workers | |||
| Intestines (ICD-7 152. 153) | 7 | 0.4 (0.2-0.7) | |
| Other Occupational Studies | Herbicides | ||
| Egyptian case—control study | |||
| Colorectal cancer | nr | 5.5 (2.4-12.3) | |
| US flavor and fragrance chemical plant workers | Dioxin, 2,4,5-T | ||
| exposed to 2,4,5-T, TCDD | |||
| Colon | 4 | 0.6 (nr) | |
| Rectum | 6 | 2.5 (nr) | |
| Reference | Study Populationa | Exposed Casesb |
Exposure of Interest/ (95% CI)b |
| Swedish residents—incidence | Phenoxy acid and chlorophenils | ||
| Colon | |||
| Exposed to phenoxy acids | 11 | 1.3 (0.6-2.8) | |
| Exposed to chlorophenols | 6 | 1.8 (0.6-5.3) | |
| ENVIRONMENTAL Seveso, Italy Residential Cohort |
TCDD |
||
| Seveso residents—25-yr follow-up—men, | |||
| women | |||
| Zone A | |||
| Colon | 3 | 1.0 (0.3-3.0) | |
| Rectum | 1 | 0.9 (0.1-6.4) | |
| Zone B | |||
| Colon | 12 | 0.6 (0.3-1.1) | |
| Rectum | 11 | 1.5 (0.8-2.8) | |
| Zone R | |||
| Colon | 137 | 0.9 (0.7-1.3) | |
| Rectum | 50 | 0.9 (0.7-1.3) | |
| Seveso—20-yr follow-up to 1996—incidence (men and women, combined) |
|||
| Zone A | |||
| Colon | 2 | 0.7 (0.2-2.7) | |
| Rectum | 0 | ||
| Zone B | |||
| Colon | 19 | 1.0 (0.7-1.6) | |
| Rectum | 17 | 1.8 (1.1-2.9) | |
| Zone R | |||
| Colon | 137 | 1.0 (0.9-1.3) | |
| Rectum | 71 | 1.1 (0.8-1.4) | |
| Seveso residents—20-yr follow-up—mortality | |||
| Zones A, B—men | |||
| Colon | 10 | 1.0 (0.5-1.9) | |
| Rectum | 9 | 2.4 (1.2-4.6) | |
| Zones A, B—men | |||
| Colon | 5 | 0.6 (0.2-1.4) | |
| Rectum | 3 | 1.1 (0.4-3.5) | |
| Reference | Study Populationa | Exposed Casesb |
Exposure of Interest/ (95% CI)b |
| Seveso residents—15-yr follow-up—mortality | |||
| Zone A—women Colon |
2 |
2.6 (0.3-9.4) | |
| Zone B—men Colon |
5 |
0.8 (0.3-2.0) | |
| Rectum | 7 | 2.9 (1.2-5.9) | |
| Zone B—women Colon |
3 |
0.6 (0.1-1.8) | |
| Rectum | 2 | 1.3 (0.1-4.5) | |
| Zone R—men Colon |
34 |
0.8 (0.6-1.1) | |
| Rectum | 19 | 1.1 (0.7-1.8) | |
| Zone R—women Colon |
33 |
0.8 (0.6-1.1) | |
| Rectum | 12 | 0.9 (0.5-1.6) | |
| Seveso residents—10-yr follow-up—morbidily | |||
| Zone B—men | |||
| Colon | 2 | 0.5 (0.1-2.0) | |
| Rectum | 3 | 1.4 (.04-4.4) | |
| Zone B—women | |||
| Colon | 2 | 0.6 (0.1-2.3) | |
| Rectum | 2 | 1.3 (0.3-5.4) | |
| Zone R—men | |||
| Colon | 32 | 1.1 (0.8-1.6) | |
| Rectum | 17 | 1.1 (0.7-1.9) | |
| Zone R—women | |||
| Colon | 23 | 0.8 (0.5-1.3) | |
| Rectum | 7 | 0.6 (.03-1.3) | |
| Seveso residents—incidence | |||
| Zones A, B—men | |||
| Colon | 3 | 0.6 (0.2-1.9) | |
| Rectum | 3 | 1.2 (0.4-3.8) | |
| Zones A, B—women | |||
| Colon | 3 | 0.7 (0.2-2.2) | |
| Rectum | 2 | 1.2 (0.3-4.7) | |
| Seveso residents—10-yr follow-up—mortality | |||
| Zones A, B, R—men | |||
| Colon | 20 | 1.0 (0.6-1.5) | |
| Rectum | 10 | 1.0 (0.5-2.7) | |
| Zones A, B, R—women | |||
| Colon | 12 | 0.7 (0.4-1.2) | |
| Rectum | 7 | 1.2 (0.5-2.7) | |
| Seveso residents—10-yr follow-up—mortality | |||
| Zone B—men | |||
| Rectum | 2 | 1.7 (0.4-7.0) | |
| Reference | Study Populationa | Exposed Casesb |
Exposure of Interest/ (95% CI)b |
| Chapaevsk, Russia Cohort | |||
| Residents of Chapaevsk, Russia—mortality | |||
| Men | |||
| Colon | 17 | 1.3 (0.8-2.2) | |
| Rectum | 21 | 1.5 (1.0-2.4) | |
| Women | |||
| Colon | 24 | 1.0 (0.7-1.5) | |
| Rectum | 24 | 0.9 (0.6-1.4) | |
| Other Environmental Studies | |||
| Finnish fishermen and spouses | Serum dioxin | ||
| Fishermen | SMRs | ||
| Colon | 8 | 0.5 (0.2-1.0) | |
| Rectum and anus | 8 | 0.8 (0.4-1.6) | |
| Spouses | |||
| Colon | 10 | 1.3 (0.6-2.4) | |
| Rectum and anus | 8 | 2.1 (0.9-4.2 | |
| Swedish fishermen—mortality (men and women) | Organochlorine | ||
| East coast | compounds | ||
| Colon | 1 | 0.1 (0.0-0.7) | |
| Rectum | 4 | 0.7 (0.2-1.9) | |
| West coast | |||
| Colon | 58 | 1.0 (0.8-1.3) | |
| Rectum | 31 | 1.0 (0.7-1.5) | |
| Swedish fishermen—incidence (men and women) | |||
| East coast | |||
| Colon | 5 | 0.4 (0.1-0.9) | |
| Rectum | 9 | 0.9 (0.4-1.6) | |
| West coast | |||
| Colon | 82 | 1.0 (0.8-1.2) | |
| Rectum | 59 | 1.1 (0.8-1.4) | |
| Finnish community exposed to chlorophenol |
Chlorophenols | ||
| Colon—men, women | 9 | 1.1 (0.7-1.8) | |
ABBREVIATIONS: 2,4-D, 2,4-dichlorophenoxyacetic acid; 2,4,5-T, 2,4,5-trichlorophenoxyacetic acid; 2,4,5-TP, 2-(2,4,5-trichlorophenoxy) propionic acid; AFHS, Air Force Health Study; AHS, Agricultural Health Study; CDC, Centers for Disease Control and Prevention; CI, confidence interval; COI, chemical of interest; IARC, International Agency for Research on Cancer; ICD, International Classification of Diseases; MCPA, methyl-4-chlorophenoxyacetic acid; MI, Michigan; NIOSH, National Institute for Occupational Safety and Health; nr, not reported; NZ, New Zealand; PCDD, polychlorinated dibenzo-p-dioxin (highly chlorinated, if four or more chlorines); TCDD, 2,3,7,8-tetrachlorodibenzo-p-dioxin; USDA, US Department of Agriculture; VA, US Department of Veterans Affairs; WV, West Virginia.
aSubjects are male, and outcome is mortality unless otherwise noted.
bGiven when available; results other than estimated risk explained individually.
Update of the Epidemiologic Literature
Vietnam-Veteran Studies No studies of exposure to the chemicals of interest and colorectal cancer in Vietnam veterans have been published since Update 2008.
Occupational Studies Two occupational-cohort studies have been updated since Update 2008. Collins et al. (2008, 2009a,b) published a series of papers examining the mortality experience of workers employed in a Dow Chemical Company in Midland, Michigan, from 1937 to 1980. Serum dioxin was evaluated to estimate exposures to five dioxins in a group of 98 workers (Collins et al., 2008). Although the serum dioxin, furan, and PCB concentrations were measured many years after exposure, distinct patterns of dioxin congeners were found in workers who had different chlorophenol exposures. Collins et al. (2009a) examined 1,615 workers who had been exposed to TCP production. The mean duration of follow-up was 36.4 years. Some 18 cases of cancer of the large intestine were observed, for an SMR of 1.2 (95% CI 0.7–1.8); two cases of rectal cancer were observed, for an SMR of 0.6 (95% CI 0.1–2.1). Collins et al. (2009b) also described the mortality experience of 773 workers who were exposed to chlorinated dioxins in the production of PCP. SMRs were calculated to compare the PCP workers with the general US population and with that of Michigan. There were 10 observed deaths from cancer of the large intestine (SMR = 1.2, 95% CI 0.6–2.3) and 1 death from cancer of the rectum (SMR = 0.5; 95% CI 0.0–2.9).
The second occupational-cohort follow-up study was that of workers in the Dow AgroSciences plant in New Plymouth, New Zealand, who were potentially exposed to TCDD (McBride et al., 2009a,b). Workers employed during the period from January 1969 to November 1988 (when 2,4,5-T was no longer produced at the work sites) were followed to the end of 2004, and SMRs were calculated by using national mortality figures. In McBride et al. (2009a), the SMR for large intestine–cancer deaths was 0.6 (95% CI 0.1–1.7) in workers exposed to TCDD and 0.0 (95% CI 0.0–2.0) in the never-exposed group. The SMR for rectal-cancer deaths was 2.0 (95% CI 0.7–4.4) in exposed workers and 2.1 (95% CI 0.3–7.7) in nonexposed workers. The SMRs for large intestine and rectal cancer according to estimated effective cumulative exposure to TCDD were not calculated; however, no trend was observed for all cancers of the digestive organs and peritoneum. The results in McBride et al. (2009b) have not been included, because they were diluted by inclusion of a set of workers who had no opportunity for TCDD exposure and no observed deaths.
Lo et al. (2010) published a case–control study of 421 Egyptian cases of colorectal carcinoma and 439 hospital-matched controls. Histories of lifestyle, occupational, and reproductive factors were obtained with questionnaires. A history of pesticide exposure was significantly associated with a higher risk of
colorectal carcinoma (odds ratio [OR] = 2.6, 95% CI 1.1–5.9). Among 73 subjects who reported farming as their longest lifetime occupation, self-reported exposure to herbicides was associated with increased risk of colorectal cancer (adjusted OR = 5.5, 95% CI 2.4–12.3). Information on specific types of herbicides was not obtained.
Environmental Studies Colon-cancer cases were reported in the cancer- incidence study of the population (males and females combined) exposed to dioxin after the Seveso accident in 1976 (Pesatori et al., 2009). Two colon cancers were observed in Zone A (high exposure) (RR = 0.68, 95% CI 0.17–2.72); 19 in Zone B (medium exposure) (RR = 1.04, 95% CI 0.66–1.64), and 137 in Zone R (low exposure) (RR = 1.04, 95% CI 0.87–1.26). Rectal-cancer cases were reported separately. No rectal-cancer cases were observed in Zone A, 17 in Zone B (RR = 1.78, 95% CI 1.09–2.88), and 71 in Zone R (RR = 1.05, 95% CI 0.82–1.35).
A second environmental study was published by Turumen et al. (2008), who assessed the mortality experience of fishermen (registered since 1980) and fishermen’s wives in Finland, presuming that their mortality reflected their high consumption of contaminated fish. SMRs for the 6,410 fishermen and 4,260 wives were calculated on the basis of national mortality figures. The investigators had previously compared fish consumption and serum dioxin level in fishermen and their wives with those in control populations and found that consumption of fish and serum dioxin were higher in the fishermen and their wives. The fishermen and their wives were also more likely to be obese. Mortality from colon cancer was not increased in the study cohort (SMR = 0.52, 95% CI 0.23–1.03 in fishermen; SMR = 1.30, 95% CI 0.62–2.39 in fishermen’s wives). Mortality from rectal and anal cancers also was not increased (SMR = 0.82, 95% CI 0.35–1.60 in fishermen; SMR = 2.13, 95% CI 0.92–4.19 in fishermen’s wives).
Biologic Plausibility
Long-term animal studies have examined the effect of exposure to the chemicals of interest on tumor incidences (Charles et al., 1996; Stott et al., 1990; Walker et al., 2006; Wanibuchi et al., 2004). No increase in the incidence of colorectal cancer in laboratory animals exposed to the chemicals of interest has been reported.
The biologic plausibility of the carcinogenicity of the chemicals of interest is discussed in general at the beginning of this chapter.
Synthesis
The epidemiologic studies reviewed yielded no evidence that suggested an association between the chemicals of interest and colorectal cancer. There is no evidence of biologic plausibility of an association between exposure to any of the
chemicals of interest and tumors of the colon or rectum. Overall, the available evidence does not support an association between the chemicals of interest and colorectal cancer.
Conclusion
On the basis of the evidence reviewed here and in previous VAO reports, the committee concludes that there is inadequate or insufficient evidence to determine whether there is an association between exposure to the chemicals of interest and colorectal cancer.
Hepatobiliary cancers include cancers of the liver (ICD-9 155.0, 155.2) and the intrahepatic bile duct (ICD-9 155.1). ACS estimated that 17,430 men and 6,690 women would receive diagnoses of liver cancer or intrahepatic bile duct cancer in the United States in 2010 and that 12,720 men and 6,190 women would die from these cancers (Jemal et al., 2010). Gallbladder cancer and extrahepatic bile duct cancer (ICD-9 156) are fairly uncommon and are often grouped with liver cancers when they are addressed.
In the United States, liver cancers account for about 1.5% of new cancer cases and 3.3% of cancer deaths. Misclassification of metastatic cancers as primary liver cancer can lead to overestimation of the number of deaths attributable to liver cancer (Percy et al., 1990). In developing countries, especially those in sub-Saharan Africa and Southeast Asia, liver cancers are common and are among the leading causes of death. Known risk factors for liver cancer include chronic infection with hepatitis B or hepatitis C virus and exposure to the carcinogens aflatoxin and vinyl chloride. Alcohol cirrhosis and obesity-associated metabolic syndrome may also contribute to the risk of liver cancer. In the general population, the incidence of liver and intrahepatic bile duct cancer increases slightly with age; at the ages of 50–64 years, it is greater in men than in women and greater in blacks than in whites. The average annual incidence of hepatobiliary cancers is shown in Table 7-4.
Conclusions from VAO and Previous Updates
The committee responsible for VAO concluded that there was inadequate or insufficient information to determine whether there is an association between exposure to the chemicals of interest and hepatobiliary cancers. Additional information available to the committees responsible for Update 1996, Update 1998, Update 2000, Update 2002, Update 2004, Update 2006, and Update 2008 did not change that conclusion.
Table 7-8 summarizes the results of the relevant studies.
TABLE 7-8 Selected Epidemiologic Studies—Hepatobiliary Cancer
| Reference | Study Populationa | Exposed Casesb |
Exposure of Interest/ Estimated Risk (95% CI)b |
| VIETNAM VETERANS | |||
| US Air Force Health Study—Ranch Hand veterans vs SEA veterans | All COIs | ||
| Air Force Ranch Hand veterans—incidence | 2 | 1.6 (0.2-11.4) | |
| US CDC Vietnam Experience Study | |||
| Follow-up of CDC Vietnam Kxpcrience Cohort (liver, intrahepatic bile ducts [ICD-9 155]) |
5 | nr | |
| US men born 1921-1953—incidence | 8 | 1.2 (0.5-2.7) | |
| US VA Mortality Study of Army and Marine Veterans | All COIs | ||
| Army Vietnam veterans (liver, bile duct) | 34 | 1.0 (0.8-1.4) | |
| Marine Vietnam veterans (liver, bile duct) | 6 | 1.2 (0.5-2.8) | |
| State Studies of US Vietnam Veterans | All COIs | ||
| Wisconsin Vietnam veterans | 0 | nr | |
| Australian Vietnam Veterans vs Australian Population | |||
| Australian male Vietnam veterans vs Australian | 27 | ||
| population—incidence | |||
| Navy | 8 | 1.0 (0.4-1.9) | |
| Army | 18 | 0.7 (0.4-1.1) | |
| Air Force | 1 | 0.2 (0.0-1.2) | |
| Australian male Vietnam veterans vs Australian | 48 | 0.9 (0.6-1.1) | |
| population-mortality (liver, gallbladder) | |||
| Navy | 11 | 1.0 (0.5-1.7) | |
| Army | 33 | 0.9 (0.6-1.2) | |
| Air Force | 4 | 0.6 (0.2-1.5) | |
| Australian military Vietnam veterans | |||
| Liver (ICD-9 155) | 8 | 0.6 (0.2-1.1) | |
| Gallbladder (ICD-9 156) | 5 | 1.3 (0.4-2.8) | |
| Australian Conscripted Army National Service (deployed vs nondeployed) | All COIs | ||
| Australian male conscripted Army National | |||
| Service Vietnam-era veterans: deployed vs | |||
| nondeployed | |||
| Incidence | 2 | 2.5 (0.1-147.2) | |
| Mortality (liver, gallbladder) | 4 | 2.5 (0.4-27.1) | |
| Australian National Service Vietnam veterans | 1 | nr | |
| OCCUPATIONAL | |||
| IARC Phenoxy Herbicide Cohort (mortality vs national mortality rates) | Dioxin, phenoxy herbicides | ||
| IARC cohort, male and female workers exposed | 15 | 0.7 (0.4-1.2) | |
| to any phenoxy herbicide or chlorophenol | |||
| Exposed to highly chlorinated PCDDs | 12 | 0.9 (0.5-1.5) | |
| Not exposed to highly chlorinated PCDDs | 3 | 0.4 (0.1-1.2) | |
| Reference | Study Populationa | Exposed Casesb |
Exposure of Interest/ Estimated Risk (95% CI)b |
| IARC cohort—exposed subcohort (men and women) | |||
| Liver, gallbladder, bilcduct (ICD-8 155-156) | 4 | 0.4 (0.1-1.1) | |
| NIOSH Mortality Cohort (12 U'S plants, production 1942-1984) (included inIARC cohort) | Dioxin, phenoxy herbicides | ||
| Slecnlond et al., 1999 | US chemical production workers | ||
| Liver, biliary tract (ICD-9 155-156) | 7 | 0.9 (0.4-1.6) | |
| NIOSH—entire cohort (liver, biliary tract)— | 6 | 1.2 (0.4-2.5) | |
| ≥1 -jt exposure, ≥ 20-yr latency | 1 | 0.6 (0.0-3.3) | |
| BASF Production Workers (included in I ARC cohort) | Dioxin, phenoxy herbicides | ||
| Oil and Zobcr. 19% | BASF employees—incidence Liver, gallbladder, and bile duct |
2 | 2.1 (0.3-7.5) |
| TCDD < 0.1 ug/kg of body weight | 1 | 2.8 (0.1-155) | |
| TCDD 0.1-0.99 ug/kg of body weight | 0 | 0.0 (0.0-15.4) | |
| TCDD ≥ 1 ug/kg of body weight | 1 | 2.8 (0.1-15.5) | |
| Dow Chemical Company—Midland. Ml (included in I ARC an NOSH cohorts) | Dioxin, phenoxy herbicides | ||
| Trichlocophcnol workers | 2 | 05 (0.1-1.6) | |
| Pcntachlorophcnol workers | 0 | 0.0 (0.0-1.7) | |
| Dow pcntachlorophcnol production workers Liver, primary (ICDA-8 155-156) |
|||
| 0-yr latency | 0 | nr | |
| 15-yr latency | 0 | nr | |
| Dow 2,4-D production workers | |||
| Liver, biliary tract (ICDA-8 155-156) | 0 | 1.2 (nr) | |
| Monsanto Plant in Nitro, WV (included in 1ARC and NIOSH cohorts) | Dioxin, phenoxy herbicides | ||
| Monsanto Company 2,4-D production workers Liver, biliary tract |
2 | 1.4 (0.2-5.2) | |
| Monsanto Company production workers | 0 | nr | |
| Danish Production Workers (included in IARC cohorti | Dioxin, phenoxy herbicides | ||
| Lyngc. 1985 | Danish production workers—incidence | ||
| Men | 3 | 1.0 (nr) | |
| Women | 0 | nr | |
| German Production Workers (included in IARC cohort) | Dioxin, phenoxy herbicides | ||
| Bechcrd et al., 1996 | German production workers Liver and biliary tract |
1 | 1.2 (0.0-6.9) |
| Reference | Study Populationa | Exposed Casesb |
Exposure of Interest/ Estimated Risk (95% CI)b |
| New Zealand Production Workers—Dow plant in Plymouth,(included in IARC cohort)NZ | Dioxin, phenoxy herbicides | ||
| Mc Bride et al., 2009a | 1,599 production workers (male and female) vs national rates—mortality 1969 through 2004 |
||
| Ever | 2 | 1.4 (0.2-5.1) | |
| Never | 0 | 0.0 (0.0-8.2) | |
| New Zealand phenoxy herbicide workers (ICD-9 155) | |||
| Producers (men and women) | 1 | 1.6 (0.0-8.8) | |
| Sprayers ( > 99% men) | 0 | 0.0 (0.0-4.2) | |
| Agricultural Health Study | Herbicides | ||
| US AHS—incidence | |||
| Liver | |||
| Private applicators (men and women) | 35 | 1.0 (0.7-1.4) | |
| Spouses of private applicators ( > 99% women) | 3 | 0.9 (0.2-2.5) | |
| Commercial applicators (men and women) | nr | 0.0 (0.0-4.2) | |
| Gallbladder | |||
| Private applicators (men and women) | 8 | 2.3 (1.0-4.5) | |
| Spouses of private applicators ( > 99% women) | 3 | 0.9 (0.2-2.5) | |
| Commercial applicators (men and women) | nr | 0.0 (0.0-35.8) | |
| US AHS | |||
| Liver | |||
| Private applicators (men and women) | 8 | 0.6 (0.2-1.1) | |
| Spouses of private applicators ( > 99% women) | 4 | 1.7 (0.4-4.3) | |
| Gallbladder | |||
| Private applicators (men and women) | 3 | 2.0 (0.4-5.7) | |
| Spouses of private applicators ( > 99% women) | 2 | l.3 (0.M.6) | |
| Other Agricultural Workers | Herbicides | ||
| Italian rice growers | 7 | 1.3 (0.5-2.6) | |
| US farmers in 23 states | |||
| White men | 326 | 1.0 (0.9-1.1) | |
| White women | 6 | 0.7 (0.3-1.6) | |
| Swedish male and female agricultural | 99% CI | ||
| workers—incidence | |||
| Liver (primary) | 103 | 0.3 (0.3-0.4) | |
| Biliary tract | 169 | 0.6 (0.5-0.7) | |
| Liver (unspecified) | 67 | 0.9 (0.7-1.3) | |
| Other Studies of Herbicide and Pesticide Applicators | Herbicides | ||
| Italian licensed pesticide users | |||
| Liver | 15 | 0.6 (0.3-0.9) | |
| Reference | Study Populationa | Exposed Casesb |
Exposure of Interest/ Estimated Risk (95% CI)b |
| Swaen et al.,, 2004 | Dutch licensed herbicide applicators | 0 | nr |
| Finnish herbicide applicators—liver, biliary tract | |||
| Incidence | 3 | 0.9 (0.2-2.6) | |
| Mortality | 2 | 0.6 (0.1-2.2) | |
| Danish farm workers—incidence | |||
| Liver | |||
| Men—self-employed | 23 | 0.4 (p< 0.05) | |
| employees | 9 | 0.8 (nr) | |
| Women—family workers | 5 | 0.5 (nr) | |
| Gallbladder | |||
| Men—self-employed | 35 | 0.8 (nr) | |
| employees | 7 | 0.8 (nr) | |
| Women—self-employed | 7 | 2.7 <p < 0.05) | |
| employees | 1 | 0.7 (nr) | |
| family workers | 17 | 1.0 (nr) | |
| Forestry Workers | Herbicides | ||
| New Zealand forestry workers—nested | |||
| case-control—incidence | |||
| Liver | 1 | 0.8 (0.1-5.8) | |
| Gallbladder | 3 | 4.1 (1.4-12.0) | |
| Paper and Pulp Workers | Dioxins | ||
| IARC cohort of pulp and paper workers | |||
| Exposure to nonvolatile organochlorine compounds | |||
| Never | 27 | 0.9 (0.6-1.3) | |
| Ever | 16 | 0.7 (0.4-1.1) | |
| Danish paper-mill workers—incidence | |||
| Liver—men | 10 | 1.1 (0.5-2.0) | |
| women | 1 | 0.6 (0.0-3.2) | |
| Gallbladder—men | 9 | 1.6 (0.7-3.0) | |
| women | 4 | 1.4 (0.4-3.7) | |
| US pulp and paper workers (ICD-8 155-156) | 2 | 2.0 (0.2-7.3) | |
| Other Occupational Studies | Phenoxy acids, chlorophenols | ||
| Swedish residents—incidence, mortality combined |
102 | 1.8 (0.9-4.0) | |
| Reference | Study Populationa | Exposed Casesb |
Exposure of Interest/ Estimated Risk (95% CI)b |
| ENVIRONMENTAL | |||
| Seveso, Italy Residential Cohort | TCDD | ||
| Seveso residents—25-yr follow-up—men. | |||
| women | |||
| Liver (ICD-9 155) | |||
| Zone A | 3 | 1.0 (0.3-3.2) | |
| Zone B | 16 | 0.9 (0.5-1.4) | |
| Zone R | 107 | 0.8 (0.7-1.0) | |
| Biliary tract (ICD-9 156) | |||
| Zone A | 0 | 0.0 (nr) | |
| Zone B | 2 | 0.6 (0.1-2.3) | |
| Zone R | 31 | 1.2 (0.8-1.7) | |
| Seveso—20-yr follow-up to 1996—incidence | |||
| (men and women, combined) | |||
| Zone A | |||
| Liver | 0 | ||
| Biliary tract | 0 | ||
| Zone B | |||
| Liver | 14 | 1.3 (0.8-2.2) | |
| Biliary tract | 6 | 2.3 (1.0-5.2) | |
| Zone R | |||
| Liver | 56 | 0.7 (0.6-1.0) | |
| Biliarv tract | 16 | 0.8 (0.5-1.4) | |
| Seveso residents—20-yr follow-up | |||
| Zone A, B—men (liver, gallbladder) | 6 | 0.5 (0.2-1.0) | |
| (liver) | 6 | 0.5 (0.2-1.1) | |
| women (liver, gallbladder) | 7 | 1.0 (0.5-2.2) | |
| (liver) | 6 | 1.3 (0.6-2.9) | |
| Seveso residents—15-yr follow-up | |||
| Zone B—men (liver, gallbladder) | 4 | 0.6 (0.2-1.4) | |
| (liver) | 4 | 0.6 (0.2-1.6) | |
| women (liver, gallbladder) | 4 | 1.1 (0.3-2.9) | |
| (liver) | 3 | 1.3 (0.3-3.8) | |
| Zone R—men (liver, gallbladder) | 35 | 0.7 (0.5-1.0) | |
| (liver) | 31 | 0.7 (0.5-1.0) | |
| women (liver, gallbladder) | 25 | 0.8 (0.5-1.3) | |
| (liver) | 12 | 0.6 (0.3-1.1) | |
| Seveso residents—10-yr follow-up—incidence | |||
| Zone B—men (liver) | 4 | 2.1 (0.8-5.8) | |
| (gallbladder—ICD-9 156) | 1 | 2.3 (0.3-17.6) | |
| women (gallbladder—ICD-9 156) | 4 | 4.9 (1.8-13.6) | |
| Zone R—men (liver) | 3 | 0.2 (0.1-0.7) | |
| (gallbladder—ICD-9 156) | 3 | 1.0 (0.3-3.4) | |
| women (liver) | 2 | 0.5 (0.1-2.1) | |
| (gallbladder—ICD-9 156) | 7 | 1.0 (0.5-2.3) | |
| Reference | Study Populationa | Exposed Casesb |
Exposure of Interest/ Estimated Risk (95% CI)b |
| Saeveso residents—incidence | |||
| Zone A, B—men (liver) | 4 | 1.5 (0.5-4.0) | |
| (gallbladder—ICD-9 156) | 1 | 2.1 (0.3-15.6) | |
| women (liver) | 1 | 1.2 (0.2-9.1) | |
| (gallbladder—ICD-9 156) | 5 | 5.2 (2.1-13.2) | |
| Zone R—men (liver) | 8 | 0.5 (0.2-0.9) | |
| (gallbladder—ICD-9 156) | 3 | 1.0 (0.3-3.4) | |
| women (liver) | 5 | 0.8 (0.3-2.1) | |
| (gallbladder—ICD-9 156) | 7 | 1.0 (0.5-2.3) | |
| Seveso residents—10-yr follow-up | |||
| Zone A—women (gallbladder—ICD-9 156) | 1 | 12.1 (1.6-88.7) | |
| Zone B—men (liver) | 3 | 1.2 (0.4-3.8) | |
| women (gallbladder—ICD-9 156) | 2 | 3.9 (0.9-16.2) | |
| Zone R—men (liver) | 7 | 0.4 (0.2-0.8) | |
| women (liver) | 3 | 0.4 (0.1-1.4) | |
| (gallbladder—ICD-9 156) | 5 | 1.2 (0.5-3.1) | |
| Quail Run Cohort | TCDD | ||
| Residents of Quail Run Mobile Home Park | 0 | nr | |
| (men and women) | |||
| Other Environmental Studies | |||
| Swedish fishermen (men and | Organochlorine compounds | ||
| women)—mortality | |||
| East coast | 1 | 0.5 (0.0-2.7) | |
| West coast (liver, bile ducts) | 9 | 0.9 (0.4-1.7) | |
| Swedish fishermen (men and women)—incidence | |||
| East coast | 6 | 1.3 (0.5-2.9) | |
| West coast (liver, bile ducts) | 24 | 1.0 (0.6-1.5) | |
| Risk factors for hepatocellular carcinoma in Hanoi. Vietnam |
Herbicides | ||
| Military service in South Vietnam for ≥ 10 years after 1960 | 11 | 8.8 (1.4-41.0) | |
ABBREVIATIONS: 2,4-D, 2,4-dichlorophenoxyacetic acid; AHS, Agricultural Health Study; CDC, Centers for Disease Control and Prevention; CI, confidence interval; COI, chemical of interest; IARC, International Agency for Research on Cancer; ICD, International Classification of Diseases; ICDA, International Classification of Diseases, Adapted for Use in the United States; MI, Michigan; NIOSH, National Institute for Occupational Safety and Health; nr, not reported; NZ, New Zealand; PCDD, polychlorinated dibenzo-p-dioxin (highly chlorinated, if four or more chlorines); SEA, Southeast Asia; TCDD, 2,3,7,8-tetrachlorodibenzo-p-dioxin; VA, US Department of Veterans Affairs; WV, West Virginia.
aSubjects are male, and outcome is mortality unless otherwise noted.
bGiven when available; results other than estimated risk explained individually.
Update of the Epidemiologic Literature
Vietnam-Veteran Studies No studies of exposure to the chemicals of interest and hepatobiliary cancer in Vietnam veterans have been published since Update 2008.
Occupational Studies Two occupational-cohort follow-up studies have been published since Update 2008. Collins et al. (2008, 2009a,b) published a series of papers examining the mortality experience of workers employed in a Dow Chemical Company in Midland, Michigan, from 1937 to 1980. Collins et al. (2009b) described the mortality experience of 773 workers who were exposed to chlorinated dioxins in the production of PCP; 75% of the cohort have been followed for more than 27 years. SMRs were calculated to compare the PCP workers with the general US population and the population of the state of Michigan. There were no observed deaths from cancer of the hepatobiliary tract. In a companion paper, the authors examined 1,615 workers who had been exposed to TCP production (Collins et al., 2009a). The mean duration of follow-up was 36.4 years. Two cases of cancer of the hepatobiliary tract were observed, for an SMR of 0.5 (95% CI 0.1–1.6).
The second occupational mortality study was of workers in the Dow Agro-Sciences plant in New Plymouth, New Zealand, who were potentially exposed to TCDD (McBride et al., 2009a,b). Workers employed during the period from January 1969 to November 1988 (when 2,4,5-T was no longer produced at the work sites) were followed to the end of 2004, and SMRs were calculated by using national mortality figures. McBride et al. (2009a) found that the SMR for hepatobiliary cancer deaths was 1.4 (95% CI 0.2–5.1) in exposed workers and 0.0 (95% CI 0.0–8.2) in the never-exposed group. The results of McBride et al. (2009b) have not been included, because they were diluted by inclusion of a set of workers who had no opportunity for TCDD exposure and no observed deaths.
Environmental Studies Hepatobiliary cancer was reported in the cancer-incidence study of the population (males and females combined) exposed to dioxin after the Seveso accident in 1976 (Pesatori et al., 2009). No liver-cancer cases were observed in Zone A (high exposure), 14 cases in Zone B (medium exposure) (RR = 1.29, 95% CI 0.76–2.20), and 56 in Zone R (low exposure) (RR = 0.74, 95% CI 0.56–0.97). Bilary-cancer cases were reported separately. No biliary cases were observed in Zone A, 6 in Zone B (RR = 2.28, 95% CI 1.00–5.17), and 16 in Zone R (RR = 0.82, 95% CI 0.49–1.39).
Biologic Plausibility
Long-term animal studies have examined the effect of exposure to the chemicals of interest on tumor incidences (Charles et al., 1996; Stott et al., 1990; Walker
et al., 2006; Wanibuchi et al., 2004). Studies performed in laboratory animals have consistently demonstrated that long-term exposure to TCDD results in the formation of liver adenomas and carcinomas (Knerr and Schrenk, 2006; Walker et al., 2006). Furthermore, TCDD increases the growth of hepatic tumors that are initiated by treatment with a complete carcinogen, and pathologic liver changes have been observed after exposure to TCDD, including nodular hyperplasia and massive inflammatory cell infiltration (Kociba et al., 1978; NTP, 2006; Walker et al., 2006; Yoshizawa et al., 2007). Inflammation and cancer are strongly intertwined in the development and progression of many cancers, including liver cancers (Mantovani et al., 2008). Similarly, in monkeys treated with TCDD, hyperplasia and an increase in cells that stain positive for alpha-smooth muscle actin have been observed (Korenaga et al., 2007). Postive staining for alpha-smooth muscle actin is thought to be indicative of a process (epithelial–mesenchymal transition) that is associated with the progression of malignant tumors (Weinberg, 2008).
With respect to cancers of the bile duct, bile duct hyperplasia (but not tumors) has been reported (Knerr and Schrenk, 2006; Walker et al., 2006; Yoshizawa et al., 2007). Similarly, monkeys treated with TCDD developed metaplasia, hyperplasia, and hypertrophy of the bile duct (Allen et al., 1977). Hollingshead et al. (2008) showed that TCDD-activated AHR in human breast and endocervical cell lines induces sustained high concentrations of the IL-6 cytokine, which has tumor-promoting effects in numerous tissues, including cholangiocytes. Thus TCDD might promote carcinogenesis in biliary tissue.
TCDD may contribute to tumor progression by inhibiting p53 regulation (phosphorylation and acetylation) triggered by genotoxicants via the increased expression of the metastasis marker AGR2 (Ambolet-Camoit et al., 2010) and through a functional interaction between the AHR and FHL2 (Kollara and Brown, 2009). The AHR was also shown to be a regulator of c-raf and propose cross-talk between the AHR and the mitogen-activated protein kinase signaling pathway in chemically induced hepatocarcinogenesis (Borlak and Jenke, 2008). TCDD inhibits UV-C radiation-induced apoptosis in primary rat hepatocytes and Huh-7 human hepatoma cells, and this supports the hypothesis that TCDD acts as a tumor-promoter by preventing initiated cells from undergoing apoptosis (Chopra et al., 2009).
In rodents, TCDD may promote hepatocarcinogenesis by cytotoxicity, chronic inflammation, and liver regeneration and by hyperplastic and hypertrophic growth due to sustained activation of the AHR (Köhle et al., 2008). Species differences associated with AHR activation are supported by the divergence in the transcriptomic responses to TCDD in mouse, rat, and human liver (Boutros et al., 2008, 2009; Carlson et al., 2009; Kim et al., 2009), but it should be noted that these in vitro human hepatocyte studies may not reflect the in vivo response of human liver to TCDD. In vitro studies with transformed cell-line and primary hepatocytes cannot replicate the complexity of a tissue response that is important in eliciting the toxic responses observed in vivo (Dere et al., 2006).
The biologic plausibility of the carcinogenicity of the chemicals of interest is discussed in general at the beginning of this chapter.
Synthesis
The isolated finding of a barely significant increase in mortality from biliary cancer in the intermediate-exposure zone at Seveso does not establish a consistent pattern of increased risk for biliary cancer. Despite the evidence of TCDD’s activity as a hepatocarcinogen in animals, the evidence from epidemiologic studies remains inadequate to link the chemicals of interest with hepatobiliary cancer, which has a relatively low incidence in Western populations.
Conclusion
On the basis of the evidence reviewed here and in previous VAO reports, the committee concludes that there is inadequate or insufficient evidence to determine whether there is an association between exposure to the chemicals of interest and hepatobiliary cancer.
The incidence of pancreatic cancer (ICD-9 157) increases with age. ACS estimated that 21,370 men and 21,770 women would receive a diagnosis of pancreatic cancer in the United States in 2010 and that 18,770 men and 18,030 women would die from it (Jemal et al., 2010). The incidence is higher in men than in women and higher in blacks than in whites. Other risk factors include family history, diet, and tobacco use; the incidence is about twice as high in smokers as in nonsmokers (Miller et al., 1996). Chronic pancreatitis, obesity, and type 2 diabetes are also associated with an increased risk of pancreatic cancer (ACS, 2006). The average annual incidence of pancreatic cancers is shown in Table 7-4.
Conclusions from VAO and Previous Updates
Update 2006 considered pancreatic cancer independently for the first time. Prior updates developed tables of results for pancreatic cancer but reached conclusions about the adequacy of the evidence of its association with herbicide exposure in the context of gastrointestinal tract cancers. The committee responsible for VAO concluded that there was limited or suggestive evidence of no association between exposure to the herbicides used by the US military in Vietnam and gastrointestinal tract tumors, including pancreatic cancer. The committee responsible for Update 2006 concluded that there was not enough evidence on each of the chemicals of interest to sustain that negative conclusion for any of the cancers in the gastrointestinal group and that, because these various types of cancer are generally regarded as separate disease entities, the evidence on each
should be evaluated separately. Pancreatic cancer was thus reclassified into the default category of inadequate or insufficient evidence of an association. The Update 2006 committee reviewed the increased rates of pancreatic cancer in Australian National Service Vietnam veterans but concluded that the increased rates could be attributed to the rates of smoking in the cohort (ADVA, 2005c). The committee also noted the report of increased rates of pancreatic cancer in US female Vietnam nurse veterans (Dalager et al., 1995). That increase persisted in the follow-up study of the American female veterans (Cypel and Kang, 2008) considered in Update 2008, but the update on mortality in the Seveso population (Consonni et al., 2008) did not support an association with pancreatic cancer.
Table 7-9 summarizes the results of the relevant studies concerning pancreatic cancer.
Update of the Epidemiologic Literature
Vietnam-Veteran Studies No studies of exposure to the chemicals of interest and pancreatic cancer in Vietnam veterans have been published since Update 2008.
Occupational Studies Collins et al. (2008, 2009a,b) published a series of papers on the mortality experience of workers employed in a Dow Chemical Company in Midland, Michigan, from 1937 to 1980. Serum dioxin was evaluated to estimate exposures to five dioxins in a group of 98 workers (Collins et al., 2008). Although the serum dioxin, furan, and PCB concentrations were measured many years after exposure, distinct patterns of dioxin congeners were found in workers who had different chlorophenol exposures. Collins et al. (2009b) described the mortality experience of 773 workers who were exposed to chlorinated dioxins in the production of PCP. Some 75% of the cohort have been followed for more than 27 years. SMRs were calculated to compare the PCP workers with the general US population and the population of the state of Michigan. There were five observed deaths from pancreatic cancer (SMR 1.1, 95% CI 0.3–2.5). In a companion paper, the authors examined 1,615 workers who had been exposed to TCP production (Collins et al., 2009a). The mean duration of follow-up was 36.4 years. Six deaths from pancreatic cancer were observed, for an SMR of 0.7 (95% CI 0.2–1.4).
McBride et al. (2009a,b) conducted an occupational mortality study of workers in the Dow AgroSciences plant in New Plymouth, New Zealand, who were potentially exposed to TCDD. Workers employed during the period from January 1969 to November 1988 (when 2,4,5-T was no longer produced at the work sites) were followed to the end of 2004, and SMRs were calculated by using national mortality figures. McBride et al. (2009a) found the SMR for pancreatic-cancer deaths was 0.3 (95% CI 0.13–3.39) in exposed workers and 0.0 (95% CI 0.0–4.9) in the never-exposed group. The results in McBride et al. (2009b) have not been included, because they were diluted by inclusion of a set of workers who had no opportunity for TCDD exposure and no observed deaths.
TABLE 7-9 Selected Epidemiologic Studies—Pancreatic Cancer
| Reference | Study Populationa | Exposed Casesb |
Exposure of Interest/ Estimated Risk (95% CI)b |
| VIETNAM VETERANS | |||
| US CDC Vietnam Experience Study | |||
| Mortality (1965-2000) | |||
| Follow-up of CDC Vietnam Experience Cohort | 5 | 1.0 (0.3-3.5) | |
| US VA Mortality Study of Army and Marine Veterans—Ground troops serving July 4, 1965—March 1, 1973 | All COIs | ||
| Army Vietnam veterans | 82 | 0.9 (0.6-1.2) | |
| Marine Vietnam veterans | 18 | 1.6 (0.5-5.8) | |
| US VA Cohort of Eemale Vietnam Veterans | All COIs | ||
| Mortality through 2004 | |||
| US Vietnam veterans—women | 17 | 2.1 (1.0-4.5) | |
| Vietnam-veteran nurses | 14 | 2.5 (1.0-6.0) | |
| Mortality through 1991 | |||
| US Vietnam veterans—women | 7 | 2.8 (0.8-10.2) | |
| Vietnam-veteran nurses | 7 | 5.7 (1.2-27.0) | |
| Mortality through 1987 | |||
| US Vietnam veterans—women | 5 | 2.7 (0.9-6.2) | |
| State Studies of US Vietnam Veterans | All COIs | ||
| PM study of deaths (1974-1989) of Michigan | 14 | 1.0 (0.6-1.7) | |
| Vietnam-era veterans—deployed vs nondeployed | |||
| Non-black | 9 | 0.7 (0.3-1.3) | |
| Black | 5 | 9.1 (2.9-21.2) | |
| Wisconsin Vietnam veterans | 4 | nr | |
| Australian Vietnam Veterans vs Australian Population | All COIs | ||
| Australian male Vietnam veterans vs Australian | 86 | 1.2 (0.9-1.4) | |
| population—incidence | |||
| Navy | 14 | 0.9 (0.5-1.5) | |
| Army | 60 | 1.2 (0.9-1.5) | |
| Air Force | 12 | 1.3 (0.7-2.3) | |
| Australian male Vietnam veterans vs Australian | 101 | 1.2 (1.0-1.5) | |
| population—mortality | |||
| Navy | 18 | 1.0 (0.6-1.6) | |
| Army | 71 | 1.3 (1.0-1.6) | |
| Air Force | 11 | 1.1 (0.5-1.8) | |
| Australian military Vietnam veterans | 38 | 1.4 (0.9-1.8) | |
| Australian Conscripted Army National Service (deployed vsnondeployed) | All COIs | ||
| Australian male conscripted Army National | |||
| Service Vietnam-era veterans: deployed vs nondeployed | |||
| Incidence | 17 | 2.5 (1.0-6.3) | |
| Mortality | 19 | 3.1 (1.3-8.3) | |
| Reference | Study Populationa | Exposed Casesb |
Exposure of Interest/ Estimated Risk (95% CI)b |
| Australian National Service Vietnam veterans | 6 | 1.5 (nr) | |
| OCCUPATIONAL | |||
| IARC Phcnoxy Herbicide Cohort (mortality vs national mortality rates) | Dioxin, phenoxy herbicides | ||
| IARC cohort, male and female workers exposed to any phenoxy herbicide or chlorophenol |
47 | 0.9 (0.7-1.3) | |
| Exposed to highly chlorinated PCDDs | 30 | 1.0 (0.7-1.4) | |
| Not exposed to highly chlorinated PCDDs | 16 | 0.9 (0.5-1.4) | |
| IARC cohort—exposed subcohort (males.females) | 26 | 1.1 (0.7-1.6) | |
| NIOSH Mortality Cohort (12 US plants, production 1942-1984) (included in IARC cohort) | Dioxin, Phenoxy Herbicides |
||
| US chemical production workers | 16 | 1.0 (0.6-1.6) | |
| Fingerhul et al., 1991 | NIOSH—entire cohort | 10 | 0.8 (0.4-1.6) |
| ≥ l-yr exposure, ≥ 20-yr latency | 4 | 1.0 (0.3-2.5) | |
| Dow Chemical Company—Midland. MI (included in IARC and NIOSH cohorts) | Dioxin, Phenoxy Herbicides |
||
| Trichlorophenol workers | 6 | 0.7 (0.2-1.4) | |
| Pentachlorophenol workers | 5 | 1.1 (0.3-2.5) | |
| Dow pentachlorophenol production workers | |||
| 0-yr latency | 2 | 0.7 (0.1-2.7) | |
| 15-yr latency | 2 | 0.9 (0.1-3.3) | |
| Danish Production Workers (included in IARC cohort) | Dioxin, Phenoxy Herbicides |
||
| Danish production workers—incidence | |||
| Men | 3 | 0.6 (nr) | |
| Women | 0 | nr | |
| Dutch Production Workers (included in IARC cohort) | Dioxin, Phenoxy Herbicides |
||
| Dutch chlorophenoxy workers | |||
| Factory A | 4 | 0.9 (0.2-4.2) | |
| Factory B | 1 | nr | |
| Dutch chemical production workers | 4 | 2.5 (0.7-6.3) | |
| Dutch phenoxy herbicide workers | 3 | 2.2 (0.5-6.3) | |
| Reference | Study Populationa | Exposed Casesb |
Exposure of Interest/ Estimated Risk (95% CI)b |
| German Production Workers (included in I ARC cohort) | Dioxin, Phenoxy Herbicides |
||
| German production workers | |||
| Plant 1 | 2 | 0.6 (0.1-2.3) | |
| Plant II | 0 | nr | |
| Plant III | 0 | nr | |
| Plant IV | 2 | 1.7 (0.2-6.1) | |
| New Zealand Production Workers—Dow plant in Plymouth, NZ (included in IARC cohort) | Dioxin, Phenoxy Herbicides |
||
| 1,599 production workers (male and female) vs national rates—mortality 1969 through 2004 |
|||
| Ever | 3 | 1.3 (0.3-3.9) | |
| Never | 0 | 0 (0.0-4.9) | |
| 't Mannetje et al., 2005 | Phenoxy herbicide producers (men and women) | 3 | 2.1 (0.4-6.1) |
| Phenoxv herbicide spravers ( > 99% men) | 0 | 0.0 (0.0-2.1) | |
| United Kingdom Production Workers (included in IARC cohort) | Dioxin, Phenoxy Herbicides |
||
| British MCPA production workers | 9 | 0.7 (0.3-1.4) | |
| Agricultural Health Study | Herbicides | ||
| A1IS nested case—control (applicators and spouses combined) | |||
| 2,4-D | 48 | 0.9 (0.5-1.5) | |
| Dicamba | 23 | 0.9 (0.6-1.6) | |
| US AHS—incidence | |||
| Private applicators (men and women) | 46 | 0.7 (0.5-1.0) | |
| Spouses of private applicators ( > 99%women) | 20 | 0.9 (0.6-1.4) | |
| Commercial applicators (men and women) | 3 | 1.1 (0.2-3.2) | |
| US AHS | |||
| Private applicators (men and women) | 29 | 0.6 (0.4-0.9) | |
| Spouses of private applicators ( > 99%women) | 0.7 (0.3-1.2) | ||
| Other Agricultural Workers | Herbicides | ||
| Italian rice growers | 7 | 0.9 (0.4-1.9) | |
| US farmers in 23 states | |||
| White men | 1,133 | 1.1 (1.1-1.2) | |
| White women | 23 | 1.0 (0.6-1.5) | |
| Danish farm workers—incidence | |||
| Men—self-employed | 137 | 0.6 (p < 0.05) | |
| employees | 23 | 0.6 (p < 0.05) | |
| Women—self-employ ed | 7 | 1.2 (nr) | |
| employees | 4 | 1.3 (nr) | |
| family workers | 27 | 0.7 (p <0.05) | |
| Reference | Study Populationa | Exposed Casesb |
Exposure of Interest/ Estimated Risk (95% CI)b |
| USUA agricultural extension agenis | 21 | 1.3 (0.8-1.9) | |
| Swedish male and female agricultural | 99% CI | ||
| workers—incidence | 777 | 0.8 (0.8-0.9) | |
| Burmeisler,1981 | Iowa farmers | 416 | 1.1 (nr) |
| Other Studies of Herbicide and Pesticide Applicators | Herbicides | ||
| Dutch licensed herbicide applicators | 5 | 1.2 (0.4-2.7) | |
| Italian licensed pesticide users | 32 | 0.7 (0.5-1.0) | |
| Dutch licensed herbicide applicators | 3 | 2.2 (0.4-6.4) | |
| Honda pesticide applicators | Expected exposed cases | ||
| 4 | 4.0 | ||
| Forestry Workers | Herbicides | ||
| USDA forest, soil conservationists | 22 | 1.5 (0.9-2.3) | |
| New Zealand forestry workers—nested case-control—incidence |
6 | 1.8 (0.8-4.1) | |
| Paper and Pulp Workers | Dioxins | ||
| IARC cohort of pulp and paper workers | |||
| Exposure to nonvolatile organochlorine compounds | |||
| Never | 67 | 0.8 (0.7-1.1) | |
| Ever | 69 | 1.1 (0.9-1.4) | |
| Danish paper-mill workers—incidence | |||
| Men | 30 | 1.2 (0.8-1.7) | |
| Women | 2 | 0.3 (0.0-1.1) | |
| New Hampshire paper and pulp workers | 9 | 1.9 (0.9-3.6) | |
| Solei et al.,1989 | US pulp and paper workers | 1 | 0.4 (0.0-2.1) |
| Northwestern US paper and pulp workers | 90% CI | ||
| Other Occupational Studies | |||
| UK case-control | Herbicides and chlorophenols | ||
| Herbicides | nr | 0.7 (0.3-1.5) | |
| Chlorophenols | nr | 0.8 (0.5-1.4) | |
| US flavor and fragrance chemical plant workers | 6 | Dioxin, 2,4.5-T | |
| 1.4 (nr) | |||
| Reference | Study Populationa | Exposed Casesb |
Exposure of Interest/ Estimated Risk (95% CI)b |
| ENVIRONMENTAL Seveso, Italy Residenlial Cohort |
TCDD | ||
| Seveso residents (men and women)—25-yr follow-up | |||
| Zone A | 2 | 1.2 (0.3-4.7) | |
| Zone B | 5 | 0.5 (0.2-1.1) | |
| Zone R | 76 | 1.0 (0.7-1.7) | |
| Seveso—20-yr follow-up to 1995—incidence | |||
| Zone A | 1 | 1.2 (0.2-8.2) | |
| Zone B | 3 | 0.6 (0.2-1.7) | |
| Zone R | 38 | 1.0 (0.7-1.4) | |
| Seveso residents—20-yr follow-up | |||
| Zones A, B—men | 4 | 0.7 (0.3-1.9) | |
| women | 1 | 0.3 (0.0-2.0) | |
| Seveso residents—15-yr follow-up | |||
| Zone A—men | 1 | 1.9 (0.0-10.5) | |
| Zone B—men | 2 | 0.6 (0.1-2.0) | |
| women | 1 | 0.5 (0.0-3.1) | |
| Zone R—men | 20 | 0.8 (0.5-1.2) | |
| women | 11 | 0.7 (0.4-1.3) | |
| Seveso residents—incidence | |||
| Zones A, B—men | 2 | 1.0 (0.3-4.2) | |
| women | 1 | 1.6 (0.2-12.0) | |
| Seveso residents—10-yr follow-up | |||
| Zones A, B, R—men | 9 | 0.6 (0.3-1.2) | |
| women | 4 | 1.0 (0.3-2.7) | |
| Seveso residents—10-yr follow-up | |||
| Zone B—men | 2 | 1.1 (0.3-4.5) | |
| Other Environmental Studies | |||
| Swedish fishermen (men and women)— | Organochlorine | ||
| mortality | compounds | ||
| East coast | 5 | 0.7 (0.2-1.6) | |
| West coast | 33 | 0.8 (0.6-1.2) | |
| Swedish fishermen (men and women)—incidence | |||
| East coast | 4 | 0.6 (0.2-1.6) | |
| West coast | 37 | 1.0 (0.7-1.4) | |
ABBREVIATIONS: 2,4-D, 2,4-dichlorophenoxyacetic acid; AHS, Agricultural Health Study; CDC, Centers for Disease Control and Prevention; CI, confidence interval; COI, chemical of interest; IARC, International Agency for Research on Cancer; MCPA, methyl-4-chlorophenoxyacetic acid; MI, Michigan; NIOSH, National Institute for Occupational Safety and Health; nr, not reported; NZ, New Zealand; PCDD, polychlorinated dibenzo-p-dioxin (highly chlorinated, if four or more chlorines); PM, proportionate mortality; TCDD, 2,3,7,8-tetrachlorodibenzo-p-dioxin; UK United Kingdom; USDA, US Department of Agriculture; VA, Department of Veterans Affairs.
aSubjects are male, and outcome is mortality unless otherwise noted.
bGiven when available; results other than estimated risk explained individually.
Andreotti et al. (2009) published a nested case–control study of pancreatic cancer in the AHS cohort. The analysis included 93 incident pancreatic-cancer cases—64 applicators (two female) and 29 spouses (all female)—and more than 82,000 controls. Applicators and their spouses had similar risks of pancreatic cancer, so risk estimates were shown for both combined. Exposure to 13 pesticides was examined, including two chemicals of interest: 2,4-D and dicamba. There were 48 cases of pancreatic cancer in the group exposed to 2,4-D (OR = 0.9, 95% CI 0.5–1.5) and 23 cases in the group exposed to dicamba (OR = 0.9, 95% CI 0.6–1.6); age, diabetes, and smoking were adjusted for. Results were also shown for intensity-weighted lifetime days of pesticide use and pancreatic-cancer risk. No statistically significant associations were seen for the two chemicals of interest.
Boers et al. (2010) published the third set of follow-up results of a retrospective cohort study of two Dutch chlorophenoxy herbicide manufacturing factories, producing mainly 2,4,5-T (factory A) and MCPA, MCPP, and 2,4-D (factory B). The cohort consisted of all persons who worked in either of the two factories during 1955–1985 (factory A) or 1965–1986 (factory B). No increases in pancreatic-cancer deaths were observed. The hazard ratio (HR) in factory A was 0.86 (95% CI 0.18–4.19). One case of pancreatic cancer was observed in factory B in exposed workers and none in controls.
Environmental Studies Pancreatic-cancer cases were reported in the cancer-incidence study of the population (males and females combined) exposed to dioxin after the Seveso accident in 1976 (Pesatori et al., 2009). One pancreatic-cancer case was observed in Zone A (high exposure) (RR = 1.15, 95% CI 0.16– 8.19), 3 in Zone B (medium exposure) (RR = 0.56, 95% CI 0.18–1.74), and 38 in Zone R (low exposure) (RR = 0.99, 95% CI 0.70–1.40).
Biologic Plausibility
Long-term animal studies have examined the effect of exposure to the chemicals of interest on tumor incidence (Charles et al., 1996; Stott et al., 1990; Walker et al., 2006; Wanibuchi et al., 2004). No increase in the incidence of pancreatic cancer in laboratory animals after the administration of cacodylic acid, 2,4-D, or picloram has been reported. A 2-year study of female rats has reported increased incidences of pancreatic adenomas and carcinomas after treatment at the highest dose of TCDD (100 ng/kg per day) (Nyska et al., 2004). Other studies have observed chronic active inflammation, acinar-cell vacuolation, and an increase in proliferation of the acinar cells surrounding the vacuolated cells (Yoshizawa et al., 2005b). As previously discussed, both chronic inflammation and hyperproliferation are closely linked to the formation and progression of cancers, including that of the pancreas (Hahn and Weinberg, 2002; Mantovani et al., 2008). Metaplastic changes in the pancreatic ducts were also observed in female monkeys treated with TCDD (Allen et al., 1977).
The biologic plausibility of the carcinogenicity of the chemicals of interest is discussed in general at the beginning of this chapter.
Synthesis
The large excess of pancreatic cancers in female Vietnam veterans vs their nondeployed counterparts observed by Thomas et al. (1991) and Dalager et al. (1995) prevailed in a study by Cypel and Kang (2008), who found a significant increase in all female Vietnam veterans and in the nurse subset. The committee responsible for Update 2006 reported a higher incidence of and mortality from pancreatic cancer in deployed Australian National Service veterans than in nondeployed veterans (ADVA, 2005c). A limitation of all the veteran studies considered has been the lack of control for the effect of smoking. For the 31 female and 62 male cases in the AHS case–control study considered in the present update (Andreotti et al., 2009), however, the risk of pancreatic cancer was not associated with 2,4-D exposure. No increase in risk has been reported in US male Vietnam veterans or in IARC follow-up studies.
Conclusion
On the basis of the evidence reviewed here and in previous VAO reports, the committee concludes that there is inadequate or insufficient evidence to determine whether there is an association between exposure to the chemicals of interest and pancreatic cancer.
ACS estimated that 10,110 men and 2,610 women would receive diagnoses of cancer of the larynx (ICD-9 161) in the United States in 2010 and that 2,870 men and 730 women would die from it (Jemal et al., 2010). Those numbers constitute a little more than 0.9% of new cancer diagnoses and 0.7% of cancer deaths. The incidence of cancer of the larynx increases with age, and it is more common in men than in women, with a sex ratio in the United States of about 4:1 in people 50–64 years old. The average annual incidence of laryngeal cancer is shown in Table 7-10.
Established risk factors for laryngeal cancer are tobacco use and alcohol use, which are independent and act synergistically. Occupational exposures—long and intense exposures to wood dust, paint fumes, and some chemicals used in the metalworking, petroleum, plastics, and textile industries—also could increase risk (ACS, 2007b). An Institute of Medicine committee concluded that asbestos is a causal factor in laryngeal cancer (IOM, 2006); infection with human papilloma virus is also thought to raise the risk of laryngeal cancer (Baumann et al., 2009; Hobbs and Birchall, 2004).
TABLE 7-10 Average Annual Incidence (per 100,000) of Laryngeal Cancer in United Statesa
| 55-59 Years Old | 60-64 Years Old | 65-69 Years Old | |||||||
| All Races | While | Black | All Races | While | Black | All Races | While | Black | |
| Men | 13.0 | 12.0 | 2.9 | 27.1 | 18.9 | 17.8 | 4.1 | 40. | 26.8 |
| Women | 3.0 | 26.4 | 6.2 | 6.1 | 51.2 | 12.4 | 4.0 | 16.3 | 6.2 |
aSurveillance, Epidemiology, and End Results program, nine standard registries, crude age-specific rates, 2004–2008 (NCI, 2010).
Conclusions from VAO and Previous Updates
The committee responsible for VAO concluded that there was limited or suggestive evidence of an association between exposure to at least one of the chemicals of interest and laryngeal cancer on the basis of the evidence discussed below in the section “Synthesis.” Additional information available to the committees responsible for Update 1996, Update 1998, Update 2000, Update 2002, Update 2004, Update 2006, and Update 2008 did not change that conclusion.
Table 7-11 summarizes the results of the relevant studies.
Update of the Epidemiologic Literature
Vietnam-Veteran Studies
No Vietnam-veteran studies addressing exposure to the chemicals of interest and laryngeal cancer have been published since Update 2008.
Occupational Studies
Collins et al. (2009a) reported on the mortality experience through 2003 of a group of workers in the Midland, Michigan, Dow Chemical plant previously included in analyses of the NIOSH mortality cohort, as reported by Fingerhut et al. (1991) and added to the expanded IARC phenoxy herbicide cohort (Kogevinas et al., 1997). In the updated analysis completed by Dow-employed epidemiologists, three laryngeal-cancer deaths were reported, and this led to estimated nonsignificant SMRs of 1.3 (95% CI 0.3–3.9) in all TCP workers and 1.5 (95% CI 0.3–4.4) when 196 workers who had some PCP exposure were excluded. As pointed out in follow-up correspondence (Collins et al., 2010; Villeneuve and Steenland, 2010), different latency models, different dose–response models, and in-depth analysis of serum exposure concentrations could alter some of the results reported in the analysis, but there were only three deaths from laryngeal cancer, so these issues are unlikely to affect the laryngeal-cancer risk estimates appreciably.
TABLE 7-11 Selected Epidemiologic Studies—Laryngeal Cancer
| Reference | Study Populationa | Exposed Casesb |
Exposure of Interest/ Estimated Risk (95% CI)b |
| VIETNAM VETERANS | |||
| US Air Force Health Study—Ranch Hand veterans vs SEA veterans | All COIs | ||
| AFHS veterans—incidence | |||
| Oral cavity, pharynx, larynx | 4 | 0.6 (0.2-2.4) | |
| US CDC Vietnam Experience Study | All COIs | ||
| CDC Vietnam Experience Cohort | 0 | 0.0 (nr) | |
| US VA Mortality Study of Army and Marine Veterans (ground troops serving July 4.1965-March 1,1973) | All COIs | ||
| Watanabe and Kang. 1996 | Army Vietnam veterans compared with US men (follow-up through 1988) | 50 | 1.3 (nr) |
| Marine Vietnam veterans | 4 | 0.7 (nr) | |
| Army Vietnam veterans | 50 | 1.4 (p < 0.05) | |
| Australian Vietnam Veterans vs Australian Population | All COIs | ||
| Australian Vietnam veterans vs Australian | 97 | 1.5 (1.2-1.8) | |
| population—incidence | |||
| Navy | 21 | 1.5 (0.9-2.1) | |
| Army | 69 | 1.6 (1.2-1.9) | |
| Air Force | 7 | 0.8 (0.3-1.7) | |
| Australian Vietnam veterans vs Australian | 28 | 1.1 (0.7-1.5) | |
| population—mortality | |||
| Navy | 6 | 1.1 (0.4-2.4) | |
| Army | 19 | 1.1 (0.7-1.7) | |
| Air Force | 3 | 0.9 (0.2-2.5) | |
| Australian military Vietnam veterans | 12 | 1.3 (0.7-2.2) | |
| Australian Conscripted Army National Service (deployed vs All COIsnon deployed) | All COLs | ||
| Australian men conscripted Army National | |||
| Service Vietnam-era veterans: deployed vs nondeployed | |||
| Incidence | 8 | 0.7 (0.2-1.6) | |
| Mortality | 2 | 0.4 (0.0-2.4) | |
| Australian National Service Vietnam veterans | 0 | 0 (0- >10) | |
| OCCUPATIONAL | |||
| IARC Phenoxy Herbicide Cohort (mortality vs national mortality rates) | Dioxin, phenoxy herbicides | ||
| IARC cohort, male and female workers exposed to any phenoxy herbicide or chlorophenol |
21 | 1.6 (1.0-2.5) | |
| Exposed to highly chlorinated PCDDs | 15 | 1.7 (1.0-2.8) | |
| Not exposed to highly chlorinated PCDDs | 5 | 1.2 (0.4-2.9) | |
| IARC cohort (men and women)—exposed subcohort | 8 | 1.5 (0.6-2.9) | |
| Reference | Study Populationa | Exposed Casesb |
Exposure of Interest/ Estimated Risk (95% CI)b |
| NIOSH Mortality Cohort (12 US plants, production 1942–1984) (included in IARC cohort) | Dioxin, phenoxy herbicides | ||
| NIOSH—entire cohort | 7 | 2.1 (0.8-4.3) | |
| ≥1-yr exposure, ≥ 20-yr latency | 3 | 2.7 (0.6-7.8) | |
| Dow Chemical Company—Midland. MI (included in IARC and NOISH cohorts) | Dioxin, phenoxy herbicides | ||
| Trichlorophenol workers | 3 | 1.3 (0.3-3.9) | |
| Pentachlorophenol workers | 2 | 1.7 (0.2-6.2) | |
| Ramlow et al., 2009b | Dow pentachlorophenol production workers | 2 | 2.9 (0.3-10.3) |
| 0-yr latency | 2 | 2.9 (0.4-10.3) | |
| 15-yr latency | 1 | nr | |
| Dow 2,4-D production workers | 1 | 3.0 (0.0-16.8) | |
| German Production Workers (included in I ARC cohort) | Dioxin. phenoxy herbicides | ||
| German production workers—men, women | 2 | 2.0 (0.2-7.1) | |
| New Zealand Production Workers—Dow plant in Plymouth.NZ (included in IARC cohort) | Dioxin, phenoxy herbicides | ||
| 1,599 production workers (male and female) vs | 1 | 2.5 (0.1-14.0) | |
| New Zealand phenoxy herbicide producers, sprayers—mortality | |||
| Phenoxy herbicide producers (men and women) | 0 | nr | |
| Phenoxy herbicide sprayers ( > 99% men) | 0 | nr | |
| United Kingdom Production Workers (included in IARC cohort) | |||
| British MCPA production workers | 4 | 1.7 (0.5-4.5) | |
| Herbicide and Pesticide Applicators | Herbicides | ||
| Dutch licensed herbicide applicators | 1 | 1.0 (0.0-5.1) | |
| Italian farmers licensed to use pesticides | 25 | 0.5 (0.3-0.7) | |
| Agricultural Workers | Herbicides | ||
| Italian rice growers | 7 | 0.9 (0.4-1.9) | |
| US farmers in 23 states | |||
| White men | 162 | 0.7 (0.6-0.8) | |
| White women | 0 | nr (0.0-3.3) | |
| Reference | Study Populationa | Exposed Casesb |
Exposure of Interest/ Estimated Risk (95% CI)b |
| Forestry Workers | Herbicides | ||
| Thörn et al., 2000 | Swedish lumberjacks exposed to phenoxyacetic herbicides | ||
| Foremen incidence | 0 | nr | |
| New Zealand forestry workers—nested | 2 | 1.1 (0.3-4.7) | |
| Paper and Pulp Workers | Dioxins | ||
| IARC cohort of pulp and paper workers | |||
| Exposure to nonvolatile organochlorine chemicals | |||
| Never | 18 | 0.9 (0.5-1.5) | |
| Ever | 20 | 1.2 (0.8-1.9) | |
| ENVIRONMENTAL | |||
| Seveso, Italy Residential Cohort | TCDD | ||
| Seveso residents (men and women)—25-yr |
|||
| Zone A | 0 | nr | |
| Zone B | ≤ 8 | nr | |
| Zone R | ≤ 49 | nr | |
| Seveso residents (men and women)—20-yr |
|||
| Zone A | 0 | nr | |
| Zone B | 8 | nr | |
| Seveso residents—15-yr follow-up—all |
|||
| Zone B—men | 6 | nr | |
| women | 0 | nr | |
| Zone R—males | 32 | nr | |
| women | 6 | nr | |
| Chapaevsk, Russia | Dixin | ||
| Residents of Chapaevsk, Russia | |||
| Men | 13 | 2.3 (1.2-3.8) | |
| Wowen | 1 | 0.1 (0.0-0.6) | |
ABBREVIATIONS: AFHS, Air Force Health Study; CDC, Centers for Disease Control and Prevention; CI, confidence interval; COI, chemical of interest; IARC, International Agency for Research on Cancer; ICD, International Classification of Diseases; MCPA, methyl-4-chlorophenoxyacetic acid; MI, Michigan; NIOSH, National Institute for Occupational Safety and Health; nr, not reported; NZ, New Zealand; PCDD, polychlorinated dibenzo-p-dioxin (highly chlorinated, if four or more chlorines); SEA, Southeast Asia; TCDD, 2,3,7,8-tetrachlorodibenzo-p-dioxin; VA, US Department of Veterans Affairs.
aSubjects are male, and outcome is mortality unless otherwise noted.
bGiven when available; results other than estimated risk explained individually.
Collins et al. (2009b) also reported on mortality in 773 Dow employees in Midland who were exposed to dioxins in the manufacture of PCP. They reported an estimated nonsignificant excess of laryngeal cancer with an SMR of 1.7 (95% CI 0.2–6.2) or, when they excluded 196 workers who had TCP exposure, 2.2 (95% CI 0.3–8.1). Again, those estimates were based on only two deaths from laryngeal cancer, so the study did not have sufficient power to support a strong inference on causality.
McBride et al. (2009a,b) studied mortality through 2004 in 1,599 Dow employees of an agricultural manufacturing plant in New Zealand that produced phenoxy herbicides and picloram. The cohort also was included in the original IARC Cohort of Phenoxy Herbicide Workers (Saracci et al., 1991). There were crude exposure estimates in this study and only one death from laryngeal cancer. When mortality from laryngeal cancer in ever-exposed workers was compared with New Zealand national death rates, the SMR was a nonsignificant 2.5 (0.1– 14.0). The study was too small to be useful for establishing an etiologic role of the chemicals of interest. The results in McBride et al. (2009b) have not been included, because they were diluted by inclusion of a set of workers who had no opportunity for TCDD exposure and no observed deaths.
Environmental Studies
Turunen et al. (2008) studied fishermen’s health in Finland, including in their assessment of mortality exposure to dioxins and PCBs by using assessment of serum and adipose tissue from a set of the study participants. They reported a deficit of laryngeal, tracheal, and lung cancers. It is difficult to interpret those results given the small numbers and the unknown effects of the diet high in fish that was probably consumed by the subjects.
Biologic Plausibility
Long-term animal studies have examined the effect of exposure to the chemicals of interest on tumor incidence (Charles et al., 1996; Stott et al., 1990; Walker et al., 2006; Wanibuchi et al., 2004). No increase in the incidence of laryngeal cancer in laboratory animals after the administration of any of the chemicals of interest has been reported.
The biologic plausibility of the carcinogenicity of the chemicals of interest is discussed in general at the beginning of this chapter.
Synthesis
The original VAO committee reviewed five studies that presented data separately for laryngeal cancer (Bond et al., 1988; Coggon et al., 1986; Fingerhut et al., 1991; Manz et al., 1991; Sarracci et al., 1991). That committee concluded
that “although the numbers are too small to draw strong conclusions, the consistency of a mild elevation in relative risk is suggestive of an association for laryn-geal cancer.” The original VAO committee also noted that the studies reviewed for laryngeal cancer did not control for potential confounders, such as smoking and alcohol consumption (IOM, 1994).
Since then, a combined analysis of many of the separate cohorts has been conducted (the IARC Cohort of Phenoxy Herbicide Workers analyzed by Kogevinas et al., 1997) and has shown significant effects in workers exposed to any phenoxyacetic acid herbicide or chlorophenol (RR = 1.6, 95% CI 1.0–2.5; 21 deaths), especially workers exposed to TCDD (or higher-chlorinated dioxins) (RR = 1.7, 95% CI 1.0–2.8; 15 deaths). Those RRs are remarkably close to the pooled estimate computed by the committee responsible for VAO. The study by Kogevinas et al. was a high-quality study that used an excellent method for assessing exposure, and its results were unlikely to have been affected by confounding, because the distribution of smoking in working cohorts is not likely to differ with degree of exposure (Siemiatycki et al., 1988). Another IARC cohort that was used in studying pulp and paper workers also showed an increase in risk (RR = 1.2, 95% CI 0.8–1.9; 20 deaths; McLean et al., 2006).
With regard to veteran studies, a positive association was found in the study of veterans in Australia that compared mortality from laryngeal cancer with that in the general population (ADVA, 2005a) but not in the study that compared Australian veterans of the Vietnam conflict with nondeployed soldiers (ADVA, 2005c). In contrast, Watanabe and Kang (1996) found a significant 40% excess of mortality from laryngeal cancer in Army personnel deployed to the Vietnam theater. The Ranch Hand study is not large enough to have sufficient power to detect an association if one exists.
An environmental study (Revich et al., 2001) of residents of Chapaevsk, Russia, which was heavily contaminated by many industrial pollutants, including dioxin, showed an association with laryngeal cancer in men (RR = 2.3, 95% CI 1.2–3.8).
The committee for Update 2008 extensively reviewed and discussed the literature as part of its reassessment of all health outcomes. The additional data reviewed for the present update (the updated mortality study of Dow chemical workers) are largely consistent with the prior work, reporting a nonsignificant excess of laryngeal cancer. Although some 10% of laryngeal cancers now being diagnosed are associated with HPV, the small fraction is unlikely to have a substantial effect on studies over time.
Conclusion
On the basis of the evidence reviewed here and in previous VAO reports, the committee concludes that there is limited or suggestive evidence of an association between exposure to at least one chemical of interest and laryngeal cancer.
Lung cancer (carcinoma of the lung or bronchus, ICD-9 162.2–162.9) is the leading cause of cancer death in the United States. ACS estimated that 116,750 men and 105,770 women would receive diagnoses of lung cancer in the United States in 2010 and that about 86,220 men and 71,080 women would die from it (Jemal et al., 2010). Those numbers represent roughly 15% of new cancer diagnoses and 28% of cancer deaths in 2010. The principal types of lung neoplasms are identified collectively as bronchogenic carcinoma and carcinoma of the lung. Cancer of the trachea (ICD-9 162) is often grouped with cancer of the lung and bronchus under ICD-9 162. The lung is also a common site of metastatic tumors.
In men and women, the incidence of lung cancer increases greatly beginning at about the age of 40 years. The incidence in people 50–54 years old is double that in people 45–49 years old, and it doubles again in those 55–59 years old. The incidence is consistently higher in black men than in women or white men. The average annual incidence of lung cancer in the United States is shown in Table 7-12.
ACS estimates that 87% of lung-cancer deaths are attributable to cigarette-smoking (ACS, 2011a). Smoking increases the risk of all histologic types of lung cancer, but the associations with squamouscell and small-cell carcinomas are strongest. Other risk factors include exposure to asbestos, uranium, vinyl chloride, nickel chromates, coal products, mustard gas, chloromethyl ethers, gasoline, diesel exhaust, and inorganic arsenic. The latter statement does not imply that cacodylic acid, which is a metabolite of inorganic arsenic, can be assumed to be a risk factor. Important environmental risk factors include exposure to tobacco smoke and radon (ACS, 2007c).
Conclusions from VAO and Previous Updates
The committee responsible for VAO concluded that there was limited or suggestive evidence of an association between exposure to at least one chemical of interest and lung cancer on the basis of the evidence discussed below in the section “Synthesis.” Additional information available to the committees responsible
TABLE 7-12 Average Annual Incidence (per 100,000) of Lung and Bronchial Cancer in United Statesa
| 55-59 Years Old | 60-64 Years Old | 65-69 Years Old | |||||||
| All Races | While | Black | All Races | While | Black | All Races | While | Black | |
| Men | 101.8 | 95.1 | 179.8 | 182.0 | 175.1 | 299.8 | 308.5 | 301.4 | 475.4 |
| Women | 75.2 | 75.5 | 98.1 | 144.8 | 150.6 | 163.3 | 230.3 | 242.1 | 248.3 |
aSurveillance, Epidemiology, and End Results program, nine standard registries, crude age-specific rates, 2004–2008 (NCI, 2010).
for Update 1996, Update 1998, Update 2000, Update 2002, Update 2004, Update 2006, and Update 2008 did not change that conclusion.
Table 7-13 summarizes the results of the relevant studies.
Update of the Epidemiologic Literature
Vietnam-Veteran Studies
The mortality experience of the ACC veterans, who were responsible for handling and spraying herbicides around the perimeters of military base camps in Vietnam, was updated through 2005 by Cypel and Kang (2010). Vital status (through 1991) had last been reported in 1997 (Dalager and Kang, 1997). The new analysis abstracted records from some 18,000 Army personnel with chemical operations experience to create cohorts that had Vietnam experience (2,872) and did not have Vietnam experience (2,737). There were 593 deaths in the Vietnam cohort and 355 in the non-Vietnam cohort. It classified lung cancer with all cancers of the “respiratory system.” There were 60 observed respiratory-cancer deaths in the Vietnam group and 26 in the non-Vietnam group, for a crude rate ratio of 2.22 and an adjusted relative risk of 1.29 (95% CI 0.79–2.10) for respiratory cancer. Compared with those in the US male population, the SMRs for respiratory cancers were significantly higher at 1.35 (95% CI 1.03–1.73) in the Vietnam cohort and 1.01 (95% CI 0.66–1.48) in the non-Vietnam veterans. The study did not have data on tobacco use, but questionnaire responses collected in 1999–2000 from a subset of ACC veterans who had documented exposure to herbicides used in theater showed that adjustment for the patterns of cigarette use did not affect their higher risk estimates for respiratory disease. The follow-up is long enough to allow for extended latency and to account for selection of healthy soldiers to apply these agents.
Occupational Studies
In an updated analysis of the mortality experience of a group of workers in the Midland, Michigan, Dow chemical plant previously studied by NIOSH as part of data reported in 1991 (Fingerhut et al., 1991), Collins et al. (2009a) found no excess lung cancer in 1,615 workers exposed to dioxin in TCP production. There were 46 deaths attributable to bronchial, lung, and tracheal cancers (SMR = 0.7, 95% CI 0.5–0.9) in all TCP workers and 41 deaths (SMR = 0.7, 95% CI 0.5–1.0) when 196 workers who had some PCP exposure were excluded. As pointed out in follow-up correspondence (Collins et al., 2010; Villeneuve and Steenland, 2010), different latency models, different dose–response models, and in-depth analysis of the serum exposure concentrations might alter some of the results reported.
Collins et al. (2009b) also reported on mortality in 773 Dow employees in Midland, Michigan, who were exposed to dioxins in the manufacture of PCP.
TABLE 7-13 Selected Epidemiologic Studies—Lung and Bronchus Cancer
| Reference | Study Populationa | Exposed Casesb |
Exposure of Interest/ Estimated Risk (95% CI)b |
| VIETNAM VETERANS | |||
| US Air Force Health Study—Ranch Hand veterans vs SEA veterans | All COIs | ||
| Comparison subjects only from AFHS (respiratory system)—incidence Serum TCDD (pg/g) based on model with exposure variable loge (TCDD) |
|||
| Per unit increase of -loge(TCDD) (pg/g) | 36 | 1.7 (0.9-3.2) | |
| Quartiles (pg/g) | |||
| 0.4-2.6 | 6 | 1.0 (nr) | |
| 2.6-3.8 | 8 | 1.1 (0.3-3.4) | |
| 3.8-5.2 | 9 | 1.2 (0.4-3.5) | |
| > 5.2 | 13 | 1.9 (0.7-5.5) | |
| Number of years served in SEA | |||
| Per year of service | 36 | 1.1 (0.9-1.2) | |
| Quartiles (years in SEA) | |||
| 0.8-1.3 | 8 | 1.0 (nr) | |
| 1.3-2.1 | 4 | 0.5 (0.2-1.8) | |
| 2.1-3.7 | 11 | 0.7 (0.3-2.0) | |
| 3.7-16.4 | 13 | 0.7 (0.3-2.0) | |
| White AFHS subjects vs national rates | |||
| (respiratory system) | |||
| Ranch Hand veterans | |||
| Incidence | 33 | 1.1 (0.8-1.6) | |
| With tours between 1966-1970 | 26 | 1.1 (0.7-1.6) | |
| Mortality | 21 | 0.9 (0.6-1.3) | |
| Comparison veterans | |||
| Incidence | 48 | 1.2 (0.9-1.6) | |
| With tours 1966-1970 | 37 | 1.2 (0.9-1.6) | |
| Mortality | 38 | 1.1 (0.8-1.5) | |
| Ranch Hand veterans from AFHS (lung and bronchus)—incidence | 10 | 3.7 (0.8-17.1) | |
| US VA Cohort of Armv Chemical Corns | All COIs | ||
| ACC—deployed vs nondeployed and vs US | |||
| men (Vietnam-service status through 2005) Respiratory system |
|||
| Deployed vs nondeployed | 60 vs 26 | 1.3 (0.8-2.1) | |
| ACC vs US men | |||
| ACC Vietnam Cohort | 60 | 1.4 (1.0-1.7) | |
| Non-Vietnam Cohort (no service in SEA) | 26 | 1.0 (0.7-1.5) | |
| ACC veterans (respiratory system)—mortality | 11 | 1.4 (0.4-5.4) | |
| US CDC Vietnam Experience Study | All COIs | ||
| Follow-up of CDC Vietnam Experience Cohort(trachea, bronchus, and lung) | 41 | 1.0 (0.6-1.5) | |
| Low pay grade at time of discharge | nr | 1.6 (0.9-3.0) | |
| Reference | Study Populationa | Exposed Casesb |
Exposure of Interest/ Estimated Risk (95% CI)b |
| US VA Marine Post Service Mortality Study (all Marines active 1967–1969) | All COIs | ||
| Marine Vietnam service vs non-Vietnam (lung) | 42 | 1.3 (0.8-2.1) | |
| US VA Mortality Study of Army and Marine Veterans (Ground troopsserving July 4.1965-March 1,1973) | All COIs | ||
| US Army and Marine Corps Vietnam veterans (lung)—mortality |
|||
| Army Vietnam service | 1,139 | 1.1 (nr)(p < 0.05) | |
| Non-Vietnam | 1,141 | 1.1 (nr)(p < 0.05) | |
| Non-Vietnam | 77 | 0.9 (nr) | |
| US VA Cohort of Female Vietnam Veterans | All COIs | ||
| US Vietnam veterans—women (lung) | 50 | 1.0 (0.7-1.4) | |
| Vietnam veteran nurses | 35 | 0.8 (0.5-1.2) | |
| Australian Vietnam Veterans vs Australian General Population | All COIs | ||
| Australian male Vietnam veterans vs | 576 | 1.2 (1.1-1.3) | |
| Australian population—incidence | |||
| Branch of service | Navy | 141 | 1.4 (1.2-1.7) |
| Army | 372 | 1.2 (1.1-1.3) | |
| Air Force | 63 | 1.0 (0.7-1.2) | |
| Histologic type—all service branches combined | |||
| Adenocarcinoma | 188 | 1.5 (1.2-1.7) | |
| Squamous | 152 | 1.2 (1.0-1.4) | |
| Small-cell | 87 | 1.2 (0.97-1.5) | |
| Iarge-cell | 79 | 1.1 (0.8-1.3) | |
| Other | 70 | 1.1 (0.8-1.3) | |
| Australian male Vietnam veterans vs | 544 | 1.2 (1.1-1.3) | |
| Australian population—mortality Branch of service |
|||
| Navy | 135 | 1.4 (1.2-1.6) | |
| Army | 339 | 1.1 (1.0-1.3) | |
| Air Force | 71 | 1.1 (0.9-1.4) | |
| Australian Vietnam veterans—(lung cancer)—incidence (validation study) | Expected number of exposed cases (95% CI) | ||
| 46 | 65 (49-81) | ||
| Australian Vietnam veterans (lung)—incidence | 120 | 65 (49-89) | |
| Australian Vietnam veterans | |||
| Lung(ICD-9 162) | 212 | 1.3 (1.1-1.4) | |
| Respiratory systems (ICD-9 163-165) | 13 | 1.8 (1.0-3.0) | |
| Reference | Study Populationa | Exposed Casesb |
Exposure of Interest/ Estimated Risk (95% CI)b |
| Australian Conscripted Army National Service (deployed vs ememployed) | All COls | ||
| Australian male conscripted Army National Service Vietnam-era veterans: deployed vs nondeployed |
|||
| Incidence (1982-2000) | 78 | 1.2 (1.0-1.5) | |
| Histologic type | |||
| Adenocarcinoma | 27 | 1.4 (0.8-1.9) | |
| Squamous | 19 | 1.5 (0.9-2.3) | |
| Small-cell | 14 | 1.4 (0.8-2.4) | |
| Large-cell | 8 | 0.7 (0.3-1.3) | |
| Other | 10 | 1.2 (0.6-2.2) | |
| Mortality (1966-2001) | 67 | 1.8 (1.2-2.7) | |
| Australian National Service Vietnam veterans (lung)—mortality | 27 | 2.2 (1.1-4.3) | |
| State Studies of US Vietnam Veterans | All COIs | ||
| Case—control of Vietnam-era Vietnam veterans | 134 | 1.4 (1.0-1.9) | |
| (lung)—incidence | |||
| PM study of deaths (1974-1989) of Michigan | 80 | 0.9 (0.7-1.1) | |
| Vietnam-era veterans—deployed vs nondeployed (lung) | |||
| OCCUPATIONAL IARC Phenoxy Herbicide Cohort (mortality vs national mortalityrates) |
Dioxin, Phenoxy Herbicides |
||
| IARC cohort, male and female workers exposed to any phenoxy herbicide or chlorophenol |
|||
| Lung(ICD-9 162) | 380 | 1.1 (1.0-1.2) | |
| Other respiratory organs (ICD-9 163-165) | 12 | 2.3 (1.2-3.9) | |
| Kxposed to highly chlorinated PCDDs | |||
| Lung (ICD-9 162) | 225 | 1.1 (1.0-1.3) | |
| Other respiratory organs (ICD-9 163-165) Not exposed to highly chlorinated PCDDs |
9 | 3.2 (1.5-6.1) | |
| Lung (ICD-9 162) | 148 | 1.0 (0.9-1.2) | |
| Other respiratory organs (ICD-9 163-165) | 3 | 1.2 (0.3-3.6) | |
| IARC cohort, men, women—mortality | |||
| Trachea, bronchus, lung | 173 | 1.0 (0.9-1.2) | |
| NIOSH Mortality Cohort (12 US plants, production 1942-1984) | Dioxin, Phenoxy Herbicides |
||
| US chemical production workers—-mortality | |||
| Lung | 125 | 1.1 (0.9-1.3) | |
| Reference | Study Populationa | Exposed Casesb |
Exposure of Interest/ Estimated Risk (95% CI)b |
| NIOSH workers exposed to TCDD—mortality Entire cohort |
|||
| Trachea, bronchus, lung (1CD-9 162) | 89 | 1.1 (0.9-1.4) | |
| Respiratory system (ICD-9 160-165) | 96 | 1.1 (0.9-1.4) | |
| ≥ 1-yr exposure, ≥ 20-yr latency | |||
| Trachea, bronchus, lung (ICD-9 162) | 40 | 1.4 (1.0-1.9) | |
| Respiratory system (ICD-9 160-165) | 43 | 1.4 (1.0-1.9) | |
| Dow Production Workers—Midland. MI (included in IARC and NIOSH cohorts) | Dioxin, phenoxy herbicides | ||
| Trichlorophenol workers | |||
| Cancers of the bronchus, trachea, and lung | 46 | 0.7 (0.5-0.9) | |
| Pentachlorophenol workers | |||
| Cancers of the bronchus, trachea, and lung | 30 | 1.0 (0.6-1.4) | |
| Dow chemical production workers—mortality | |||
| Lung | 54 | 0.8 (0.6-1.1) | |
| Dow 2,4-D production workers—mortality | |||
| Respiratory system (ICD-8 160-163) | 1 | 0.9 (0.6-1.3) | |
| Dow pentachlorophenol production | |||
| workers—mortality 0-yr latency |
|||
| Respiratory system (ICD-8 160-163) | 18 | 1.0 (0.6-1.5) | |
| Lung (ICD-8 162) | 16 | 0.9 (0.5-1.5) | |
| Respiratory system (ICD-8 160-163) | 17 | 1.1 (0.6-1.8) | |
| Lung (ICD-8 162) | 16 | 1.1 (0.6-1.8) | |
| Dow 2,4-D production workers | |||
| Respiratory system (ICD-8 162-163) | 9 | 0.8 (0.4-1.5) | |
| Dow 2,4-D production workers—mortality | |||
| Lung (ICD-8 162-163) | 8 | 1.0 (0.5-2.0) | |
| Low cumulative exposure | 0.7 nr | ||
| Medium cumulative exposure | 2 | 1.0 (nr) | |
| High cumulative exposure | 5 | 1.7 (m) | |
| BASF Production Workers (included in IARC cohort) | Dioxin, Phenoxy Herbicides |
||
| BASF employees—incidence Respiratory system |
13 | 1.2 (0.6-2.0) | |
| TCDD 0.1-0.99 µg/kg of body weight | 2 | 0.7 (0.1-2.5) | |
| TCDD ≥ 1 µg/kg of body weight | 8 | 2.0 (0.9-3.9) | |
| Lung, bronchus | 11 | 1.1 (0.6-2.0) | |
| TCDD 0.1-0.99 µg/kg of body weight | 2 | 0.8 (0.1-2.8) | |
| TCDD ≥ 1 µg/kg of body weight | 8 | 2.2 (1.0-4.3) | |
| BASF employees—incidence | 90% CI | ||
| Trachea, bronchus, lung | 4 | 2.0 (0.7-4.6) | |
| Reference | Study Populationa | Exposed Casesb |
Exposure of Interest/ Estimated Risk (95% CI)b |
| Danish Production Workers (included in IARC cohort) | Dioxin, Phenoxy Herbicides |
||
| Danish production workers—incidence (2 of original 4 plant) | |||
| Lung | 13 | 1.6 (0.9-2.8) | |
| Danish production workers—incidence (all 4 plants) Lung |
|||
| Men | 38 | 1.2 (nr) | |
| Women | 6 | 2.2 (nr) | |
| Dutch Production Workers (included in IARC cohort) | Dioxin, Phenoxy Herbicides |
||
| Dutch chlorophenoxy workers | |||
| Factory A | |||
| Respiratory cancer | 21 | 1.1 (0.5-2.5) | |
| Trachea, lung, bronchus cancers | 20 | 1.2 (0.5-2.8) | |
| Factory B | |||
| Respiratory cancer | 12 | 1.2 (0.6-2.7) | |
| Trachea, lung, bronchus cancers | 12 | 1.2 (0.6-2.7) | |
| Bueno de Mcsquita et al., 1993 | Dutch phenoxy herbicide workers—mortality | ||
| Trachea, bronchus, lung (ICD-8 162) | 9 | 0.8 (0.4-1.5) | |
| Respiratory system (ICD-8 160-163) | 9 | 1.7 (0.5-6.3) | |
| German Production Workers (included in IARC cohort) | Dioxin, Phenoxy Herbicides |
||
| German production workers—lung | 47 | 1.4 (1.1-1.9) | |
| German production workers—mortality | |||
| Lung | 26 | 1.7 (1.1-2.4) | |
| New Zealand Production Workers—Dow plant in Plymouth, NZ (included in IARC cohort) | Dioxin, Phenoxy Herbicides |
||
| Mc Bride et al., 2009a | 1,599 production workers (male and female) vs national rates—mortality 1969 through 2004 |
||
| Respiratory cancer | 13 | 0.9 (0.5-1.6) | |
| Trachea, bronchus, and lung | 11 | 0.8 (0.4-1.5) | |
| New Zealand phenoxy herbicide workers—mortality Producers (men and women) |
|||
| Trachea, bronchus, lung (1CD-9 162) | 12 | 1.4 (0.7-2.4) | |
| Other respiratory system sites (ICD-9163-165) | 1 | 3.9 (0.1-21.5) | |
| Sprayers ( > 99% men) | |||
| Trachea, bronchus. lung (ICD-9 162) | 5 | 0.5 (0.2-1.1) | |
| Other respiratory system sites (ICD-9163-165) | 1 | 2.5 (0.1-13.7) | |
| Reference | Study Populationa | Exposed Casesb |
Exposure of Interest/ Estimated Risk (95% CI)b |
| United Kingdom Production Workers (included in IARC cohort) | Dioxin, Phenoxy Herbicides |
||
| British phenoxy herbicide workers—mortality | |||
| Lung | 19 | 1.3 (0.8-2.1) | |
| Workers with exposure above background | 14 | 1.2 (0.7-2.1) | |
| British MCPA production workers—mortality | |||
| Lung, pleura, mediastinum (ICD-8 162—164) | 117 | 1.2 (1.0-1.4) | |
| Background exposure | 39 | 1.0 (0.7-1.4) | |
| Low-grade exposure | 35 | 1.1 (0.8-1.6) | |
| High-grade exposure | 43 | 1.3 (1.0-1.8) | |
| Agricultural Health Study | Herbicides | ||
| Pesticide applicators in AHS—lung-cancer incidence from enrollment through 2002 Dicamba—lifetime days exposure |
|||
| None | 95 | 1.0 | |
| 1–<20 | 14 | 0.8 (0.5-1.5) | |
| 20–<56 | 11 | 0.6 (0.3-1.3) | |
| 56–< 116 | 12 | 1.0 (0.5-1.9) | |
| ≥ 116 | 15 | 1.5 (0.8-2.7) p-trend = 0.13 |
|
| US AHS—incidence | |||
| Private applicators (men and women) Lung |
266 | 0.5 (0.4-0.5) | |
| Respiratory system | 294 | 0.5 (0.4-0.5) | |
| Spouses of private applicators ( > 99% women) | |||
| Lung | 68 | 0.4 (0.3-0.5) | |
| Respiratory system | 71 | 0.4 (0.3-0.5) | |
| Commercial applicators (men and women) | |||
| Lung | 12 | 0.6 (0.3-1.0) | |
| Respiratory system | 14 | 0.6 (0.3-1.0) | |
| US AHS (lung)—mortality | |||
| Private applicators (men and women) | 129 | 0.4 (0.3-0.4) | |
| ≤ 10 years | 25 | 0.4 (nr)(p < 0.05) | |
| > 10 years | 80 | 0.3 (nr)(p < 0.05) | |
| Spouses of private applicators ( > 99% women) | 29 | 0.3 (0.2-0.5) | |
| Other Agricultural Workers | Herbicides |
||
| Danish gardeners (nasal, laryngeal, lung, and bronchus. ICD-7 160-165)—incidence |
|||
| 10-yr follow-up (1975-1954) reported in |
41 | 1.0 (0.7-1.3) | |
| 25-yr follow-up (1975-2001) | |||
| Born before 1915 (high exposure) | 34 | 0.9 (0.6-1.3) | |
| Born 1915-1934 (medium exposure) | 72 | 1.0 (0.8-1.2) | |
| Born after 1934 (low exposure) | 8 | 0.8 (0.4-1.7) | |
| Reference | Study Populationa | Exposed Casesb |
Exposure of Interest/ Estimated Risk (95% CI)b |
| Italian rice growers—mortality | |||
| Ling | 45 | 0.8 (0.6-1.1) | |
| Pleura | 2 | 2.2 (0.2-7.9) | |
| Italian licensed pesticide users—mortality | |||
| Lung | 155 | 0.5 (0.4-0.5) | |
| US farmers in 23 states (lung)—mortality | |||
| While men | 6,473 | 0.9 (0.9-0.9) | |
| White women | 57 | 0.8 (0.6-1.1) | |
| Dutch Licensed Herbicide Applicators | Herbicides | ||
| Dutch licensed herbicide applicators (trachea, and lung)—mortality | 27 | 0.7 (0.5-1.0) | |
| Dutch herbicide applicators—mortality | |||
| Trachea and lung | 12 | 1.1 (0.6-1.9) | |
| Other Studies of Herbicide and Pesticide Applicators | Herbicides | ||
| Finnish herbicide applicators, 1972-1989 Incidence |
|||
| Trachea, bronchus, lung (ICD-8 162) | 39 | 0.9 (0.7-1.3) | |
| Other respiratory (ICD-8 160, 161, 163) | 4 | 1.1 (0.7-1.3) | |
| Trachea, bronchus, lung (ICD-8 162) | 37 | 1.0 (0.7-1.4) | |
| Other respiratory (ICD-8 160, 161, 163) | 1 | 0.5 (0.0-2.9) | |
| Herbicide sprayers in Ontario (lung)— mortality | 5 | nr | |
| Saskatchewan farmers applying herbicides—incidence | |||
| Lung | 103 | 0.6 (nr) | |
| Herbicide sprayers in Minnesota—mortality | |||
| Trachea, bronchus, lung IICD-9 162.0-162.8) | 54 | 0.7 (0.5-0.9) | |
| All respiratory (ICD-9 160.0-165.9) | iT | 0.7 (0.5-0.9) | |
| Swedish pesticide applicators—incidence | |||
| Trachea, bronchus, lung | 38 | 0.5 (0.4-0.7) | |
| Licensed pesticide applicators in Florida, lawn. | |||
| Lung (ICD-8 162-163) | 7 | 0.9 (nr) | |
| Swedish herbicide sprayers (lung)—mortality | 3 | 1.4 (nr) | |
| Forestry Workers | Herbicides | ||
| Thörn et al., 2000 | Swedish lumberjacks exposed to phenoxy herbicides | ||
| Foremen (bronchus and lung)—incidence | 1 | 4.2 (0.0-23.2) | |
| New Zealand forestry workers—incidence (nested case-control) |
|||
| Lung | 30 | 1.3 (0.8-1.9) | |
| Reference | Study Populationa | Exposed Casesb |
Exposure of Interest/ Estimated Risk (95% CI)b |
| Paper and Pulp Workers | Dioxins | ||
| IARC cohort of pulp and paper workers— exposure to nonvolatile organochlorine compounds Lung (ICD-9 162) |
|||
| Never | 356 | 1.0 (0.9-1.1) | |
| Ever | 314 | 1.0 (0.9-1.2) | |
| Pleura (ICD-9 163) | |||
| Never | 17 | 2.8 (1.6-4.5) | |
| Ever | 4 | 0.8 (0.2-2.0) | |
| Other respiratory (ICD-9 164-165) | |||
| Never | 8 | 2.1 (0.9-4.2) | |
| Ever | 2 | 0.7 (0.1-2.4) | |
| ENVIRONMENTAL Seveso, Italy Residential Cohort |
TCDD | ||
| Seveso residents—25-yr follow-up—men, women flung ICD-9 162) | |||
| Zone A | 11 | 1.1 (0.6-2.0) | |
| Zone B | 62 | 1.1 (0.9-1.4) | |
| Zone R | 383 | 1.0 (0.8-1.1) | |
| Seveso residents—20-yr follow-up to 1996— | |||
| incidence flung ICD-9 162) | |||
| Zone A | 7 | 1.1 (0.5-2.4 | |
| Zone B | 37 | 0.96 (0.7-1.3) | |
| Zone R | 280 | 1.0 (0.9-1.2) | |
| Seveso residents—20-yr follow-up (lung)—incidence | |||
| Zones A, B—men | iT | 1.3 (1.0-1.7) | |
| women | 4 | 0.6 (0.2-1.7) | |
| Seveso residents—15-yr follow-up (lung)—incidence | |||
| Zone A—men | 4 | 1.0 (0.4-2.6) | |
| women | 0 | nr | |
| Zone B—men | 34 | 1.2 (0.9-1.7) | |
| women | 2 | 0.6 (0.1-2.3) | |
| Zone R—men | 176 | 0.9 (0.8-1.1) | |
| women | 29 | 1.0 (0.7-1.6) | |
| Seveso residents—15-yr follow-up (lung)—incidence | |||
| Zone A—men | 4 | 1.0 (0.3-2.5) | |
| Zone B—men | 34 | 1.2 (0.9-1.7) | |
| women | 2 | 0.6 (0.1-2.1) | |
| Zone R—men | 176 | 0.9 (0.8-1.0) | |
| women | 29 | 1.0 (0.7-1.5) | |
| Reference | Study Populationa | Exposed Casesb |
Exposure of Interest/ Estimated Risk (95% CI)b |
| Seveso residents—10-yr follow-up(trachea, bronchus, lung)—incidence | |||
| Zone A—men | 2 | 0.8 (0.2-3.4) | |
| Zone B—men | 18 | 1.1 (0.7-1.8) | |
| Zone R—men | 96 | 0.8 (0.7-1.0) | |
| women | 16 | 1.5 (0.8-2.5) | |
| Chapaevsk, Russia | Dioxin | ||
| Residents of Chapaevsk, Russia (lung) | |||
| Men | 168 | 3.1 (2.6-3.5) | |
| Women | 40 | 0.4 (0.3-0.6) | |
| Other Environmental Studies | |||
| Finnish fishermen and spouses | |||
| Larynx, trachea, and lung combined | |||
| Fishermen | 72 | 0.8 (0.6-1.0) | |
| Spouses | 8 | 0.7 (0.3-1.4) | |
| Residents of Japanese municipalities with and without waste-incineration plants | Age-adjusted mortality (per 100.000) |
||
| Men | |||
| With | 39.0 ± 6.7 vs | ||
| Without | 41.6 ± 9.1 (p=0.001) | ||
| Women | |||
| With | 13.7 ± 3.8 vs | ||
| Without | 14.3 ± 4.6 (p=0.11) | ||
| Swedish fishermen | |||
| East coast (lung, larynx) | 16 | 0.8 (0.5-1.3) | |
| West coast (Uine. larvnxl) | 77 | 0.9 (0.7-1.1) | |
ABBREVIATIONS: 2,4-D, 2,4-dichlorophenoxyacetic acid; ACC, Army Chemical Corps; AFHS, Air Force Health Study; AHS, Agricultural Health Study; CDC, Centers for Disease Control and Prevention; CI, confidence interval; COI, chemical of interest; IARC, International Agency for Research on Cancer; ICD, International Classification of Diseases; MCPA, methyl-4-chlorophenoxyacetic acid; MI, Michigan; NIOSH, National Institute for Occupational Safety and Health; nr, not reported; PCDD, polychlorinated dibenzo-p-dioxin (highly chlorinated, if four or more chlorines); PM, proportionate mortality; SEA, Southeast Asia; TCDD, 2,3,7,8-tetrachlorodibenzo-p-dioxin; VA, US Department of Veterans Affairs.
aSubjects are male, and outcome is mortality unless otherwise noted.
bGiven when available; results other than estimated risk explained individually.
In that report, there were 30 lung-, tracheal-, or bronchial-cancer deaths, for an estimated SMR of 1.0 (95% CI 0.6–1.4) or 1.1 (95% CI 0.7–1.6) when 196 workers who had TCP exposure were excluded. An accompanying estimated dose–response relationship did not support an increase in risk associated with an estimated increase in exposure.
McBride et al. (2009a,b) studied 1,599 Dow employees who manufactured 2,4,5-TCP in New Zealand. McBride et al. (2009a) reported crude exposure estimates and 13 deaths from respiratory cancer (11 of the bronchus, trachea, or lung). The SMR for lung cancer was not increased (0.9 for respiratory cancer and 0.8 for cancer of the trachea, bronchus, or lung). The highest SMR for lung cancer was observed in the highest exposure category created in an effort to perform exposure–response analysis, but the other risk estimates were not increased for other exposure categories. A crude effort was made to control for smoking, but its overall effect is difficult to assess. The proportional-hazards model also showed that the highest RR estimate occurred in the most heavily exposed workers, but again this was not reported to be significantly increased or to represent a trend. The results in McBride et al. (2009b) have not been included, because they were diluted by inclusion of a set of workers who had no opportunity for TCDD exposure and no observed deaths.
Finally, Boers et al. (2010) reported on the mortality experience of workers in two chlorophenoxy herbicide plants in the Netherlands. The previously significant increases in respiratory cancer were attenuated in this follow-up. Increased risk remained significant for all cancers. Factory A had 1,167 workers from 1955 to 1985. Factory B included 1,143 who had worked from 1965 to 1986. Crude exposure estimates were based on job. Respiratory-cancer risks were not significantly increased, with HRs of 1.11 (95% CI 0.49–2.52) for factory A (21 deaths in the exposed) and 1.22 (95% CI 0.56–2.66) for factory B (12 deaths in the exposed). Similar estimates of risk were evident for tracheal, lung, and bronchial cancers (factory A, HR = 1.15, 95% CI 0.48–2.77; factory B, HR = 1.22, 95% CI 0.56–2.66). HRs, calculated by factory did not show significant increases although the data were unstable when broken down into finer exposure categories (exposed in 1963 accident for factory A, main production worker exposed, and occasionally exposed for both factories). Although the previously reported significant increases in risks of respiratory cancer were not replicated in this analysis with 15 years of additional follow-up, the magnitude of the risks estimated in the Dutch workers was quite similar to that of the significant risks estimated by the ACC follow-up.
Environmental Studies
Pesatori et al. (2009) reported on cancer incidence in a 20-year follow-up of people exposed in the industrial accident in Seveso. Cancer of the lung occurred with an RR estimated by zone, drawn from residents in three exposure zones— very high (Zone A), high (Zone B), and low (Zone R). The RRs for lung-cancer incidence in the exposure groups were 1.12 (95% CI 0.53–2.36) in Zone A, 0.96 (95% CI 0.69–1.33) in Zone B, and 1.04 (95% CI 0.92–1.19) in Zone R. There were 7, 37, and 280 lung-cancer cases during the follow-up period in Zones A,
B, and R, respectively. The highest lung-cancer risk estimates were found in the longest-latency group in each exposure zone, although there was no clear evidence of an exposure–response relationship based on the small numbers of cases.
Turunen et al. (2008) conducted a study of dioxin-exposed and PCB-exposed fisherman in Finland that included assessment of mortality and estimates of exposure to dioxins and PCBs derived by using serum and adipose tissue from a set of the study participants. They reported a deficit (SMR = 0.80, 95% CI 0.63–1.01) of laryngeal, tracheal, and lung cancers—72 cases—and the SMR in their wives was even lower (0.70, 95% CI 0.30–1.38) with eight cases. The exposed fishermen were at slightly higher RR than their wives, but this excess was not significant and there was a deficit of these cancers compared with those in the general population.
Biologic Plausibility
Long-term animal studies have examined the effects of exposure to the chemicals of interest on tumor incidence (Charles et al., 1996; Stott et al., 1990; Walker et al., 2006; Wanibuchi et al., 2004). As noted in previous VAO reports, there is evidence of increased incidence of squamous-cell carcinoma of the lung in male and female rats exposed to TCDD at high concentrations (Kociba et al., 1978; Van Miller et al., 1977). A significant increase in neoplastic and non-neoplastic lung lesions was found in female rats exposed to TCDD for 2 years (Kociba et al., 1978; NTP, 1982a,b, 2006; Walker et al., 2006, 2007). The most common nonneoplastic lesions were bronchiolar metaplasia and squamous metaplasia of the alveolar epithelium. Cystic keratinizing epithelioma was the most commonly observed neoplasm. The lung was also identified as a target organ in a tumor-promotion study after 60 weeks of exposure to TCDD in ovariectomized female Sprague Dawley rats initiated with a single dose of diethyl-N-nitrosamine (Beebe et al., 1995; Tritscher et al., 2000). Those studies ended with increased incidences of alveolar epithelial hyperplasia and alveolar–bronchiolar metaplasia; this result was similar to what was observed in the National Toxicology Program (NTP) studies (Tritscher et al., 2000).
A 2-year study of F344 rats exposed to cacodylic acid at 0–100 ppm and B6C3F1 mice exposed at 0–500 ppm failed to detect lung neoplasms at any dose (Arnold et al., 2006); this finding is consistent with those of previous studies. However, exposure to cacodylic acid had previously been shown to increase tumor multiplicity in mouse strains that were susceptible to developing lung tumors (for example, A/J strain; Hayashi et al., 1998) or in mice pretreated with an intitiating agent (4-nitroquinoline 1-oxide; Yamanaka et al., 1996). The data indicate that cacodylic acid may act as a tumor-promoter in the lung.
The biologic plausibility of the carcinogenicity of the chemicals of interest is discussed in general at the beginning of this chapter.
Synthesis
The evidence remains limited but suggestive of an association between exposure to at least one chemical of interest and the risk of developing or dying from lung cancer. In the present update, there are compelling new data from the follow-up of the heavily exposed ACC (Cypel and Kang, 2010) that show significantly increased lung-cancer risks in ACC veterans who used herbicides in Vietnam; the magnitude of the estimated risk is consistent with those in many similar investigations. Additional updates of occupational data are unchanged, showing no increase in respiratory-cancer risk (Collins et al., 2009a,b). The latest update of the Netherlands occupationally exposed cohort is somewhat changed, showing still increased but now nonsignificant lung-cancer risk (Boers et al., 2010). Those estimates are not significant, but they remain increased and, in magnitude, again very similar to the ACC estimates and other published data.
In the past, the most compelling evidence has come from studies of heavily exposed occupational cohorts, including British MCPA production workers (Coggon et al., 1986), German production workers (Becher et al., 1996; Manz et al., 1991), a BASF cohort (Ott and Zober, 1996), a NIOSH cohort (Fingerhut et al., 1991; Steenland et al., 1999), and Danish production workers (Lynge, 1993). The latest findings from the Ranch Hand study (Pavuk et al., 2005) suggest an increase in risk with serum TCDD concentration even in subjects who made up the comparison group, whose TCDD exposure was considerably lower (but not zero) than that of the Ranch Hand cohort. The American and Australian cohort studies of Vietnam veterans (ADVA, 2005a,b,c; Dalager and Kang, 1997), which presumably cover a large proportion of exposed soldiers, showed higher than expected incidence of and mortality from lung cancer. The main limitations of those studies are that there was no assessment of exposure—as there was in, for example, the Ranch Hand study—and that some potential confounding variables, notably smoking, could not be accounted for. The committee believes that it is unlikely that the distribution of smoking differed greatly between the two cohorts of veterans, so confounding by smoking is probably minimal. The studies therefore lend support to the findings of the Ranch Hand study. The methodologically sound AHS did not show any increased risk of lung cancer, but, although there was substantial 2,4-D exposure in this cohort (Blair et al., 2005b), dioxin exposure of the contemporary farmers was probably negligible.
Results of the environmental studies were mostly consistent with no association, although in the cancer-incidence update from Seveso the highest risks occurred in the most exposed.
Also supportive of an association, however, are the numerous lines of mechanistic evidence, discussed in the section on biologic plausibility, which provide further support for the conclusion that the evidence of an association is limited or suggestive.
Conclusion
On the basis of the evidence reviewed here and in previous VAO reports, the committee concludes that there is limited or suggestive evidence of an association between exposure to at least one chemical of interest and carcinomas of the lung, bronchus, and trachea.
ACS estimated that about 1,530 men and 1,120 women would receive diagnoses of bone or joint cancer (ICD-9 170) in the United States in 2010 and that 830 men and 630 women would die from these cancers (Jemal et al., 2010). Primary bone cancers are among the least common malignancies, but the bones are frequent sites of tumors secondary to cancers that have metastasized. Only primary bone cancer is considered here. The average annual incidence of bone and joint cancer is shown in Table 7-14.
Bone cancer is more common in teenagers than in adults. It is rare among people in the age groups of most Vietnam veterans (50–64 years). Among the risk factors for bone or joint cancer in adults are exposure to ionizing radiation in treatment for other cancers and a history of some noncancer bone diseases, including Paget disease.
Conclusions from VAO and Previous Updates
The committee responsible for VAO concluded that there was inadequate or insufficient information to determine whether there is an association between exposure to the chemicals of interest and bone and joint cancer. Additional information available to the committees responsible for Update 1996, Update 1998, Update 2000, Update 2002, Update 2004, Update 2006, and Update 2008 did not change that conclusion. Table 7-15 summarizes the results of the relevant studies.
TABLE 7-14 Average Annual Incidence (per 100,000) of Bone and Joint Cancer in United Statesa
| 55-59 Years Old | 60-64 Years Old | 65-69 Years Old | |||||||
| All Races | While | Black | All Races | While | Black | All Races | While | Black | |
| Men | 1.1 | 1.3 | 0.3 | 1.1 | 1.0 | 17.8 | 1.2 | 1.6 | 2.9 |
| Women | 0.8 | 0.9 | 0.6 | 1.6 | 1.7 | 2.2 | 0.9 | 16.3 | 0.4 |
aSurveillance, Epidemiology, and End Results program, nine standard registries, crude age-specific rates, 2004–2008 (NCI, 2010).
TABLE 7-15 Selected Epidemiologic Studies—Bone and Joint Cancer
| Reference | Study Populationa | Exposed Casesb |
Exposure of Interest/ Estimated Risk (95% CI)b |
| VIETNAM VETERANS | |||
| US Air Force Health Study—Ranch Hand veterans vs SEA veterans | All COIs | ||
| Air Force Ranch Hand veterans | 0 | nr | |
| US VA Mortality Study of Army and Marine Veterans (ground troops serving July 4.1965-March 1,1973) | All COIs | ||
| Army Vietnam veterans | 27 | 0.8 (0.4-1.7) | |
| Marine Vietnam veterans | 11 | 1.4 (0.1-21.5) | |
| State Studies of Vietnam Veterans | All COIs | ||
| Massachusetts Vietnam veterans | 4 | 0.9 (0.1-11.3) | |
| Wisconsin Vietnam veterans | 1 | nr | |
| New York Vietnam veterans | 8 | 1.0 (0.3-3.0) | |
| OCCUPATIONAL | |||
| IARC Phenoxy Herbicide Cohort (mortality vs national mortality rates) | Dioxin. phenoxy herbicides | ||
| IARC cohort, male and female workers exposed to any phenoxy herbicide or chlorophenol |
5 | 1.2 (0.4-2.8) | |
| Exposed to highly chlorinated PCDDs | 3 | 1.1 (0.2-3.1) | |
| Not exposed to highly chlorinated PCDDs | 2 | 1.4 (0.2-5.2) | |
| NIOSH Mortality Cohort (12 US plants, production 1942-1984)(included in IARC cohort) | Dioxin, phenoxy herbicides | ||
| NIOSH—entire cohort | 2 | 2.3 (0.3-8.2) | |
| ≥1-yr exposure, ≥ 20-yr latency | 1 | 5.5 (0.1-29.0) | |
| Dow Production Workers—Midland. MI (included in IARC and NTOSH cohorts) | Dioxin, phenoxy herbicides | ||
| Dow pentachlorophenol production workers | 0 | nr | |
| 0-yr latency | 0 | nr | |
| 15-yr latency | 0 | nr | |
| Dow 2,4-D production workers | 0 | nr (0.0-31.1) | |
| BASF Production Workers (included in IARC cohort) | Dioxin, phenoxy herbicides | ||
| Zober et al., | BASF employees—basic cohort | 90% CI | |
| 1990 | 0 | 0 (0.0-65.5) | |
| Monsanto Production Workers (included in IARC cohort) | Dioxin, phenoxy herbicides | ||
| Monsanto Company workers | 2 | 5.0 (0.6-18.1) | |
| New Zealand Production Workers—Dow plant in Plymouth.NZ (included in IARC cohort) | Dioxin, phenoxy herbicides | ||
| 1,599 production workers (male and female) vs national rates—mortality 1969 through 2004 | 0 | 0 (0.0-21.8) | |
| Reference | Study Populationa | Exposed Casesb |
Exposure of Interest/ Estimated Risk (95% CI)b |
| Phenoxy herbicide producers and sprayers (men and women) | 0 | nr | |
| United Kingdom Production Workers (included in IARC cohort) | Dioxin, phenoxy herbicides | ||
| British MCPA production workers | 1 | 0.9 (0.0-5.0) | |
| Studies of Agricultural Workers | Herbicides | ||
| Italian rice growers | 1 | 0.5 (0.0-2.6) | |
| US farmers in 23 states | |||
| White men | 49 | 1.3 (1.0-1.8) | |
| White women | 1 | 1.2 (0.0-6.6) | |
| Danish, Italian farm workers | |||
| Male Danish farmers | 9 | 0.9 (nr) | |
| Female Danish farmers | 0 | nr | |
| Swedish male and female agricultural | 44 | 99% CI | |
| workers—incidence | 1.0 (0.6-1.4) | ||
| Iowa farmers | 56 | 1.1 (nr) | |
| Other Studies of Herbicide and Pesticide Applicators | Herbicides | ||
| Dutch licensed herbicide applicators | 0 | nr | |
| Italian licensed pesticide users | 10 | 0.8 (0.4-1.4) | |
| Forestry Workers | Herbicides | ||
| Hcrtzman et al., 1997 | British Columbia sawmill workers | ||
| Mortality | 5 | 1.3 (0.5-2.7) | |
| Incidence | 4 | 1.1 (0.4-2.4) | |
| Not exposed to highly chlorinated PCDDs | 2 | 1.4 (0.2-5.2) | |
| Rix et al., 1989 | New Zealand forestry workers—nested | 1 | 1.7 (0.2-13.3) |
| case-control—incidence | |||
| Paper and Pulp Workers | Dioxins | ||
| Danish paper-mill workers—incidence | |||
| Men | 1 | 0.5 (0.0-2.7) | |
| Women | 0 | nr | |
| Other Occupational Studies Herbicides |
|||
| Mcrlctti et al., 2006 | Association between occupational exposure and risk of bone sarcoma | 18 | 2.6 (1.5-4.6) |
| ENVIRONMENTAL | |||
| Seveso, Italy Residential Cohort | |||
| Bertaz et al., 1998 | Seveso residents—15-yr follow-up | ||
| Zone B women | 1 | 2.6 (0.3-19.4) | |
| Zone R men | 2 | 0.5 (0.1-2.0) | |
| Zone R women | 7 | 2.4 (1.0-5.7) | |
| Reference | Study Populationa | Exposed Casesb |
Exposure of Interest/ Estimated Risk (95% CI)b |
| Seveso residents—15-yr follow-up | |||
| Zone B women | 1 | 2.6 (0.0-14.4) | |
| Zone R men | 2 | 0.5 (0.1-1.7) | |
| Zone R women | 7 | 2.4 (1.0-4.9) | |
| Chapaevsk, Russia | |||
| Residents of Chapaevsk, Russia | |||
| Mortality standardized to Samara region(bone.soft-tissue cancer) | |||
| Men | 7 | 2.1 (0.9-4.4) | |
| Women | 7 | 1.4 (0.6-3.0) | |
ABBREVIATIONS: 2,4-D, 2,4-dichlorophenoxyacetic acid; CI, confidence interval; COI, chemical of interest; IARC, International Agency for Research on Cancer; MCPA, methyl-4-chlorophenoxyacetic acid; MI, Michigan; NIOSH, National Institute for Occupational Safety and Health; nr, not reported; NZ, New Zealand; PCDD, polychlorinated dibenzo-p-dioxin (highly chlorinated, if four or more chlorines); SEA, Southeast Asia; VA, US Department of Veterans Affairs.
aSubjects are male, and outcome is mortality unless otherwise noted.
bGiven when available; results other than estimated risk explained individually.
Update of the Epidemiologic Literature
Vietnam-Veteran and Occupational Studies
No Vietnam-veteran studies or occupational studies concerning exposure to the chemicals of interest and bone and joint cancer have been published since Update 2008.
Environmental Studies
McBride et al. (2009a,b) examined mortality in an occupational cohort of TCP workers employed in a Dow Agrosciences site in New Zealand during the period 1969–1988. This set of the IARC occupational cohort (see Chapter 5) includes 1,599 workers. No bone-cancer deaths were identified in the study. The results in McBride et al. (2009b) have not been included, because they were diluted by inclusion of a set of workers who had no opportunity for TCDD exposure and no observed deaths.
Biologic Plausibility
No animal studies have reported an increased incidence of bone and joint cancers after exposure to the chemicals of interest. The biologic plausibility of
the carcinogenicity of the chemicals of interest is discussed in general at the beginning of this chapter.
Synthesis
The new study of Dow production workers in New Zealand found no cases of bone and joint cancer, and the previous body of results summarized in Table 7-15 does not indicate an association between exposure to the chemicals of interest and bone cancer.
Conclusion
On the basis of the evidence reviewed here and in previous VAO reports, the committee concludes that there is inadequate or insufficient evidence to determine whether there is an association between exposure to the chemicals of interest and bone and joint cancers.
Soft-tissue sarcoma (STS) (ICD-9 164.1, 171) arises in soft somatic tissues in and between organs. Three of the most common types of STS—liposarcoma, fibrosarcoma, and rhabdomyosarcoma—occur in similar numbers in men and women. Because of the diverse characteristics of STS, accurate diagnosis and classification can be difficult. ACS estimated that about 5,680 men and 4,840 women would receive diagnoses of STS in the United States in 2010 and that about 2,020 men and 1,900 women would die from it (Jemal et al., 2010). The average annual incidence of STS is shown in Table 7-16.
Among the risk factors for STS are exposure to ionizing radiation during treatment for other cancers and some inherited conditions, including Gardner syndrome, Li-Fraumeni syndrome, and neurofibromatosis. Several chemical exposures have been identified as possible risk factors (Zahm and Fraumeni, 1997).
TABLE 7-16 Average Annual Incidence (per 100,000) of Soft-Tissue Sarcoma (Including Malignant Neoplasms of the Heart) in United Statesa
| 55-59 Years Old | 60-64 Years Old | 65-69 Years Old | |||||||||
| All Races | While | Black | All Races | While | Black | All Races | While | Black | |||
| Men | 5.3 | 5.4 | 5.2 | 6.7 | 7.1 | 5.2 | 8.6 | 8.9 | 6.4 | ||
| Women | 4.5 | 4.4 | 6.2 | 5.3 | 5.2 | 7.3 | 6.7 | 6.9 | 4.0 | ||
aSurveillance, Epidemiology, and End Results program, nine standard registries, crude age-specific rates, 2004–2008 (NCI, 2010).
Conclusions from VAO and Previous Updates
The committee responsible for VAO judged that the strong findings in the IARC and NIOSH cohorts and the extensive Scandinavian case–control studies, complemented by consistency in preliminary reports on the Seveso population and one statistically significant finding in a state study of Vietnam veterans, constituted sufficient information to determine that there is an association between exposure to at least one of the chemicals of interest and STS. Additional information available to the committees responsible for Update 1996, Update 1998, Update 2000, Update 2002, Update 2004, and Update 2006 did not change that conclusion. A case–control study conducted in Italy (Zambon et al., 2007) and an update on Danish gardeners (Hansen et al., 1992) considered in Update 2008 reinforced the evidence of an association, but the TCDD-exposed Seveso population has shown no evidence of an association (Consonni et al., 2008). Table 7-17 summarizes the relevant studies.
Update of the Epidemiologic Literature
Vietnam-Veteran Studies
No Vietnam-veteran studies concerning exposure to the chemicals of interest and STS have been published since Update 2008.
Occupational Studies
Collins et al. (2009a,b) reported on the mortality experience of the occupational cohort in the Midland, Michigan, Dow Chemical plant previously included in analyses of the NIOSH Mortality Cohort, as reported by Fingerhut et al. (1991) and added to the expanded IARC Cohort of Phenoxy Herbicide Workers (Kogevinas et al., 1997). TCP was produced at the plant from 1942 to 1979, and PCP was produced from 1937 to 1980. Job histories of the workers were used to determine duration of time spent in the TCP or PCP units. Mortality in the workers and SMRs were calculated by using the US population as the referent. In the PCP analysis (Collins et al., 2009b), one death from STS of a worker who was exposed to both PCP and TCP was identified, for a PCP SMR for STS of 2.2 (95% CI 0.0–12.1). In a separate analysis of the 1,615 TCP workers (Collins et al., 2009a), four deaths from STS were identified, for a TCP SMR of 4.1 (95% CI 1.1–10.5). One of the deaths occurred in a worker who was exposed to both TCP and PCP; when this death was removed from the analysis, the SMR was reduced to 3.5 (95% CI 0.7–10.2). As pointed out in follow-up correspondence (Collins et al., 2010; Villeneuve and Steenland, 2010) and discussed in detail in Chapter 5, different latency models, different dose–response models, and in-depth analysis of the serum concentrations could alter some of the results reported in
TABLE 7-17 Selected Epidemiologic Studies—Soft-Tissue Sarcoma
| Reference | Study Populationa | Exposed Casesb |
Exposure of Interest/ Estimated Risk (95% CI)b |
| VIETNAM VETERANS | |||
| US Air Force Health Study | All COIs | ||
| AFHS veterans | 1 | 0.8 (0.1-12.8) | |
| Ranch Hand veterans | 0 | nr | |
| Ranch Hand veterans | 1 | nr | |
| Comparisons | 1 | nr | |
| US VA Marine Post-service Mortality Study (all Marines active 1967-1969) | All COIs | ||
| Watanabe and Rang, 1995 | US Marines in Vietnam | 0 | nr |
| US VA Mortality Study of Army and Marine Veterans (ground troops serving July 4, 1965-March 1, 1973) | All COIs | ||
| Army Vietnam veterans | 43 | 1.1 | |
| Marine Vietnam veterans | 11 | 0.7 | |
| Army 1 Corps Vietnam veterans | 10 | 0.9 (0.4-1.6) | |
| Army Vietnam veterans | 30 | 1.0 (0.8-1.2) | |
| Marine Vietnam veterans | 8 | 0.7 (0.4-1.3) | |
| US Vietnam veterans | |||
| Army | 30 | 1.0 (nr) | |
| Marines | 8 | 0.7 (nr) | |
| Australian Vietnam Veterans vs Australian General Population | All COIs | ||
| Australian Vietnam veterans vs Australian population—incidence | 35 | (0.7-1.3) | |
| Navy | 6 | 0.8 (0.3-1.7) | |
| Army | 29 | 1.2 (0.8-1.6) | |
| Air Force | 0 | 0.0 (0.0-1.1) | |
| Australian Vietnam veterans vs Australian population—mortality | 12 | 0.8 (0.4-1.3) | |
| Navy | 3 | 0.9 (0.2-2.4) | |
| Army | 9 | 0.8 (0.4-1.5) | |
| Air Force | 0 | 0.0 (0.0-2.3) | |
| Male Australian Vietnam veterans—incidence (validation study) | Expected number of exposed cases (95% CI) | ||
| 14 | 27 (17-37) | ||
| Male Australian Vietnam veterans—self-reported incidence | 398 | 27 (17-37) | |
| Female Australian Vietnam veterans—self-reported incidence | 2 | 0 (0-4) | |
| Australian military Vietnam veterans | 9 | 1.0 (0.4-1.8) | |
| Reference | Study Populationa | Exposed Casesb |
Exposure of Interest/ Estimated Risk (95% CI)b |
| Australian Conscripted Army National Service (deployed vs nondeployed) | All COIs | ||
| Australian men conscripted Army National Service Vietnam era veterans—deployed vs nondeployed | |||
| Incidence | 10 | 1.0 (0.4-2.4) | |
| Mortality | 3 | 0.5 (0.1-2.0) | |
| Australian National Service Vietnam veterans | 2 | 0.7 (0.6-4.5) | |
| Feit et al., 1987 | Australian Vietnam veterans | 1 | 1.3 (0.1-20.0) |
| VA Case-control Studies | All COIs | ||
| Vietnam veterans vs Vietnam-era veterans | 86 | 0.8 (0.6-1.1) | |
| Vietnam Veterans of Massachusetts | All COIs | ||
| Massachusetts Vietnam veterans | 18 | 1.6 (0.5-5.4) | |
| Massachusetts Vietnam veterans | 9 | 5.2 (2.4-11.1) | |
| State Studies of US Vietnam Veterans | All COIs | ||
| PM study of deaths (1974-1989) of Michigan Vietnam-era veterans—deployed vs nondeployed |
8 | 1.1 (0.5-2.2) | |
| Wisconsin Vietnam veterans | 4 | nr | |
| New York State Vietnam veterans | 2 | 1.1 (0.2-6.7) | |
| New York State Vietnam veterans | 10 | 0.5 (0.2-1.3) | |
| OCCUPATIONAL | |||
| IARC Phenoxy :Herbicide Cohort (mortality vs national mortality | Dioxin, phenoxy herbicides | ||
| IARC cohort, male and female workers exposed to any phenoxy herbicide or chlorophenol |
9 | 2.0 (0.9-3.8) | |
| Exposed to highly chlorinated PCDDs | 6 | 2.0 (0.8-4.4) | |
| Not exposed to highly chlorinated PCDDs | 2 | 1.4 (0.2-4.9) | |
| IARC cohort (men and women)—incidence | 11 | nr | |
| 10-19 years since first exposure IARC cohort (men and women) | 4 | 6.1 (1.7-15.5) | |
| IARC cohort—exposed subcohort (men and women) | 4 | 2.0 (0.6-5.2) | |
| NIOSH Mortality Cohort (12 US plants, production 1942-19841 (included in IARC cohort) | Dioxin, phenoxy herbicides | ||
| US chemical production workers | 0 | nr | |
| Reference | Study Populationa | Exposed Casesb |
Exposure of Interest/ Estimated Risk (95% CI)b |
| Fringerhut et al., 1991 | NIOSH cohort—enure cohort | 4 | 3.4 (0.9-8.7) |
| ≥ l-yr exposure, ≥ 20-yr latency | 3 | 9.2 (1.9-27.0) | |
| BASF Production Workers (included in IARC cohort) | Dioxin, phenoxy herbicides | ||
| BASF; employees—incidence | 0 | Expected number of exposed cases 0.2 | |
| BASF employees—basic cohort | 0 | nr | |
| Dow Production Workers—Midland. MI (included in IARC and MOSH cohorts) | Dioxin, phenoxy herbicides | ||
| Trichlorophenol workers | 4 | 4.1 (1.1-10.5) | |
| Pentachlorophenol workers | 1 | 2.2 (0.0-12.1) | |
| Dow chemical production workers | 2 | 2.4 (0.3-8.6) | |
| Dow pentachlorophenol production workers | 0 | Expected number of exposed cases 0.2 | |
| Dow 2,4-D production workers | 0 | nr | |
| Danish Production Workers (included in IARC cohort) | Dioxin, phenoxy herbicides | ||
| Danish production workers—updated incidence for men, women | 5 | 2.0 (0.7-4.8) | |
| Danish production workers—incidence | |||
| Men | 5 | 2.7 (0.9-6.3) | |
| Women | 0 | nr | |
| Dutch Production Workers (included in IARC cohort) | Dioxin, phenoxy herbicides | ||
| Dutch chemical production workers | 0 | nr | |
| Dutch phenosy herbicide workers | 0 | 0.0 (0.0-23.1) | |
| German Production Workers (included in IARC cohort) | Dioxin, phenoxy herbicides | ||
| German production workers—men, women | 0 | nr | |
| United Kingdom Production Workers (included in IARC cohort) | Dioxin, phenoxy herbicides | ||
| Coygon et al., 1986 | British MCPA chemical workers | 1 | 1.1 (0.03-5.9) |
| Reference | Study Populationa | Exposed Casesb |
Exposure of Interest/ Estimated Risk (95% CI)b |
| New Zealand Production Workers—Dow plant in Plymouth, NZ (included in IARC cohort) | Dioxin, phenoxy herbicides | ||
| 1,599 production workers (male and female) vs national rates—mortality 1969 through 2004 |
|||
| Ever exposed workers | 1 | 3.4 (0.1-19.5) | |
| Phenoxy herbicide producers (men and women) | 0 | 0.0 (0.0-19.3) | |
| Phenoxy herbicide sprayers ( > 99% men) | 1 | 4.3 (0.1-23.8) | |
| Agricultural Health Study | Herbicides | ||
| US AHS—incidence | |||
| Private applicators (men and women) | 10 | 0.7 (0.3-1.2) | |
| Spouses of private applicators ( > 99%'women) | 3 | 0.5 (0.1-1.4) | |
| Commercial applicators (men and women) | nr | 0.0 (0.0-3.8) | |
| US AHS | |||
| Private applicators (men and women) | 4 | 0.7 (0.2-1.8) | |
| Spouses of private applicators ( > 99%women) | 3 | 1.4 (0.3-4.1) | |
| Other Agricultural Workers | Herbicides | ||
| Danish gardeners (ICD-7 197)—incidence | |||
| 10-yr follow-up (1975-1984) reported in |
3 | 5.3 (1.1-15.4) | |
| 25-yr follow-up (1975-2001) | |||
| Born before 1915 (high exposure) | 3 | 5.9 (1.9-18.2) | |
| Born 1915-1934 (medium exposure) | 0 | 0.0 (0.0-3.8) | |
| Born after 1934 (low exposure) | 1 | 1.8 (0.3-12.9) | |
| US farmers in 23 states 1993 | 9S | 0.9 (0.8-1.1) | |
| Danish gardeners—incidence | 3 | 5.3 (1.1-15.4) | |
| Swedish agricultural workers (men and | 99% CI | ||
| women) | 7 | 0.9 (0.4-1.9) | |
| Kansas residents—incidence | |||
| All farmers | 95 | 1.0 (0.7-1.6) | |
| Farm use of herbicides | 22 | 0.9 (0.5-1.6) | |
| Italian rice growers | |||
| Among all living females | 5 | 2.4 (0.4-16.1) | |
| Agricultural workers in England | |||
| Overall | 42 | 1.7 (1.0-2.9) | |
| Under 75 yrs of age | 33 | 1.4 (0.8-2.6) | |
| New Zealand Pesticide Workers | Herbicides | ||
| Smith and |
Reanalysis of New Zealand workers | 90% CI | |
| 133 | 1.1 (0.7-1.8) | ||
| Update of New Zealand workers | 90% CI | ||
| 17 | 1.6 (0.7-3.8) | ||
| Reference | Study Populationa | Exposed Casesb |
Exposure of Interest/ Estimated Risk (95% CI)b |
| New Zealand workers exposed to herbicides | 90% CI | ||
| 17 | 1.6 (0.8-3.2) | ||
| Other Studies of Herbicide and Pesticide Applicators | Herbicides | ||
| Italian licensed pesticide users | 2 | 1.0 (0.1-3.5) | |
| Florida pesticide applicators | 0 | nr | |
| Forestry Workers | Herbicides | ||
| Canadian sawmill workers | 11 | 1.0 (0.6-1.7) | |
| USDA forest and soil conservationists | 2 | 1.0 (0.1-3.6) | |
| New Zealand forestry workers—nested case-control—incidence | 4 | 3.2 (1.2-9.0) | |
| Paper and Pulp Workers | Dioxins | ||
| IARC cohort of pulp and paper workers Exposure to nonvolatile organochlorine compounds |
|||
| Never | 8 | 1.2 (0.5-2.4) | |
| Ever | 4 | 0.8 (0.2-2.0) | |
| Danish paper-mill workers—incidence | |||
| Women employed in sorting and packing | 8 | 4.0 (1.7-7.8) | |
| Men employed in sorting and packing | 12 | 1.2 (0.6-2.0) | |
| Other Occupational Studies | Herbicides | ||
| Mack. 1995 | US cancer registry data (SEER program) review | ||
| Men | 3.526 | nr | |
| Women | 2,886 | nr | |
| Australia residents | 30 | 1.0 (0.3-3.1) | |
| Washington state residents—incidence | |||
| High phenoxy exposure | nr | 0.9 (0.4-1.9) | |
| Self-reported chloracne | nr | 3.3 (0.8-14.0) | |
| Swedish residents | |||
| Exposed to phenoxy acids | 13 | 5.5 (2.2-13.8) | |
| Exposed to chlorophenols | 6 | 5.4 (1.3-22.5) | |
| Swedish workers | (2.5-10.4) | ||
| 25 | 5:1 matched | ||
| Reference | Study Populationa | Exposed Casesb |
Exposure of Interest/ Estimated Risk (95% CI)b |
| ENVIRONMENTAL | |||
| Seveso, Italy Residential Population | Dioxin | ||
| Seveso residents—25-yr follow-up—men. | |||
| women | |||
| Zone A | 0 | nr | |
| Zone B | 0 | nr | |
| Zone R | 4 | 0.8 (0.3-2.1) | |
| Seveso—20-yr follow-up to 1996—incidence | |||
| Zone A | 0 | nr | |
| Zone B | 0 | nr | |
| Zone R | 9 | 1.3 (0.6-2.7) | |
| Bcrtazzi et al.,2001 | Seveso—20-yr follow-up (men and women) | 0 | nr |
| Bcrtazzi et al., | Seveso—15-yr follow-up (men and women) | ||
| 1998 | Zone R men | 4 | 2.1 (0.7-6.5) |
| Seveso residents—15-yr follow-up (men and women) | |||
| Zone R men | 4 | 2.1 (0.6-5.4) | |
| Bcrtazzi et al.,1993 | Seveso residents—10-yr follow-up—morbidity | ||
| Zone R men | 6 | 2.8 (1.0-7.3) | |
| Zone R women | 2 | 1.6 (0.3-7.4) | |
| Bcrtazzi et al., 1989a | Seveso residents—10-yr follow-up | ||
| Zone A, B, R men | 2 | 5.4 (0.8-38.6) | |
| Zone A, B, R women | 1 | 2.0 (0.2-1.9) | |
| Bcrtazzi et al., 1989b | Seveso residents—10-yr follow-up | ||
| Zone R men | 2 | 6.3 (0.9-45.0) | |
| Zone B women | 1 | 17.0 (1.8-163.6) | |
| Other Environmental Studies | 2,4,5-T | ||
| Residents of New Plymouth Territorial Authority, New Zealand near plant manufacturing 2,4,5-T in 1962-1987 |
|||
| Incidence | 56 | 1.0 (0.8-1.4) |
|
| 1970-1974 | 7 | 1.0 (0.4-2.1) | |
| 1975-1979 | 3 | 0.4 (0.1-2.1) | |
| 1980-1984 | 10 | 1.3 (0.6-2.4) | |
| 1985-1989 | 11 | 1.2 (0.6-2.2) | |
| 1990-1994 | 9 | 0.9 (0.4-1.7) | |
| 1995-1999 | 14 | 1.3 (0.7-2.2) | |
| 2000-2001 | 2 | 0.8 (0.1-3.0) | |
| Mortality | 27 | l.2 (0.8-I.8) |
|
| 1970-1974 | 5 | 1.8 (0.6-4.3) | |
| 1975-1979 | 1 | 0.4 (0.0-2.0) | |
| 1980-1984 | 4 | 1.1 (0.3-2.9) | |
| 1985-1989 | 5 | 1.5 (0.5-3.6) | |
| 1990-1994 | 5 | 1.3 (0.4-3.0) | |
| 1995-1999 | 5 | 1.3 (0.4-3.0) | |
| 2000-2001 | 2 | 0.9 (0.1-3.1) | |
| Reference | Study Populationa | Exposed Casesb |
Exposure of Interest/ Estimated Risk (95% CI)b |
| Population-based Veneto Tumour Registry, Italy, average exposure based on duration and distance of residence from 33 industrial sources—incidence |
Dioxin | ||
| Sarcoma (ICD-9 158, 171, 173, visceral sites) | |||
| Men | |||
| < 4 TCDD (fg/m3) | 31 | 1.0 | |
| 4-6 | 39 | 1.1 (0.6-2.0) | |
| ≥ 6 | 17 | 1.9 (0.9-4.0) p-trend = 0.15 |
|
| Women | |||
| < 4 TCDD (fg/m3) | 24 | 1.0 | |
| 4-6 | 44 | 1.5 (0.8-2.7) | |
| ≥ 6 | 17 | 2.4 (1.0-5.6) p-trend = 0.04 |
|
| Men, women combined | |||
| Connective, other soft tissue (ICD-9 171) | |||
| < 4 TCDD (fg/m3) | 25 | 1.0 | |
| 4-6 | 39 | 1.4 (0.7-2.5) | |
| ≥ 6 | 17 | 3.3 (1.4-7.9) p-trend = 0.01 |
|
| Skin (ICD-9 173) | |||
| < 4 TCDD (fg/m3) | 5 | 1.0 | |
| 4-6 | 10 | 0.0 (0.3-4.7) |
|
| ≥ 6 | 2 | 0.3 (0.0-3.4) p-trend = 0.48 |
|
| Retroperitoneum, peritoneum (ICD-9 158) | |||
| < 4 TCDD (fg/m3) | 6 | 1.0 | |
| 4-6 | 12 | 1.1 (0.3-3.4) | |
| ≥ 6 | 3 | 0.8 (0.1-4.5) p-trend = 0.86 |
|
| Visceral sites | |||
| < 4 TCDD (fg/m3) | 19 | 1.0 | |
| 4-6 | 1.2 (0.6-2.6) | ||
| ≥ 6 | 12 | 2.5 (1.0-6.3) p-trend = 0.08 |
|
| Canadian residents | Phenoxyherbicides | ||
| Any phenoxyherbictde | 46 | 1.1 (0.7-1.5) | |
| 2,4-D | 4 | 1.0 (0.6-1.5) | |
| Mecoprop | 12 | 1.0 (0.5-1.9) | |
| MCPA | 12 | 1.1 (0.5-2.2) | |
| Residents near industrial-waste incinerator in | Dioxin | ||
| Mantua, Italy—incidence | |||
| Residence within 2 km of incinerator | 5 | 31.4 (5.6-176.1) | |
| Reference | Study Populationa | Exposed Casesb |
Exposure of Interest/ Estimated Risk (95% CI)b |
| Finnish STS patients vs controls within quintiles based on TEQ in subcutaneous fat—incidence |
110 | Dioxin | |
| Quintile 1 (median,∼12 ng/kg TEQ) | nr | 1.0 | |
| Quintile 2 (median, ∼20 ng/kg TEQ) | nr | 0.4 (0.2-1.1) | |
| Quintile 3 (median, ∼28 ng/kg TEQ) | nr | 0.6 (0.2-1.7) | |
| Quintile 4 (median, ∼40 ng/kg TEQ) | nr | 0.5 (0.2-1.3) | |
| Quintile 5 (median, ∼62 ng/kg TEQ) | nr | 0.7 (0.2-2.0) | |
| Residents near chemical plant in Mantua, | 20 | TCDD emissions | |
| Italy—incidence | 2.3 (1.3-3.5) | ||
| Residents near French solid-waste incinerator—incidence |
Dioxin | ||
| Spatial cluster | 45 | 1.4 (p = 0.004) | |
| 1994-1995 | 12 | 3.4 (p = 0.008) | |
| Italian rice growers and chloniphenols |
Chlophenoxy acids and chlorophenols | ||
| Swedish fishermen—incidence (men and women) | Organochlorine compounds and chlorophenol | ||
| West coast | 3 | 0.5 (0.1-1.4) | |
| Finnish community exposed to chlorophenol contamination (men and women) |
6 | 1.6 (0.7-3.5) | |
ABBREVIATIONS: 2,4-D, 2,4-dichlorophenoxyacetic acid; 2,4,5-T, 2,4,5-trichlorophenoxyacetic acid; AFHS, Air Force Health Study; AHS, Agricultural Health Study; CI, confidence interval; COI, chemical of interest; IARC, International Agency for Research on Cancer; ICD, International Classification of Diseases; MCPA, methyl-4-chlorophenoxyacetic acid; MI, Michigan; NIOSH, National Institute for Occupational Safety and Health; nr, not reported; NZ, New Zealand; PCDD, polychlorinated dibenzo-p-dioxin (highly chlorinated, if four or more chlorines); PM, proportionate mortality; SEER, Surveillance, Epidemiology, and End Results; STS, soft-tissue sarcoma; TCDD, 2,3,7,8-tetrachlorodibenzo-p-dioxin; TEQ, toxicity equivalent; USDA, US Department of Agriculture; VA, US Department of Veterans Affairs.
aSubjects are male, and outcome is mortality unless otherwise noted.
bGiven when available; results other than estimated risk explained individually.
cCommittee computed total SMR and standard incidence ratio by dividing sum of observed values by sum of expected values over all years; 95% CIs on these total ratios were computed with exact methods.
dThere appears to be an error in this entry because lower 95% CL (0.3) is not smaller than odds ratio (0.0).
the analysis; given the small number of deaths from STS, however, those methodologic considerations are unlikely to alter the conclusions regarding STS.
McBride et al. (2009a,b) evaluated mortality from cancers in an occupational cohort of TCP workers in New Zealand, a set of the IARC cohort (see Chapter 5). Workers were employed at the plant from 1969 to 1988, and SMRs were calculated by using the New Zealand population as the comparison group. Exposure was classified as ever exposed or never exposed to TCDD. One case of STS was identified in the ever-exposed group and none in the never-exposed group. When compared with the expected number of deaths in the New Zealand population, an increased association was observed, with an SMR of 3.4 (95% CI 0.1–19.5) for the ever-exposed workers. Results in McBride et al. (2009b) have not been included, because they were diluted by inclusion of a set of workers who had no opportunity for TCDD exposure and no observed deaths.
Environmental Studies
Cancer incidence was re-evaluated in the Seveso cohort for the period 1977– 1996 (Pesatori et al., 2009). The Seveso cohort, described in Chapter 5, includes all residents of Seveso at the time of the accident and those who migrated into or were born in the area in the 10-year period after the accident. A total of 218,761 residents are included in the analysis: 723 residents in the high-exposure zone (Zone A); 4,821 in the medium-exposure zone (Zone B); 31,643 in the low- exposure zone (Zone R); and the remainder who lived outside the zone of exposure. A total of nine STS cases were identified; all nine were in Zone R. Compared with the incidence in the reference zone, STS incidence in Zone R was higher, with an RR of 1.32 (95% CI 0.64–2.73).
Biologic Plausibility
In a 2-year study, dermal application of TCDD to Swiss-Webster mice led to an increase in fibrosarcomas in females but not in males (NTP, 1982b). There is some concern that the increase in fibrosarcomas may be associated with the treatment protocol rather than with TCDD. The NTP gavage study (NTP, 1982a) also found increased incidences of fibrosarcomas in male and female rats and in female mice.
The biologic plausibility of the carcinogenicity of the chemicals of interest is discussed in general at the beginning of this chapter.
Synthesis
Previous committees have concluded that the occupational, environmental, and Vietnam-veteran studies showed sufficient evidence to link herbicide exposure to STS. Although confidence intervals in the new studies were broad because
of the small samples, that conclusion is consistent with the findings of McBride et al. (2009a), Collins et al. (2009a,b), and Pesatori et al. (2009).
Conclusion
On the basis of the evidence reviewed here and in previous VAO reports, the committee concludes that there is sufficient evidence of an association between exposure to at least one of the chemicals of interest and STS.
Skin cancers are generally divided into two broad categories: neoplasms that develop from melanocytes (malignant melanoma, or simply melanoma) and neoplasms that do not. Nonmelanoma skin cancers (primarily basal-cell and squamous-cell carcinomas) have a far higher incidence than melanoma but are considerably less aggressive and therefore more treatable. The average annual incidence of melanoma is shown in Table 7-18. The committee responsible for Update 1998 first chose to address melanoma studies separately from those of nonmelanoma skin cancer. Some researchers report results by combining all types of skin cancer without specifying type. The present committee believes that combined information is not interpretable (although there is a supposition that mortality figures refer predominantly to melanoma and that sizable incidence figures refer to nonmelanoma skin cancer); therefore, it is interpreting data only when results specify melanoma or nonmelanoma skin cancer.
ACS estimated that about 38,870 men and 29,260 women would receive diagnoses of cutaneous melanoma (ICD-9 172) in the United States in 2008 and that about 5,670 men and 3,030 women would die from it (Jemal et al., 2010). More than a million cases of nonmelanoma skin cancer (ICD-9 173), primarily basal-cell and squamous-cell carcinomas, are diagnosed in the United States each year (ACS, 2006); it is not required to report them to registries, so the numbers of cases are not as precise as those of other cancers. ACS reports that although
TABLE 7-18 Average Annual Incidence (per 100,000) of Skin Cancers (Excluding Basal-Cell and Squamous-Cell Cancers) in United Statesa
| 55-59 Years Old | 60-64 Years Old | 65-69 Years Old | |||||||
| All Races | While | Black | All Races | While | Black | All Races | While | Black | |
| Melanomas of the Skin: | |||||||||
| Men | 49.0 | 58.8 | 1.8 | 68.7 | 81.4 | 2.0 | 86.7 | 103.0 | 5.2 |
| Women | 30.2 | 37.2 | 1.5 | 35.5 | 43.0 | 1.6 | 39.2 | 47.2 | 2.2 |
aSurveillance, Epidemiology, and End Results program, nine standard registries, crude age-specific rates, 2004–2008. SEER incidence data not available for nonmelanocytic skin cancer (NCI, 2010).
melanoma accounts for less than 5% of skin-cancer cases, it is responsible for about 73% of skin-cancer deaths (ACS, 2011a). It estimates that 2,000 people die each year from nonmelanoma skin cancer (ACS, 2011b).
Melanoma occurs more frequently in fair-skinned people than in dark-skinned people; the risk in whites is roughly 20 times that in dark-skinned blacks. The incidence increases with age, more strikingly in males than in females. Other risk factors include the presence of particular kinds of moles on the skin, suppression of the immune system, and excessive exposure to UV radiation, typically from the sun. A family history of the disease has been identified as a risk factor, but it is unclear whether that is attributable to genetic factors or to similarities in skin type and sun-exposure patterns.
Excessive exposure to UV radiation is the most important risk factor for nonmelanoma skin cancer; some skin diseases and chemical exposures have also been identified as potential risk factors. Exposure to inorganic arsenic is a risk factor for skin cancer; this does not imply that exposure to cacodylic acid, which is a metabolite of inorganic arsenic, can be assumed to be a risk factor.
Conclusions from VAO and Previous Updates
The committee responsible for VAO concluded that there was inadequate or insufficient information to determine whether there is an association between exposure to the chemicals of interest and skin cancer. Additional information available to the committee responsible for Update 1996 did not change that conclusion. The committee responsible for Update 1998 considered the literature on melanoma separately from that of nonmelanoma skin cancer and found that there was inadequate or insufficient information to determine whether there is an association between the chemicals of interest and melanoma. The committees responsible for Update 2000, Update 2002, and Update 2004 concurred with the findings of Update 1998. The committee responsible for Update 2006 was unable to reach a consensus as to whether there was limited or suggestive evidence of an association between exposure to the chemicals of interest and melanoma or inadequate or insufficient evidence to determine whether there is an association, so melanoma was left in the lower category. The committee for Update 2008 determined that evidence of an association between exposure to the chemicals of interest and melanoma remained inadequate or insufficient to determine whether an association exists. Table 7-19 summarizes the relevant melanoma studies.
Update of the Epidemiologic Literature
Vietnam-Veteran Studies
Cypel and Kang (2010) analyzed the mortality of ACC veterans who used herbicides in Vietnam (see Chapter 5). All-causes mortality and cause-specific
TABLE 7-19 Selected Epidemiologic Studies—Melanoma
| Reference | Study Populationa | Exposed Casesb |
Exposure of Interest/ Estimated Risk (95% CI)b |
| VIETNAM VETERANS US Air Force Health Study—Ranch Hand veterans vs SEA veterans |
All COIs | ||
| White Air Force comparison subjects only—incidence Serum TCDD (pg/g), based on model with expousure variable loge(TCDD) |
|||
| Per unit increase of -loge(TCDD) Quartiles (pg/g) |
25 | 2.7 (1.1-6.3) | |
| 0.4-2.6 | 3 | 1.0 | |
| 2.6-3.8 | 5 | 2.1 (0.4-11.0) | |
| 3.8-5.2 | 8 | 3.2 (0.7-15.5) | |
| > 5.2 | 9 | 3.6 (0.7-17.2) | |
| Number years served SEA | |||
| Per year of service | 25 | 1.1 (0.9-1.3) | |
| Quartiles (years in SEA) | |||
| 0.8-1.3 | 3 | 1.0 | |
| 1.3-2.1 | 4 | 1.9 (0.3-10.3) | |
| 2.1-3.7 | 8 | 3.2 (0.7-15.3) | |
| 3.7-16.4 | 10 | 4.1 (0.9-19.7) | |
| AFHS subjects vs national rates | |||
| White AFHS Ranch Hand veterans | |||
| Incidence | 17 | 2.3 (1.4-3.7) | |
| With tours between 1966-1970 | 16 | 2.6 (1.5-4.1) | |
| Mortality | nr | ||
| White AFHS comparison veterans | |||
| Incidence | 15 | 1.5 (0.9-2.4) | |
| With tours between 1966-1970 | 12 | 1.5 (0.8-2.6) | |
| Mortality | nr | ||
| White AFHS subjects—incidence | |||
| Who spent at most 2 yrs in SEA | |||
| Per unit increase of -loge(TCDD) (pg/g) | 14 | 2.2 (1.3-3.9) | |
| Comparison group | 3 | E0 | |
| Ranch Hand—< 10 TCDD pg/g in | 4 | 3.0 (0.5-16.8) | |
| Ranch Hand—< 118.5 TCDD pg/g at | 4 | 7.4 (1.3-41.0) | |
| end of service | |||
| Ranch Hand— > 118.5 TCDD pg/g at | 3 | 7.5 (1.1-50.2) | |
| end of service | |||
| Only Ranch Hands with 100% service in | |||
| Vietnam, comparisons with 0% service in | |||
| Vietnam | |||
| Per unit increase of -loge(TCDD) in pg/g | 14 | 1.7 (1.0-2.8) | |
| Comparison group | 2 | E0 | |
| Ranch Hand— < 10 TCDD pg/g in 1987 | 5 | 3.9 (0.4-35.3) | |
| Reference | Study Populationa | Exposed Casesb |
Exposure of Interest/ Estimated Risk (95% CI)b |
| Ranch Hand—< 118.5 TCDD pg/g at |
4 | 7.2 (0.9-58.8) | |
| Ranch Hand—> 118.5 TCDD pg/g at |
3 | 5.5 (0.6-46.1) | |
| Air Force Ranch Hand veterans—incidence | 16 | 1.8 (0.8-3.8) | |
| Kelchum et al., 1999 | Ranch Hand veterans, comparisons through |
||
| Comparisons | 9 | 1.0 | |
| Ranch Hand background exposure | 4 | 1.1 (0.3-4.5) | |
| Ranch Hand low exposure | 6 | 2.6 (0.7-9.1) | |
| Ranch Hand high exposure | 2 | 0.9 (0.2-5.6) | |
| Wolfe et al 1990 | Air Force Ranch Hand veterans—incidence | 4 | 1.3 (0.3-5.2) |
| US VA Cohort of Army Chemical Corps | All COIs | ||
| Cypel and Kang et al., 2010 | ACC—deployed vs nondeployed and vs US |
5 vs 4 | 1.5 (0.4–6.2) |
| ACC veterans vs US men | |||
| Vietnam cohort | 5 | 1.3 (0.4–3.1) | |
| Non-Vietnam cohort | 4 | 1.3 (0.4–3.4) | |
| US CDC Vietnam Experience Study | All COIs | ||
| Follow-up of CDC Vietnam Experience Cohort | 6 | 1.4 (0.4–4.9) | |
| US VA Mortality Study of Army and Marine Veterans (ground troops serving July 4, 1965–March 1, 1973) | All COIs | ||
| Army Vietnam veterans | 145 | 1.0 (0.9–1.1) | |
| Marine Vietnam veterans | 36 | 0.9 (0.6–1.5) | |
| State Studies of US Vietnam Veterans | All COIs | ||
| Massachusetts Vietnam veterans—incidence | 21 | 1.4 (0.7–2.9) | |
| Australian Vietnam Veterans vs Australian population | All COIs | ||
| Survey of Australian Vietnam Veterans |
nr | 4.7 (1.3–8.2) | |
| Australian male Vietnam veterans vs |
756 | 1.3 (1.2–1.4) | |
| Navy | 173 | 1.4 (1.2–1.6) | |
| Army | 510 | 1.2(1.2–1.4) | |
| Air Force | 73 | 1.4(1.1–1.7) | |
| Australian male Vietnam veterans vs |
111 | 1.1(0.9–1.3) | |
| Navy | 35 | 1.6 (1.0–2.1) | |
| Army | 66 | 1.0 (0.7–1.2) | |
| Air Force | 10 | 1.0 (0.5–1.8) | |
| Reference | Study Populationa | Exposed Casesb |
Exposure of Interest/ Estimated Risk (95% CI)b |
| Australian Vietnam veterans—incidence (validation study) |
Expected number of exposed cases (95% CI) |
||
| 483 | 380 (342-418) | ||
| Australian Vietnam veterans (men)—self- | 2,689 | 380 (342-418) | |
| reported incidence | |||
| Australian Vietnam veterans (women)—self- | 7 | 3 (1-8) | |
| reported incidence | |||
| Australian Vietnam veterans (men) | 51 | 1.3 (0.9-1.7) | |
| Australian Conscripted Army National Service (deployed vs nondeployed) | All COIs | ||
| Australian male conscripted Army National Service Vietnam-era veterans—deployed vs nondeployed |
|||
| Incidence | 204 | 1.1 (0.9-1.4) | |
| Mortality | 14 | 0.6 (0.3-1.1) | |
| Australian National Service Vietnam veterans | 16 | 0.5 (0.2-1.3) | |
| OCCUPATIONAL IARC Phenoxy Herbicide Cohort (mortality vs national mortality rates) |
All COIs | ||
| IARC cohort, male and femable workers exposed to any phenoxy herbicide or chlorophenol | 9 | 0.6 (0.3-1.2) | |
| Exposed to highly chlorinated PCDDs | 5 | 0.5 (0.2-3.2) | |
| Not exposed to highly chlorinated PCDDs | 4 | 0.0 (0.3-2.4) | |
| Dow Chemical Company—Midland, MI (included in [ARC and NIOSH cohorts) | All COIs | ||
| Trichlorophenol workers | 2 | 0.6 (0.1-2.3) | |
| Pentachlorophenol workers | 1 | 0.7 (0.0-4.0) | |
| Danish Production Workers (included in I ARC cohort) | Dioxin, phenoxy herbicides | ||
| Danish production workers—updated incidence | 4 | 4.3 (1.2-10.9) | |
| Dutch Production Workers (included in IARC cohort) | Dioxin, phenoxy herbicides | ||
| Dutch chemical production workers (included in IARC cohort) | 1 | 2.9 (0.1-15.9) | |
| New Zealand Production Workers—Dow plant in Plymouth, NZ (included in IARC cohort) | Dioxin, Phenoxy Herbicides |
||
| 1,599 production workers (male and female) vs national rates—mortality 1969 through 2004 | |||
| Ever-exposed workers | 2 | 1.0 (0.1-3.7) | |
| Reference | Study Populationa | Exposed Casesb |
Exposure of Interest/ Estimated Risk (95% CI)b |
| Dainish gardeners—incidence (skin, ICD-7 190-191) |
|||
| 10-yr follow-up (1975-1984) reported in |
31 | 1.3 (0.9-1.8) | |
| 25-yr follow-up (1975-2001) | |||
| Born before 1915 (high exposure) | 28 | 0.9 (0.6-1.4) | |
| Born 1915-1934 (medium exposure) | 36 | 0.6 (0.4-0.9) | |
| Born after 1934 (low exposure) | 5 | 0.3 (0.1-0.7) | |
| ’t Mannetje at al., 2005 | New Zealand phenoxy herbicide producers, | ||
| sprayers—mortality | |||
| Phenoxy herbicide producers (men and women) | 0 | 0.0 (0.0-3.0) | |
| Phenoxy herbicide sprayers ( > 99% men) | 1 | 0.6 (0.0-3.4) | |
| Agricultural Health Study | Herbicides | ||
| AHS (licensed, male pesticide | |||
| applicators)—150 cutaneous melanomas among 24.704 pesticide applicators | |||
| Ever-exposed to arsenic-based pesticides vs never-exposed | 1.3 (0.7-2.4) | ||
| Ever used lead arsenate insecticide | 1.2 (0.6-2.3) | ||
| Pesticide applicators in AMS—melanoma | |||
| incidence from enrollment through 2002 Dicamba—lifetime days exposure | |||
| None | 32 | 1.0 | |
| 1– <20 | 10 | 1.0 (0.5-2.1) | |
| 20– <56 | 18 | 1.6 (0.8-3.0) | |
| 56– < 116 | 6 | 0.7 (0.3-1.8) | |
| ≥ 116 | 6 | 0.8 (0.3-2.1) p-trend = 0.5l |
|
| US AHS—incidence | |||
| Private applicators (men and women) | 100 | 1.0 (0.8-1.2) | |
| Spouses of private applicators ( > 99%women) | 67 | 1.6 (1.3-2.1) | |
| Commercial applicators (men and women) | 7 | 1.1 (0.4-2.2) | |
| US AHS | |||
| Private applicators (men and women) | 13 | 0.7 (0.4-1.3) | |
| Spouses of private applicators | 2 | 0.4 (0.1-1.6) | |
| ( > 99%women) | |||
| Other Agricultural Workers | Herbicides | ||
| US farmers in 23 states | |||
| White men | 244 | 1.0 (0.8-1.1) | |
| White women | 5 | 1.1 (0.4-2.7) | |
| Danish workers—incidence | |||
| Men | 72 | 0.7 (p < 0.05) | |
| Women | 5 | 1.2 (nr) | |
| Reference | Study Populationa | Exposed Casesb |
Exposure of Interest/ Estimated Risk (95% CI)b |
| Canadian farmers | 24 | 1.1 (0.7-1.6) | |
| Swedish male and female agricultural | 99% CI | ||
| workers—incidence | 268 | 0.8 (0.7-1.0) | |
| Other Studies of Herbicide and Pesticide Applicators | Herbicides | ||
| Dutch licensed herbicide applicators | |||
| Melanoma, squamous-cell carcinoma, unknown skin cancer (mortality presumably attributable to melanoma) |
5 | 3.6 (1.2-8.3) | |
| Italian licensed pesticide users | 9 | 1.2 (0.6-2.3) | |
| Magnani el al., 1987 | UK case—control | ||
| Herbicides | nr | 1.2 (0.4-4.0) | |
| Chlorophenols | nr | 0.9 (0.4-2.3) | |
| Forestry Workers | Herbicides | ||
| Thörn et al., 2000 | Swedish lumberjack workers exposed to | ||
| Women | 1 | 3.5 (0.1-19.2) | |
| Men | 0 | nr | |
| British Columbia sawmill workers | |||
| Incidence | 38 | 1.0 (0.7-1.3) | |
| Mortality | 17 | 1.4 (0.9-2.0) | |
| Paper and Pulp Workers | Dioxins | ||
| IARC cohort of pulp and paper workers Exposure to nonvolatile organochlorine |
|||
| Never | 20 | 0.8 (0.5-1.3) | |
| Ever | 21 | 1.2 (0.7-1.8) | |
| ENVIRONMENTAL Seveso, Italy Residential Cohort |
TCDD |
||
| Seveso residents—25-yr follow-up—men, women | |||
| Zone A | 1 | 3.1 (0.4-22.0) | |
| Zone B | 2 | 1.0 (0.2-3.9) | |
| Zone R | 12 | 0.8 (0.4-1.5) | |
| Seveso—20-yr follow-up to 1996—incidence | |||
| Zone A | 1 | 1.6 (0.2-11.6) | |
| Zone B | 2 | 0.5 (0.1-2.0) | |
| Zone R | 19 | 0.7 (0.4-1.1) | |
| Seveso residents—20-yr follow-up | |||
| Zones A, B—men | 1 | 1.5 (0.2-12.5) | |
| women | 2 | 1.8 (0.4-7.3) | |
| Reference | Study Populationa | Exposed Casesb |
Exposure of Interest/ Estimated Risk (95% CI)b |
| Bertazzi et al., 1997 | Seveso residents—I5-yr follow-up | ||
| Zone A—women | 1 | 9.4(0.1-52.3) | |
| Zone R—men | 3 | 1.1(0.2-3.2) | |
| women | 3 | 0.6(0.1-1.8) | |
| Bertazzi et al.. | Seveso residents—10-yr follow-up | ||
| 1989a | Zones A, B, R—men | 3 | 3.3(0.8-13.9) |
| women | 1 | 0.3(0.1-2.5) | |
| Other Environmental Studies | |||
| Svensson et al., 1995 | Swedish fishermen (men and women) | Organochlorine compounds |
|
| East coast | compounds | ||
| Incidence | 0 | 0.0 (0.0-0.7) | |
| Mortality | 0 | 0.0(0.0-1.7) | |
| West coast | |||
| Incidence | 20 | 0.8(0.5-1.2) | |
| Mortality | 6 | 0.7(0.3-1.5) | |
ABBREVIATIONS: ACC, Army Chemical Corps; AFHS, Air Force Health Study; AHS, Agricultural Health Study; CDC, Centers for Disease Control and Prevention; CI, confidence interval; COI, chemical of interest; IARC, International Agency for Research on Cancer; ICD, International Classification of Diseases; MI, Michigan; NIOSH, National Institute for Occupational Safety and Health; nr, not reported; NZ, New Zealand; PCDD, polychlorinated dibenzo-p-dioxin (highly chlorinated, if four or more chlorines); SEA, Southeast Asia; TCDD, 2,3,7,8-tetrachlorodibenzo-p-dioxin; VA, US Department of Veterans Affairs.
aCohorts are male, and outcome mortality unless otherwise noted.
bGiven when available; results other than estimated risk explained individually.
mortality were compared in people who served in Vietnam (2,872) and those who did not (2,737). In comparing the Vietnam cohort with the nondeployed cohort, a moderate but not statistically significant increase in risk of malignant skin cancer was observed (adjusted RR = 1.52, 95% CI 0.37–6.20). In comparing mortality with that in males in the US population, the risk of skin cancer was slightly increased in both veteran cohorts (SMR = 1.33, 95% CI 0.43–3.10 for Vietnam veterans; SMR = 1.31, 95% CI 0.36–3.36 for the nondeployed veterans). Analyses of examining those who reported spraying herbicides in Vietnam (compared with veterans who reported no spraying) did not measure risk of mortality from malignant skin cancer associated with herbicide exposure.
A cohort study of Australian Vietnam veterans (O’Toole et al., 2009) was conducted in 1990–1993 and re-examined in 2005–2006. In the original assessment, 641 Australian Vietnam veterans were randomly selected for participation from the list of Army veterans deemed eligible for previous studies of Agent Orange, and 450 are included in the more recent assessment. Interviewers ad-
ministered the Australian Bureau of Statistics National Health Survey that assessed physical health and associated risk factors, a 32-item combat index, an assessment for combat-related posttraumatic stress disorder and an assessment of general psychiatric status. The prevalence of a variety of self-reported health conditions was compared with that in the general population, and SMRs were calculated (standardized to the Australian male population in 5-year age groups). Compared with the general population, Vietnam veterans had a higher prevalence of melanoma (SMR = 4.73, 95% CI 1.25–8.21). Given the self-reported outcome, the possibility that nonmelanoma skin cancers were misclassified into the melanoma category cannot be ruled out.
Occupational Studies
McBride et al. (2009a,b) evaluated mortality from cancers in an occupational cohort of TCP workers in New Zealand, a set of the IARC cohort (see Chapter 5). Workers were employed during the period 1969–1988, and SMRs were calculated by using the New Zealand population as the comparison group. Exposure was classified as ever exposed or never exposed to TCDD. In McBride et al. (2009a), two cases of malignant melanoma were identified in the ever-exposed group and none in the never-exposed group. When those cases were compared with the expected number of deaths in the New Zealand population, no association was observed (SMR = 1.0, 95% CI 0.1–3.7) in the ever-exposed workers. Results in McBride et al. (2009b) have not been included, because they were diluted by inclusion of a set of workers who had no opportunity for TCDD exposure and no observed deaths.
Collins et al. (2009a,b) reported the mortality experience in the occupational cohort in the Midland, Michigan, Dow Chemical plant previously included in analyses of the NIOSH mortality cohort, as reported by Fingerhut et al. (1991) and added to the expanded IARC phenoxy herbicide cohort (Kogevinas et al., 1997). TCP was produced at the plant in 1942–1979 and PCP in 1937–1980. Job histories of the workers were used to determine the amount of time that they spent in the TCP or PCP units. Mortality in the workers and SMRs were calculated by using the US population as the referent. One death from malignant melanoma was identified in the PCP-only workers (SMR = 0.7, 95% CI 0.0–4.0) (Collins et al., 2009b). In a separate analysis of the TCP workers (Collins et al., 2009a), two deaths from malignant melanoma were identified (SMR = 0.6, 95% CI 0.1–2.3); one of the deaths occurred in a worker who was exposed to both TCDD and PCP, and when this death was removed from the analysis, the SMR was reduced to 0.4 (95% CI 0.0–2.0). As pointed out in follow-up correspondence (Collins et al., 2010; Villeneuve and Steenland, 2010) and discussed in detail in Chapter 5, different latency models, different dose–response models, and in-depth analysis of the serum concentrations could alter some of the results reported in this analysis; given the small number of deaths from malignant melanoma, such methodologic considerations are unlikely to alter the conclusions regarding melanoma.
A possible association between pesticide use and melanoma was also evaluated in the AHS (Dennis et al., 2010). The AHS is described in Chapter 5. Among the pesticides of interest, any history of exposure to arsenic-based pesticides was weakly associated with melanoma in comparison with applicators who reported never using these types of pesticides (adjusted OR = 1.3, 95% CI 0.7–2.4). A similar result was observed for applicators who reported ever using lead arsenate insecticides (OR = 1.2, 95% CI 0.6–2.3).
Environmental Studies
Cancer incidence was re-evaluated in the Seveso cohort for the period 1977– 1996 (Pesatori et al., 2009). The Seveso cohort, described in Chapter 5, includes all residents of Seveso at the time of the accident and those who migrated into or were born in the area in the 10-year period after the accident. A total of 218,761 residents are included in the analysis: 723 in the high-exposure zone (Zone A), 4,821 in the medium-exposure zone (Zone B), 31,643 in the low-exposure zone (Zone R), and the remainder who lived in the noncontaminated zone. A total of 22 melanoma cases were identified: 1 in Zone A, 2 in Zone B, and 19 in Zone R. Compared with the incidence in the reference zone, melanoma incidence was higher, but imprecise, in Zone A (RR = 1.62, 95% CI 0.23–11.61) and lower in Zones B and R (RR = 0.50, 95% CI 0.12–2.03; RR = 0.71, 95% CI 0.44–1.14, respectively).
Biologic Plausibility
There have been no new studies of animal models of skin cancer. TCDD and related herbicides have not been found to cause melanoma in animal models. In general, rodents, which are used in most toxicology studies, are not a good model for studying melanoma. TCDD does produce nonmelanoma skin cancers in animal models (Wyde et al., 2004). As discussed elsewhere in this chapter, TCDD is a known tumor-promoter and could act as a promoter for skin-cancer initiators, such as UV radiation. Ikuta et al. (2009) examined the physiologic role of the AHR in human skin and theorized that overactivation can lead to skin cancers, but they provided no evidence that melanoma incidence is increased after TCDD exposure.
The biologic plausibility of the carcinogenicity of the chemicals of interest is discussed in general at the beginning of this chapter.
Synthesis
No association between the chemicals of interest and melanoma was observed in any of the three new occupational studies. Although the risk of melanoma was increased in those living in the highest-exposure zone in the Seveso
cohort, this finding was based on only one melanoma case. The new studies do not provide evidence to support moving melanoma to the category of limited or suggestive evidence. Of the two new Vietnam veteran studies, no association was observed in the ACC study, which was based on five cases of malignant skin cancer in the Vietnam cohort and four cases in the non-Vietnam cohort, as reflected in the similar RRs in the two cohorts when mortality was compared with that in the general population. An increased risk of melanoma was reported in the O’Toole study of Australian Vietnam veterans, but the prevalence of self-reported melanoma in the veteran population (1.6%) suggests that nonmelanoma skin cancer may have been misclassified as melanoma.
The committee responsible for Update 2006 was unable to reach a consensus as to whether there was limited or suggestive evidence of an association between exposure to the chemicals of interest and melanoma or inadequate or insufficient evidence to determine whether there is an association. That committee recognized that the findings from the AFHS, including the evaluation of TCDD measurements and melanoma (Akhtar et al., 2004; Pavuk et al., 2005), were of prime interest. However, the data from the final AFHS examination cycle indicate that many more melanoma cases were diagnosed in the comparison veterans than in the Ranch Hand subjects, so the committee responsible for Update 2006 recommended that the Akhtar et al. analyses be rerun on the final AFHS dataset. The final data on the Ranch Hand and comparison subjects still have not been analyzed in a satisfactory and uniform manner, so the present committee also strongly encourages such an analysis to provide documentation of the full melanoma experience revealed by the AFHS and to permit definitive evaluation of the possible association between the chemicals of interest and melanoma.
Conclusion
On the basis of the evidence reviewed here and in previous VAO reports, the committee concludes that there is inadequate or insufficient evidence to determine whether there is an association between exposure to the chemicals of interest and melanoma.
SKIN CANCER—BASAL-CELL CANCER AND SQUAMOUS-CELL CANCER (NONMELANOMA SKIN CANCERS)
The preceding section on melanoma presented background information on nonmelanoma skin cancers (ICD-9 173).
Conclusions from VAO and Previous Updates
The committee responsible for VAO concluded that there was inadequate or insufficient information to determine whether there is an association between
exposure to the chemicals of interest and skin cancer, and additional information available to the committee responsible for Update 1996 did not change that conclusion. The committee responsible for Update 1998 considered the literature on nonmelanocytic skin cancer separately from that on melanoma and concluded that there was inadequate or insufficient information to determine whether there is an association between exposure to the chemicals of interest and basal-cell or squamous-cell cancer. The committees responsible for Update 2000, Update 2002, Update 2004, Update 2006, and Update 2008 did not change that conclusion. Table 7-20 summarizes the relevant studies.
Update of the Epidemiologic Literature
No Vietnam-veteran studies or occupational studies concerning exposure to the chemicals of interest and basal-cell or squamous-cell cancer have been published since Update 2006.
Environmental Studies
Cancer incidence was re-evaluated in the Seveso cohort for the period 1977– 1996 (Pesatori et al., 2009). The Seveso cohort, described in Chapter 5, includes all residents of Seveso at the time of the accident and those who migrated into or were born in the area in the 10-year period after the accident. A total of 218,761 residents are included in the analysis: 723 in the high-exposure zone (Zone A), 4,821 in the medium-exposure zone (Zone B), 31,643 in the low-exposure zone (Zone R), and the remainder who lived outside the zone of exposure. A total of 96 skin-cancer cases were identified; 3 in Zone A, 5 in Zone B, and 88 in Zone R. Compared with the incidence in the reference zone, the incidence of skin cancer was increased, but imprecise, in Zone A (RR = 1.39, 95% CI 0.45–4.32) and decreased in Zones B and R (RR = 0.37, 95% CI 0.15–0.90; RR = 0.93, 95% CI 0.75–1.17, respectively).
Biologic Plausibility
There are no new studies on animal models of skin cancer to report. TCDD has been shown to produce nonmelanoma skin cancers in animal models (Wyde et al., 2004). As discussed elsewhere in this chapter, TCDD is a known tumor-promoter and could act as a promoter for skin-cancer initiators, such as UV radiation, but no experiments have been conducted specifically to support this potential mechanism.
The biologic plausibility of the carcinogenicity of the chemicals of interest is discussed in general at the beginning of this chapter.
| Reference | Study Populationa | Exposed Casesb |
Exposure of Interest/ Estimated Risk (95% CI)b |
| VIETNAM VETERANS | |||
| US Air Force Health Study—Ranch Hand veterans vs SEA veterans | All COIs | ||
| While Air Force comparison subjects only (basal cell and squamous cell) —incidence | |||
| Serum TCDD (pg/g). based on model with exposure variable loge(TCDD) | |||
| Per unit increase of -loge(TCDD) Quaniles (pg/g) | 253 | 1.2 (0.9-1.4) | |
| 0.4-2.6 | 50 | nr | |
| 2.6-3.8 | 59 | 1.2 (0.8-1.8) | |
| 3.8-5.2 | 71 | 1.5 (1.1-2.3) | |
| >5.2 | 73 | 1.4 (0.9-2.0) | |
| Number of years served in SEA | |||
| Per year of service Quaniles (years in SEA) | 253 | 1 (0.9-1.1) | |
| 0.8-1.3 | 55 | nr | |
| 1.3-2.1 | 50 | 0.9 (0.6-1.4) | |
| 2.1-3.7 | 73 | 1.1 (0.8-1.6) | |
| 3.7-16.4 | 75 | 1.2 (0.8-1.7) | |
| Air Force Ranch Hand veterans—incidence | |||
| Basal-cell carcinoma | 121 | 1.2 (0.9-1.6) | |
| Squamous-cell carcinoma | 20 | 1.5 (0.8-2.8) | |
| Air Force Ranch Hand veterans—incidence | |||
| Basal cell carcinoma | 78 | 1.5 (1.0-2.1) | |
| Squamous cell carcinoma | 6 | 1.6 (0.5-5.1) | |
| Australian Vietnam Veterans vs Australian Population | All COIs | ||
| Australian Vietnam veterans (men)—self-reported incidence | 6,936 | nr | |
| Australian Vietnam veterans (women)—self-reported incidence | 37 | nr | |
| OCCUPATIONAL | |||
| IARC Phenoxy Herbicide Cohort (mortality vs national mortality) | Dioxin, phenoxy herbicides | ||
| IARC cohort, male and female workers exposed to any phenoxy herbicide or chlorophenol | 4 | 0.9 (0.3-2.4) | |
| Exposed to highly chlorinated PCDDs | 4 | 1.3 (0.3-3.2) | |
| Not exposed to highly chlorinated PCDDs | 0 | 0.0 (0.0-3.4) | |
| Dow Production Workers—Midland. MI (included in IARC NTOSH cohorts) | Dioxin, phenoxy herbicides | ||
| Dow 2,4-D production workers | |||
| Nonmelanoma skin cancer | 0 | nr | |
| United Kingdom Production Workers (included in IARC cohort ) | Dioxin, phenoxy herbicides | ||
| British MCPA production workers | 3 | 3.1 (0.6-9.0) | |
| Reference | Study Populationa | Exposed Casesb |
Exposure of Interest/ Estimated Risk (95% CI)b |
| Agricultural Workers | Herbicides | ||
| Danish gardener;—incidence (skin, ICD-7 190-191) |
|||
| 10-yr follow-up (1975-1984) reported in |
31 | 1.3 (0.9-1.8) | |
| 25-yr follow-up (1975-2001) | |||
| Born before 1915 (high exposure) | 28 | 0.9 (0.6-1.4) | |
| Born 1915-1934 (medium exposure) | 36 | 0.6 (0.4-0.9) | |
| Born after 1934 (low exposure) | 5 | 0.3 (0.1-0.7) | |
| US farmers in 23 states | |||
| Skin (including melanoma) | |||
| White men | 425 | 1.1 (1.0-1.2) | |
| White women | 6 | 1.0 (0.4-2.1) | |
| Danish workers—incidence | |||
| Men—self-employed | 493 | 0.7 <p < 0.05) | |
| employee | 98 | 0.7 (p< 0.05) | |
| Women—self-employed | 5 | 0.3 (p< 0.05) | |
| employee | 10 | 0.9 <nr) | |
| family worker | 90 | 0.6 (p< 0.05) | |
| Swedish male and female agricultural | 99%CI | ||
| workers—incidence | 708 | 1.1 (1.0-1.2) | |
| Studies of Herbicide and Pesticide Applicators | Herbicides | ||
| Dutch licensed herbicide applicators | |||
| Melanoma, squamous-cell carcinoma, unknown skin cancer (mortality presumably attributable to melanoma) |
5 | 3.6 (1.2-8.3) | |
| Italian licensed pesticide users | 3 | 0.6 (0.1-1.8) | |
| Zhong and Rafnsson. 1996 | Icelandic pesticide users (men, women —incidence) | ||
| Men | 5 | 2.8 (0.9-6.6) | |
| Forestry Workers | Herbicides | ||
| Thörn et al., 2000 | Swedish lumberjacks exposed to phenoxyacetic herbicides—incidence |
||
| Foremen | 1 | 16.7 (0.2-92.7) | |
| ENVIRONMENTAL | |||
| Seveso, Italy Residential Cohort | TCDD | ||
| Seveso—20-yr follow-up to 1996—incidence | |||
| Zone A | 3 | 1.4 (0.5-4.3) | |
| Zone B | 5 | 0.4 (0.2-0.9) | |
| Zone R | 88 | 0.9 (0.8-1.2) | |
| Reference | Study Populationa | Exposed Casesb |
Exposure of Interest/ Estimated Risk (95% CI)b |
| Seveso residents—10-yr follow -up—incidence |
|||
| Zone A—men | 1 | 2.4 (0.3-17.2) | |
| women | 1 | 3.9 (0.5-28.1) | |
| Zone B—men | 2 | 0.7 (0.2-2.9) | |
| women | 2 | 1.3 (0.3-5.1) | |
| Zone R—men | 20 | 1.0 (0.6-1.6) | |
| women | 13 | 1.0 (0.6-1.9) | |
| Seveso residents—incidence | |||
| Zones A, B—men | 3 | 1.0 (0.3-3.0) | |
| women | 3 | 1.5 (0.5-4.9) | |
| Zone R—men | 20 | 1.0 (0.6-1.6) | |
| women | 13 | 1.0 (0.5-1.7) | |
| Other Environmental Studies | Herbicides | ||
| Alberta, Canada, residents—squamous-cell | |||
| carcinoma-incidence | |||
| All herbicide exposure | 79 | 1.5 (1.0-2.3) | |
| Low herbicide exposure | 33 | 1.9 (1.0-3.6) | |
| High herbicide exposure | 46 | 3.9 (2.2-6.9) | |
| Alberta, Canada, residents—basal-cell carcinoma | |||
| All herbicide exposure | 70 | 1.1 (0.8-1.7) | |
| Swedish fishermen East coast | Organochlorine compounds | ||
| Incidence | 2.3 (1.5-3.5) | ||
| Mortality | 0 | 0.0 (0.0-15.4) | |
| West coast | |||
| Incidence | 69 | 1.1 (0.9-1.4) | |
| Mortality | 5 | 3.1 (1.0-7.1) | |
ABBREVIATIONS: 2,4-D, 2,4-dichlorophenoxyacetic acid; CI, confidence interval; COI, chemical of interest; IARC, International Agency for Research on Cancer; ICD, International Classification of Diseases; MCPA, 2-methyl-4-chlorophenoxyacetic acid; MI, Michigan; NIOSH, National Institute for Occupational Safety and Health; nr, not reported; PCDD, polychlorinated dibenzo-p-dioxin (highly chlorinated, if four or more chlorines); SEA, Southeast Asia; TCDD, 2,3,7,8-tetrachlorodibenzo-p-dioxin.
aSubjects are male, and outcome is mortality unless otherwise noted.
bGiven when available; results other than estimated risk explained individually.
Synthesis
In accord with the results of reports previously assessed, the committee concludes that there is inadequate or insufficient evidence to determine whether there is an association between exposure to the chemicals of interest and basal-cell or squamous-cell cancer.
Conclusion
On the basis of the evidence reviewed here and in previous VAO reports, the committee concludes that there is inadequate or insufficient evidence to determine whether there is an association between exposure to the chemicals of interest and basal-cell or squamous-cell cancer.
Breast cancer (ICD-9 174 for females, ICD-9 175 for males) is the second-most common type of cancer (after nonmelanoma skin cancer) in women in the United States. ACS estimated that 207,090 women would receive diagnoses of breast cancer in the United States in 2010 and that 39,840 would die from it (Jemal et al., 2010). Overall, those numbers represent about 28% of the new cancers and 15% of cancer deaths in women. Incidence data on breast cancer are presented in Table 7-21.
Breast-cancer incidence generally increases with age. In the age groups of most Vietnam veterans, the incidence is higher in whites than in blacks. Established risk factors other than age include personal or family history of breast cancer and some characteristics of reproductive history—specifically, early menarche, late onset of menopause, and either no pregnancies or first full-term pregnancy after the age of 30 years. A pooled analysis of six large-scale prospective studies of invasive breast cancer showed that alcohol consumption over the range of consumption reported by most women was associated with a small linear increase in incidence in women (Smith-Warner et al., 1998). It is now generally accepted that breast-cancer risk is increased by prolonged use of hormone-replacement therapy, particularly preparations that combine estrogen and progestins (Chlebowski et al., 2003). The potential of other personal behavioral and environmental factors (including use of exogenous hormones) to affect breast-cancer incidence is being studied extensively.
Most of the roughly 10,000 female Vietnam veterans who were potentially exposed to herbicides in Vietnam are approaching or have recently reached meno-
TABLE 7-21 Average Annual Incidence (per 100,000) of Breast Cancer in United Statesa
| 55-59 Years Old | 60-64 Years Old | 65-69 Years Old | |||||||
| All Races | While | Black | All Races | While | Black | All Races | While | Black | |
| Men | 1.9 | 2.9 | 3.3 | 3.3 | 7.2 | 4.9 | 5.3 | 4.1 | 1.9 |
| Women | 283.2 | 289.4 | 273.6 | 357.1 | 369.8 | 339.6 | 412.1 | 430.9 | 376.9 |
aSurveillance, Epidemiology, and End Results program, nine standard registries, crude age-specific rates, 2004–2008 (NCI, 2010).
pause. Given the high incidence of breast cancer in older and postmenopausal women in general, it is expected on the basis of demographics alone that the breast-cancer burden in female Vietnam veterans will increase in the near future.
The vast majority of breast-cancer epidemiologic studies involve women, but the disease also occurs rarely in men, with 1,970 new cases expected in 2010 (Jemal et al., 2010). Reported instances of male breast cancer are noted, but the committee’s conclusions are based on the studies in women.
Conclusions from VAO and Previous Updates
The committee responsible for VAO concluded that there was inadequate or insufficient information to determine whether there is an association between exposure to the chemicals of interest and breast cancer. Additional information available to the committees responsible for Update 1996, Update 1998, Update 2000, Update 2002, and Update 2004 did not change that conclusion. After consideration of a new study with positive findings for association of breast cancer with 2,4-D exposure in female farm workers in California (Mills and Yang, 2005)—in conjunction with the earlier findings of Kang et al. (2000), Kogevinas et al. (1997), Revich et al. (2001), and Warner et al. (2002)—the committee responsible for Update 2006 was unable to reach consensus as to whether there might be limited or suggestive evidence of an association between the chemicals of interest and breast cancer. After reviewing studies that had null findings on mortality from breast cancer in the important cohorts of female Vietnam-era veterans (Cypel and Kang, 2008) and Seveso residents (Consonni et al., 2008), all members of the committee for Update 2008 concurred that breast cancer should remain in the category of inadequate or insufficient evidence of an association.
Table 7-22 summarizes the relevant research.
Update of the Epidemiologic Literature
No Vietnam-veteran studies concerning exposure to the chemicals of interest and breast cancer have been published since Update 2008.
Occupational Studies
McBride et al. (2009a,b) extended their earlier research by including additional exposed and unexposed workers, constructing exposure estimates based on serum dioxin (TCDD) concentrations in exposed and unexposed workers, and extending follow-up by 4 years. The authors reported on the mortality experience of 1,599 workers employed during 1969–1988 in a New Zealand site that manufactured TCP and a nearby field station where 2,4,5-T was occasionally used and tested (McBride et al., 2009a). Measurements of 346 blood samples confirmed higher exposure than New Zealand background. The study was limited
TABLE 7-22 Selected Epidemiologic Studies—Breast Cancer
| Reference | Study Populationa | Exposed Casesb |
Exposure of Interest/ Estimated Risk (95% CI)b |
| VIETNAM VETERANS | |||
| US CDC Vietnam Experience Study | |||
| Follow-up of CDCVES | 0 | nr | |
| US VA Cohort of Eemale Vietnam Veterans | All COIs | ||
| US Vietnam veterans—women | 57 | 1.0 (0.7-1.4) | |
| Vietnam-veteran nurses | 44 | 0.9 (0.6-1.4) | |
| Female US Vietnam veterans | 170 | 1.2 (0.9-1.5) | |
| Female US Vietnam veterans | 26 | 1.0 (0.6-1.8) | |
| Female US Vietnam veterans | 17 | 1.2 (0.6-2.5) | |
| Australian Vietnam Veterans vs Australian General Population | All COIs | ||
| Australian male Vietnam veterans vs Australian popul ation—incidence |
7 | 0.9 (0.4-1.9) | |
| Navy | 1 | 0.6 (0.0-3.3) | |
| Army | 5 | 1.0 (0.3-2.2) | |
| Air Force | 1 | 1.1 (0.0-6.3) | |
| Australian male Vietnam veterans vs Australian population—mortality |
4 | 2.2 (0.6-5.4) | |
| Navy | 1 | 2.5 (0.0-13.5) | |
| Army | 3 | 2.5 (0.5-7.2) | |
| Air Force | 0 | 0.0 (0.0-14.6) Expected number of exposed cases |
|
| Australian Vietnam veterans (women)—self- | (95% CI) | ||
| reported incidence | 17 | 5 (2-11) | |
| Australian military Vietnam veterans (men) | 3 | 5.5 (1.0- > 10.0) | |
| Australian Conscripted Army National Service (deployed vs nondeployed) | All COIs | ||
| Australian male conscripted Army National Service Vietnam era veterans—deployed vs nondeployed |
0 | nr | |
| Incidence | 0 | 0.0 (0.0-2.4) | |
| Mortality | nr | ||
| OCCUPATIONAL | |||
| IARC Phenoxy Herbicide Cohort (mortality vs national mortality rates) | Dioxin, phenoxy herbicides | ||
| IARC cohort—women | 7 | 0.9 (0.4-1.9) | |
| Reference | Study Populationa | Exposed Casesb |
Exposure of Interest/ Estimated Risk (95% CI)b |
| IARC cohort—exposed subcohort (men and women) | |||
| Men | 2 | 3.5 (0.4-12.5) | |
| Women | 1 | 0.3 (0.0-1.7) | |
| Danish Production Workers (included in IARC cohort) | Dioxin, phenoxy herbicides | ||
| Danish male and female production | |||
| workers—incidence | |||
| Women | 13 | 0.9 (nr) | |
| German Production Workers (included in IARC cohort) | Dioxin, phenoxy herbicides | ||
| Manaz et al., 1991 | German production workers—men, women | ||
| Women | 9 | 2.2 (1.0-4.1) | |
| New Zealand Production Workers—Dow plant in Plymouth, NZ (included in IARC cohort) | Dioxin, phenoxy herbicides | ||
| 1,599 production workers (male and female) vs national rates—mortality 1969 through 2004 | |||
| Ever-exposed female workers | 2 | 1.4 (0.2-5.0) | |
| Phenoxy herbicide producers | |||
| Women | 1 | 1.3 (0.0-7.2) | |
| Men | 1 | 32 (0.8-175) | |
| Phenoxy herbicide sprayers ( > 99% men) | 0 | 0.0 (nr) | |
| Agricultural Health Study | Herbicides | ||
| US AHS—incidence | |||
| Private applicators (men and women) | 27 | 1.1 (0.7-1.6) | |
| Spouses of private applicators ( > 99IA- women) | 474 | 1.0 (0.9-1.1) | |
| Commercial applicators (men and women) | 1 | 0.6 (0.1-3.5) | |
| US AHS, wives of private applicators—incidence | |||
| Wives’ own use of phenoxy herbicides | 41 | 0.8 (0.6-1.1) | |
| 2.4-D | 4] | 0.8 (0.6-1.1) | |
| Husbands’ use of phenoxy herbicides | 110 | 1.1 (0.7-1.8) | |
| 2,4-D | 107 | 0.9 (0.6-1.4) | |
| 2,4,5-T | u | 1.3 (0.9-1.9) | |
| 2.4,5-TP | 19 | 2.0 (1.2-3.2) | |
| US AHS—mortality | |||
| Private applicators (men and women) | 3 | 0.9 (0.2-2.7) | |
| Spouses of private applicators ( > 99% women) | 54 | 0.9 (0.7-1.1) | |
| Paper and Pulp Workers | Dioxin | ||
| IARC cohort of pulp and paper workers | |||
| Exposure to nonvolatile organochlorine compounds | |||
| Never | 21 | 0.9 (0.6-1.4) | |
| Ever | 32 | 0.9 (0.6-1.3) | |
| Reference | Study Populationa | Exposed Casesb |
Exposure of Interest/ Estimated Risk (95% CI)b |
| Other Agricultural Workers | Herbicides | ||
| Mills and Yang. 2005 | Hispanic agricultural farm workers (women) Cancer diagnosis 1987-1994 | ||
| Low 2.4-D use | 12 | 0.6 (0.2-1.9) | |
| High 2.4-D use | 8 | 0.6 (0.2-1.7) | |
| Cancer diagnosis 1995-2001 | |||
| Low 2.4-D use | 19 | 2.2 (1.0-4.9) | |
| High 2,4-D use | 21 | 2.1 (1.1-4.3) | |
| Female farm workers, residents in North Carolina | |||
| Used pesticides in garden | 228 | 2.3 (1.7-3.1) | |
| Laundered clothes for pesticide user | 119 | 4.1 (2.8-5.9) | |
| US farmers in 23 states | |||
| Men—while | 18 | 0.7 (0.4-1.2) | |
| nonwhite | 4 | 1.7 (0.5-4.4) | |
| Women—white | 71 | 1.0 (0.8-1.3) | |
| nonwhite | 30 | 0.7 (0.5-1.0) | |
| Danish, Italian farm workers | |||
| Male farmers | 5 | 0.5 (nr) | |
| Female farmers | 41 | 0.9 (nr) | |
| Female family workers | 429 | 0.8 (p< 0.05) | |
| Swedish agricultural workers—incidence | 99% CI | ||
| Men and women | 444 | 0.8 (0.7-0.9) | |
| Men only | or | 1.0 (nr) | |
| ENVIRONMENTAL | |||
| Seveso, Italy Residential Cohort TCDD |
|||
| Seveso residents (men and women)—25-yr follow-up | |||
| Zone A | 2 | 0.6 (0.2-2.4) | |
| Zone B | 13 | 0.6 (0.3-1.2) | |
| Zone R | 133 | 0.9 (0.7-1.1) | |
| Seveso—20-yr follow-up to 1996—incidence | |||
| Zone A | 8 | 1.4 (0.7-2.9) | |
| Zone B | 30 | 0.9 (0.6-1.2) | |
| Zone R | 249 | 1.0 (0.9-1.2) | |
| Zone A only (15+yrs after accident) | 5 | 2.6 (1.1-6.2) | |
| Zone A only (10-14 yrs after accident) | 2 | 1.4 (0.4-5.7) | |
| Zone A onlv (5-9 yrs after accident) | 1 | 0.8 (0.1-5.7) | |
| Seveso residents—20-yr follow-up | |||
| Zone A, B—females | 14 | 0.7 (0.4-1.3) | |
| Seveso residents—15-yr follow-up | |||
| Zone A—women | 1 | 0.6 (0.0-3.1) | |
| Zone B—women | 9 | 0.8 (0.4-1.5) | |
| Zone R—women | 67 | 0.8 (0.6-1.0) | |
| Reference | Study Populationa | Exposed Casesb |
Exposure of Interest/ Estimated Risk (95% CI)b |
|
| Bertazzi el al., 1993 | Seveso residents—10-yr follow-up—incidence | |||
| Zone A—women | 1 | 0.5 (0.1-3.3) | ||
| Zone B—women | 10 | 0.7 (0.4-1.4) | ||
| Zone R—women | 106 | 1.1 (0.9-1.3) | ||
| men | 1 | 1.2 (0.1-10.2) | ||
| Bertazzi el al., 1989b | Seveso residents—10-yr follow-up | |||
| Zone A—women | 1 | 1.1 (0.1-7.5) | ||
| Zone B—women | 5 | 0.9 (0.4-2.1) | ||
| Zone R—women | 28 | 0.6 (0.4-0.9) | ||
| Seveso Women's Health Study | Dioxin | |||
| SWIIS—981 women who were infants to 40 yrs of age when exposed—incidence |
||||
| With 10-fold increase in TCDD | 15 | 2.1 (1.0-4.6) | ||
| Chapaevsk, Russia Residential Cohort | ||||
| Residents of Chapaevsk, Russia—women | 58 | 2.1 (1.6-2.7) | ||
| Other Knvironmental Studies | ||||
| Finnish fishermen and spouses | Dioxin | |||
| Fishermen's wives | 18 | 0.810.5-1.3) | ||
| Case—control study in Besancon, | ||||
| France—incidence | ||||
| Residence in zones of dioxin exposure around solid-waste incinerator | ||||
| Women, 20-59 yrs of age | ||||
| Very low | 41 | 1.0 | ||
| Low | 81 | 1.1 (0.7-1.6) | ||
| Intermediate | 64 | 1.3 (0.8-1.9) | ||
| High | 11 | 0.9 (0.4-1.8) | ||
| Women, at least 60 yrs of age | ||||
| Very low | u | 1.0 | ||
| Low | 111 | 0.9 (0.6-1.3) | ||
| Intermediate | 72 | 1.0 (0.7-1.4) | ||
| High | 4 | 0.3 (0.1-0.9) | ||
| Teilelbaum et al., 2007 | Case—control study in Long Island, New | Pesticides | ||
| York—incidence | ||||
| Used lawn and garden pesticides | ||||
| Never | 240 | 1.0 | ||
| Ever | 1,254 | 1.3 (1.1-1.6) | ||
| Product for weeds | 1,109 | 1.4 (1.2-1.8) | ||
| Reference | Study Populationa | Exposed Casesb |
Exposure of Interest/ Estimated Risk (95% CI)b |
| Women undergoing breast biopsies in San | PCDDs, PCDFs | ||
| Francisco area hospitals—79 breast-cancer cases vs 52 controls with benign breast conditions—incidence | |||
| Total TEQs Ipg/g) in adipose breast tissue | |||
| ≤ 14.0 | 24 | 1.0 | |
| 14.1-20.9 | 22 | 0.7 (0.3-1.9) | |
| ≤ 21.0 | 33 | 0.3 (0.3-2.0) p-trend = 0.99 |
|
| California Teachers Study cohort | 2.4-D, cacodylic acid | ||
| Residential proximity to use of "endocrine disruptors" (including 2.4-D, cacodylic acid) Quartiles of use (lb/mi1) |
|||
| < 1 | 1,027 | 1.0 | |
| 1-21 | 274 | 1.0 (0.8-1.1) | |
| 22-323 | 114 | 0.9 (0.7-1.1) | |
| ≥ 324 | 137 | 1.0 (0.9-1.3) | |
| Women receiving medical care in Woodland | 73 | Organochlorines | |
| Hills, California | nr | ||
| Women in Quebec City—newly diagnosed | Organochlorines | ||
| 314 | nr | ||
| Patients at Yale-New Haven hospital with breast | nr | dl-PCBs | |
| Related surgery; dioxin-like congener 156 | 0.9 (0.8-1.0) | ||
| Høyer et al., 2000 | Female participants in Copenhagen City Heart | Organochlorines | |
| Study | 195 | Overall survival relative risk 2.8 (1.4—5.6) |
|
ABBREVIATIONS: 2,4-D, 2,4-dichlorophenoxyacetic acid; 2,4,5-T, 2,4,5-trichlorophenoxyacetic acid; 2,4,5-TP, 2 (2,4,5-trichlorophenoxy) propionic acid; AHS, Agricultural Health Study; CDC, Centers for Disease Control and Prevention; CI, confidence interval; COI, chemical of interest; IARC, International Agency for Research on Cancer; nr, not reported; NZ, New Zealand; PCDD, polychlorinated dibenzo-p-dioxin (highly chlorinated, if four or more chlorines); PCDF, polychlorinated dibenzofurans; SWHS, Seveso Women’s Health Study; TCDD, 2,3,7,8-tetrachlorodibenzo-p-dioxin; TEQ, toxicity equivalent quotient; VA, US Department of Veterans Affairs; VES, Vietnam Experience Study.
aSubjects are female, and outcome is mortality unless otherwise noted.
bGiven when available; results other than estimated risk explained individually.
by a high loss of follow-up (21%). The SMR for ever-exposed female workers was 1.4 ((95% CI 0.2–5.0) on the basis of two observed death. It should be noted that the authors reported increased SMRs for other cancers previously found to be associated with dioxins. Results in McBride et al. (2009b) have not been included, because they were diluted by inclusion of a set of workers who had no opportunity for TCDD exposure and no observed deaths.
Environmental Studies
Pesatori et al. (2009) updated mortality and cancer-incidence results for the study conducted among residents of Seveso, Italy. Poisson regression models were used to calculate sex-, age-, and period-adjusted rate ratios. The use of exposure zones (A, B, and R) to define individual exposure introduces misclassification that is likely to be random and to attenuate associations. However, later serum measurements on a subset confirmed the utility of assigning zone of residence as a proxy for exposure to TCDD.
The rate ratio for Zone A was increased (1.43, 95% CI 0.71–2.87), whereas the RRs for Zones B and R were 0.85 (95% CI 0.59–1.22) and 1.00 (95% CI 0.88–1.15), respectively. Analyses accounting for time since acute high exposure to TCDD found a significantly increased incidence of breast cancer 15 or more years after the accident in Zone A (RR 2.57, 95% CI 1.07–6.20) on the basis of five cases. The RR 10–14 years after the accident was 1.42 (95% CI 0.35–5.68), and for 5–9 years after the accident it was 0.81 (95% CI 0.11–5.74) on the basis of two and one deaths, respectively.
Turunen et al. (2008) conducted a mortality study of Finnish fishermen and fishermen’s wives. The cohort consisted of 6,410 Finnish professional fisherman and their wives (4,260). The cohort was linked with Statistics Finland’s national cause-of-death data for 1980–2005. SMRs were calculated by using national mortality figures. The SMR for breast cancer in fishermen’s wives was not increased (SMR = 0.80, 95% CI 0.47–1.25) on the basis of 18 observed deaths.
Dai and Oyana (2008) conducted an epidemiologic study with an ecologic study design to explore the spatial variation in breast-cancer incidence in Midland, Saginaw, and Bay Counties in Michigan. They used spatial modeling and soil concentrations to assign exposure on the basis of ZIP codes. The authors reported that there was a temporal increase in the number of breast-cancer cases from 1985 to 2002; that ZIP codes with the highest rates were clustered in or near contaminated areas, adjusted for age; and that living near or close to contaminated areas was spatially associated with increased breast-cancer incidence. The study has several limitations, the most important of which is that it did not collect information on individual exposure to dioxins. Therefore, the relevance of the study to the VAO report is low.
Biologic Plausibility
The experimental evidence indicates that 2,4-D, 2,4,5-T, and TCDD are weakly genotoxic at most. However, TCDD is a demonstrated carcinogen in animals and is recognized as having carcinogenic potential in humans because of the mechanisms discussed in Chapter 4.
With respect to breast cancer, studies performed in laboratory animals (Sprague-Dawley rats) indicate that the effect of TCDD may depend on the age
of the animal. For example, TCDD exposure was found to inhibit mammary-tumor growth in the adult rat (Holcombe and Safe, 1994) but to increase tumor growth in the neonatal rat (21 days old) (Desaulniers et al., 2001). Other studies have failed to demonstrate an effect of TCDD on mammary-tumor incidence or growth (Desaulniers et al., 2004).
Fenton (2009) recently reviewed the literature on TCDD and breast cancer and suggested that a mechanism may be related to endocrine disruption, which might indicate a close association between the development of mammary cancers and mammary gland differentiation. Agents capable of disrupting the ability of the normal mammary epithelial cell to enter or maintain its appropriate status (a proliferative, differentiated, apoptotic state), to maintain its appropriate architecture, or to conduct normal hormone (estrogen) signaling are likely to act as carcinogenic agents (Fenton, 2006; McGee et al., 2006). In that light, it is interesting that postnatal exposure of pregnant rats to TCDD has been found to alter proliferation and differentiation of the mammary gland (Birnbaum and Fenton, 2003; Vorderstrasse et al., 2004). Jenkins et al. (2007) used a carcinogen-induced rat mammary-cancer model to show that prenatal exposure to TCDD alters mammary gland differentiation and increases susceptibility to mammary cancer by altering the expression of estrogen-receptor genes and of genes involved in oxidative-stress defense. Thus, the effect of TCDD may depend on the timing of the exposure and on the magnitude of gene expression at the time of exposure; TCDD may influence mammary-tumor development only if exposure to it occurs during a specific window during breast development. The breast is the only human organ that does not fully differentiate until it becomes ready for use; nulliparous women have less-differentiated breast lobules, which are presumably more susceptible to carcinogenesis.
Activation of the AHR by dioxin or by the nondioxin ligand indole-3-carbinol is believed to protect against breast cancer by mechanisms that disrupt migration and metastasis (Bradlow, 2008; Hsu et al., 2007).
TCDD has been shown to modulate the induction of DNA chain breaks in human breast-cancer cells by regulating the activity of the enzymes responsible for estradiol catabolism and generating more reactive intermediates, which might contribute to TCDD-induced carcinogenesis by altering the ratio of 4-OH-estradiol to 2-OH-estradiol (Lin et al., 2007, 2008). A similar imbalance in metabolite ratios has been observed in pregnant Taiwanese women, in whom the ratio of 4-OH-estradiol to 2-OH-estradiol, a breast-cancer–risk marker, decreased with increasing exposure to TCDD (Wang et al., 2006). Expression of CYP1B1, the cytochrome P450 enzyme responsible for 2-OH-estradiol formation, but not CYP1A1, the one responsible for 4-OH estradiol formation, was found to be highly increased in premalignant and malignant rat mammary tissues in which the AHR was constitutively active in the absence of ligand (Yang et al., 2008). On the basis of recent mechanistic data, it has been proposed that the AHR contributes to mammary-tumor cell growth by inhibiting apoptosis while promoting
transition to an invasive, metastatic phenotype (Marlowe et al., 2008; Schlezinger et al., 2006).
Recent evidence has shown that AHR activation by TCDD in human breast and endocervical cell lines induces sustained high concentrations of the IL-6 cytokine, which has tumor-promoting effects in numerous tissues, including breast tissue, so TCDD might promote carcinogenesis in these tissues (DiNatali et al., 2010; Hollingshead et al., 2008). Degner et al. (2009) have shown that AHR ligands can upregulate the expression of COX-2, and this may lead to a proinflammatory environment that can support tumor development.
The biologic plausibility of the carcinogenicity of the chemicals of interest is discussed in general at the beginning of this chapter.
Synthesis
In the early 1990s, it was suggested that exposure to some environmental chemicals, such as organochlorine compounds, might play a role in the etiology of breast cancer through estrogen-related pathways. The relationship between organochlorines and breast-cancer risk has been studied extensively especially in the last decade; TCDD and dioxin-like compounds have been among the organochlorines so investigated. Today, there is no clear evidence of a causal role of most organochlorines in human breast cancer (Salehi et al., 2008).
Because of concerns raised by a combination of a new study that had good exposure assessment and positive findings (Mills and Yang, 2005) and several earlier studies (Kang et al., 2000; Kogevinas et al., 1997; Revich et al., 2001; Warner et al., 2002), some members of the committee responsible for Update 2006 believed that there was suggestive evidence of an association, but that committee was unable to reach a consensus. After reviewing new studies that had null findings on mortality from breast cancer in the important cohorts of female Vietnam-era veterans (Cypel and Kang, 2008) and Seveso residents (Consonni et al., 2008), the committee for Update 2008 readily reached consensus that breast cancer should remain in the category of inadequate or insufficient evidence of an association.
New evidence since the last VAO report includes the updated cancer- incidence results for residents of Seveso (Pesatori et al., 2009). The most compelling evidence from the recent study was the increased RR in Zone A for breast-cancer incidence after time since the accident was accounted for: 15 or more years and 10–14 years after the accident, the RR for breast cancer was RR 2.57 (95% CI 1.07–6.20), 1.42 (95% CI 0.35–5.68), respectively, whereas it was 0.81 (95% CI 0.11–5.74) 5–9 years after the accident. Accounting for latency between exposure and outcome led to stronger associations. However, despite evidence from the Seveso cohort, results from the occupational study by McBride et al. (2009a) did not support an increased risk of mortality from breast cancer.
Conclusion
Having considered the new evidence and the results of studies reviewed in previous updates, the present committee concludes that there is inadequate or insufficient evidence to determine whether there is an association (either positive or negative) between exposure to the chemicals of interest and breast cancer.
CANCERS OF THE FEMALE REPRODUCTIVE SYSTEM
This section addresses cancers of the cervix (ICD-9 180), endometrium (also referred to as the corpus uteri; ICD-9 182.0–182.1, 182.8), and ovary (ICD-9 183). Other cancers of the female reproductive system that are infrequently reported separately are unspecified cancers of the uterus (ICD-9 179), placenta (ICD-9 181), fallopian tube and other uterine adnexa (ICD-9 183.2–183.9), and other female genital organs (ICD-9 184); findings on these cancers are included in this section. It also presents statistics on other cancers of the female reproductive system. ACS estimates of the numbers of new female reproductive-system cancers in the United States in 2010 are presented in Table 7-23, with genital-system cancers representing roughly 10% of new cancer cases and 12% of cancer deaths in women (Jemal et al., 2010).
Cervical cancer occurs more often in blacks than in whites, whereas whites are more likely to develop endometrial and ovarian cancer. The incidence of endometrial and ovarian cancer is increased in older women and in those with positive family histories. Use of unopposed estrogen-hormone therapy and obesity, which increases endogenous concentrations of estrogen, both increase the risk of endometrial cancer. Human papilloma virus (HPV) infection, particularly infection with HPV types 16 and 18, is the most important risk factor for cervical cancer. Use of oral contraceptives is associated with a substantial reduction in the risk of ovarian cancer.
|
|
|||
| Site | New Cases | Deaths | |
|
|
|||
| Cervix | 12,200 | 4,210 | |
| Endometrium | 43,470 | 7,950 | |
| Ovary | 21,880 | 13,850 | |
| Other female genital | 2,300 | 7,810 | |
|
|
|||
SOURCE: Jemal et al., 2010.
Conclusions from VAO and Previous Updates
The committee responsible for VAO concluded that there was inadequate or insufficient information to determine whether there is an association between exposure to the chemicals of interest and female reproductive cancers. Additional information available to the committees responsible for Update 1996, Update 1998, Update 2000, Update 2002, Update 2004, Update 2006, and Update 2008 did not change that conclusion.
Tables 7-24, 7-25, and 7-26 summarize the results of the relevant studies.
Update of the Epidemiologic Literature
No Vietnam-veteran studies concerning exposure to the chemicals of interest and cancers of the female reproductive system have been published since Update 2008.
Occupational Studies
McBride et al. (2009a,b) published two reports of a mortality follow-up of the workers in the Dow AgroSciences plant in New Plymouth, New Zealand, who were potentially exposed to TCDD. No deaths were attributed to cancer of the corpus uteri (ICD-10 C54–C55) or ovary (ICD-10 C56). One death due to cancer of the cervix uteri (ICD-10 C53) was recorded in the group of never-exposed workers; no deaths from this cancer were recorded in the exposed workers. The results in McBride et al. (2009b) have not been included, because they were diluted by inclusion of a set of workers who had no opportunity for TCDD exposure and no observed deaths.
TABLE 7-24 Selected Epidemiologic Studies—Cervical Cancer
| Reference | Study Populationa | Exposed Casesb |
Exposure of Interest/ Estimated Risk (95% CI)b |
| VIETNAM VETERANS US VA Cohort of Female Vietnam Veterans |
All COIs | ||
| Kang et aL,2000 | Female Vietnam veterans | 57 | 1.1(0.7-1.7) |
| Australian Vietnam Veterans vs Australian General Population All COIs |
|||
| CDVA,1998b | Australian Vietnam veterans—self-reported | 8 | Expected number of exposed cases (95% CI) 1 (0–5) |
| Reference | Study Populationa | Exposed Casesb |
Exposure of Interest/ Estimated Risk (95% CI)b |
| OCCUPATIONAL | |||
| IARC Phcnoxy Herbicide Cohort (mortality vs national mortality rates) | Dioxin, Phenoxy Herbicides |
||
| IARC cohort, female workers exposed to any phenoxy herbicide or chlorophenol | 3 | 1.1 (0.2-3.3) | |
| Exposed to highly chlorinated PCDDs | 0 | 0.0 (0.0-3.8) | |
| Not exposed to highly chlorinated PCDDs | 3 | 1.8 (0.4-5.2) | |
| Danish Production Workers (included in IARC cohort) | Dioxin, phenoxy herbicides | ||
| Danish phenoxy herbicide workers | 7 | 3.2 (1.3-6.6) | |
| New Zealand Production Workers—Dow plant in Plymouth, NZ (included in IARC cohort) | Dioxin, Phenoxy Herbicides |
||
| Dow trichlorophenol workers Cervix uteri (ICD-10 C53) | 0 | 0.0 (0.0-14.6) | |
| Agricultural Workers | Herbicides | ||
| US farmers in 23 slates | |||
| Whites | 6 | 0.9 (0.3-2.0) | |
| Nonwhites | 21 | 2.0 (1.3-3.1) | |
| Danish farmers—incidence | |||
| Self-employed farmers | 7 | 0.5 (p < 0.05) | |
| Family workers | 100 | 0.5 (p < 0.05) | |
| Employees | 12 | (0.8 <nr) | |
| Swedish female agricultural workers—incidence | |||
| 82 | 0.6 (0.4-0.8) | ||
| ENVIRONMENTAL | |||
| Seveso, Italv Residential Cohort | TCDD | ||
| Seveso—20-yr follow-up to 1996—incidence | |||
| Zone A | 2 | 2.7 (0.7-10.8) | |
| Zone B | 7 | 1.5 (0.7-3.1) | |
| Zone R | 28 | 0.8 (0.6-1.3) | |
| Chapaevsk, Russia Residential Cohort | Dioxin | ||
| Residents of Chapaevsk, Russia | 13 | 1.8 (1.0-3.1) | |
ABBREVIATIONS: CI, confidence interval; COI, chemical of interest; IARC, International Agency for Research on Cancer; nr, not reported; NZ, New Zealand; PCDD, polychlorinated dibenzo-p-dioxin (highly chlorinated, if four or more chlorines); TCDD, 2,3,7,8-tetrachlorodibenzo-p-dioxin; VA, US Department of Veterans Affairs.
aSubjects are female, and outcome is mortality unless otherwise noted.
bGiven when available; results other than estimated risk explained individually.
TABLE 7-25 Selected Epidemiologic Studies—Uterine Cancer
| Reference | Study Populationa | Exposed Casesb |
Exposure of Interest/ Estimated Risk (95% CI)b |
| VIETNAM VETERANS | |||
| US VA Cohort of Female Vietnam Veterans | All COIs | ||
| US non-Vietnam veterans | 5 | 0.8 (0.2-2.8) | |
| vs non-Vietnem nurses | 5 | 1.3 (0.3-5.0) | |
| US Vietnam veterans—incidence | 41 | 1.0 (0.6-1.6) | |
| US Vietnam veterans | 4 | 2.1 (0.6-5.4) | |
| Australian Vietnam Veterans vs Australian Population | All COIs | ||
| Australian Vietnam veterans—self-reported incidence | Expected number of exposed cases (95% CI) | ||
| 4 | 1 (0-5) | ||
| OCCUPATIONAL | All COIs | ||
| IARC Phenoxy Herbicide Cohort (mortality vs national mortality | Dioxin, Phenoxy Herbicides | ||
| IARC cohort, female workers exposed to any cancers of endometrium (includes cancers of endometrium) | 3 | 3.4 (0.7-10.0) | |
| Exposed to highly chlorinated PCDDs | 1 | 1.2 (0.0-6.5) | |
| Not exposed to highly chlorinated PCDDs | 4 | 2.3 (0.6-5.9) | |
| New Zealand Production Workers—Dow plant in Plymouth, NZ (included in IARC cohort) | Dioxin, Phenoxy Herbicides |
||
| 1,599 production workers (male and female) 2004 | |||
| Corpus uteri (ICD-10 C54-C55) | 0 | 0.0 (0.0-30.6) | |
| Agricultural Workers | Herbicides | ||
| US farmers in 23 states | |||
| Whites | 15 | 1.2 (0.7-2.1) | |
| Nonwhites | 17 | 1.4 (0.8-2.2) | |
| Danish farmers—incidence | |||
| Self-employed farmers | 8 | 0.6 (nr) | |
| Family workers | 103 | 0.8 (p< 0.05) | |
| Employees | 9 | 0.9 (nr) | |
| Swedish female agricultural | 99% CI | ||
| workers—incidence | 135 | 0.9 (0.7-1.1) | |
| ENVIRONMENTAL | |||
| Seveso, Italy Residential Cohor | TCDD | ||
| Seveso residents—25-yr follow-up | |||
| Zone A | 0 | 0 | |
| Zone B | 2 | 0.5 (0.1-1.9) | |
| Zone R | 41 | 1.3 (0.9-1.8) | |
| Reference | Study Populationa | Exposed Casesb |
Exposure of Interest/ Estimated Risk (95% CI)b |
| Seveso—20-yr follow-up lo 1996—incidence |
|||
| Zone A | 4 | 2.3 (0.9-6.3) | |
| Zone B | 10 | 0.9 (0.5-1.7) | |
| Zone R | 61 | 0.8 (0.6-1.0) | |
| Endometrium (ICD-9 182) | |||
| Zone A | 1 | 1.2 (0.2-8.8) | |
| Zone B | 3 | 0.6 (0.2-1.9) | |
| Zone R | 27 | 0.7 (0.5-1.1) | |
| Seveso residents—20-yr follow-up | |||
| Zones A, B | 2 | 0.5 (0.1-1.9) | |
| Seveso residents—15-yr follow-up | |||
| Zone B | 1 | 0.3 (0.0-2.4) | |
| Seveso residents—15-yr follow-up | |||
| Zone B | 1 | 0.3 (0.0-1.9) | |
| Zone R | 27 | 1.1 (0.8-1.7) | |
| Swedish women | 154 | 1.0 (0.6-2.0) | |
ABBREVIATIONS: CI, confidence interval; COI, chemical of interest; IARC, International Agency for Research on Cancer; ICD, International Classification of Diseases; nr, not reported; NZ, New Zealand; PCDD, polychlorinated dibenzo-p-dioxin (highly chlorinated, if four or more chlorines); TCDD, 2,3,7,8-tetrachlorodibenzo-p-dioxin; VA, US Department of Veterans Affairs.
aSubjects are female, and outcome is mortality unless otherwise noted.
bGiven when available; results other than estimated risk explained individually.
Environmental Studies
Pesatori et al. (2009) updated cancer-incidence results for the study conducted among residents of Seveso, Italy. Poisson regression models were used to calculate sex-, age- and period-adjusted rate ratios. The use of exposure zones (A, B, and R) to define individual exposure introduces misclassification that is likely to be random and attenuate associations. However, later serum measurements of a subset confirmed the utility of assigning zone of residence as a proxy for exposure to TCDD.
The rate ratios for cancer of the uterus in Zones A, B, and R were 2.34 (95% CI 0.87–6.27), 0.93 (95% CI 0.49–1.73), and 0.79 (95% CI 0.60–1.03), respectively. The rate ratios for cancer of the cervix in Zones A, B, and R were 2.67 (95% CI 0.66–10.77), 1.47 (95% CI 0.69–3.12), and 0.84 (95% CI 0.57–1.25), respectively. Although cancer of the uterus and cancer of the cervix were higher in Zone A, the estimates were not statistically significant. For cancer of the en-
TABLE 7-26 Selected Epidemiologic Studies—Ovarian Cancer
| Reference | Study Populationa | Exposed Casesb |
Exposure of Interest/ Estimated Risk (95% CI)b |
| VIETNAM VETERANS | |||
| US VA Cohort of Female Vietnam Veterans | All COIs | ||
| Vietnam veterans—prevalence | 16 | 1.8 (0.7-4.7) | |
| Australian Vietnam Veterans vs Australian General Population | All COIs | ||
| Australian Vietnam veterans—self-reported incidence | Expected number of exposed cases (95% CI) | ||
| 1 | 0 (0-4) | ||
| OCCUPATIONAL | |||
| IARC Phenoxy Herbicide Cohort (mortality vs national mortality rates) | Dioxin, phenoxy herbicides | ||
| IARC cohort, female workers exposed to any phenoxy herbicide or chlorophenol |
1 | 0.3 (0.0-1.5) | |
| Exposed to highly chlorinated PCDDs | 0 | 0.0 (0.0-2.6) | |
| Not exposed to highly chlorinated PCDDs | 1 | 0.5 (0.0-2.5) | |
| IARC cohort | 1 | 0.7 (nr) | |
| New Zealand Production Workers—Dow plant in Plymouth, NZ (included in IARC cohort) | Dioxin, Phenoxy Herbicides |
||
| 1,599 production workers (male and female) vs national rates—mortality 1969 through 2004 | |||
| Ovarian cancer (ICD-I0C56) | 0 | 0.0 (0.0-9.5) | |
| Agricultural Health Study | Herbicides | ||
| US AHS | |||
| Private applicators (men and women) | 4 | 3.9 (1.1-10.1) | |
| Spouses of private applicators (> 99% women) | 13 | 0.7 (0.4-1.2) | |
| US AHS—incidence | |||
| Private applicators (men and women) | 8 | 3.0 (1.3–5.9) | |
| Spouses of private applicators (> 99% women) | 32 | 0.6 (0.4-0.8) | |
| Commercial applicators (men and women) | 0 | 0.0 (0.0-16.0) | |
| Other Agricultural Workers | Herbicides | ||
| Danish farmers—incidence | |||
| Self-employed farmers | 12 | 0.9 (nr) | |
| Family workers | 104 | 0.8 (p< 0.05) | |
| Employees | 5 | 0.5 (nr) | |
| Other Occupational Studies | Herbicides | ||
| Female residents near Alessandria, Italy | 18 | 4.4 (1.9-16.1) | |
| Reference | Study Populationa | Exposed Casesb |
Exposure of Interest/ Estimated Risk (95% CI)b |
| ENVIRONMENTAL | |||
| Seveso, Italy Residenlial Cohort | TCDD | ||
| Seveso residents—25-yr follow-up | |||
| Zone A | 1 | 1.2 (0.2-8.5) | |
| Zone B | 2 | 0.4 (0.1-1.6) | |
| Zone R | 37 | 1.0 (0.7-1.4) | |
| Pesalori et al., 2009 | Seveso—20-yr follow-up to 1996—incidence | ||
| Zone A | 1 | 1.1 (0.2-7.9) | |
| Zone B | 1 | 0.2 (0.0-1.3) | |
| Zone R | 45 | 1.1 (0.8-1.5) | |
| Seveso residents—20-yr follow-up | |||
| Zones A, B | 3 | 0.7 (0.2-2.0) | |
| Seveso residents—15-yr follow-up | |||
| Zone A | 1 | 2.3 (0.3-16.5) | |
| Seveso residents—15-yr follow-up | |||
| Zone A—women | 1 | 2.3 (0.0-12.8) | |
| Zone R—women | 21 | 1.0 (0.6-1.6) | |
ABBREVIATIONS: AHS, Agricultural Health Study; CI, confidence interval; COI, chemical of interest; IARC, International Agency for Research on Cancer; ICD, International Classification of Diseases; nr, not reported; NZ, New Zealand; PCDD, polychlorinated dibenzo-p-dioxin (highly chlorinated, if four or more chlorines); TCDD, 2,3,7,8-tetrachlorodibenxo-p-dioxin; VA, US Department of Veterans Affairs.
aSubjects are female, and outcome is mortality unless otherwise noted.
bGiven when available; results other than estimated risk explained individually.
dometrium, the RRs in Zones A, B, and R were 1.24 (95% CI 0.17–8.82), 0.6 (95% CI 0.19–1.87), and 0.73 (95% CI 0.49–1.1), respectively. The RRs for ovarian cancer in Zones A, B, and R were 1.11 (95% CI 0.16–7.90), 0.18 (95% CI 0.02–1.25), and 1.12 (95% CI 0.82–1.54), respectively.
Biologic Plausibility
Yoshizawa et al. (2009) have shown that chronic administration of TCDD and other AHR ligands to female adult Harlan Sprague-Dawley rats results in chronic inflammation and increases in reproductive-tissue tumors, including cystic endometrial hyperplasia and uterine squamous-cell carcinoma. The mechanism of action might be related to endocrine disruption and chronic inflammation. Hollingshead et al. (2008) also showed that TCDD activation of the AHR in human breast and endocervical cell lines induces sustained high concentrations
of the IL-6 cytokine, which has tumor-promoting effects in numerous tissues, including ovarian; thus, TCDD might promote carcinogenesis in these tissues.
The biologic plausibility of the carcinogenicity of the chemicals of interest is discussed in general at the beginning of this chapter.
Synthesis
New information concerning female reproductive cancers since Update 2008 was sparse and inconsistent. The results from the updated follow-up of residents of Seveso and the occupational study add little weight to the existing body of evidence.
Conclusion
On the basis of the evidence reviewed here and in previous VAO reports, the committee concludes that there is inadequate or insufficient evidence to determine whether there is an association between exposure to the chemicals of interest and uterine, ovarian, or cervical cancer.
ACS estimated that 217,730 new cases of prostate cancer (ICD-9 185) would be diagnosed in the United States in 2010 and that 32,050 men would die from it (Jemal et al., 2010). That makes prostate cancer the second-most common cancer in men (after nonmelanoma skin cancers); it is expected to account for about 28% of new cancer diagnoses and 11% of cancer deaths in men in 2010. The average annual incidence of prostate cancer is shown in Table 7-27.
The incidence of prostate cancer varies dramatically with age and race. The risk more than doubles from the ages of 50–54 years and 55–59 years, and it nearly doubles again from the ages of 55–59 years and 60–64 years. As a group, American black men have the highest recorded incidence of prostate cancer in the world (Miller et al., 1996); their risk is roughly twice that in whites in the
TABLE 7-27 Average Annual Incidence (per 100,000) of Prostate Cancer in United Statesa
| 55-59 Years Old | 60-64 Years Old | 65-69 Years Old | ||||||
| All Races | White | Black | All Races | White | Black | All Races | White | Black |
| 347.7 | 330.6 | 616.7 | 609.6 | 586.6 | 1,020.7 | 887.2 | 864.2 | 1,387.4 |
aSurveillance, Epidemiology, and End Results program, nine standard registries, crude age-specific rates, 2004–2008 (NCI, 2010).
United States, 5 times that in Alaska natives, and nearly 8.5 times that in Korean Americans. Little is known about the causes of prostate cancer. Other than race and age, risk factors include a family history of the disease and possibly some elements of the Western diet, such as high consumption of animal fats. The drug finasteride, which has been widely used to treat benign enlargement of the prostate, was found to decrease the prevalence of prostate cancer substantially in a major randomized trial (Thompson et al., 2003). Finasteride acts by decreasing the formation of potent androgen hormones in the prostate.
The study of the incidence of and mortality from prostate cancer is complicated by trends in screening for the disease. The widespread adoption of serum prostate-specific antigen (PSA) screening in the 1990s led to very large increases in prostate-cancer incidence in the United States, which have recently subsided as exposure to screening has become saturated. The long-term influence of better screening on incidence and mortality in any country or population is difficult to predict and will depend on the rapidity with which the screening tool is adopted, its differential use in men of various ages, and the aggressiveness of tumors detected early with this test (Gann, 1997). Because exposure to PSA testing is such a strong determinant of prostate-cancer incidence, epidemiologic studies must be careful to exclude differential PSA testing as an explanation of a difference in risk observed between two populations.
Prostate cancer tends not to be fatal, so mortality studies might miss an increased incidence of the disease. Findings that show an association between an exposure and prostate-cancer mortality should be examined closely to determine whether the exposed group might have had poorer access to treatment that would have increased the likelihood of survival.
Conclusions from VAO and Previous Updates
The committee responsible for VAO concluded that there was limited or suggestive evidence of an association between exposure to the chemicals of interest and prostate cancer. Additional information available to the committees responsible for Update 1996, Update 1998, Update 2000, Update 2002, Update 2004, Update 2006, and Update 2008 did not change that conclusion.
Table 7-28 summarizes results of the relevant studies, including both morbidity and mortality studies. The type, quality, and specificity of each study must be considered in the interpretation and weighing of evidence. Because of study heterogeneity, simply examining all the estimated risks in the table together will not yield a good assessment of the risks.
TABLE 7-28 Selected Epidemiologic Studies—Prostate Cancer
| Reference | Study Populationa | Exposed Casesb | Exposure of Interest/ Estimated Risk (95% CI)b |
| VIETNAM VETERANS | |||
| Air Force Ranch Hands—Ranch Hand veterans vs SEA veterans | All COIs | ||
| Pavuk el al.,2006 | AMIS subjects—incidence 20-year cumulative TCDD (ppt-year) |
||
| Comparison group | 81 | 1.0 | |
| Ranch Hand low (≤ 434 ppt-year) | 31 | 1.0(0.7-1.6) | |
| Ranch Hand high (> 434 ppt-year) | 28 | 1.2(0.8-1.9) p-trend = 0.42 |
|
| Last tour in SKA before 1969 (heavyspraying) | |||
| Yes | |||
| Comparison group | 17 | 1.0 | |
| Ranch Hand low (≤ 434 ppt-year) | 9 | 1.0(0.4-2.3) | |
| Ranch Hand high (> 434 ppt-year) | 15 | 2.3(1.1-4.7) p-trend = 0.04 |
|
| No | |||
| Comparison group | 64 | 1.0 | |
| Ranch Hand low (≤ 434 ppt-year) | 22 | 1.1(0.7-1.8) | |
| Ranch Hand high (> 434 ppt-year) | 13 | 0.9(0.5-1.6) p-trend = 0.75 |
|
| Less than 2 years served in SEA | |||
| Yes | |||
| Comparison group | 16 | 1.0 | |
| Ranch Hand low (≤ 434 ppt-year) | 20 | 1.9(1.0-3.7) | |
| Ranch Hand high (> 434 ppt-year) | 14 | 2.2(1.0-4.5) p-trend = 0.03 |
|
| No | |||
| Comparison group | 65 | 1.0 | |
| Ranch Hand low (≤ 434 ppt-year) | 11 | 0.8(0.4-1.5) | |
| Ranch Hand high (> 434 ppt-year) | 14 | 1.1(0.6-1.9) p-trend = 0.89 |
|
| Pavuk el al., 2005 | While Air Force comparison subjects only—incidence Serum TCDD (pg/g) based on model with exposure variable loge(TCDD) |
||
| Per unit increase of –loge(TCDD) Quaniles (pg/g) | 83 | 1.1(0.7-1.5) | |
| 0.4-2.6 | 13 | 1.0 | |
| 2.6-3.8 | 24 | 1.7(0.8-3.3) | |
| 3.8-5.2 | 24 | 1.5(0.7-2.9) | |
| >5.2 | 22 | 1.2(0.6-2.4) | |
| Reference | Study Populationa | Exposed Casesb | Exposure of Interest/ Estimated Risk (95% CI)b |
| Number of years served in SEA Per year of service |
83 | 1.1 (1.0-1.2) | |
| Quartiles (years in SIEA) | |||
| 0.8-1.3 | 8 | 1.0 | |
| 1.3-2.1 | 11 | 1.3 (0.5-3.2) | |
| 2.1-3.7 | 28 | 2.2 (1.0-4.9) | |
| 3.7-16.4 | 36 | 2.4 (1.1-5.2) | |
| Akhlar et al., 2004 | AFHS subjects vs national rales While AFHS Ranch Hand veterans | ||
| Incidence | 36 | 1.5 (1.0-2.0) | |
| With tours in 1966-1970 | 34 | 1.7 (1.2-2.3) | |
| Mortality | 2 | 0.7 (0.1-2.3) | |
| White AFHS comparison veterans | |||
| Incidence | 54 | 1.6 (1.2-2.1) | |
| With tours between 1966-1970 | 42 | 1.6 (1.2-2.2) | |
| Mortality | 3 | 0.8 (0.2-2.1) | |
| White AFHS subjects—incidence | |||
| Who spent at most 2 years in SIEA | |||
| Per unit increase of -loge(TCDD) | 28 | 1.5 (0.9-2.4) | |
| Comparison group | 7 | 1.0 | |
| Ranch Hand—< 10 TCDD pg/g in 1987 | 10 | 1.5 (0.5-4.4) | |
| Ranch Hand—< 118.5 TCDD pg/g at end of service | 6 | 2.2 (0.7-6.9) | |
| Ranch Hand—> 118.5 TCDD pg/g at end of service | 5 | 6.0 (1.4-24.6) | |
| Only Ranch Hands with 100% service in Vietnam and comparisons with no service in Vietnam | |||
| Per unit increase of –loge(TCDD) | 20 | 1.1 (0.6-1.8) | |
| Comparison group | 3 | 1.0 | |
| Ranch Hand—< 10 TCDD pg/g in | 9 | 2.5 (0.4-16.1) | |
| Ranch Hand—< 118.5 TCDD pg/g at end of service | 4 | 2.4 (0.4-16.0) | |
| Ranch Hand—> 118.5 TCDD pg/g at end of service | 4 | 4.7 (0.8-29.1) | |
| Air Force Ranch Hand veterans | 26 | 0.7 (0.4-1.3) | |
| Air Force Ranch Hand veterans | 2 | 0.6 expected | |
| Reference | Study Populationa | Exposed Casesb | Exposure of Interest/ Estimated Risk (95% CI)b |
| US VA Cohort of Armv Chemical Corps | All COIs | ||
| Cypcl and Kang. 2010 | ACC—deployed vs nondeployed and vs US men (Vietnam-service status throught 2005) | ||
| Deployed vs nondeployed | 5 vs 2 | 1.0 (0.2-5.6) | |
| ACC veterans vs US men | |||
| Vietnam cohort | 5 | 1.1 (0.3-2.5) | |
| Non-Vietnam cohort | 2 | 0.95 (0.1-3.4) | |
| US CDC Vietnam Kxperience Study | All COIs | ||
| Follow-up of CDC VES cohort | 1 | 0.4 (nr) | |
| Department of Veterans Affairs | All COIs | ||
| US Army and Marine Corps Vietnam veterans | |||
| Army Vietnam Service | 58 | 1.1 (nr) | |
| Non-Vietnam | 1 | 1.2 (nr)c | |
| Marine Vietnam Service | 9 | 1.2 (nr) | |
| Non-Vietnam | 6 | 1.3 (nr) | |
| Army Vietnam veterans | 30 | 0.9 (0.6-1.2) | |
| Marine Vietnam veterans | 5 | 1.3 (0.2-10.3) | |
| State Studies of US Vietnam Veterans | All COIs | ||
| Vietnam-era veterans in northern California | 239 | 2.9 (2.3-3.6) | |
| Veterans Affairs Health System—self-reported exposure to Agent Orange | |||
| Veterans using the VA Medical Center in Ann Arbor, Michigan | |||
| All cases | 11 | OR 2.1 (0.8-5.2) | |
| Cases in white veterans only | nr | OR 2.7 (0.9-8.2) | |
| Massachusetts Vietnam veterans—incidence | 15 | 0.8 (0.4-1.6) | |
| PM study of deaths (1974-1989) of Michigan | |||
| Vietnam-era veterans—deployed vs nondeployed | |||
| Male genital system | 19 | 1.1 (0.6-1.7) | |
| Wisconsin Vietnam veterans | 0 | nr | |
| Other Studies of US Vietnam Veterans | All COIs | ||
| Veterans with radical prostatectomies examined in VA Healthcare facilities | |||
| AO-exposed veterans with biochemical progression | nr | 1.5 (1.1-2.0) | |
| Australian Vietnam Veterans vs Australian Population | All COIs | ||
| O’Toole et al., 2009 | Survey of Australian Vietnam Veterans compared to the Australian general population | nr | 1.3 (0.3-6.7) |
| Australian male Vietnam veterans vs Australian population—incidence | 692 | 1.3 (1.2-1.3) | |
| Navy | 137 | 1.2 (1.0-1.4) | |
| Army | 451 | 1.8 (1.2-1.4) | |
| Air Force | 104 | 1.3 (1.0-1.5) | |
| Reference | Study Populationa | Exposed Casesb | Exposure of Interest/ Estimated Risk (95% CI)b |
| ADVA, 2005b | Australian male Vietnam veterans vs Australian population—mortality | 107 | 1.2(1.0-1.5) |
| Navy | 22 | 1.3(0.8-1.8) | |
| Army | 65 | 1.2(0.9-1.5) | |
| Air Force | 19 | 1.4(0.8-2.1) | |
| AIIIW, 1999 | Auslralian Vietnam veterans—incidence (validation study) | 212 | Expected number of exposed cases (95%CI) 147(123-171) |
| CDVA, 1998a | Australian Vietnam veterans—self-reported incidence | 428 | 147(123-171) |
| CDVA, 1997a | Australian military Vietnam veterans | 36 | 1.5(1.0-2.0) |
| Australian Conscripted Army National Service (deployed vs nondeployed) | All COIs | ||
| ADVA, 2005c | Australian male conscripted Army National Service Vietnam-era veterans | ||
| Incidence | 65 | 1.2(0.9-1.5) | |
| Mortality | 0 | 0.0 (0.0-0.7) | |
| Other Australian Vietnam Veterans | All COIs | ||
| Leavy ct al.,2006 | 606 prostate cancer cases in Western Australia Vietnam service | 25 | 2.1(0.9-5.1) |
| OCCUPATIONAL | |||
| IARC Phenoxy Herbicide Cohort (mortality vs national mortality rates) | Dioxin, phenoxy herbicides | ||
| Kogevinas etal., 1997 | IARC cohort, workers exposed to any phenoxy herbicide or chlorophenol | 68 | 1.1(0.9-1.4) |
| Exposed to highly chlorinated PCDDs | 43 | 1.1(0.8-1.5) | |
| Not exposed to highly chlorinated PCDDs | 25 | 1.1(0.7-1.6) | |
| Saracci et al., 1991 | IARC cohort—exposed subcohort | 30 | 1.1(0.8-1.6) |
| NIOSH Mortality Cohort (12 US plants, production 1942-1984) (included in IARC cohort) | Dioxin, phenoxy herbicides | ||
| Stccnland et al., 1999 | US chemical production workers | 28 | 1.2(0.8-1.7) |
| Fingerhut etal., 1991 | NIOSH—entire cohort | 17 | 1.2(0.7-2.0) |
| ≥1-yr exposure, ≥ 20-yr latency | 9 | 1.5(0.7-2.9) | |
| Monsanto Plant—Nitro, WV (included in IARC and NIOSH cohort) | Dioxin, phenoxy herbicides | ||
| Collins etal., 1993 | Monsanto Company workers | 9 | 1.6(0.7-3.0) |
| Reference | Study Populationa | Exposed Casesb | Exposure of Interest/ Estimated Risk (95% CI)b |
| Dow Chemical Company—Midland. MI (included in IARC and NIOSH cohorts) | Dioxin, phenoxy herbicides | ||
| Collins et al., 2009a | Trichlorophenol workers | 21 | 1.4(0.9-2.2) |
| Collins et al., 2009b | Pentachlorophenol workers | 8 | 1.0(0.4-1.9) |
| Bodner et al., 2003 | Dow chemical production workers (included in IARC cohort, NIOSH Dioxin Registry) | nr | 1.7(1.0-2.6) |
| Burns et al., 2001 | Dow 2.4-D production workers (included in IARC cohort. NIOSH Dioxin Registry) | 7 | 1.3(0.5-2.8) |
| Bond et al., 1988 | Dow 2.4-D production workers (included in IARC cohort, NIOSH Dioxin Registry) | 1 | 1.0(0.0-5.8) |
| BASF Production Workers {included in IARC cohort) | Dioxin, phenoxy herbicides | ||
| Ott and Zober, 1996 | BASF employees—incidence | ||
| TCDD < 0.1 μg/kg of body weight | 4 | 1.1 (0.3-2.8) | |
| TCDD 0.1-0.99 μg/kg of body weight | 1 | 1.1 (0.0-5.9) | |
| Zober et al., 1990 | BASF employees—basic cohort | 0 | 90% CI nr (0.0-6.1) |
| Danish Production Workers (included in IARC cohort) | Dioxin, phenoxy herbicides | ||
| Lynge, 1985 | Danish production workers—incidence | 9 | 0.8 (nr) |
| Dutch Production Workers (included in IARC cohort) | Dioxin, phenoxy herbicides | ||
| Boers et al.,2010 | Dutch chlorophenoxy workers | ||
| Factory A (HR for exposed vs unexposed) | 6 vs 2 | 2.9 (0.6-14.2) | |
| Factory B (HR for exposed vs unexposed) | 4 vs 2 | 2.7 (0.5-14.9) | |
| Bueno de Mesquita et al., 1993 | Dutch phenoxy herbicide workers (included in IARC cohort) | 3 | 2.6 (0.5-7.7) |
| German Production Workers (included in IARC cohort) | Dioxin, phenoxy herbicides | ||
| Becher et al., 1996 | German production workers | 9 | 1.3 (nr) |
| Manz et al., 1991 | German production workers—men, women | 7 | 1.4(0.6-2.9) |
| New Zealand Production Workers—Dow plant in Plymouth ,NZ (included in IARC cohort) | Dioxin, phenoxy herbicides | ||
| McBride et al., 2009a | 1.599 production workers (male and female) vs national rates—mortality 1969 through 2004 | ||
| Ever-exposed workers | 1 | 0.2(0.0-1.2) | |
| Never-exposed workers | 2 | 1.9(0.2-6.7) | |
| 't Mannetje et al., 2005 | Phenoxy herbicide producers | 1 | 0.4(0.0-2.1) |
| Phenoxy herbicide sprayers (> 99% men) | 2 | 0.6(0.1-2.2) | |
| Reference | Study Populationa | Exposed Casesb | Exposure of Interest/ Estimated Risk (95% CI)b |
| United Kingdom Production Workers (included in IARC cohort) | Dioxin, plienoxy herbicides | ||
| Coggon et al., 1986 | British MCPA production workers | 18 | 1.3(0.8-2.1) |
| Agrlcultuml Health Study | Herbicides | ||
| Samanic et al., 2006 | Pesticide applicators in AHS—prostate cancer incidence from enrollment through 2002 Dicamba—lifetime days exposure | ||
| None | 343 | 1.0 | |
| 1- < 20 | 106 | 1.0(0.8-1.3) | |
| 20-<56 | 102 | 0.9(0.7-1.2) | |
| 56- <116 | 76 | 1.0(0.7-1.3) | |
| ≥ 116 | 67 | 1.1 (0.8-1.5) p-trend = 0.45 |
|
| Alavanja et al., 2005 | US AHS—incidence | ||
| Private applicators | 1.046 | 1.3(1.2-1.3) | |
| Spouses of private applicators (> 99% women) | 5 | 1.2(0.4-2.8) | |
| Commercial applicators | 41 | 1.4(1.0-1.9) | |
| Blair et al., 2005a | US AHS | ||
| Private applicators | 48 | 0.7 (0.5-0.8) | |
| Spouses of private applicators (> 99% women) | 0 | 0.0(0-1.6) | |
| Alavanja et al., 2003 | US AHS—pesticide appliers in Iowa and North Carolina—incidence | 566 | 1.1 (1.1-1.2) |
| Other Agricultural Workers | Herbicides | ||
| Hansen et al., 2007 | Danish gardeners (male genital organs, ICD-7 177-178)—incidence | ||
| 10-yr follow-up (1975-1984) reported in | 20 | 1.2(0.7-1.8) | |
| Hansen etal. (1992) 25-yr follow-up (1975-2001) |
|||
| Bom before 1915 (high exposure) | 39 | 1.3(1.0-1.8) | |
| Bom 1915—1934 (medium exposure) | 35 | 0.9(0.6-1.2) | |
| Bom after 1934 (low exposure) | 3 | 0.4(0.1-1.3) | |
| Sharma-Wagner et al., 2000 | Swedish citizens Agriculture, stock raising |
6,080 | 1.1 (1.0-1.1) (p<0.01) |
| Farmers, foresters, gardeners | 5,219 | 1.1 (1.0-1.1) (p<0.01) |
|
| Paper-mill workers | 304 | 0.9(0.8-1.0) | |
| Pulp grinding | 39 | 1.4(1.0-1.9) (p< 0.05) |
|
| Gambini et al., 1997 | Italian rice growers | 19 | 1.0(0.6-1.5) |
| Blair et al., 1993 | US farmers in 23 states | ||
| Whites | 3,765 | 1.2(1.1-1.2) | |
| Nonwhites | 564 | 1.1 (1.1-1.2) | |
| Reference | Study Populationa | Exposed Casesb | Exposure of Interest/ Estimated Risk (95% CI)b |
| Morrison et al., 1993 | Canadian farmers. 45–69 yrs of age, no employees, or custom workers, sprayed ≥ 250 acres | 20 | 2.2(1.3-3.8) |
| Ronco et al., 1992 | Danish farm workers—incidence | ||
| Self-employed | 399 | 0.9 (p< 0.05) | |
| Employee | 63 | 0.8 (p< 0.05) | |
| Alavanja et al., 1988 | USDA agricultural extension agents | nr | 1.0(0.7-1.5) |
| Burmeister et al., 1983 | Iowa residents—farm exposures | 4, 827 |
1.2 (p< 0.05) |
| Wiklund, 1983 | Swedish male agricultural workers | 3,890 | 99% CI 1.0(0.9-1.0) |
| Burmeister, 1981 | Iowa farmers | 1,138 | 1.1 (p<0.01) |
| Dutch Pesticide Applicators | Herbicides | ||
| Swaen et al., 2004 | Dutch licensed herbicide applicators | 6 | 1.0(0.4-2.2) |
| Swaen et al., 1992 | Dutch licensed herbicide applicators | 1 | 1.3(0.0-7.3) |
| Other Studies of Herbicide and Pesticide Applicators | Herbicides | ||
| Fleming et al., 1999a | Florida pesticide appliers | 353 | 1.9(1.7-2.1) |
| Fleming et al., 1999b | Florida pesticide appliers | 64 | 2.4(1.8-3.0) |
| Dich and Wiklund, 1998 | Swedish pesticide appliers | 401 | 1.1 (1.0-1.2) |
| Bom 1935 or later | 7 | 2.0 (0.8-4.2) | |
| Bom before 1935 | 394 | 1.1 (1.0-1.2) | |
| Zhong and Rafnsson, 1996 | Icelandic pesticide users | 10 | 0.7(0.3-1.3) |
| Asp et al., 1994 | Finnish herbicide applicators | ||
| Incidence | 6 | 0.4(0.1-0.8) | |
| Mortality | 5 | 0.8(0.3-1.8) | |
| Torch io et al., 1994 | Italian licensed pesticide users | 1.0(0.7-1.2) | |
| Blair et al., 1983 | Florida pesticide applicators | Expected number of exposed cases (95% CI) | |
| 2 | 3.8 (nr) | ||
| Forestry Workers | Herbicides | ||
| Thorn et al.,2000 | Swedish lumberjacks exposed to phenoxyacetic herbicides | ||
| Foremen—incidence | 2 | 4.7 (nr) | |
| Male lumberjacks—incidence | 3 | 0.9 (nr) | |
| Reference | Study Populationa | Exposed Casesb | Exposure of Interest/ Estimated Risk (95% CI)b |
| Hcrlzman et al., 1997 | Canadian sawmill workers Morbidity | 282 | 1.0(0.9-1.1) |
| Mortality from male genital tract cancers | 116 | 1.2(1.0-1.4) | |
| Alavanja et al., 1989 | USDA forest conservationists | nr | 1.6(0.9-3.0) |
| Soil conservationists | nr | 1.0(0.6-1.8) | |
| Reifetal., 1989 | New Zealand forestry workers—nested case-control —incidence | 12 | 0.7(0.4-1.3) |
| Paper and Pulp Workers | Dioxin | ||
| McLean et al., 2006 | IARC cohort of pulp and paper workersExposure to nonvolatile organochlorine compounds | ||
| Never | 117 | 0.9(0.7-1.0) | |
| Ever | 84 | 0.9(0.7-1.2) | |
| Henneberger et al., 1989 | New Hampshire pulp and paper workers | 9 | 1.0(0.5-1.9) |
| Solet et al.,1989 | US paper and pulp workers | 4 | 1.1(0.3-2.9) |
| Robinson et al., 1986 | Northwestern US paper and pulp workers | 17 | 90% CI 1.2(0.7-1.7) |
| ENVIRONMENTAL | |||
| Seveso, Italy Residential Cohort | TCDD | ||
| Consonni et al, 2008 | Seveso residents—25-yr follow-up to 2001—men, women | ||
| Zone A | 1 | 0.9(0.1-6.2) | |
| Zone B | 8 | 0.9(0.4-1.8) | |
| Zone R | 65 | 1.1(0.8-1.4) | |
| Pesatori et al., 2009 | Seveso—20-yr follow-up to 1996—incidence | ||
| Zone A | 0 | ||
| Zone B | 7 | 0.9 (0.5-2.0) | |
| Zone R | 39 | 0.8(0.5-1.1) | |
| Bertazzi et al., 2001 | Seveso residents—20-yr follow-up | ||
| Zones A, B—men | 8 | 1.1(0.5-2.2) | |
| Bertazzi el al., 1997 | Seveso residents—15-yr follow-up | ||
| Zone B—men | 6 | 1.2(0.5-2.7) | |
| Zone R—men | 39 | 1.2(0.8-1.6) | |
| Bertazzi el al., 1993 | Seveso residents—10-yr follow-up—incidence | ||
| Zone R—men | 16 | 0.9(0.5-1.5) | |
| Pesatori et al., 1992 | Seveso residents—incidence | ||
| Zones A, B—men | 4 | 1.4(0.5-3.9) | |
| Zone R—men | 17 | 0.9(0.6-1.5) | |
| Bertazzi et al., 1989a | Seveso residents—10-yr follow-up | ||
| Zones A, B, R—men | 19 | 1.6(1.0-2.7) | |
| Reference | Study Populationa | Exposed Casesb | Exposure of Interest/ Estimated Risk (95% CI)b |
| Bertazzi et al., 1989b | Seveso residents—10-yr follow-up | ||
| Zone B—men | 3 | 2.2 (0.7-6.9) | |
| Zone R—men | 16 | 1.6(0.9-2.7) | |
| Other Knvironmenlal Studies | Serum dioxin | ||
| Turunen et al., 2008 | Finnish fishermen and spouses | 36 | 0.99(0.7-1.4) |
| Svensson et al., 1995 | Swedish fishermen—mortality | ||
| Organochlorine compounds | |||
| East coast | 12 | 1.0(0.5-1.8) | |
| West coast | 123 | 1.1 (0.9-1.3) | |
| Swedish fishermen—incidence | |||
| East coast | 38 | 1.1 (0.8-1.5) | |
| West coast | 224 | 1.0(0.9-1.1) | |
ABBREVIATIONS: 2,4-D, 2,4-dichlorophenoxyacetic acid; ACC, Army Chemical Corps; AFHS, Air Force Health Study; AHS, Agricultural Health Study; AO, Agent Orange; CDC, Centers for Disease Control and Prevention; CI, confidence interval; COI, chemical of interest; HR, hazard ratio; IARC, International Agency for Research on Cancer; ICD, International Classification of Diseases; MCPA, 2-methyl-4-chlorophenoxyacetic acid; MI, Michigan; NIOSH, National Institute for Occupational Safety and Health; nr, not reported; NZ, New Zealand; OR, odds ratio; PCDD, polychlorinated dibenzo-p-dioxin (highly chlorinated, if four or more chlorines); PM, proportionate mortality; SEA, Southeast Asia; TCDD, 2,3,7,8-tetrachlorodibenzo-p-dioxin; USDA, US Department of Agriculture; VA, US Department of Veterans Affairs; VES, Vietnam Experience Study; WV, West Virginia.
aSubjects are male and outcome is mortality unless otherwise noted.
bGiven when available; results other than estimated risk explained individually.
cStatistically significant with the 95% CI not including 1.0.
Update of the Epidemiologic Literature
Vietnam-Veteran Studies
Among Australian Vietnam veterans, O’Toole et al. (2009) extended follow-up to 36 years after the war. The relative prevalence of prostate cancer (compared with that in the general population) was 1.29 (95% CI 0.34–6.73) on the basis of a sample size of 450 veterans.
Cypel and Kang (2010) studied 2,872 ACC veterans and compared them with 2,737 non-Vietnam veterans or US men. When Cox adjusted analyses were used, the prostate-cancer mortality in ACC veterans compared with non-Vietnam veterans was 1.02 (95% CI 0.19–5.64); there were five observed deaths in the Vietnam cohort and two in the non-Vietnam cohort. The Cox proportional hazards survival analysis adjusted for race, rank, duration of military service, and age at
entry into follow-up. In the analysis in which the ACC veterans were compared with US men, the result was 1.05 (95% CI 0.34–2.45) for five observed cases.
Shah et al. (2009) investigated the association of Agent Orange exposure with prostate-cancer clinicopathologic characteristics, rates of biochemical progression after treatment, and PSA doubling time after recurrence of prostate cancer in patients that had radical prostatectomy (RP). The study population consisted of 1,495 veterans who had undergone RP during 1988–2007 at Veterans Affairs Health Care Facilities in West Los Angeles and Palo Alto, California, Augusta, Georgia, and Durham, North Carolina; veteran’s data was abstracted from the Shared Equal Access Regional Cancer Hospital (SEARCH) database. The authors noted that the men were grouped by the presence or absence of Agent Orange exposure, but a detailed explanation of the criteria used to determine the presence of exposure was not given. After adjustment for clinical variables, there was no significant association of Agent Orange exposure with odds of a pathologic Gleason sum, positive surgical margins, extracapsular extension, or seminal vesicle invasion. During a mean follow-up of 60 months (with a standard deviation of 46 months), men who were exposed to Agent Orange were more likely to progress than men who were not exposed; after adjustment for clinicopathologic findings, they had an increased RR of biochemical progression of 1.47 (95% CI 1.08–2.00). In the 501 men who had PSA recurrence, the PSA doubling time (PSADT) was available for 298 men. Agent Orange exposure was associated with a significantly shorter mean adjusted PSADT (8.2 vs 18.6 months). Study limitations include the potential for more aggressive screening for prostate cancer in men who had been exposed to Agent Orange, which led to earlier diagnosis. A second limitation is that only men with RP were included; that is, men who had more advanced disease were excluded, so an association of Agent Orange with more advanced disease could not be studied. A final limitation is that Agent Orange exposure was not quantified and was assessed subjectively. The authors note that there is potential concern with exposure assignment because there are financial incentives to associate their diagnosis with a history of Agent Orange exposure; this limits the relevance of the results.
Occupational Studies
Boers et al. (2010) published results of the third follow-up of the retrospective Dutch cohort study in two chlorophenoxy herbicide manufacturing factories (Plant A and Plant B). The authors extended follow-up an additional 15 years through the end of 2006 and included data from Plant B that had previously not been included, because of the small number of deaths reported at the last follow-up. The data from the two plants were analyzed separately because exposure to phenoxy herbicides and dioxins was considered to differ between factories. In Plant A, there were 539 exposed male workers and 482 unexposed workers. In Plant B, there were 411 male workers classified as exposed and 626 classified as unexposed. Although the follow-up period is long, the cohort is moderate in size and would have limited
power to detect increases in rare cancers. The authors reported increased HRs for prostate cancer that were consistent with earlier published analyses. Specifically, the risk in Plant A (HR = 2.93, 95% CI 0.61–14.15) was based on six and two deaths in the exposed and unexposed workers, respectively. The risk in Plant B (HR = 2.68, 95% CI 0.48–14.85) was based on four and two deaths in exposed and unexposed workers, respectively. For all genital cancers, the HR was increased, but not significantly (HR = 3.28, 95% CI 0.63–17.15).
Collins et al. (2009a) published updated results from a Dow Chemical Company site in Michigan. They followed 1,615 workers who were exposed to dioxins in a TCP production plant. Serum dioxin measurements in a set of 280 (17%) workers were used to estimate historical TCDD exposure of all workers. Serum TCDD concentrations were higher than in the unexposed and the general population. Workers were followed from 1942 to 2003. There was an increase (but not a statistically significant increase) in SMR for prostate cancer (SMR = 1.4, 95% CI 0.9–2.2 in all TCP workers; SMR = 1.5, 95% CI 0.9–2.4 when 196 workers who also had PCP exposure were excluded).
Collins et al. (2009b) examined mortality rates among 773 workers in a PCP manufacturing facility who were exposed to dioxins during PCP manufacturing during 1937–1980. Serum dioxin measurements were used to estimate exposure to five dioxins, including TCDD. In all PCP workers, the SMR was 1.0 (95% CI 0.4–1.9), and the number of observed deaths was eight. When they excluded 196 workers who also had TCP exposure, the SMR was 1.0 (95% CI 0.4–2.1) on the basis of seven observed deaths.
McBride et al. (2009a,b) extended their earlier analyses by including additional exposed and unexposed workers, constructing exposure estimates based on serum dioxin (TCDD) in exposed and unexposed workers, and extending follow-up for 4 additional years. The authors reported on the mortality experience of 1,599 workers employed during 1969–1988 at a New Zealand site that manufactured TCP and a nearby field station where 2,4,5-T was occasionally used and tested (McBride et al., 2009a). Serum measurements from 346 blood samples confirmed higher exposure than New Zealand background. The study was limited by a high loss of follow-up (21%). The SMR for ever-exposed workers was 0.2 (95% CI 0.0–1.2) on the basis of one observed death. The SMR for never-exposed workers was 1.9 (95% CI 0.2–6.7) on the basis of two observed deaths. It should be noted that the authors reported increased SMRs for other cancers previously found to be associated with dioxins. The results in McBride et al. (2009b) have not been included because they were diluted by inclusion of a set of workers who had no opportunity for TCDD exposure and no observed deaths.
Environmental Studies
Pesatori et al. (2009) updated cancer-incidence results for the study of residents of Seveso. Poisson regression models were used to calculate sex-, age-, and
period-adjusted rate ratios. The use of exposure zones (A, B, and R) to define individual exposure introduces misclassification, which is likely to be random and to attenuate associations. However, later serum measurements on a subset confirmed the utility of using zone of residence as a proxy for exposure to TCDD. For prostate cancer, none of the RRs (95% CI) were increased: for Zones A, B, and R the RRs were not calculable, 0.94 (95% CI 0.45–1.99), and 0.75 (95% CI 0.54–1.05), respectively.
Turunen et al. (2008) conducted a mortality study of Finnish fishermen and their wives. The cohort consisted of 6,410 Finnish professional fishermen and 4,260 wives. The cohort was linked with Statistics Finland’s national cause-of-death data for 1980–2005. SMRs were calculated by using national mortality figures. The SMR for prostate cancer was 0.99 (95% CI 0.69–1.36) on the basis of 36 observed deaths.
Biologic Plausibility
Prostate cells and prostatic-cancer cell lines are responsive to TCDD in induction of various genes, including those involved in drug metabolism. Simanainen et al. (2004a) used different rat lines (TCDD-resistant Hans/Wistar and TCDD-sensitive Long Evans) and showed that TCDD treatment resulted in a significant decrease in the weight of prostate lobes, but the effect did not appear to be line-specific. In contrast, the TCDD-related reduction in sperm appears to be line-specific and not fully related to the effects of TCDD on serum testosterone (Simanainen et al., 2004b). TCDD effects appear to occur through actions on the urogenital sinus (Lin et al., 2004). In utero and lactational exposure to TCDD appears to retard the aging process in the prostate (Fritz et al., 2005). In a follow-up, progeny mice of a genetic cross between AHR-null mice and the transgenic adenocarcinoma of the mouse prostate (TRAMP) strain that models prostate cancer showed that the presence of the AHR inhibited the formation of prostate tumors that have a neuroendocrine phenotype (Fritz et al., 2008). In agreement with a possible protective role, negative associations were found in the AFHS between the risk of benign prostate hyperplasia and both TCDD exposure and serum testosterone concentration (Gupta et al., 2006).
The biologic plausibility of the carcinogenicity of the chemicals of interest is discussed in general at the beginning of this chapter.
Synthesis
The results on Australian and US ACC Vietnam veterans are weak but consistent with the previous finding of suggestive evidence of an association between the chemicals of interest and prostate cancer. The few occupational and environmental studies published since Update 2008 do not provide substantial evidence for or against the earlier conclusion. The previously existing body of epidemio-
logic evidence supporting an association between exposure to the chemicals of interest and prostate cancer is robust enough that the committee’s judgment that there is limited or suggestive evidence of an association is not reversed by the largely negative results in experimental systems.
Analysis of data from VA medical facilities by Shah et al. (2009) found indicators of poor prognosis were associated with self-reported Agent Orange exposure of veterans who had already had radical prostatectomies for diagnosed prostate cancer. The committee had some reservations about possible bias associated with self-reporting of Agent Orange exposure. Furthermore, this interesting finding does not directly address a role of Agent Orange in the occurrence of prostate cancer.
Conclusion
On the basis of the evidence reviewed here and in previous VAO reports, the committee concludes that there remains limited or suggestive evidence of an association between exposure to at least one of the chemicals of interest and prostate cancer.
ACS estimated that 8,480 men would receive diagnoses of testicular cancer (ICD-9 186.0–186.9) in the United States in 2010 and that 350 men would die from it (Jemal et al., 2010). Other cancers of the male reproductive system that are infrequently reported separately are cancers of the penis and other male genital organs (ICD-9 187). The average annual incidence of testicular cancer is shown in Table 7-29.
Testicular cancer occurs more often in men younger than 40 years old than in older men. On a lifetime basis, the risk in white men is about 4 times that in black men. Cryptorchidism (undescended testes) is a major risk factor for testicular cancer. Family history of the disease also appears to be a risk factor. Several other hereditary, medical, and environmental risk factors have been suggested, but the results of research are inconsistent (Bosl and Motzer, 1997).
TABLE 7-29 Average Annual Incidence (per 100,000) of Testicular Cancer in United Statesa
| 55-59 Years Old | 60-64 Years Old | 65-69 Years Old | ||||||
| All Races | White | Black | All Races | White | Black | All Races | White | Black |
| 2.8 | 3.3 | 0.3 | 1.5 | 1.6 | 0.8 | 1.3 | 1.4 | 0.6 |
aSurveillance, Epidemiology, and End Results program, nine standard registries, crude age-specific rates, 2004–2008 (NCI, 2010).
Conclusions from VAO and Previous Updates
The committee responsible for VAO concluded that there was inadequate or insufficient information to determine whether there is an association between exposure to the chemicals of interest and testicular cancer. Additional information available to the committees responsible for Update 1996, Update 1998, Update 2000, Update 2002, Update 2004, Update 2006, and Update 2008 did not change that conclusion. Table 7-30 summarizes the results of the relevant studies.
Update of the Epidemiologic Literature
Vietnam-Veteran Studies
Cypel and Kang (2010) studied 2,872 ACC veterans and compared them with 2,737 non-Vietnam veterans or US men. Using Cox adjusted analyses, the testicular-cancer mortality for ACC veterans compared with non-Vietnam veterans was not calculable; there were two observed deaths in the Vietnam cohort and none in the non-Vietnam cohort. When the ACC veterans were compared with US men, the SMR was 3.63 (95% CI 0.44–13.1) on the basis of two observed cases.
Occupational Studies
Collins et al. (2009a) published updated results from a Dow Chemical Company site in Michigan. They followed 1,615 workers who had been exposed to dioxins in a TCP production plant. Serum dioxin measures in a set of 280 (17%) workers were used to estimate historical TCDD exposure of all workers. Serum TCDD concentrations were higher than in the unexposed and the general population. Workers were followed from 1942 to 2003. There was an increase in SMR (but not a statistically significant one) for testicular cancer in all TCP workers (SMR = 1.6, 95% CI 0.0–8.9). When workers who also had PCP exposure were excluded, the SMR was 1.8 (95% CI 0.0–10.1).
Collins et al. (2009b) examined mortality in 773 workers who had been exposed to dioxins during PCP manufacturing during 1937–1980. Serum dioxin concentrations were used to estimate exposure to five dioxins, including TCDD. No deaths from testicular cancer were observed.
McBride et al. (2009a,b) extended their earlier analyses by including additional exposed and unexposed workers, constructing exposure estimates based on serum dioxin (TCDD) concentrations in exposed and unexposed workers, and extending follow-up for 4 additional years. The authors reported on the mortality experience of 1,599 workers employed during 1969–1988 at a New Zealand site that manufactured TCP and at a nearby field station where 2,4,5-T was occasionally used and tested (McBride et al., 2009a). Serum measurements from 346 blood samples confirmed higher exposure than New Zealand background. The
TABLE 7-30 Selected Epidemiologic Studies—Testicular Cancer
| Reference | Study Populationa | Exposed Casesb | Exposure of Interest/ Estimated Risk (95% CI)b |
| VIETNAM VETERANS | |||
| US Air Force Health Study—Ranch Hand veterans vs SEA veterans | All COIs | ||
| Air Force Ranch Hand veterans | 3 | nr | |
| US VA Cohort of Armv Chemical Coins | All COIs | ||
| ACC veterans (deployed vs nondeployed) vs US men | |||
| Vietnam cohort | 2 | 3.6 (0.4-13.1) | |
| Army Chemical Corps veterans | 2 | 4.0 (0.5-14.5) | |
| US VA Mortality Study of Army and Marine Veterans (ground troops serving July 4,1965-March 1,1973) | All COIs | ||
| Watanabe | Army Vietnam service | 114 | 1.1 (nr) |
| and Kang, 1996 | Marine Vietnam service | 28 | 1.0 (nr) |
| Army Vietnam veterans | 109 | 1.2 (ns) | |
| Marine Vietnam veterans | 28 | 0.8 (ns) | |
| Army Vietnam veterans | 90 | 1.1 (0.8-1.5) | |
| Marine Vietnam veterans | 26 | 1.3 (0.5-3.6) | |
| VA Case-Control Studies | All COIs | ||
| Bull man et al., 1994 | Navy veterans | 12 | 2.6 (1.1-6.2) |
| Australian Vietnam Veterans vs Australian Population | All COIs | ||
| Australian male Vietnam veterans vs Australian population—incidence | 54 | 0.9 (0.6-1.1) | |
| Navy | 17 | 1.2 (0.7-1.8) | |
| Army | 34 | 0.8 (0.5-1.0) | |
| Air Force | 3 | 0.8 (0.2-2.3) | |
| Australian male Vietnam veterans vs Australian population—mortality | 14 | 0.9 (0.4-1.4) | |
| Navy | 3 | 0.8 (0.2-2.4) | |
| Army | 10 | 0.9 (0.4-1.7) | |
| Air Force | 0 | 0.0 (0.0-3.3) | |
| AIIIW, 1999 | Australian Vietnam veterans—incidence (validation study) | 59 | Expected number of exposed cases (95% CI) 110 (89-139) |
| Australian Vietnam veterans—self-reported incidence | 151 | 110 (89-131) | |
| Australian military Vietnam veterans | 4 | ns | |
| Reference | Study Populationa | Exposed Casesb | Exposure of Interest/ Estimated Risk (95% CI)b |
| Australian Conscripted Army National Service (deployed vs nondcploy) | All COIs | ||
| ADVA, 2005c | Australian male conscripted Army National Service Vietnam-era veterans—deployed vs non-deployed | ||
| Incidence | 17 | 0.7(0.4-1.2) | |
| Mortality | 4 | 0.8 (0.2-2.0) | |
| CDVA, 1997b | Australian National Service Vietnam veterans | 1 | 1.3 |
| State Studies of US Vietnam Veterans | All COIs | ||
| Clapp, 1977 | Massachusetts Vietnam veterans—incidence | 30 | 1.2(0.4-3.3) |
| Anderson et al., 1986 | Wisconsin Vietnam veterans | 9 | 1.0(0.5-1.9) |
| Other Studies of US Vietnam Veterans | All COIs | ||
| Tarone et al., 1991 | Patients in three Washington, DC. area hospitals | 31 | 2.3(1.0-5.5) |
| OCCUPATIONAL | |||
| IARC Phenoxy Herbicide Cohort (mortality vs national mortality rates) | |||
| Kogevinas et al., 1997 | IARC cohort, workers exposed to any phenoxy herbicide or chlorophenol | 68 | 1.1 (0.9-1.4) |
| Exposed to highly chlorinated PCDDs | 43 | 1.1 (0.8-1.5) | |
| Not exposed to highly chlorinated PCDDs | 25 | 1.1 (0.3-1.6) | |
| Saracci et al., 1991 | IARC cohort exposed subcohort | 7 | 2.3 (0.9-4.6) |
| Dow Chemical Company—Midland, MI (included in IARC and NIOSH cohorts) | Dioxin, phenoxy herbicides | ||
| Collins et al., 2009a | Trichlorophenol workers Testes and other male genital |
1 | 1.6(0.0-8.9) |
| Collins et al., 2009b | Pentachlorophenol workers Testes and other male genital |
0 | 0.0(0.0-12.5) |
| Burns et al., 2001 | Dow chemical production workers | 1 | 2.2 (0.0-12.5) |
| Ramlow et al., 1996 | Dow pentachlorophenol production workers | 0 | nr |
| Reference | Study Populationa | Exposed Casesb | Exposure of Interest/ Estimated Risk (95% CI)b |
| Bond et al., 1988 | Dow 2,4-D production workers | 1 | 4.6 (0.0-25.7) |
| New Zealand Production Workers—Dow plant in Plymouth, NZ (included in IARC cohort) | Dioxin, phenoxy herbicides | ||
| Mc Bride et al., 2009a | 1,599 production workers (male and female) vs national rates—mortality 1969 through 2004 Ever-exoosed workers | 0 | 0.0(0.0-15.6) |
| United Kingdom Production Workers (included in IARC cohort) | |||
| Coggon et al., 1986 | British MCPA production workers | 4 | 2.2 (0.6-5.7) |
| Agricultural Health Study | Herbicides | ||
| Alavanja et al., 2005 | US AHS—incidence | ||
| Private applicators | 23 | 1.1 (0.7-1.6) | |
| Spouses of private applicators (> 99% women) | nr | 0.0 (0.0-50.2) | |
| Commercial applicators | 4 | 1.2(0.3-3.2) | |
| Blair et al., 2005a | US AHS | ||
| Private applicators | 0 | nr | |
| Spouses of private applicators (> 99% women) | 0 | nr | |
| Other Agricultural Workers | Herbicides | ||
| Blair et al., 1993 | US farmers in 23 states | ||
| White men | 32 | 0.8(0.6-1.2) | |
| Nonwhite men | 6 | 1.3(0.5-2.9) | |
| Ronco et al., 1992 | Danish farm workers—incidence | ||
| Men—self-employed | 74 | 0.9 (nr) | |
| employee | 23 | 0.6 (p< 0.05) | |
| Wiklund, 1983 | Swedish male agricultural workers—incidence | 101 | 99% CI 1.0(0.7-1.2) |
| Other Studies of Herbicide and Pesticide Applicators | Herbicides | ||
| Flemming et al., 1999b | Florida pesticide appliers | 23 | 2.5(1.6-3.7) |
| Zhong and Rafnsson, 1996 | Icelandic pesticide users | 2 | 1.2(0.1-4.3) |
| Forestry Workers | Herbicides | ||
| Reifetal., 1989 | New Zealand forestry workers—nested case-control—incidence | 6 | 1.0(0.4-2.6) |
| Hertzman et al., 1997 | British Columbia sawmill workers | ||
| Mortality (male genital cancers) | 116 | 1.0(0.8-1.1) | |
| Incidence | 18 | 1.0(0.6-1.4) | |
| Reference | Study Populationa | Exposed Casesb | Exposure of Interest/ Estimated Risk (95% CI)b |
| Paper and Pulp Workers | Dioxin | ||
| McLean et al., 2006 | IARC cohort of pulp and paper workers Exposure to nonvolatile organochlorine compounds |
||
| Never | 2 | 1.1 (0.1-4.1) | |
| Ever | 5 | 3.6(1.2-8.4) | |
| Other Occupational Workers | Herbicides | ||
| Hardell et al., 1998 | Swedish workers exposed to herbicides | 4 | 0.3(0.1-1.0) |
| ENVIRONMENTAL | |||
| Seveso, Italy Residential Cohort | TCDD | ||
| Pesatori et al., 2009 | Seveso—20-yr follow-up to 1996—incidence | ||
| Zone A | 0 | ||
| Zone B | 2 | 0.8 (0.2-3.3) | |
| Zone R | 22 | 1.4(0.9-2.3) | |
| Bertazzi et al., 2001 | Seveso residents—20-yr follow-up | ||
| Zone A, B—men | 17 | 1.0(0.6-1.7) | |
| Bertazzi et al., 1998 | Seveso residents—15-yr follow-up (genitourinarytract)—incidence | ||
| Zone B—men | 10 | 1.0(0.5-1.8) | |
| Zone R—men | 73 | 1.0(0.8-1.3) | |
| Bertazzi et al., 1993 | Seveso residents—10-yr follow-up—incidence | ||
| Zone B—men | 1 | 1.0(0.1-7.5) | |
| Zone R—men | 9 | 1.4(0.7-3.0) | |
| Pesatori et al., 1992 | Seveso residents—incidence | ||
| Zones A, B—men | 1 | 0.9(0.1-6.7) | |
| Zone R—men | 9 | 1.5(0.7-3.0) | |
ABBREVIATIONS: 2,4-D, 2,4-dichlorophenoxyacetic acid; ACC, Army Chemical Corps; AHS, Agricultural Health Study; CI, confidence interval; COI, chemical of interest; IARC, International Agency for Research on Cancer; MCPA, 2-methyl-4-chlorophenoxyacetic acid; MI, Michigan; NIOSH, National Institute for Occupational Safety and Health; nr, not reported; ns, not significant; NZ, New Zealand; PCDD, polychlorinated dibenzo-p-dioxin (highly chlorinated, if four or more chlorines); SEA, Southeast Asia; TCDD, 2,3,7,8-tetrachlorodibenzo-p-dioxin; VA, US Department of Veterans Affairs.
aSubjects are male, and outcome is mortality unless otherwise noted.
bGiven when available; results other than estimated risk explained individually.
study was limited by a high loss of follow-up (21%). No testicular-cancer deaths were reported in the study. The results in McBride et al. (2009b) have not been included because they were diluted by inclusion of a set of workers who had no opportunity for TCDD exposure and no observed deaths.
Environmental Studies
Pesatori et al. (2009) updated mortality and cancer-incidence results for the study conducted among residents of Seveso. Poisson regression models were used to calculate rate ratios adjusted for sex, age, and period. The use of exposure zones (A, B, and R) to define individual exposure introduces misclassification, which is likely to be random and to attenuate associations. However, later serum measurements of a subset confirmed the utility of assigning zone of residence as a proxy for exposure to TCDD. For testicular cancer, none of the RRs was significantly increased; that for Zone A was noncalculable, and those for Zones B and R were 0.82 (95% CI 0.20–3.32) and 1.44 (95% CI 0.9–2.31), respectively.
Biologic Plausibility
No animal studies of the incidence of testicular cancer after exposure to any of the chemicals of interest have been published since Update 2008. The biologic plausibility of the carcinogenicity of the chemicals of interest is discussed in general at the beginning of this chapter.
Synthesis
The evidence from epidemiologic studies is inadequate to link herbicide exposure and testicular cancer. The relative rarity of this cancer makes it difficult to develop risk estimates with any precision. Most cases occur in men 25–35 years old, and men who have received such a diagnosis could be excluded from military service; this could explain the slight reduction in risk observed in some veteran studies.
Conclusion
On the basis of the evidence reviewed here and in previous VAO reports, the committee concludes that there is inadequate or insufficient evidence to determine whether there is an association between exposure to the chemicals of interest and testicular cancer.
Urinary bladder cancer (ICD-9 188) is the most common urinary tract cancer. Cancers of the urethra, and paraurethral glands and other and unspecified urinary cancers (ICD-9 189.3–189.9) are infrequently reported separately; any findings on these cancers would be reported in this section. ACS estimated that 52,760 men and 17,770 women would receive a diagnosis of bladder cancer in the United States in 2010 and that 10,410 men and 4,270 women would die from it (Jemal et al., 2010). In males, in whom this cancer is about twice as common as it is in females, those numbers represent about 7% of new cancer diagnoses and 3% of cancer deaths. Overall, bladder cancer is fourth in incidence in men in the United States.
Bladder-cancer risk rises rapidly with age. In men in the age groups that characterize most Vietnam veterans, bladder-cancer incidence is about twice as high in whites as in blacks. The average annual incidence of urinary bladder cancer is shown in Table 7-31.
The most important known risk factor for bladder cancer is tobacco use, which accounts for about half the bladder cancers in men and one-third of them in women (Miller et al., 1996). Occupational exposure to aromatic amines (also called arylamines), polycyclic aromatic hydrocarbons (PAHs), and some other organic chemicals used in the rubber, leather, textile, paint-products, and printing industries is associated with higher incidence. In some parts of Africa and Asia, infection with the parasite Schistosoma haematobium contributes to the high incidence.
Exposure to inorganic arsenic is also a risk factor for bladder cancer. Although cacodylic acid is a metabolite of inorganic arsenic, as discussed in Chapter 4, the data are insufficient to conclude that studies of inorganic-arsenic exposure are directly relevant to exposure to cacodylic acid, so the literature on inorganic arsenic is not considered in this section.
TABLE 7-31 Average Annual Incidence (per 100,000) of Bladder Cancer in United Statesa
| 55-59 Years Old | 60-64 Years Old | 65-69 Years Old | |||||||
| All Races | White | Black | All Races | White | Black | All Races | White | Black | |
| Men | 44.2 | 47.7 | 27.1 | 77.7 | 85.4 | 47.3 | 130.2 | 141.3 | 95.3 |
| Women | 12.4 | 13.8 | 7.5 | 21.2 | 23.2 | 14.5 | 34.0 | 37.4 | 27.9 |
aSurveillance, Epidemiology, and End Results program, nine standard registries, crude age-specific rates, 2004–2008 (NCI, 2010).
Conclusions from VAO and Previous Updates
The committees responsible for VAO and Update 1996 concluded that there was limited or suggestive evidence of no association between exposure to the chemicals of interest and urinary bladder cancer. Additional information available to the committee responsible for Update 1998 led it to change that conclusion to one of inadequate or insufficient information to determine whether there is an association. The committee responsible for Update 2000, Update 2002, Update 2004, Update 2006, and Update 2008 did not change that conclusion.
Table 7-32 summarizes the results of the relevant studies.
Update of the Epidemiologic Literature
Vietnam-Veteran Studies
No Vietnam-veteran studies concerning exposure to the chemicals of interest and bladder cancer have been published since Update 2008.
Occupational Studies
Boers et al. (2010) published results from the third follow-up of the retrospective Dutch study of a cohort in two chlorophenoxy herbicide manufacturing factories (Plant A and Plant B). The authors extended follow-up an additional 15 years through the end of 2006 and included data from Plant B that had previously not been included, because of the small number of deaths reported at the last follow-up. The data from the two plants were analyzed separately because exposure to phenoxy herbicides and dioxins was considered to differ between factories. In Plant A, there were 539 exposed male workers and 482 unexposed workers. In Plant B, there were 411 male workers classified as exposed and 626 classified as unexposed. Although the follow-up period is long, the cohort is moderate in size and would have limited power to detect increases in rare cancers. The authors reported an increased hazard ratio for bladder cancer in Plant A of 2.27 (95% CI 0.5–10.28) on the basis of nine deaths in exposed and two deaths in unexposed workers. Plant B had an HR of 1.05 (95% CI 0.15–7.21) on the basis of two deaths in exposed and two deaths in unexposed workers.
Collins et al. (2009a) published updated results from a Dow Chemical Company site in Michigan. They followed 1,615 workers who were exposed to dioxins in a TCP production plant. Serum dioxin measures of a set of 280 (17%) workers were used to estimate historical TCDD exposure of all workers. Serum TCDD concentrations were higher than those in unexposed people and the general population. Workers were followed from 1942 to 2003. The SMR for bladder cancer was 1.2 (95% CI 0.5–2.7) in all TCP workers and 1.2 (95% CI 0.4–2.7) when 196 workers who also had TCP exposure were excluded. Collins et al. (2009b)
TABLE 7-32 Selected Epidemiologic Studies—Urinary Bladder Cancer
| Reference | Study Populationa | Exposed Casesb | Exposure of Interest/ Estimated Risk (95% CI)b |
| VIETNAM VETERANS | |||
| Air Force Ranch Hands—Ranch Hand veterans vs SEA veterans | All COIs | ||
| AFHS subjects vs national rates | |||
| White AFHS Ranch Hand veterans Incidence |
14 | 1.1 (0.6-1.7) | |
| With tours between 1966-1970 | 14 | 1.3 (0.7-2.1) | |
| Mortality | 1 | 0.9 (nr) | |
| White AFHS comparison veterans Incidence |
8 | 0.4 (0.2-0.8) | |
| With tours in 1966-1970 | 4 | 0.3 (0.1-0.7) | |
| Mortality | 1 | 0.6 (nr) | |
| Air Force Ranch Hand veterans Bladder, kidney |
11 | 3.1 (0.9-11.0) | |
| Centers for Disease Control and Prevention | All COIs | ||
| Follow-up of CDC Vietnam Experience Cohort | 1 | nr | |
| US Department of Veterans Affairs | All COIs | ||
| Army Vietnam veterans | 9 | 0.6 (0.3-1.2) | |
| Marine Vietnam veterans | 4 | 2.4 (0.1-66.4) | |
| State Studies of US Vietnam Veterans | All COIs | ||
| Massachusetts Vietnam veterans | 80 | 0.6 (0.2-1.3) | |
| Wisconsin Vietnam veterans | 1 | nr | |
| Australian Vietnam Veterans vs Australian Population | All COIs | ||
| Australian male Vietnam veterans vs Australian population—incidence | 164 | 1.0 (0.9-1.2) | |
| Navy | 34 | 1.0 (0.7-1.4) | |
| Army | 104 | 1.0 (0.8-1.2) | |
| Air Force | 26 | 1.3 (0.8-1.8) | |
| Australian military Vietnam veterans vs Australian population—mortality | 22 | 0.7 (0.4-1.0) | |
| Navy | 4 | 0.6 (0.2-1.6) | |
| Army | 13 | 0.7 (0.3-1.1) | |
| Air Force | 5 | 1.1 (0.4-2.5) | |
| Australian military Vietnam veterans | 11 | 1.1 (0.6-1.9) | |
| Australian Conscripted Army National Service (deployed vs nondeployed) | |||
| Australian male conscripted Army National Service Vietnam-era veterans |
|||
| Incidence | 19 | 0.7 (0.4-1.1) | |
| Mortality | 1 | 0.3 (0.0-1.7) | |
| Australian National Service Vietnam veterans | 1 | 0.6 (nr) | |
| Reference | Study Populationa | Exposed Casesb | Exposure of Interest/ Estimated Risk (95% CI)b |
| OCCUPATIONAL | |||
| IARC Pfaenoxy Herbicide Cohort | Dioxin, phenoxy herbicides | ||
| IARC cohort, male and female workers exposed to any phenoxy herbicide or chlorophenol | 34 | 1.0 (0.7-1.5) | |
| Exposed to highly chlorinated PCDDs | 24 | 1.4 (0.9-2.1) | |
| Not exposed to highly chlorinated PCDDs | 10 | 0.7 (0.3-1.2) | |
| IARC cohort—exposed subcohort (men and women) | 13 | 0.8 (0.4-1.4) | |
| NIOSH Mortality Cohort (12 US plants, production 1942–1984) (included in IARC cohort) | Dioxin, phenoxy herbicides | ||
| US chemical production workers | |||
| Total cohort | 16 | 2.0 (1.1-3.2) | |
| High-exposure cohort | 6 | 3.0 (1.4-8.5) | |
| Fingerhul et al., 1991 | NIOSH—entire cohort (bladder, other) | 9 | 1.6 (0.7-3.0) |
| ≥ 1-yr exposure, ≥ 20-yr latency | 4 | 1.9 (0.5-4.8) | |
| Monsanto Plant—Nitro, WV (accident and workers) (included in IARC and NIOSH cohort) | Dioxin, phenoxy herbicides | ||
| Monsanto Company workers (many also exposed to 4-aminobiphenyl, a known bladder carcinogen) | |||
| Bladder, other urinary | 16 | 6.8 (3.9-11.1) | |
| Dow Chemical Company—Midland, MI (included in IARC and NIOSH cohorts) | Dioxin, phenoxy herbicides | ||
| Trichlorophenol workers | 6 | 1.2 (0.5-2.7) | |
| Pentachlorophenol workers | 2 | 0.7 (0.1-2.7) | |
| Dow chemical production workers | nr | 0.7 (0.1-2.0) | |
| Bums et al., 2001 | Dow 2,4-D production workers | 1 | 0.5 (0.1-2.8) |
| Dow 2,4-D production workers | 0 | nr (0.0-7.2) | |
| BASF Production Workers (included in IARC cohort) | Dioxin, phenoxy herbicides | ||
| BASF employees (bladder, kidney)—incidence | 2 | 1.4 (0.4-3.2) | |
| BASF employees—basic cohort | 0 | 90% CI nr (0.0-15.0) |
|
| Danish Production Workers (included in IARC cohort) | Dioxin, phenoxy herbicides | ||
| Danish production workers—incidence | 11 | 0.8 (nr) | |
| Dutch Production Workers (included in IARC cohort) | Dioxin, phenoxy herbicides | ||
| Dutch chlorophenoxy workers | |||
| Factory A (HR for exposed vs unexposed) | 9 vs 2 | 2.3 (0.5-10.3) | |
| Factory B (HR for exposed vs unexposed) | 2 vs 2 | 1.1 (0.2-7.2) | |
| Reference | Study Populationa | Exposed Casesb | Exposure of Interest/ Estimated Risk (95% CI)b |
| Dutch chemical production workers | |||
| Total cohort | 4 | 3.7 (1.0-9.5) | |
| Accidentally exposed subcohort | 1 | 2.8 (0.1-15.5) | |
| Dutch phenoxy herbicide workers | 1 | 1.2 (0.0-6.7) | |
| New Zealand Production Workers—Dow plant in Plymouth, NZ (included in IARC cohort) | Dioxin, phenoxy herbicides | ||
| 1,599 production workers (male and female) vs national rates—mortality 1969 through 2004 Ever-exposed workers | 0 | 0.0 (0.0-2.9) | |
| ’t Mannetje et al., 2005 | New Zealand phenoxy herbicide producers, sprayers | ||
| Phenoxy herbicide producers (men and women) | 0 | nr | |
| Phenoxy herbicide sprayers (> 99% men) | 0 | nr | |
| United Kingdom Production Workers (included in IARC cohort) | Dioxin, phenoxy herbicides | ||
| British MCPA production workers | 8 | 0.9 (0.4-1.7) | |
| Paper and Pulp Workers | Dioxin | ||
| IARC cohort of pulp and paper workers Exposure to nonvolatile organochlorine compounds |
|||
| Never | 50 | 1.0 (0.7-1.3) | |
| Ever | 43 | 1.1 (0.8-1.5) | |
| New Hampshire pulp and paper workers | 4 | 1.2 (0.3-3.2) | |
| Northwestern US paper and pulp workers | 8 | 1.2 (0.6-2.6) | |
| Agricultural Health Study | Herbicides | ||
| Pesticide applicators in AHS—bladder-cancer incidence from enrollment through 2002 Dicamba—lifetime days exposure | |||
| None | 43 | 1.0 | |
| 1-<20 | 6 | 0.5 (0.2-1.3) | |
| 20-<56 | 9 | 0.7 (0.3-1.4) | |
| 56-< 116 | 6 | 0.6 (0.3-1.5) | |
| ≥116 | 8 | 0.8 (0.4-1.9) p-trend = 0.66 |
|
| US AHS (urinary system)—incidence | |||
| Private applicators (men and women) | 184 | 0.7 (0.6-0.8) | |
| Spouses of private applicators (> 99% women) | 17 | 0.7 (0.4-1.1) | |
| Commercial applicators (men and women) | 13 | 1.1 (0.6-1.8) | |
| Reference | Study Populationa | Exposed Casesb | Exposure of Interest/ Estimated Risk (95% CI)b |
| USAHS | |||
| Private applicators (men and women) | 7 | 0.4 (0.1-0.7) | |
| Spouses of private applicators (> 99% female) | 2 | 0.8 (0.1-2.7) | |
| Other Agricultural Workers | Herbicides | ||
| Danish gardeners (urinary system, 1CD-7 180-181)—incidence | |||
| 10-yr follow-up (1975-1984) reported in |
18 | 0.9 (0.7-1.8) | |
| 25-yr follow-up (1975-2001) Bom before 1915 (high exposure) |
25 | 1.1 (0.7-1.6) | |
| Born 1915-1934 (medium exposure) | 23 | 0.5 (0.4-0.8) | |
| Bom after 1934 (low exposure) | 1 | 0.2 (0.0-1.1) | |
| Danish workers—incidence | |||
| Men—self-employed | 300 | 0.6 (p < 0.05) | |
| employee | 70 | 0.7 (p < 0.05) | |
| Women—self-employed | 1 | 0.2 (nr) | |
| employee | 2 | 0.6 (nr) | |
| family worker | 25 | 0.6 (p < 0.05) | |
| USDA agricultural extension agents | 8 | 0.7 (0.4-1.4) | |
| Iowa fanners | 274 | 0.9 (nr) | |
| Forestry Workers | Herbicides | ||
| Canadian sawmill workers | |||
| Mortality | 33 | 0.9 (0.7-1.2) | |
| Incidence | 94 | 1.0 (0.8-1.2) | |
| USDA forest, soil conservationists | 8 | 0.8 (0.3-1.6) | |
| New Zealand forestry workers—nested case-control—incidence | 4 | 0.7 (0.3-1.8) | |
| Other Studies of Herbicide and Pesticide Applicators | Herbicides | ||
| Dutch licensed herbicide applicators | 2 | 0.7 (0.1-2.4) | |
| Finnish herbicide applicators—incidence | 12 | 1.6 (0.8-2.8) | |
| Italian licensed pesticide users | 31 | 0.5 (0.4-0.8) | |
| Herbicide sprayers in Ontario | |||
| Diseases of genitourinary system | 1 | 1.0 (0.0-5.6) | |
| Florida pesticide applicators | 3 | 1.6 (nr) | |
| ENVIRONMENTAL | TCDD | ||
| Chapaevsk, Russia Cohort | |||
| Residents of Chapaevsk. Russia (urinary organs) | |||
| Men | 31 | 2.6 (1.7-3.6) | |
| Women | 17 | 0.8 (0.5-1.3) | |
| Reference | Study Populationa | Exposed Casesb | Exposure of Interest/ Estimated Risk (95% CI)b |
| Seveso, Italy Residential Cohort | TCDD | ||
| Seveso residents—25-yr follow-up—men and women | |||
| Zone A | 1 | 1.0 (0.2-7.4) | |
| Zone B | 6 | 0.9 (0.4-2.0) | |
| Zone R | 42 | 0.9 (0.6-1.2) | |
| Seveso—20-yr follow-up to 1996—incidence | |||
| Zone A | 3 | 14 (0.5-4.5) | |
| Zone B | 17 | 1.3 (0.8-2.2) | |
| Zone R | 84 | 0.9 (0.8-1.2) | |
| Seveso residents—20-yr follow-up | |||
| Zone A, B—men | 6 | 1.2 (0.5-2.7) | |
| Seveso residents—15-yr follow-up | |||
| Zone B—men | 1 | 2.4 (0.3-16.8) | |
| women | 3 | 0.9 (0.3-3.0) | |
| Zone R—men | 21 | 0.9 (0.6-1.5) | |
| women | 4 | 0.6 (0.2-1.8) | |
| Seveso residents—incidence | |||
| Zones A, B—men | 10 | 1.6 (0.9-3.1) | |
| women | 1 | 0.9 (0.1-6.8) | |
| Zone R—men | 39 | 1.0 (0.7-1.4) | |
| women | 4 | 0.6 (0.2-1.5) | |
| Other Environmental Studies | Phenoxy herbicides, chlorophenols | ||
| Italian rice growers | 12 | 1.0 (0.5-1.8) | |
| Swedish fishermen (men and women)—mortality | Organochlorine compounds | ||
| East coast | 5 | 1.3 (0.4-3.1) | |
| West coast | 20 | 1.0 (0.6-1.6) | |
| Swedish fishermen (men and women)—incidence | |||
| East coast | 10 | 0.7 (0.4-1.3) | |
| West coast | 55 | 0.9 (0.7-1.1) | |
| Finnish community exposed to chlorophenol contamination (men and women) |
14 | Clilorophenols 1.0 (0.6-1.9) |
|
ABBREVIATIONS: 2,4-D, 2,4-dichlorophenoxyacetic acid; AFHS, Air Force Health Study; AHS, Agricultural Health Study; CDC, Centers for Disease Control and Prevention; CI, confidence interval; COI, chemicals of interest; HR, hazard ratio; IARC, International Agency for Research on Cancer; ICD, International Classification of Diseases; MCPA, 2-methyl-4-chlorophenoxyacetic acid; MI, Michigan; NIOSH, National Institute for Occupational Safety and Health; nr, not reported; NZ, New Zealand; PCDD, polychlorinated dibenzo-p-dioxin (highly chlorinated, if four or more chlorines); SEA, Southeast Asia; TCDD, 2,3,7,8-tetrachlorodibenzo-p-dioxin; USDA, US Department of Agriculture; WV, West Virginia.
aSubjects are male, and outcome is mortality unless otherwise noted.
bGiven when available; results other than estimated risk explained individually.
described the mortality experience of 773 workers who were exposed to chlorinated dioxins in the production of PCP; 75% of the cohort have been followed for more than 27 years. SMRs were calculated by comparing the PCP workers with the general US population and the state of Michigan. The SMR for bladder cancer was 0.7 (95% CI 0.1–2.7) in all PCP workers on the basis of two deaths and 0.5 (95% CI 0.0–2.6) on the basis of one death when 196 workers who also had TCP exposure were excluded.
McBride et al. (2009a,b) extended their earlier publications by including additional exposed and unexposed workers, constructing exposure estimates based on serum dioxin (TCDD) concentrations in exposed and unexposed workers, and extending follow-up for 4 additional years. The authors reported on the mortality experience of 1,599 workers who were employed during 1969–1988 at a New Zealand site that manufactured TCP and a nearby field station where 2,4,5-T was occasionally used and tested (McBride et al., 2009a). Serum measurements from 346 blood samples confirmed higher exposure than New Zealand background. The study was limited by a high loss of follow-up (21%). The SMR (95% CI) for bladder cancer in ever-exposed workers was 0 (0.0–2.9) on the basis of no observed deaths. The results in McBride et al. (2009b) have not been included, because they were diluted by inclusion of a set of workers who had no opportunity for TCDD exposure and no observed deaths.
Environmental Studies
Pesatori et al. (2009) updated cancer-incidence results of the study of residents of Seveso. Poisson regression models were used to calculate sex-, age-, and period-adjusted rate ratios. The use of exposure zones (A, B, and R) to define individual exposure introduces misclassification, which is likely to be random and to attenuate associations. However, later serum measurements of a subset confirmed the utility of using zone of residence as a proxy for exposure to TCDD. For bladder cancer, RRs for Zones A, B, and R were 1.44 (95% CI 0.46–4.49), 1.33 (95% CI 0.82–2.16), and 0.94 (95% CI 0.75–1.19), respectively.
In a 12-year follow-up study in Taiwan, Huang et al. (2008) found significantly higher levels of MMAV and lower levels of DMAV in patients with urothelial carcinoma than among the healthy residents. After adjustment for age, gender, educational level, and smoking status, the incidence of urinary DMAV was inversely associated with the risk of urothelial carcinoma, having relative risks across the low, medium, and high strata of 1.0, 0.3, and 0.3, respectively (p < 0.05 for the trend test).
Biologic Plausibility
In laboratory animals, cacodylic acid has been shown to induce primarily bladder tumors (Cohen et al., 2006; Wang et al., 2009). In a study of male F344
rats, cacodylic acid administered in drinking water resulted in formation of bladder tumors at the highest concentrations (50 and 200 ppm) (Wei et al., 2002). In another report (Arnold et al., 2006), administration of cacodylic acid in the diet resulted in formation of papillomas and carcinomas in the bladders of female and male F344 rats but not B6C3F1 mice. Experimental work since Update 2006 has shown that cacodylic acid (dimethyl arsenic acid, DMA) is cytotoxic at high concentrations in rat urothelial cells in vitro (Nascimento et al., 2008); such concentrations are unlikely to be environmentally relevant. Other recent studies have shown DMA concentrations to be lower in bladder-cancer patients than in matched controls (Pu et al., 2007) and to be associated with a lower incidence of urinary cancer (Huang et al., 2008). In contrast, greater oxidative DNA damage has been found in association with higher DMA concentrations in urothelial-cancer patients (Chung et al., 2008), although this was not the case in primary human hepatocytes (Dopp et al., 2008). In a study that used a rat cancer initiation–promotion model, DMA was found to be a weak cancer-initiator but a tumor-promoter at high dose (Fukushima et al., 2005).
No studies have reported an increased incidence of urinary bladder cancer in TCDD-treated animals, but activation of the AHR pathway with TCDD enhances cancer-cell invasion by upregulating the matrix metalloproteinase (MMP)-1 and MMP-9 expression and is associated with poor prognosis in upper urinary tract urothelial cancer (Ishida et al., 2010).
The biologic plausibility of the carcinogenicity of the chemicals of interest is discussed in general at the beginning of this chapter.
Synthesis
Available analyses of an association between exposure to the chemicals of interest and bladder-cancer risk are characterized by low precision because of the small numbers, low exposure specificity, and lack of ability to control for confounding. The data that have emerged over the last several updates suggest that DMA may be a bladder-tumor–promoter and that DMA concentrations are lower in patients who have urinary cancer. The evidence in either direction remains too preliminary to alter the conclusion that the cumulative evidence of such an association is inadequate or insufficient.
Conclusion
On the basis of the evidence reviewed here and in previous VAO reports, the committee concludes that there is inadequate or insufficient evidence to determine whether there is an association between exposure to the chemicals of interest and bladder cancer.
Cancers of the kidney (ICD-9 189) and renal pelvis (ICD-9 189.1) are often grouped in epidemiologic studies; cancer of the ureter (ICD-9 189.2) is sometimes also included. Although diseases of those organs have different characteristics and could have different risk factors, there is some logic to grouping them: the structures are all exposed to filterable chemicals, such as PAHs, that appear in urine. ACS estimated that 35,370 men and 22,870 women would receive diagnoses of renal cancer (ICD-9 189, 189.1) in the United States in 2010 and that 8,210 men and 4,830 women would die from it (Jemal et al., 2010). Those figures represent 2–4% of all new cancer diagnoses and cancer deaths. The average annual incidence of renal cancer is shown in Table 7-33.
Renal cancer is twice as common in men as in women. In the age groups that include most Vietnam veterans, black men have a higher incidence than white men. With the exception of Wilms tumor, which is more likely to occur in children, renal cancer is more common in people over 50 years old.
Tobacco use is a well-established risk factor for renal cancer. People who have some rare syndromes—notably, von Hippel–Lindau syndrome and tuberous sclerosis—are at higher risk. Other potential risk factors include obesity, heavy acetaminophen use, kidney stones, and occupational exposure to asbestos, cadmium, and organic solvents. Firefighters, who are routinely exposed to numerous pyrolysis products, are in a known higher-risk group.
Conclusions from VAO and Previous Updates
The committee responsible for VAO concluded that there was inadequate or insufficient information to determine whether there is an association between exposure to the chemicals of interest and renal cancer. Additional information available to the committees responsible for Update 1996, Update 1998, Update 2000, Update 2002, Update 2004, Update 2006, and Update 2008 did not change that conclusion. Table 7-34 summarizes the results of the relevant studies.
TABLE 7-33 Average Annual Incidence (per 100,000) of Kidney and Renal Pelvis Cancer in United Statesa
| 55-59 Years Old | 60-64 Years Old | 65-69 Years Old | |||||||
| All Races | White | Black | All Races | White | Black | All Races | White | Black | |
| Men | 40.7 | 39.2 | 61.1 | 60.3 | 60.2 | 77.4 | 77.8 | 78.6 | 95.3 |
| Women | 20.0 | 20.2 | 23.8 | 27.8 | 29.2 | 30.0 | 36.2 | 35.6 | 45.2 |
aSurveillance, Epidemiology, and End Results program, nine standard registries, crude age-specific rates, 2004–2008 (NCI, 2010).
TABLE 7-34 Selected Epidemiologic Studies—Renal Cancer
| Reference | Study Populationa | (Exposed Casesb |
Exposure of Interest/ Estimated Risk (95% CI)b |
| VIETNAM VETERANS | |||
| US Air Force Health Study—Ranch Hand veterans vs SEA veterans | All COIs | ||
| AFHS, 2000 | Air Force Ranch Hand veterans | 11 | 3.1 (0.9-11.0) |
| US CDC Vietnam Experience Study | All COIs | ||
| Boehmer el al., 2004 | Follow-up of CDC VES | 1 | nr |
| US VA Mortality Study of Army and Marine Veterans (ground troops serving July 4, 1965–March 1, 1973) | All COIs | ||
| Breslin et al., 1988 | Army Vietnam veterans | 55 | 0.9(0.5-1.5) |
| Marine Vietnam veterans | 13 | 0.9(0.5-1.5) | |
| State Studies of US Vietnam Veterans | All COIs | ||
| Visinlainer et al, 1995 | PM study of deaths (1974-1989) of Michigan Vietnam-era veterans—deployed vs nondeployed |
21 | 1.4(0.9-2.2) |
| Kogan and Clapp, 1988 | Massachusetts Vietnam veterans | 9 | 1.8(1.0-3.5) |
| Anderson et al., 1986 | Wisconsin Vietnam veterans | 2 | nr |
| Australian Vietnam Veterans vs Australian Population | All COIs | ||
| ADVA, 2005a | Australian male Vietnam veterans vs Australian populat ion—incidence | 125 | 1.0(0.8-1.2) |
| Navy | 34 | 1.3(0.9-1.7) | |
| Army | 77 | 0.9(0.7-1.1) | |
| Air Force | 14 | 1.1 (0.6-1.8) | |
| ADVA, 2005b | Australian male Vietnam veterans vs Australian population—mortality |
50 | 1.0(0.7-1.2) |
| Navy | 12 | 1.1 (0.6-1.9) | |
| Army | 33 | 0.9(0.6-1.3) | |
| Air Force | 5 | 0.8(0.3-1.8) | |
| CDVA, 1997a | Australian military Vietnam veterans | 22 | 1.2(0.7-1.8) |
| Australian Conscripted Army National Service (deployed vs nondeployed) | All COIs | ||
| ADVA, 2005c | Australian male conscripted Army National Service Vietnam-era veterans—deployed vs nondeployed |
||
| Incidence | 19 | 0.7(0.4-1.0) | |
| Mortality | 4 | 0.4(0.1-1.1) | |
| CDVA, 1997b | Australian National Service Vietnam veterans | 3 | 3.9 (nr) |
| Reference | Study Populationa | (Exposed Casesb |
Exposure of Interest/ Estimated Risk (95% CI)b |
| OCCUPATIONAL | |||
| IARC Phenoxy Herbicide Cohort (mortality vs national mortality rates) | Dioxin, phenoxy herbicides | ||
| Kogevinas et al., 1997 | IARC cohort, male and female workers exposed to any phenoxy herbicide or chlorophenol | 29 | 1.1 (0.7-1.6) |
| Exposed to highly chlorinated PCDDs | 26 | 1.6(1.1-2.4) | |
| Not exposed to highly chlorinated PCDDs | 3 | 0.3(0.1-0.9) | |
| Saracci et al., 1991 | IARC cohort—exposed subcohort (men and women) | 11 | 1.0(0.5-1.7) |
| NIOSH Mortality Cohort (12 US plants, production 1942–1984) (included in IARC cohort) | Dioxin, phenoxy herbicides | ||
| Steenland et al., 1999 | US chemical workers | 13 | 1.6(0.8-2.7) |
| Fingerhut et al, 1991 | NIOSH cohort—entire cohort | 8 | 1.4(0.6-2.8) |
| ≥ 1-yr exposure, ≥ 20-yr latency | 2 | 1.1 (0.1-3.8) | |
| Dow Chemical Company—Midland, MI (included in IARC and NIOSH cohorts) | Dioxin, phenoxy herbicides | ||
| Collins et al., 2009a | Trichlorophenol workers | 2 | 0.4(0.1-1.5) |
| Collins et al., 2009b | Pentachlorophenol workers | 4 | 1.7(0.5-44) |
| Bums et al., 2001 | Dow 2,4-D production workers | 2 | 0.9(0.1-3.3) |
| Bond et al., 1988 | Dow 2,4-D production workers | 0 | nr (0.0-6.2) |
| Danish Production Workers (included in IARC cohort) | Dioxin, phenoxy herbicides | ||
| Lynge, 1985 | Danish production workers—incidence | 3 | 0.6 (nr) |
| Dutch Production Workers (included in IARC cohort) | Dioxin, phenoxy herbicides | ||
| Boers et al., 2010 | Dutch chlorophenoxy workers | ||
| Plant A—exposed workers | 8 | HR = "infinitively large" | |
| Hooiveld et al., 1998 | Dutch chemical production workers | ||
| Total cohort—kidney cancer | 4 | 4.1(1.1-10.4) | |
| Total cohort—"urinary organs" | 8 | 3.9(1.7-7.6) | |
| German Production Workers (included in IARC cohort) | Dioxin, phenoxy herbicides | ||
| Manz et al., 1991 | German production workers—men, women | 3 | 1.6(0.3-4.6) |
| New Zealand Production Workers—Dow plant in Plymouth, NZ (included in IARC cohort) | Dioxin, phenoxy herbicides | ||
| McBride et al., 2009a | 1,599 production workers (male and female) vs national rates—mortality 1969 through 2004 | ||
| Ever-exposed workers | 3 | 2.3 (0.5-6.7) | |
| ’t Mannetje et al., 2005 | Phenoxy herbicide producers (men and women) | 1 | 1.2(0.0-6.6) |
| Phenoxy herbicide sprayers (> 99% men) | 3 | 2.7 (0.6-8.0) | |
| Reference | Study Populationa | (Exposed Casesb |
Exposure of Interest/ Estimated Risk (95% CI)b |
| United Kingdom Production Workers (included in IARC cohort) | Dioxin, phenoxy herbicides | ||
| Coggon el al., 1986 | British MCPA production workers | 5 | 1.0(0.3-2.3) |
| Agricultural Studies | Herbicides | ||
| Hansen et al., 2007 | Danish gardeners—incidence (urinary system, ICD-7 180-181) 10-yr follow-up (1975-1984) reported in Hansen et al. (1992) 25-yr follow-up (1975-2001) |
18 | 0.9(0.7-1.8) |
| Born before 1915 (high exposure) | 25 | 1.1 (0.7-1.6) | |
| Born 1915-1934 (medium exposure) | 23 | 0.5 (0.4-0.8) | |
| Born after 1934 (low exposure) | 1 | 0.2(0.0-1.1) | |
| Mellemgaard et al., 1994 | Danish Cancer Registry patients | ||
| Occupational herbicide exposure, men | 13 | 1.7(0.7-4.3) | |
| Occupational herbicide exposure, women | 3 | 5.7 (0.6-58.0) | |
| Blair et al., 1993 | US fanners in 23 states | ||
| White men | 522 | 1.1 (1.0-1.2) | |
| White women | 6 | 0.8(0.3-1.7) | |
| Ronco et al.,1992 | Danish workers—incidence | ||
| Men—self-employed | 141 | 0.6 (p < 0.05) | |
| employee | 18 | 0.4 (p < 0.05) | |
| Women—self-employed | 4 | 0.9 (nr) | |
| employee | 3 | I.O(nr) | |
| family worker | 30 | 0.8 (nr) | |
| Alavanja et al., 1988 | USDA agricultural extension agents | nr | 1.7(0.9-3.3) |
| Wiklund, 1983 | Swedish male and female agricultural | 99% CI | |
| workers—incidence | 775 | 0.8 (0.7-0.9) | |
| Burmeister, 1981 | Iowa farmers | 178 | 1.1 (ns) |
| Magnani et al., 1987 | UK case-control | Herbicides | |
| Herbicides | nr | 1.3(0.6-3.1) | |
| Chlorophenols | nr | 0.9(0.4-1.9) | |
| Other Studies of Herbicide and Pesticide Applicators Herbicides | |||
| Swaen et al., 2004 | Dutch licensed herbicide applicators | 4 | 1.3(0.4-3.4) |
| Torchio et al., 1994 | Italian licensed pesticide users | 16 | 0.6(0.4-1.0) |
| Blair et al., 1983 | Florida pesticide applicators | 1 | 0.5 (nr) |
| Forestry Workers | Herbicides | ||
| Reif et al., 1989 | New Zealand forestry workers—nested case-control—incidence |
2 | 0.6 (0.2-2.3) |
| Reference | Study Populationa | (Exposed Casesb |
Exposure of Interest/ Estimated Risk (95% CI)b |
| Alavanja el al., 1989 | USDA forest conservationists | nr | 1.7(0.5-5.5) |
| Soil conservationists | nr | 2.4(1.0-5.9) | |
| Paper and Pulp Workers | Dioxin | ||
| McLean et al., 2006 | IARC cohort of pulp and paper workers Exposure to nonvolatile organochlorine compounds |
||
| Never | 41 | 0.9(0.7-1.3) | |
| Ever | 18 | 0.5 (0.3-0.8) | |
| Henneberger et al., 1989 | New Hampshire paper and pulp workers | 3 | 1.5 (03-44) |
| Robinson et al., 1986 | Northwestern US paper and pulp workers | 6 | 1.2(0.5-3.0) |
| ENVIRONMENTAL | |||
| Scvcso, Italy Residential Cohort | TCDD | ||
| Consonni et al., 2008 | Seveso residents—25-yr follow-up—men, women | ||
| Zone A | 0 | nr | |
| Zone B | 3 | 0.6 (0.2-2.0) | |
| Zone R | 39 | 1.2(0.8-1.6) | |
| Pesatori et al., 2009 | Seveso—20-yr follow-up to 1996—incidence | ||
| Zone A | 0 | ||
| Zone B | 6 | 0.9 (0.4-2.0) | |
| Zone R | 43 | 0.9(0.7-1.2) | |
| Bertazzi et al., 2001 | Seveso residents—20-yr follow-up | ||
| Zone A, B—men | 3 | 0.8 (0.3-2.6) | |
| women | 3 | 1.8(0.6-5.8) | |
| Bertazzi et al., 1993 | Seveso residents—10-yr follow-up (kidney. | ||
| other urinary organs)—incidence | |||
| Zone R—men | 10 | 0.9(0.4-1.7) | |
| women | 7 | 1.2(0.5-2.7) | |
| Pesatori et al., 1992 | Seveso residents—incidence | ||
| Zones A, B—men | 0 | nr | |
| women | 1 | 1.1 (0.2-8.1) | |
| Zone R—men | 11 | 0.9(0.5-1.7) | |
| women | 7 | 1.2 (0.5-2.6) | |
ABBREVIATIONS: 2,4-D, 2,4-dichlorophenoxyacetic acid; CDC, Centers for Disease Control and Prevention; CI, confidence interval; COI, chemical of interest; HR, hazard ratio; IARC, International Agency for Research on Cancer; ICD, International Classification of Diseases; MCPA, 2-methyl-4-chlorophenoxyacetic acid; MI, Michigan; NIOSH, National Institute for Occupational Safety and Health; nr, not reported; NZ, New Zealand; PCDD, polychlorinated dibenzo-p-dioxin (highly chlorinated, if four or more chlorines); PM, proportionate mortality; SEA, Southeast Asia; TCDD, 2,3,7,8-tetrachlorodibenzo-p-dioxin; UK, United Kingdom; USDA, US Department of Agriculture; VA, US Department of Veterans Affairs; VES, Vietnam Experience Study
aSubjects are male, and outcome is mortality unless otherwise noted.
bGiven when available; results other than estimated risk explained individually.
Update of the Epidemiologic Literature
Vietnam-Veteran Studies
No Vietnam-veteran studies concerning exposure to the chemicals of interest and renal cancer have been published since Update 2008.
Occupational Studies
Boers et al. (2010) published results from the third follow-up of the retrospective Dutch cohort study in two chlorophenoxy herbicide manufacturing factories (Plant A and Plant B). The authors extended follow-up an additional 15 years through the end of 2006 and included data from Plant B that had previously not been included, because of the small number of deaths reported at the last follow-up. The data from the two plants were analyzed separately because exposure to phenoxy herbicides and dioxins was considered to differ between factories. In Plant A, there were 539 exposed male workers and 482 unexposed workers. In Plant B, there were 411 male workers who were classified as exposed and 626 classified as unexposed. Although the follow-up period is long, the cohort is moderate in size and would have limited power to detect increases in rare cancers. The authors reported the HR as infinitively large for renal cancer in Plant A on the basis of eight deaths in the exposed and no deaths in the unexposed workers. Plant B had an HR of 0 on the basis of no deaths in the exposed and no deaths in the unexposed workers.
Collins et al. (2009a) published updated results from a Dow Chemical Company site in Michigan. They followed 1,615 workers who were exposed to dioxins in a TCP production plant. Serum dioxin measures of a set of 280 (17%) workers were used to estimate historical TCDD exposure of all workers. Serum TCDD concentrations were higher than those in unexposed people and the general population. Workers were followed from 1942 to 2003. The SMR for renal cancer was 0.4 (95% CI 0.1–1.5) in all TCP workers and 0.5 (95% CI 0.1–1.7) when 196 workers who also had TCP exposure were excluded.
Collins et al. (2009b) described the mortality experience of 773 workers who were exposed to chlorinated dioxins in the production of PCP; 75% of the cohort have been followed for more than 27 years. SMRs were calculated to compare the PCP workers with the general US population and the state of Michigan. The SMR for renal cancer was 1.7 (95% CI 0.5–4.4) in all PCP workers on the basis of four deaths and 2.3 (95% CI 0.6–5.8) on the basis of four deaths when 196 workers who also had TCP exposure were excluded.
McBride et al. (2009a,b) extended their earlier research by including additional exposed and unexposed workers, constructing exposure estimates based on the basis of serum dioxin (TCDD) concentrations in exposed and unexposed workers, and extending follow-up for 4 additional years. The authors reported the
mortality experience of 1,599 workers who were employed during 1969–1988 at a New Zealand site that manufactured TCP and a nearby field station where 2,4,5-T was occasionally used and tested (McBride et al., 2009a). Serum measurements from 346 blood samples confirmed higher exposure than New Zealand background. The study was limited by a high loss of follow-up (21%). The SMR for renal-cancer death in ever-exposed workers was 2.3 (95% CI 0.5–6.7) on the basis of three observed deaths. The results in McBride et al. (2009b) have not been included, because they were diluted by inclusion of a set of workers who had no opportunity for TCDD exposure and no observed deaths.
Environmental Studies
Pesatori et al. (2009) published updated mortality and cancer incidence results of the study of residents of Seveso. Poisson regression models were used to calculate sex-, age-, and period-adjusted rate ratios. The use of exposure zones (A, B, and R) to define individual exposure introduces misclassification, which is likely to be random and to attenuate associations. However, later serum measurements of a subset confirmed the utility of assigning zone of residence as a proxy for exposure to TCDD. No renal cancers were observed in Zone A, and risks were not elevated in Zone B (RR = 0.87, 95% CI 0.39–1.96) or Zone R (RR = 0.90, 95% CI 0.65–1.24).
Biologic Plausibility
No animal studies have reported an increased incidence of renal cancer after exposure to the chemicals of interest. The biologic plausibility of the carcinogenicity of the chemicals of interest is discussed in general at the beginning of this chapter.
Synthesis
Available analyses of an association between exposure to the chemicals of interest and renal-cancer risk are limited by the small number of cases and lack of exposure specificity. No data have emerged since Update 2008 to alter the committee’s conclusion that the evidence is inadequate or insufficient to determine whether there is an association.
Conclusion
On the basis of the evidence reviewed here and in previous VAO reports, the committee concludes that there is inadequate or insufficient evidence to determine whether there is an association between exposure to the chemicals of interest and renal cancer.
Brain and other nervous-system cancers (ICD-9 191–192) involve the central nervous system (CNS) and include tumors of the brain and spinal cord, the cranial nerves, and the meninges (the outer coverings of the brain and spinal cord). Any of the cell types in the CNS can produce cancer. Tumors of the peripheral nerves and autonomic nervous system are considered soft-tissue tumors (ICD-9 171). Most cancers in the CNS originate in other parts of the body, such as the lung or breast, but have metastasized to the brain or spinal cord. This section focuses on cancers that originate in the CNS.
Cancer of the eye (ICD-9 190) was considered retrospectively in Update 2006, but the present committee decided that findings concerning cancer of the eye would be tracked with results on brain cancer because, when it is reported, it is often grouped with brain cancer.
The average annual incidence of primary CNS cancer is shown in Table 7-35. About 95% of cases derive from the brain, cranial nerves, and cranial meninges. In people over 45 years old, about 90% of tumors that originate in the brain are gliomas—astrocytoma, ependymoma, oligodendroglioma, or glioblastoma multi-forme. Astrocytoma is the most common; glioblastoma multiforme has the worst prognosis. Meningiomas make up 20–40% of CNS cancers; they tend to occur in middle age and are more common in women than in men. Most meningiomas are benign and can be removed surgically.
ACS estimated that about 11,980 men and 10,040 women would receive diagnoses of brain and other nervous-system cancers in the United States in 2010 and that 7,420 men and 5,720 women would die from them (Jemal et al., 2010). Those numbers represent about 1.5% of new cancer diagnoses and 2.3% of cancer deaths. ACS estimated that 1,240 men and 1,240 women would receive diagnoses of cancers of the eye and orbit in the United States in 2010 and that 120 men and 110 women would die from them (Jemal et al., 2010).
In reviewing the descriptive epidemiology of these cancers, it is important to recognize the variation with which specific cancers are included in published reports, many of which distinguish between benign and malignant cancers. Another
TABLE 7-35 Average Annual Incidence (per 100,000) of Brain and Other Nervous System Cancers in United Statesa
| 55-59 Years Old | 60-64 Years Old | 65-69 Years Old | |||||||
| All Races | White | Black | All Races | White | Black | All Races | White | Black | |
| Men | 13.3 | 14.8 | 8.9 | 16.4 | 18.4 | 8.7 | 19.6 | 21.6 | 14.0 |
| Women | 7.9 | 8.9 | 4.5 | 11.3 | 12.3 | 7.0 | 13.2 | 14.7 | 8.9 |
aSurveillance, Epidemiology, and End Results program, nine standard registries, crude age-specific rates, 2004–2008 (NCI, 2010).
variation is whether cancer derived from related tissues (such as the pituitary or the eye) is included. Various types of cancer are usually grouped; although this may bias results in unpredictable ways, the most likely consequence is dilution of risk estimates toward the null.
The only well-established environmental risk factor for brain tumors is exposure to high doses of ionizing radiation (ACS, 2007d; Wrensch et al., 2002). Other environmental exposures—such as to vinyl chloride, petroleum products, and electromagnetic fields—are unproved as risk factors. The causes of most cancers of the brain and other portions of the nervous system are not known.
Conclusions from VAO and Previous Updates
The committee responsible for VAO concluded that there was limited or suggestive evidence of no association between exposure to the chemicals of interest and brain cancer. The committees responsible for Update 1996, Update 1998, Update 2000, Update 2002, and Update 2004 did not change that conclusion.
The committee responsible for Update 2006 changed the classification for brain cancer (formally expanded to include cancers of the eye and orbit) to inadequate or insufficient evidence to determine an association between exposure to the chemicals of interest and brain cancer. That committee considered one study that suggested a relationship between adult gliomas and phenoxy acid herbicides (Lee et al., 2005), studies that reported slightly but not statistically significantly higher risks of brain cancer in deployed than in nondeployed Australian Vietnam-era veterans (ADVA, 2005a,b) and in pesticide applicators in the AHS (Alavanja et al., 2005), and several studies that had essentially neutral findings (Carreon et al., 2005; Magnani et al., 1987; McLean et al., 2006; Ruder et al., 2004; Torchio et al., 1994). Overall, the studies discussed in Update 2006 suggested that a conclusion of no association between exposure to the chemicals of interest and brain cancer had been too definitive.
The committee for Update 2008 agreed that brain cancers should remain in the inadequate or insufficient category following review of two new studies. The relevance of the largely null findings of association with occupational exposure to herbicides from a case–control study (Samanic et al., 2008) of gliomas and meningiomas was limited because no specific compounds were addressed. In evaluating mortality through 2001 in the Seveso cohort, Consonni et al. (2008) found no increase in mortality from brain cancer in any of the three exposure zones with increasing exposure and no indication of a dose–response relationship.
Table 7-36 summarizes the results of the relevant studies.
TABLE 7-36 Selected Epidemiologic Studies—Brain Tumors
| Reference | Study Populationa | (Exposed Casesb |
Exposure of Interest/ Estimated Risk (95% CI)b |
| VIETNAM VETERANS | |||
| US Air Force Health Study—Ranch Hand veterans vs SEA veterans | All COIs | ||
| Akhtar et al.,2004 | White AFHS subjects vs national rates Ranch Hand veterans |
||
| Incidence (brain and nervous system) | 5 | 1.8(0.7-4.1) | |
| With tours in 1966-1970 | 5 | 2.2 (0.8-4.8) | |
| Mortality (CNS) | 3 | 1.3(0.3-3.6) | |
| Comparison veterans Incidence (brain and nervous system) |
2 | 0.5(0.1-1.8) | |
| With tours in 1966-1970 | 2 | 0.7(0.1-2.3) | |
| Mortality (CNS) | 1 | 0.3 (nr) | |
| US VA Cohort of Armv Chemical Corns | All COIs | ||
| Cypel and Kang, 2010 | ACC veterans (deployed vs nondeployed) vs US men | ||
| Vietnam cohort | 4 | 0.9 (0.2-2.2) | |
| Non-Vietnam cohort | 2 | 0.5(0.1-2.0) | |
| Dalager and Kang, 1997 | ACC veterans (crude rate ratio vs nondeployed) | 2 | 1.9 (nr) |
| Thomas and Kang, 1990 | ACC Vietnam veterans | 2 | nr |
| US CDC Vietnam Experience Study | All COIs | ||
| Boehmer et al., 2004 | Follow-up of CDC Vietnam Experience Cohort (meninges, brain, other CNS) |
9 | 1.2(0.4-3.2) |
| Boyle et al., 1987 | VES cohort | 3 | nr |
| US VA Mortality Study of Army and Marine Veterans (ground troops serving July 4, 1965–March 1, 1973 |
All COIs | ||
| Breslin et al., 1988 | Army Vietnam veterans | 116 | 1.0(0.3-3.2) |
| Marine Vietnam veterans | 25 | 1.1 (0.2-7.1) | |
| US VA Cohort of Female Vietnam Veterans | All COIs | ||
| Cypel and Kang, 2008 | US Vietnam veterans (brain and CNS)—women | 8 | 2.0 (0.7-5.9) |
| Vietnam veteran nurses | 8 | 3.6 (0.9-14.5] | |
| Dalager et al., 1995 | US Vietnam veterans—women | 4 | 1.4(0.4-3.7) |
| Australian Vietnam Veterans vs Australian Population | All COIs | ||
| ADVA, 2005a | Australian male Vietnam veterans vs Australian population (brain)—incidence |
97 | 1.1 (0.9-1.2) |
| Navy | 24 | 1.2(0.7-1.7) | |
| Army | 63 | 1.0(0.8-1.3) | |
| Air Force | 10 | 1.1 (0.6-2.1) | |
| ADVA, 2005b | Australian male Vietnam veterans vs Australian population (brain, CNS)—mortality |
99 | 1.0(0.8-1.1) |
| Navy | 23 | 1.0(0.6-1.4) | |
| Army | 66 | 0.9(0.7-1.2) | |
| Air Force | 9 | 0.9(0.4-1.6) | |
| Reference | Study Populationa | (Exposed Casesb |
Exposure of Interest/ Estimated Risk (95% CI)b |
| CDVA, 1997a | Australian military Vietnam veterans | 39 | 1.1 (0.7-1.4) |
| Australian Cunscripted Army National Service (deployed vs nondeployed) | All COIs | ||
| ADVA, 2005c | Australian male conscripted Army National Service Vietnam-era veterans—deployed vs nondeployed (brain, CNS) |
||
| Incidence (1982-2000) | 23 | 1.4(0.7-2.6) | |
| Mortality (1966-2001) | 27 | 1.6(0.9-3.1) | |
| CDVA, 1997b | Australian National Service Vietnam veterans | 13 | 1.4 (nr) |
| Slate Studies of US Vietnam Veterans | All COIs | ||
| Visinlainer et al., 1995 | PM study of deaths (1974-1989) of Michigan Vietnam-era veterans—deployed vs nondeployed |
36 | 1.1 (0.8-1.5) |
| Anderson et al., 1986 | Wisconsin Vietnam veterans | 8 | 0.8(0.3-1.5) |
| Lawrence et al., 1985 | New York Vietnam veterans (brain and CNS) | 4 | 0.5(0.2-1.5) |
| OCCUPATIONAL | |||
| IARC Phenoxy Herbicide Cohort (mortality vs national mortality rates) | Dioxin, phenoxy herbicides | ||
| Kogevinas et al., 1997 | IARC cohort, male and female workers exposed to any phenoxy herbicide or chlorophenol |
22 | 0.7(0.4-1.0) |
| Exposed to highly chlorinated PCDDs | 12 | 0.6(0.3-1.1) | |
| Not exposed to highly chlorinated PCDDs | 10 | 0.8(0.4-1.5) | |
| Saracci et al., 1991 | IARC cohort (men and women)—exposed subcohort | 6 | 0.4(0.1-0.8) |
| NIOSH Mortality Cohort (12 US plants, production 1942–1984) (included in IARC cohort) | Dioxin, phenoxy herbicides | ||
| Steenland et al., 1999 | US chemical workers (brain and CNS) | 8 | 0.8(0.4-1.6) |
| Fingerhut et al., 1991 | NIOSH cohort—entire cohort (brain and CNS) ≥ 1-yr exposure, ≥ 20-yr latency |
2 | 1.1 (0.1-3.8) |
| Dow Chemical Company—Midland, MI (included in IARC and NIOSH cohorts) | Dioxin, phenoxy herbicides | ||
| Collins et al., 2009a | Trichlorophenol workers | 3 | 0.6(0.1-1.7) |
| Collins et al., 2009b | Pentachlorophenol workers | 1 | 0.4 (0.0-2.3) |
| Bodner et al., 2003 | Dow chemical production workers (brain and CNS) | nr | 0.6(0.1-1.8) |
| Bums et al., 2001 | Dow 2,4-D production workers | 3 | 1.1 (0.2-3.2) |
| Reference | Study Populationa | (Exposed Casesb |
Exposure of Interest/ Estimated Risk (95% CI)b |
| Ramlow et al., 1996 | Dow pentachlorophenol production workers (brain and CNS) | ||
| 0-yr latency | 1 | nr | |
| 15-yr latency | 1 | nr | |
| Bond el al., 1988 | Dow 2,4-D production workers | ||
| Brain, other system tissues | 0 | nr (0.0-4.1) | |
| Danish Production Workers (included in 1ARC cohort) | Dioxin, phenoxy herbicides | ||
| Lynge, 1985 | Danish production workers—incidence | 4 | 0.7 (nr) |
| German Production Workers (included in IARC cohort) | Dioxin, phenoxy herbicides | ||
| Becher et al., 1996 | German production workers—cohort 1 | 3 | 2.3 (0.5-6.8) |
| New Zealand Production Workers—Dow plant in Plymouth, NZ (included in IARC cohort) |
Dioxin, phenoxy herbicides | ||
| McBride et al., 2009a | 1,599 production workers (male and female) vs national rates—mortality 1969 through 2004 |
||
| Ever-exposed workers | 4 | 2.0 (0.6-5.2) | |
| ’t Mannetje et al., 2005 | New Zealand phenoxy herbicide workers Phenoxy herbicide producers (men and women) |
1 | 0.8 (0.0-4.6) |
| Phenoxy herbicide sprayers (> 99% men) | 1 | 0.6 (0.0-3.4) | |
| United Kingdom Production Workers (included in IARC cohort) | Dioxin, phenoxy herbicides | ||
| Coggon et al., 1986 | British MCPA chemical workers (brain and CNS) | 11 | 1.2(0.6-2.2) |
| Agricultural Health Study | Herbicides | ||
| Alavanja et al., 2005 | US AHS—incidence Private applicators (men and women) |
33 | 0.8 (0.6-0.8) |
| Spouses of private applicators (> 99% women) | 15 | 0.9(0.5-1.4) | |
| Commercial applicators (men and women) | 5 | 1.9(0.6-4.3) | |
| Blair et al.,2005a | US AHS | ||
| Private applicators (men and women) Years handled pesticides |
19 | 0.7(0.4-1.1) | |
| ≥ 10 years | 5 | 0.9 (ns) | |
| ≥ 10 years | 12 | 0.6 (ns) | |
| Spouses of private applicators (> 99% women) | 11 | 1.1 (0.5-1.8) | |
| NIOSH Upper Midwest Health Study | Herbicides | ||
| Carreon et al., 2005 | NIOSH UMHS—case-control Women | ||
| Arsenicals | 13 | 1.0(0.5-1.9) | |
| Phenoxy herbicides | 25 | 0.9(0.5-1.5) | |
| 2,4-D | 24 | 0.9(0.5-1.6) | |
| Reference | Study Populationa | (Exposed Casesb |
Exposure of Interest/ Estimated Risk (95% CI)b |
| Ruder el al., 2004 | NIOSH UMHS—case-control Men | ||
| Arsenicals | 15 | 0.7(0.4-1.4) | |
| Phenoxy herbicides | 67 | 0.9(0.6-1.2) | |
| 2,4-D | nr | nr | |
| Other Agricultural Studies | Herbicides | ||
| Gambini et al., 1997 | Italian rice growers (brain and CNS) | 4 | 0.9 (0.2-2.3) |
| Dean, 1994 | Irish farmers, farm workers | ||
| Men | 195 | nr | |
| Women | 72 | nr | |
| Blair et al., 1993 | US farmers in 23 states | ||
| White men | 447 | 1.2(1.1-1.3) | |
| White women | 9 | 1.1 (0.5-2.1) | |
| Morrison et al., 1992 | Farmers in Canadian prairie province | ||
| 250+ acres sprayed with herbicides | 24 | 0.8(0.5-1.2) | |
| Ronco et al., 1992 | Danish farmers (brain and CNS)—incidence | ||
| Men | 194 | 1.1 (nr) | |
| Women | 5 | 1.0 (nr) | |
| Wigle et al., 1990 | Canadian farmers | 96 | 1.0(0.8-1.3) |
| Alavanja et al., 1988 | USDA agricultural extension agents | nr | 1.0(0.4-2.4) |
| MusLvo et al., 1988 | Brain-tumor patients in Milan, Italy (male, female farmers) | 61 | 1.6(1.1-2.4) |
| Burmeister, 1981 | Iowa fanners | 111 | 1.1 (ns) |
| Other Studies of Herbicide and Pesticide Applicators | Herbicides | ||
| Swaen et al., 2004 | Dutch licensed herbicide applicators | 4 | 1.6(04-4.1) |
| Asp et al., 1994 | Finnish herbicide applicators (eye, brain) | ||
| Incidence | 3 | 0.7(0.1-2.0) | |
| Mortality | 3 | 1.2(0.3-3.6) | |
| Torchio et al., 1994 | Italian licensed pesticide users | ||
| Brain, nervous system | 15 | 0.5 (0.3-0.9) | |
| Eye | 4 | 24(0.7-6.1) | |
| Swaen et al., 1992 | Dutch licensed herbicide applicators | 3 | 3.2 (0.6-9.3) |
| Blair et al., 1983 | Florida pesticide applicators | 5 | 2.0 (nr) |
| Reference | Study Populationa | (Exposed Casesb |
Exposure of Interest/ Estimated Risk (95% CI)b |
| Agricultural Case-Control Studies | Herbicides | ||
| Samanic et al., 2008 | US hospital-based case-control study Cumulative lifetime occupational exposure to herbicides vs unexposed Gliomas |
||
| Men | 65 | 0.9(0.6-1.3) | |
| Low quartile | 20 | 1.0(0.5-1.9) | |
| Second quartile | 16 | 1.0(0.5-2.1) | |
| Third quartile | 12 | 0.6(0.3-1.3) | |
| Fourth quartile | 17 | 0.8(0.4-1.6) p-trend = 0.50 |
|
| Women | 35 | 1.3(0.8-2.0) | |
| Below median | 23 | 1.5(0.8-2.7) | |
| Above median | 12 | 1.0(0.5-2.1) p-trend = 0.91 |
|
| Meningiomas (women only) | 33 | 2.4(1.4-4.3) | |
| Below median | 16 | 2.1 (1.0-4.4) | |
| Above median | 17 | 2.9(1.3-6.2) p-trend = 0.01 |
|
| Lee et al., 2005 | Nebraska case-control study (gliomas)—incidence Phenoxy herbicides—combined reports (identical with results for 2,4-D specifically) |
32 | 1.8(1.0-3.3) |
| By self | 7 | 0.6(0.2-1.6) | |
| By proxy | 25 | 3.3(1.5-7.2) | |
| 2,4,5-T—combined reports | 7 | 1.3(0.5-3.6) | |
| By self | 2 | 0.4(0.1-2.3) | |
| By proxy | 5 | 2.7 (0.7-9.8) | |
| Reifetal., 1989 | Case-control study, all men with occupation entered into New Zealand Cancer Registry 1980-1984 (brain, CNS cancers) |
||
| Forestry workers | 4 | 1.2(0.4-3.3) | |
| Magnani et al., 1987 | UK case-control, JEM used on occupation given on death certificate |
||
| Herbicides | nr | 1.2(0.7-2.1) | |
| Chlorophenols | nr | 1.1 (0.7-1.8) | |
| Forestry Workers | Herbicides | ||
| ITiorn et al., 2000 | Swedish lumberjacks exposed to phenoxy acetic herbicides | ||
| Foreman—incidence | 0 | nr | |
| Alavanja et al., 1989 | USDA forest, soil conservationists | 6 | 1.7(0.6-3.7) |
| Reference | Study Populationa | (Exposed Casesb |
Exposure of Interest/ Estimated Risk (95% CI)b |
| Paper and Pulp Workers | Dioxin | ||
| McLean et al., 2006 | IARC cohort of pulp and paper workers Exposure to nonvolatile organochlorine compounds |
||
| Never | 44 | 1.0(0.7-1.4) | |
| Ever | 28 | 0.8(0.5-1.2) | |
| Henneberger et al., 1989 | New Hampshire pulp and paper workers | 2 | 1.2 (0.1–4.2) |
| Robinson et al., 1986 | Northwestern US paper and pulp workers | 4 | 0.6(0.2-2.1) |
| ENVIRONMENTAL | |||
| Seveso, Italy Residenlial Cohort | TCDD | ||
| Consonni et al., 2008 | Seveso residents—25-yr follow-up—men, women | ||
| Zone A | 0 | nr | |
| Zone B | 3 | 0.7(0.2-2.1) | |
| Zone R | 34 | 4 (0.8-1.6) | |
| Pesatori et al., 2009 | Seveso—20-yr follow-up to 1996—incidence | ||
| Zone A | 2 | 2.4 (0.6-9.8) | |
| Zone B | 4 | 0.8 (0.3-2.1) | |
| Zone R | 37 | 1.0(0.7-1.5) | |
| Bertazzi et al., 2001 | Seveso residents—20-yr follow-up | ||
| Zone A, B—men | 1 | 0.4(0.1-3.0) | |
| women | 3 | 1.9(0.6-6.0) | |
| Bertazzi et al., 1998 | Seveso residents—15-yr follow-up | ||
| Zone B—men | 1 | 0.8(0.1-5.5) | |
| women | 3 | 3.2(1.0-10.3) | |
| Zone R—men | 12 | 1.3(0.7-2.5) | |
| women | 8 | 1.1 (0.5-2.4) | |
| Bertazzi et al., 1993 | Seveso residents—10-yr follow-up—incidence | ||
| Zone R—men | 6 | 0.6(0.3-1.4) | |
| women | 6 | 1.4(0.6-3.4) | |
| Pesatori et al., 1992 | Seveso residents—incidence | ||
| Zones A, B—women | 1 | 1.5(0.2-11.3) | |
| Zone R—men | 6 | 0.6(0.3-1.4) | |
| women | 5 | 1.2(0.4-3.0) | |
| Bertazzi et al., 1989a | Seveso residents—10-yr follow-up | ||
| Zones A, B, R—men | 5 | 1.2(0.4-3.1) | |
| women | 5 | 2.1 (0.8-5.9) | |
| Other Environmental Studies | Organochlorine compounds | ||
| Swedish fishermen (men and women)—mortality | |||
| East coast | 2 | 0.6(0.1-2.1) | |
| West coast | 15 | 1.1 (0.6-1.7) | |
| Reference | Study Populationa | (Exposed Casesb |
Exposure of Interest/ Estimated Risk (95% CI)b |
| Swedish fishermen (men and women)—incidence | |||
| East coast | 3 | 0.5(0.1-1.5) | |
| West coast | 24 | 0.9(0.6-1.4) | |
ABBREVIATIONS: 2,4-D, 2,4-dichlorophenoxyacetic acid; 2,4,5-T, 2,4,5-trichlorophenoxyacetic acid; ACC, Army Chemical Corps; AFHS, Air Force Health Study; AHS, Agricultural Health Study; CDC, Centers for Disease Control and Prevention; CI, confidence interval; CNS, central nervous system; COI, chemical of interest; IARC, International Agency for Research on Cancer; JEM, job–exposure matrix; MCPA, 2-methyl-4-chlorophenoxyacetic acid; MI, Michigan; NIOSH, National Institute for Occupational Safety and Health; nr, not reported; ; ns, not significant; NZ, New Zealand; PCDD, polychlorinated dibenzo-p-dioxin (highly chlorinated, if four or more chlorines); PM, proportionate mortality; SEA, Southeast Asia; TCDD, 2,3,7,8-tetrachlorodibenzo-p-dioxin; UK, United Kingdom; UMHS, Upper Midwest Health Study; USDA, US Department of Agriculture; VA, US Department of Veterans Affairs; VES, Vietnam Experience Study.
aSubjects are male, and outcome is mortality unless otherwise noted.
bGiven when available; results other than estimated risk explained individually.
Update of the Epidemiologic Literature
Vietnam-Veteran Studies
Cypel and Kang (2010) compared death rates in 2,800 deployed and 2,800 nondeployed Vietnam-era veterans. There were no differences in deaths from brain cancers between the two groups.
Occupational Studies
Collins et al. (2009a) evaluated a previously known cohort of workers at the Dow Chemical Company site in Midland, Michigan, who were exposed to TCP or 2,4,5-T during 1948–1982. Of those workers, 12% had been previously documented to have experienced chloracne. Serum dioxin measures of a set of 280 (17%) workers were used to estimate historical TCDD exposure for all workers. Serum TCDD concentrations were higher than those of unexposed people and the general population. Workers were followed from 1942 to 2003. The SMR for cancer of the central nervous system was 0.6 (95% CI 0.1–1.7) in all TCP workers and 0.4 (95% CI 0.1–1.6) when 196 workers who also had TCP exposure were excluded.
Collins et al. (2009b) described the mortality experience of 773 workers who were exposed to chlorinated dioxins in the production of PCP during 1937–1980, 20% of whom had experienced chloracne; 75% of the cohort have been followed
for more than 27 years. SMRs were calculated to compare the PCP workers with the general US population and the population of the state of Michigan. No clear risk of brain cancer was noted in association with either short-term or long-term exposure. The SMR for brain cancer was 0.4 (95% CI 0.0–2.3) in all PCP workers on the basis of one death; however, it appears that the death occurred in the group of workers who also had TCP exposure.
McBride et al. (2009a,b) extended their earlier research by including additional exposed and unexposed workers, constructing exposure estimates based on serum dioxin (TCDD) concentrations in exposed and unexposed workers, and extending follow-up for 4 additional years. The authors reported the mortality experience of 1,599 workers who were employed during 1969–1988 at a New Zealand site that manufactured TCP and a nearby field station where 2,4,5-T was occasionally used and tested (McBride et al., 2009a). Serum measurements from 346 blood samples confirmed higher exposure than New Zealand background. The study was limited by a high loss of follow-up (21%). The SMR for death from cancer of the central nervous system for ever-exposed workers was 2.0 (95% CI 0.6–5.2), on the basis of four observed deaths. No deaths were reported in the never-exposed workers. The results in McBride et al. (2009b) have not been included, because they were diluted by inclusion of a set of workers who had no opportunity for TCDD exposure and no observed deaths.
Environmental Studies
The well-documented exposure that occurred in Seveso was again queried; Pesatori et al. (2009) in a 20-year follow-up study noted no increase in brain cancers in any of the exposure zones around the accident site. For brain cancer, RRs for Zones A, B, and R were 2.43 (95% CI 0.60–9.79), 0.76 (95% CI 0.28–2.05), and 1.04 (95% CI 0.73–1.48), respectively.
Biologic Plausibility
No animal studies have reported an association between exposure to the chemicals of interest and brain cancer. The biologic plausibility of the carcinogenicity of the chemicals of interest is discussed in general at the beginning of this chapter.
Synthesis
Since Update 2008, several studies relevant to the possibility of an association between the chemicals of interest and brain cancer have been identified, including cohort and case–control studies. All recent studies are consistent in identifying no relationship between exposure to the chemicals of interest and the development of gliomas.
Conclusion
On the basis of the epidemiologic evidence from new and previously reported studies of populations that had potential exposure to the chemicals of interest, the committee concludes that there is inadequate or insufficient evidence to determine whether there is an association between exposure to the chemicals of interest and brain cancer and other nervous system cancers.
Cancers of the endocrine system as grouped by the SEER program (see Table B-2 in Appendix B) have a disparate group of ICD codes: thymus cancer (ICD-9 164.0), thyroid cancer (ICD-9 193), and other endocrine cancer (ICD-9 194).
ACS estimated that 10,740 men and 33,930 women would receive diagnoses of thyroid cancer in the United States in 2010 and that 730 men and 960 women would die from it and estimated that 1,150 men and 1,110 women would receive diagnoses of other endocrine cancers in 2010 and that 410 men and 470 women would die from them (Jemal et al., 2010). Incidence data on cancers of the endocrine system are presented in Table 7-37.
Thyroid cancer is the most prevalent endocrine cancer. Many types of tumors can develop in the thyroid gland; most are benign. The thyroid gland contains two main types of cells: follicular cells make and store thyroid hormones and make thyroglobulin, and C cells make the hormone calcitonin, which helps to regulate calcium metabolism. Different cancers with varying degrees of seriousness can develop from each kind of cell, and the classification of thyroid cancer is still evolving (Liu et al., 2006; Nikiforov, 2011). Papillary carcinoma is the most common and usually affects women of childbearing age; it metastasizes slowly and is the least malignant type of thyroid cancer. Follicular carcinoma accounts for about 15% of all cases and has a greater rate of recurrence and metastasis. Medullary carcinoma is a cancer of nonthyroid cells in the thyroid gland and tends to occur in families; it requires treatment different from other types of thyroid cancer. Anaplastic carcinoma (also called giant-cell cancer and spindle-cell cancer) is rare but is the most aggressive form of thyroid cancer; it does not respond to
TABLE 7-37 Average Annual Incidence (per 100,000) of Endocrine System Cancer in United Statesa
| 55-59 Years Old | 60-64 Years Old | 65-69 Years Old | |||||||
| All Races | White | Black | All Races | White | Black | All Races | White | Black | |
| Men | 13.9 | 14.3 | 11.2 | 15.2 | 15.5 | 12.3 | 17.8 | 18.1 | 15.1 |
| Women | 29.7 | 30.3 | 20.2 | 29.4 | 30.4 | 18.6 | 31.1 | 30.9 | 24.4 |
aSurveillance, Epidemiology, and End Results program, nine standard registries, crude age-specific rates, 2004–2008 (NCI, 2010).
radioiodine therapy and metastasizes quickly, invading such nearby structures as the trachea and causing compression and breathing difficulties.
Thyroid cancer can occur in all age groups. Radiation exposure is recognized as a risk factor for thyroid cancer, so increased incidence is observed among people who received radiation therapy directed at the neck (a common treatment in the 1950s for enlarged thymus glands, adenoids, and tonsils and for skin disorders) or who were exposed to I125 from the Chernobyl nuclear powerplant accident. If radiation exposure occurred in childhood, the risk of thyroid cancer is further increased. Other risk factors are a family history of thyroid cancer and chronic goiter.
Conclusions from VAO and Previous Updates
The committees responsible for VAO, Update 1996, Update 1998, Update 2000, Update 2002, and Update 2004 did not consider endocrine cancers separately and therefore reached no conclusion as to whether there was an association between exposure to the chemicals of interest and endocrine cancers. The committees responsible for Update 2006 and Update 2008 considered endocrine cancers separately and concluded that there was inadequate or insufficient evidence to determine whether there was an association between the chemicals of interest and endocrine cancers. Table 7-38 summarizes the pertinent results of the relevant studies.
Update of the Epidemiologic Literature
Vietnam-Veteran Studies
No studies concerning exposure to the chemicals of interest and thyroid or other endocrine cancers in Vietnam veterans have been published since Update 2008.
Occupational Studies
McBride et al. (2009a,b) published an occupational mortality study of workers in the Dow AgroSciences plant in New Plymouth, New Zealand, who were potentially exposed to TCDD. Workers employed during January 1969–October 2003 were followed to the end of 2004, and SMRs were calculated by using national mortality figures (McBride et al., 2009a). A total of 1,754 workers were included in the study, but 22% were lost to follow-up. No deaths from cancers of the thyroid or other endocrine glands was observed. The results in McBride et al. (2009b) have not been included, because they were diluted by inclusion of a set of workers who had no opportunity for TCDD exposure and no observed deaths.
TABLE 7-38 Selected Epidemiologic Studies—Endocrine Cancers (Thyroid, Thymus, and Other)
| Reference | Study Populationa | (Exposed Casesb |
Exposure of Interest/ Estimated Risk (95% CI)b |
| VIETNAM VETERANS |
|||
| US VA Mortality Study of Army and Marine Veterans (ground troops serving July 4, 1965–March 1, 1973) |
All COIs | ||
| Breslin et al., 1988 | Veterans with service in Vietnam vs era veterans (thyroid and other endocrine, 1CD-9 193-194) |
All COIs | |
| Army | 15 | 0.6(0.3-1.2) | |
| Marine Corps | 4 | 0.6 (0.1-3.4) | |
| Australian Vietnam Veterans vs Australian Population | |||
| ADVA, 2005a | Australian male Vietnam veterans vs Australian population (thyroid)—incidence |
17 | 0.6 (0.3-0.9) |
| Navy | 3 | 0.5(0.1-1.3) | |
| Army | 11 | 0.5(0.3-1.0) | |
| Air Force | 3 | 1.2(0.2-3.5) | |
| ADVA, 2005b | Australian male Vietnam veterans vs Australian population (thyroid)—mortality |
2 | 0.5(0.0-1.8) |
| Navy | 1 | 1.2(0.0-6.5) | |
| Army | 1 | 0.4 (0.0-2.0) | |
| Air Force | 0 | 0.0 (0.0-7.8) | |
| Australian Conscripted Army National Service (deployed vs nondcploycd) |
All COIs | ||
| ADVA, 2005c | Australian male conscripted Army National Service Vietnam-era veterans—deployed vs nondeployed |
||
| Thyroid—incidence | 4 | 0.6(0.1-2.2) | |
| Thyroid—mortality | 1 | 1.2(0.0-91.7) | |
| State Study of US Vietnam Veterans | All COIs | ||
| Clapp, 1997 | Massachusetts male Vietnam veterans vs era veterans (thyroid)—incidence 1988–1993 |
4 | 1.2 (0.3–4.5) |
| OCCUPATIONAL | |||
| IARC Phenoxy Herbicide Cohort (mortality vs national mortality rates) | Dioxin, phenoxy herbicides | ||
| Kogevinas et al., 1997 | IARC cohort, male and female workers exposed to any phenoxy herbicide or chlorophenol |
||
| Thyroid (ICD-9 193) | 4 | 1.7(0.5-4.3) | |
| Exposed to highly chlorinated PCDDs | 2 | 1.4(0.2-4.9) | |
| Not exposed to highly chlorinated PCDDs | 2 | 2.2 (0.3-7.9) | |
| Other endocrine organs (ICD-9 194) | 5 | 3.6(1.2-8.4) | |
| Exposed to highly chlorinated PCDDs | 2 | 2.3(0.3-8.1) | |
| Not exposed to highly chlorinated PCDDs | 3 | 6.4(1.3-18.7) | |
| Dow Chemical Company—Midland, Ml (included in IARC and NIOSH cohorts) | Dioxin, phenoxy herbicides | ||
| Ramlow et al., 1996 | Dow cohort of pentachlorophenol factory workers employed in 1940-1989 in Michigan Division |
0 | nr |
| Reference | Study Populationa | (Exposed Casesb |
Exposure of Interest/ Estimated Risk (95% CI)b |
| Bond et al., 1988 | Dow 2,4-D production workers | 0 | nr |
| New Zealand Production Workers—Dow plant in Pymouth, NZ (included in IARC and NIOSH cohorts) |
Dioxin, phenoxy herbicides | ||
| McBride et al., 2009a | 1,599 production workers (male and female) vs national rates—mortality 1969 through 2004 |
||
| Thyroid, other endocrine Ever-exposed workers |
0 | 0.0 (0.0-19.8) | |
| 't Mannelje et al., 2005 | Phenoxy herbicide producers (men and women) | 0 | nr |
| Phenoxy herbicide sprayers (> 99% meh) | 0 | nr | |
| United Kingdom Production Workers (included in IARC cohort) | Dioxin, phenoxy herbicides | ||
| Coggon et al., 1986 | British MCPA procuction workers (thyroid) | 1 | 1.8(0.4-9.8) |
| Agricultural Health Study | Herbicides | ||
| Alavanja et al., 2005 | US AHS (thyroid, other endocrine)—incidence | ||
| Private applicators (men and women) | 29 | 1.3(0.8-1.8) | |
| Spouses of private applicators (> 99% women) | 24 | 0.9(0.5-1.4) | |
| Commercial applicators (men and women) | 3 | 1.6(0.3-5.0) | |
| Blair et al., 2005a | US AHS (thyroid)—mortality | ||
| Private applicators (men and women) | 3 | 1.8(0.4-5.3) | |
| Spouses of private applicators (> 99% women) | 0 | 0.0 (0.0-2.2) | |
| Other Agricultural Studies | Herbicides | ||
| Zhong and Rafnsson, 1996 | Icelandic men, women exposed to agricultural pesticides, primarily 2,4-D (other endocrine organs, ICD-9 194)—incidence |
2 | 13(0.1-4.7) |
| Blair et al., 1993 | US farmers in 23 states (thyroid) | ||
| White men | 39 | 13(1.0-1.8) | |
| White women | 1 | 0.8 (0.0-4.4) | |
| Hallquist et al., 1993 | Case-control study of male, female thyroid cancers from Swedish Cancer Registry, 1980-1989 |
||
| Phenoxy herbicide exposure | 3 | 0.5 (0.0-2.0) | |
| Chlorophenol exposure | 4 | 2.8(0.5-18) | |
| Ronco et al., 1992 | Danish workers—incidence | ||
| Men—self-employed | 13 | 0.7 (nr) | |
| employee | 5 | 1.1 (nr) | |
| Women—self-employed | 1 | 1.3 (nr) | |
| employee | 1 | 1.4 (nr) | |
| family worker | 15 | 1.7 (p< 0.05) | |
| Wiklund, 1983 | Swedish male and female agricultural workers—incidence |
99% CI | |
| Thyroid | 126 | 0.9(0.7-1.1) | |
| Other endocrine gland | 117 | 0.7 (0.5-0.9) | |
| Reference | Study Populationa | (Exposed Casesb |
Exposure of Interest/ Estimated Risk (95% CI)b |
| Other Studies of Herbicide and Pesticide Applicators | Herbicides | ||
| Asp el al., 1994 | Finnish phenoxy herbicide applicators (thyroid, other endocrine)—incidence |
||
| No latency | 2 | 1.9(0.3-7.0) | |
| 10-yr latency | 2 | 2.4 (0.3-8.6) | |
| 15-yr latency | 2 | 3.4(0.4-12.2) | |
| Mortality (thyroid) | |||
| No latency | 1 | 3.8(0.1-21.3) | |
| 10-yr latency | 1 | 4.7(0.1-26.4) | |
| 15-yr latency | 1 | 6.5 (0.2-36.2) | |
| Wiklund el al., 1989a | Cancer risk in licensed pesticide applicators in Sweden | 6 | 1.1 (0.4-2.4) |
| Forestry Workers | Herbicides | ||
| Green, 1991 | Cohort mortality study of forestry workers exposed to phenoxy acid herbicides |
1 | nr |
| ENVIRONMENTAL | |||
| Seveso, Italv Residential Cohort | TCDD | ||
| Pesalori et al., 2009 | Seveso—20-yr follow-up to 1996—incidence (ICD-9 193) |
||
| Zone A | 1 | 2.6(0.4-18.9) | |
| Zone B | 4 | 1.6(0.6-4.4) | |
| Zone R | 19 | 1.2(0.7-1.9) | |
| Pesalori et al., 2008 | Seveso population (1976-1996): incidence cases identified by hospital discharge records |
||
| Zone A (prolactinoma) | 1 | 6.2 (0.9-45.5) | |
| Zone B (nonfunctioning pituitary tumors) | 2 | 1.9(0.5-7.7) | |
| Zone R (2 nonfunctioning pituitary adenomas and 3 prolactinomas) | 5 | 0.7(0.3-1.8) | |
| Bertazzi et al., 1998 | Cancer mortality after Seveso incident | ||
| Zone A | nr | nr | |
| Zone B—men | 1 | 4.9 (0.6-39.0) | |
| women | 1 | 3.2 (0.4-24.5) | |
| Zone R—men | 0 | nr | |
| women | 2 | 0.8 (0.2-3.6) | |
ABBREVIATIONS: 2,4-D, 2,4-dichlorophenoxyacetic acid; AHS, Agricultural Health Study; CI, confidence interval; COI, chemical of interest; IARC, International Agency for Research on Cancer; ICD, International Classification of Diseases; MCPA, 2-methyl-4-chlorophenoxyacetic acid; MI, Michigan; NIOSH, National Institute for Occupational Safety and Health; nr, not reported; NZ, New Zealand; PCDD, polychlorinated dibenzo-p-dioxin (highly chlorinated, if four or more chlorines); TCDD, 2,3,7,8-tetrachlorodibenzo-p-dioxin; VA, US Department of Veterans Affairs.
aSubjects are male, and outcome is mortality unless otherwise noted.
bGiven when available; results other than estimated risk explained individually.
Environmental Studies
Thyroid-cancer cases were reported in the cancer-incidence study of the population (males and females combined) exposed to dioxin after the Seveso accident in 1976 (Pesatori, 2009). One thyroid-cancer case was observed in residents of Zone A (RR = 2.63, 95% CI 0.37–18.86), 4 thyroid-cancer cases in residents of Zone B (RR = 1.60, 95% CI 0.59–4.36), and 19 in residents of Zone R (RR = 1.15, 95% CI 0.70–1.89).
Pesatori et al. (2008) published a report on benign pituitary adenomas in the Seveso cohort. Incident cases were obtained from the hospital discharge-registration system, and 42 pituitary adenomas were identified among residents of the entire area. The noncontaminated area with 34 cases was used as the referent; Zone A had one prolactinoma (pituitary adenoma that secrets prolactin) (RR = 6.2, 95% CI 0.9–45.5), Zone B had two nonfunctioning pituitary adenomas (RR = 1.9, 95% CI 0.5–7.7), and Zone R had two nonfunctioning pituitary adenomas and three prolactinomas (RR = 0.7, 95% CI 0.3–1.8).
Biologic Plausibility
The NTP conducted carcinogenesis bioassays in Osborne-Mendel rats and B6C3F1 mice that were exposed to TCDD by gavage (NTP, 1982a). The incidence of follicular-cell adenoma, but not of carcinoma, increased with increasing TCDD dose in male and female rats; the increase was significant in male but not in female rats. There was a significant increase in follicular-cell adenoma in female but not in male mice. The NTP carried out a similar study in female Sprague-Dawley rats more recently (NTP, 2006), and Walker et al. (2006) compared the data from that study and the results of the Dow Chemical assessment of TCDD carcinogenicity (Kociba et al., 1978). In the NTP and Dow studies, the incidence of thyroid cancer (C-cell adenoma and carcinoma) decreased with increasing dose of TCDD. However, an increased incidence of minimal thyroid follicular-cell hypertrophy was noted in rats given TCDD at 22 ng/kg of body weight or more.
As indicated in Chapter 4, 2,4-D and 2,4,5-T are weakly mutagenic or carcinogenic at most. No studies that addressed a possible association between exposure to those herbicides and thyroid cancer in animal models have been identified.
The biologic plausibility of the carcinogenicity of the chemicals of interest is discussed in general at the beginning of this chapter.
Synthesis
The studies reviewed previously did not provide sufficient evidence to determine whether there is an association between exposure to the chemicals of interest and thyroid cancer or other endocrine cancers, and no new additional information that would alter this judgment was found by the present committee.
Conclusion
On the basis of the epidemiologic evidence reviewed here, the committee concludes that there is insufficient evidence to determine whether there is an association between exposure to the chemicals of interest and thyroid or other endocrine cancers.
Lymphohematopoietic cancers (LHCs) constitute a heterogeneous group of clonal hematopoietic and lymphoid-cell disorders, including leukemias, lymphomas, and multiple myeloma. They are among the most common types of cancer induced by environmental and therapeutic agents. As in the case of other cancers that are subject to idiosyncratic grouping in the results reported from epidemiologic studies (notably, head and neck cancers and gastrointestinal cancers), the conclusions that the VAO committees have drawn about associations between herbicide exposure and specific LHCs have been complicated and curtailed by the lack of specificity and by inconsistencies in groupings in the available evidence. For LHCs, that has been a function not only of epidemiologists’ seeking to combine related cancers to produce categories that have enough cases to permit statistical analysis but also of alterations in the prevailing system used by the medical community to classify these malignancies. Categorization of cancers of the lymphatic and hematopoietic systems has continued to evolve, guided by growing information about gene expression and lineage of the clonal cancer cells that characterize each of a broad spectrum of neoplasms arising in these tissues (Jaffe, 2009). The World Health Organization (WHO) categorization presented in the WHO Classification of Tumours of Haematopoietic and Lymphoid Tissue (WHO, 2008) makes its primary partition depending on whether the cancer cells are of myeloid or lymphoid origin (see Figure 7-1).
Stem cells arising in the bone marrow generate two major lineages of leukocytes: myeloid and lymphoid. Myeloid cells include monocytes and three types of granulocytes (neutrophils, eosinophils, and basophils). Lymphoid cells include T and B lymphocytes and a smaller set of cells called natural killer (NK) cells. All those cells circulate in the blood and are collectively referred to as white blood cells. Monocytes move out of the bloodstream into inflamed tissues, where they differentiate into macrophages or dendritic cells. Stem cells that are destined to become T lymphocytes migrate from the bone marrow to the thymus, where they acquire antigen-specific receptors. Antigen stimulation induces the T cells to differentiate into the several types involved in cell-mediated immunity. Pre-B cells mature in the bone marrow into antigen-specific B cells. On encountering their cognate antigens, B cells differentiate into antibody-secreting plasma cells involved in humoral immunity, which result in multiple myeloma when they undergo malignant transformation.
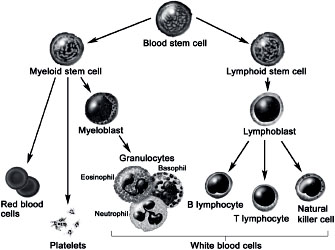
FIGURE 7-1 Hematopoiesis of stem cell differentiation. SOURCE: ©Winslow, 2007, US government has certain rights.
LHCs originate in specific pluripotent or lineage-restricted cells at different stages in hematopoiesis and immune-cell development. The normal cells are transformed into a malignant tumor through multistep processes that involve genetic and epigenetic alterations. Traditionally, LHCs have been divided into leukemias, lymphomas, myelomas, and so on, according to their cell and site of origin (Figure 7-1). That information and morphologic, cytochemical, and immunophenotypic data are used to characterize LHCs further by their distinct subtypes.
Leukemias occurs when a cell residing in the bone marrow becomes cancerous and its daughter cells crowd normal cells in the bone marrow or are released from the bone marrow and circulate in the blood. Leukemias have generally been classified as myeloid or lymphoid, depending on the lineage of the original mutated cell. If the original mutated cell of a cancer of the blood arises in a lymphocytic cell line, the cancer is called lymphocytic leukemia; lymphocytic leukemias have been further partitioned into acute (ALL) forms if they are derived from precursor B or T lymphoid cells and chronic (CLL) forms derived from more mature lymphoid cells, which tend to replicate less rapidly. Similarly, myeloid leukemias arise from the myeloid cell lineage and are classified into acute and chronic forms, AML and CML, respectively.
Lymphoma is a general term for cancers that arise from lymphocytes (B, T, or NK cells). Lymphomas generally present as solid tumors at lymphoid proliferative sites, such as lymph nodes and spleen. As stem cells mature into B or T cells, they pass through several developmental stages, each with unique functions. The developmental stage at which a cell becomes malignant defines the kind of lymphoma. About 85% of lymphomas are of B-cell origin, and 15% of T- or NK-cell origin. There are two major types of lymphoma: Hodgkin lymphoma (HL), previously referred to as Hodgkin disease and non-Hodgkin lymphoma (NHL). B cells give rise to a number of types of neoplasms that are given names based on the stage at which B-cell development was arrested when the cells became cancerous. Follicular, large-cell, and immunoblastic lymphomas result when a malignancy develops after a B cell has been exposed to antigens (such as bacteria and viruses). CLL is now believed to be a tumor of antigen-experienced (memory) B cells, not naive B cells (Chiorazzi et al., 2005); small lymphocytic lymphoma (SLL), which presents primarily in lymph nodes rather than in the bone marrow and blood, is now considered to be the same disease as CLL at a different stage (Jaffe et al., 2008).
Myeloma is another type of lymphohematopoietic malignancy derived from antibody-secreting plasma cells, which also have a B-cell lineage, that accumulate in the marrow of various bones. In most cases (90%), tumors are formed at multiple sites, and the disease is called multiple myeloma. The related premalignant condition AL amyloidosis also arises from B-cell–derived plasma cells. It occurs in 5–15% of patients who have multiple myeloma and causes abnormal deposition of antibody fragments.
The ICD system partitioned these malignancies into leukemias and lymphomas primarily on the basis of whether cancer cells circulated in the blood (disseminated) or appeared in the lymphatic system (solid tissue), respectively, before subdividing according to cell type. The emerging WHO classification of lymphohematopoietic malignancies (Campo et al., 2008; Jaffe, 2009) stratifies cancers of the blood and lymph nodes into disease categories according to their cell lineages, lymphoid or myeloid, as shown in Figure 7-1. It represents a substantial advance in understanding of the biologic paths by which these cancers develop. The current committee decided, however, that it would not be productive to reformulate this entire section to correspond to the WHO categories. In practice, results on LHCs have routinely been reported in a variety of groupings, so it is a continuing challenge to parse out results, noting when results for broader groupings are presented in the results tables for several more specific diagnoses, while recognizing that the specific results will be muted by being “misclassified” with other entities. Most epidemiologic studies already in the evidentiary database that did specify diseases precisely used ICD-9 or earlier versions. Furthermore, the existing records that will serve as the basis of many ongoing and even future studies will use earlier and evolving classifications, so this is likely to remain the case even in new literature for a considerable period. The nomenclature has become more
uniform in recent studies, but the possibility of ambiguity remains if earlier researchers did not use a unique code in accordance with some established system.
Because it has been the objective of VAO committees to address disease entities in as great specificity as possible with the available data, the coarser grouping of LHCs has little effect on the entities about which conclusions of association have been drawn. The present committee notes, however, that the commonality of biologic origin of LHCs that have been judged to have a substantial amount of evidence supporting association with the chemicals of interest (HL, NHL, CLL, hairy-cell leukemia [HCL], multiple myeloma, and AL amyloidosis) means that the WHO approach is supportive of and consistent with these decisions.
VA has asked previous VAO committees to address CLL, AML, and then HCL individually. Scrutiny of the entire body of epidemiologic results on leukemia for findings on particular types (as had been the most common manner of grouping) revealed several studies that showed increased risks specifically of CLL but did not provide support for an association of AML with herbicide exposure. The committee for Update 2002 advised VA that CLL is recognized as a form of the already recognized-as-service-related condition NHL, whereas the committee for Update 2006 did not recognize an association with AML. Later, the committee responsible for Update 2008 advised VA that HCL is a form of CLL. In light of the history and in accord with the current WHO classification, the current committee has incorporated data specifically on CLL and HCL into the section on NHL. The more common cancers of the lymphatic system are described in the sections below on HL, NHL, and multiple myeloma (with a section on the related condition, AL amyloidosis), followed by discussion of evidence on leukemias in general but with a focus on information regarding those of myelocytic origin.
Hodgkin lymphoma (ICD-9 201), also known as Hodgkin disease, is distinguished from NHL primarily on the basis of its neoplastic cells, mononucleated Hodgkin cells, and multinucleated Reed–Sternberg cells originating in germinal-center B cells (Küppers et al., 2002). HL’s demographics and genetics are also characteristic. ACS estimated that 4,670 men and 3,820 women would receive diagnoses of HL in the United States in 2010 and that 740 men and 580 women would die from it (Jemal et al., 2010). The average annual incidence is shown in Table 7-39.
The possibility that HL has an infectious etiology has been a topic of discussion since its earliest description. An increased incidence in people who have a history of infectious mononucleosis has been observed in some studies, and a link with Epstein–Barr virus has been proposed. In addition to the occupational associations discussed below, higher rates of the disease have been observed in people who have suppressed or compromised immune systems.
TABLE 7-39 Average Annual Incidence (per 100,000) of Hodgkin Disease in United Statesa
| 55-59 Years Old | 60-64 Years Old | 65-69 Years Old | |||||||
| All Races | White | Black | All Races | White | Black | All Races | White | Black | |
| Men | 4.0 | 4.0 | 2.4 | 3.8 | 4.0 | 4.4 | 4.5 | 4.8 | 4.7 |
| Women | 2.0 | 1.9 | 3.6 | 2.2 | 2.3 | 1.6 | 3.4 | 3.8 | 3.1 |
aSurveillance, Epidemiology, and End Results program, nine standard registries, crude age-specific rates, 2004–2008 (NCI, 2010).
Conclusions from VAO and Previous Updates
The committee responsible for VAO determined that there were sufficient epidemiologic data to support an association between exposure to the chemicals of interest and HL. Additional studies available to the committees responsible for Update 1996, Update 1998, Update 2000, Update 2002, Update 2004, Update 2006, and Update 2008 did not change that conclusion. Table 7-40 summarizes the results of the relevant studies.
Update of the Epidemiologic Literature
Vietnam-Veteran Studies No studies concerning exposure to the chemicals of interest and HL specifically in the Vietnam-veteran population have been published since Update 2008.
In their update of mortality in the ACC cohort through 2005, Cypel and Kang (2010) presented estimates of association between the chemicals of interest and all LHCs and leukemias in deployed and nondeployed veterans but no results for specific lymphoid cancers.
Occupational Studies The Dow Chemical Company site in Midland, Michigan, produced TCP or 2,4,5-T from 1942 to 1982 and PCP from 1937 to 1980. Some of the workers were exposed to both TCP and PCP. Historical exposures were estimated by evaluating serum dioxin in some of the workers (reported in Collins et al., 2008); their vital status was followed from 1942 to 2003 in the TCP study (Collins et al., 2009a) and from 1940 to 2003 in the PCP study (Collins et al., 2009b), and cause-specific death rates and trends with exposure were evaluated. No deaths from HL were identified in the study of PCP workers (Collins et al., 2009b), but the TCP study (Collins et al., 2009a), included in the NIOSH eight-plant cohort, found that the SMR of HL was 1.8 (95% CI 0.2–6.4); the finding was not statistically significant.
McBride et al. (2009a,b) published an occupational mortality study of workers in the Dow AgroSciences plant in New Plymouth, New Zealand, who
TABLE 7-40 Selected Epidemiologic Studies—Hodgkin Lymphoma
| Reference | Study Populationa | Exposed Casesb |
Exposure of Interest/ Estimated Risk (95% CI)b |
| VIETNAM VETERANS | |||
| US Air Force Health Study—Ranch Hand veterans vs SEA veterans | All COIs | ||
| Akhtar et al., 2004 | White Air Force Ranch Hand veterans vs national rates (lymphopoietic cancel)—incidence |
||
| Ranch Hand veterans | 10 | 0.9(0.4-1.5) | |
| Comparison Air Force veterans | 9 | 0.6(0.3-1.0) | |
| AFHS, 2000 | Air Force Ranch Hand veterans | 1 | 0.3 (0.0-3.2) |
| Michalek et al., 1990; Wolfe et al., 1990 |
Air Force Ranch Hand veteran | 0 | nr |
| US CDC Vietnam Experience Study | All COIs | ||
| Boehmer et al., 2004 | Follow-up of CDC VES cohort | 2 | 0.9 (nr) |
| Boyle et al., 1987 | Vietnam Experience Study | 0 | nr |
| US CDC Selected Cancers Study | All COIs | ||
| CDC, 1990a | US men born 1921-1953 | ||
| Vietnam veterans | 28 | 1.2(0.7-2.4) | |
| Army | 12 | 1.0(0.5-2.0) | |
| Marine Corps | 4 | 1.7(0.5-5.9) | |
| Air Force | 5 | 1.7(0.6-0.9) | |
| Navy | 7 | 1.1 (0.4-2.6) | |
| US VA Mortality Study of Army and Marine Veterans (ground troops serving July 4, 1965-March 1,1973) |
All COIs | ||
| Watanabe and Kang, 1996 | Marine Vietnam veterans | 25 | 1.9(1.2-2.7) |
| Watanabe et al., 1991 | Army Vietnam veterans vs Army non-Vietnam veterans | 116 | 1.0 (nr) |
| vs all non-Vietnam veterans | 116 | 1.1 (nr) | |
| Marine Vietnam veterans vs Marine non-Vietnam veterans | 25 | 1.9 (nr) | |
| vs all non-Vietnam veterans | 25 | I.O(nr) | |
| Breslin et al., 1988 | Vietnam-era veterans—deployed vs nondeployed | ||
| Army | 92 | 1.2(0.7-1.9) | |
| Marine Corps | 22 | 1.3(0.7-2.6) | |
| US VA Cohort of Female Vietnam Veterans | All COIs | ||
| Cypel and Kang, 2008 | US Vietnam veterans (lymphopoietic cancersc)—women | 18 | 0.7(0.4-1.3) |
| Vietnam-veteran nurses | 14 | 0.7(0.3-1.3) | |
| State Studies of Vietnam Veterans | All COIs | ||
| Visintainer et al., 1995 | PM study of deaths (1974-1989) of Michigan | 20 | 1.1 (0.7-1.8) |
| Vietnam-era veterans—deployed vs nondeployed | |||
| Reference | Study Populationa | Exposed Casesb |
Exposure of Interest/ Estimated Risk (95% CI)b |
| Anderson et al., 1986 | Wisconsin Vietnam veterans | 4 | nr |
| Holmes et al., 1986 | West Virginia Vietnam veterans compared with West Virginia Vietnam-era veterans |
5 | 8.3(2.7-19.5) |
| Lawrence et al., 1985 | New York Vietnam veterans compared with New York Vietnam-era veterans (lymphoma and HD) |
10 | 99% CI 1.0(0.4-2.2) |
| Australian Vietnam Veterans vs Australian Population | All COIs | ||
| ADVA, 2005a | Australian male Vietnam veterans vs Australian population—incidence |
51 | 2.1 (1.5-2.6) |
| Navy | 7 | 1.3(0.5-2.6) | |
| Army | 40 | 2.3(1.6-3.0) | |
| Air Force | 4 | 2.1 (0.6-5.3) | |
| ADVA, 2005b | Australian male Vietnam veterans vs Australian population—mortality |
13 | 0.9(0.5-1.5) |
| Navy | 2 | 0.6(0.1-2.1) | |
| Army | 11 | 1.1 (0.5-1.9) | |
| Air Force | 0 | 0.0 (0.0-2.9) | |
| Australian Conscripted Army National Service (deployed vs non deployed) | All COIs | ||
| ADVA, 2005c | Australian male conscripted Army National Service Vietnam era veterans: deployed vs non-deployed |
||
| Incidence | 12 | 0.9 (0.4-2.0) | |
| Mortality | 4 | 1.7(0.3-11.8) | |
| Fett et al. ,1987 | Australian Vietnam veterans | 0 | nr |
| OCCUPATIONAL | |||
| IARC Phenoxy Herbicide Cohort (mortality vs national mortality rates) | Dioxin, phenoxy herbicides | ||
| Kogevinas et al., 1997 | IARC cohort, male and female workers exposed to any phenoxy herbicide or chlorophenol |
10 | 1.0(0.5-1.8) |
| Exposed to highly chlorinated PCDDs | 8 | 1.3(0.6-2.5) | |
| Not exposed to highly chlorinated PCDDs | 1 | 0.3(0.0-1.5) | |
| Kogevinas et al., 1993 | IARC cohort, females—incidence | 1 | nr |
| Kogevinas et al., 1992 | IARC cohort (men and women) | 3 | 0.6(0.1-1.7) |
| Saracci et al., 1991 | IARC cohort, exposed subcohort (men and women) | 2 | 0.4(0.1-1.4) |
| NIOSH Mortality Cohort (12 US plants, production 1942–1984) (included in IARC and NIOSH cohorts) | Dioxin, phenoxy herbicides | ||
| Sleenland et al., 1999 | US chemical production workers | 3 | 1.1 (0.2-3.2) |
| Fingerhut et al., 1991 | NIOSH cohort—entire cohort | 3 | 1.2(0.3-3.5) |
| ≥ 1-yr exposure, ≥ 20-yr latency | 1 | 2.8(0.1-15.3) | |
| Reference | Study Populationa | Exposed Casesb |
Exposure of Interest/ Estimated Risk (95% CI)b |
| BASF Production Workers (included in IARC cohort) | Dioxin, phenoxy herbicides | ||
| Zober et al., 1990 | BASF employees—basic cohort | 0 | nr |
| Dow Chemical Company—Midland, MI (included in IARC and NIOSH cohorts) | Dioxin, phenoxy herbicides | ||
| Collins et al., 2009a | Trichlorophenol workers | 0 | 0.0 (0.0-6.4) |
| Collins et al., 2009b | Pentachlorophenol workers | 2 | 1.8(0.2-6.4) |
| Bums et al., 2001 | Dow 2,4-D production workers | 1 | 1.5(0.0-8.6) |
| Ramlow et al., 1996 | Dow pentachlorophenol production workers | 0 | nr |
| Bond et al., 1988 | Dow 2,4-D production workers | 1 | 2.7 (0.0-14.7) |
| Danish Production Workers (included in 1ARC cohort) | Dioxin, phenoxy herbicides | ||
| Hooiveld et al., 1998 | Dutch chemical production workers | 1 | 3.2(0.1-17.6) |
| German Production Workers (included in IARC cohort) | Dioxin, phenoxy herbicides | ||
| Becher et al., 1996 | German production workers | 0 | nr |
| New Zealand Production Workers—Dow plant in Plymouth, NZ (included in IARC cohort) |
Dioxin, phenoxy herbicides | ||
| McBride et al., 2009a | 1,599 Production workers (men and women) vs national rates—mortality 1969 through 2004 |
||
| Ever exposed | 1 | 4.2 (0.1-23.3) | |
| Never exposed | 0 | 0.0 (0.0-47.1) | |
| ’t Mannetje et al., 2006 | New Zealand phenoxy herbicide producers, sprayer | ||
| Phenoxy herbicide producers (men and women) | 1 | 5.6(0.1-31.0) | |
| Phenoxy herbicide sprayers (> 99% men) | 0 | 0.0(0.0-16.1) | |
| Agricultural Health Study | Herbicides | ||
| Alavanja et al., 2005 | US AHS—incidence | ||
| Private applicators (men and women) | 11 | 0.9(0.4-1.6) | |
| Spouses of private applicators (> 99% women) | 4 | 0.7(0.2-1.9) | |
| Commercial applicators (men and women) | 1 | 0.8(0.1-1.2) | |
| Blair et al., 2005a | US AHS | 3 | 1.1 (0.2-3.3) |
| Private applicators (men and women) | 3 | 1.7(0.3-1.8) | |
| Spouses of private applicators (> 99% women) | 0 | 0.0 (0.0-2.5) | |
| Torchio et al., 1994 | Italian licensed pesticide users | 11 | 1.0(0.5-1.7) |
| Reference | Study Populationa | Exposed Casesb |
Exposure of Interest/ Estimated Risk (95% CI)b |
| Oilier Aericultural Workers | Herbicides | ||
| Orsi el al., 2009 | Hospital-based case-control study in France—incidence (males only) | ||
| Occupational use of herbicides | 7 | 1.5(0.6-0.1) | |
| Phenoxy herbicides | 6 | 2.5 (0.8-7.7) | |
| Domestic use of herbicides | 19 | 0.8(0.4-1.6) | |
| Gambini et al., 1997 | Italian rice growers | 1 | 0.7 (0.0-3.6) |
| Blair et al., 1993 | US farmers in 23 slates | 56 | 1.0(0.8-1.3) |
| Alavanja et al., 1988 | USDA agricultural extension agents | ||
| PM analysis | 6 | 2.7(1.2-6.3) | |
| Case-conirol analysis | 6 | 1.1 (0.3-3.5) | |
| Dubrow et al., 1988 | Hancock County, Ohio, residents—farmers | 3 | 2.7 (nr) |
| Wiklund et al., 1988 | Swedish agricultural and forestry workers (men and women) | ||
| Workers in land or in animal husbandry | 242 | 1.0(0.9-1.2) | |
| Workers in silviculture | 15 | 2.3(1.3-3.7) | |
| Hoar el al., 1986 | Kansas residents | ||
| All farmers | 71 | 0.8(0.5-1.2) | |
| Farm use of herbicides (phenoxy acids and others) | 28 | 0.9(0.5-1.5) | |
| Farmers using herbicides > 20 days/yr | 3 | 1.0(0.2-1.1) | |
| Fanners using herbicides > 15 yrs | Hi | 1.2(0.5-2.6) | |
| Pearce et al., 1985 | New Zealand residents with agricultural occupations, 20-64 yrs of age | 107 | 1.1 (0.6-2.0) |
| Wiklund, 1983 | Swedish male and female agricultural workers—incidence | 226 | 99% CI 1.0(0.9-1.2) |
| Burmeisier, 1981 | Iowa farmers | 47 | 1.2 (ns) |
| Other Studies of Herbicide and Pesticide Applicators | Herbicides | ||
| Swaen et al., 2004 | Dutch licensed herbicide applicators | 0 | nr |
| Asp et al., 1994 | Finnish herbicide applicators | 2 | 1.7(0.2-6.0) |
| Swaen et al., 1992 | Dutch licensed herbicide applicators | 1 | 3.3(0.04-18.6) |
| Green, 1991 | Ontario herbicide sprayers | 0 | nr |
| Wiklund et al., 1989b | Swedish pesticide applicators | 15 | 1.5(0.8-2.4) |
| Riihimaki et al., 1982 | Finnish herbicide applicators | 0 | nr |
| Reference | Study Populationa | Exposed Casesb |
Exposure of Interest/ Estimated Risk (95% CI)b |
| Forestry Workers | Herbicides | ||
| Eriksson et al., 1992 | Swedish Cancer Registry patients (men and women) | ||
| Male sawmill workers | 10 | 2.2 (nr) | |
| Male farmers | 97 | 1.2 (nr) | |
| Male forestry workers | 35 | 1.2 (nr) | |
| Male horticulture workers | 11 | 1.2 (nr) | |
| Alavanja et al., 1989 | USDA forest, soil conservationists | 4 | 2.2 (0.6-5.6) |
| Paper and Pulp workers | Dioxin | ||
| McLean et al., 2006 | IARC cohort of pulp and paper workers Exposure to nonvolatile organochlorine compounds |
||
| Never | 7 | 0.6(0.2-1.2) | |
| Ever | 17 | 1.8(1.0-2.8) | |
| Rix et al., 1998 | Danish paper-mill workers—incidence | ||
| Men | 18 | 2.0(1.2-3.2) | |
| Women | 2 | 1.1 (0.1-3.8) | |
| Other Occupational Studies | |||
| Waterhouse et al., 1996 | Residents of Tecumseh, Michigan | 13 | Herbicides/ 2.0(1.1-3.4) |
| Phenoxy herbicides / 90% CI | |||
| Persson et al., 1993 | Swedish NHL patients—exposure to phenoxy herbicides | 5 | 7.4(1.4-40.0) |
| Ronco et al., 1992 | Danish workers—incidence | Herbicides | |
| Men—self-employed | 27 | 0.6 (p < 0.05) | |
| employee | 13 | 1.0 (nr) | |
| Female—self-employed | 1 | 1.1 (nr) | |
| employee | 1 | 1.2 (nr) | |
| family worker | 9 | 0.9 (nr) | |
| LaVecchia et al., 1989 | Residents of the Milan, Italy, area (men and women) | Herbicides, dioxin | |
| Agricultural occupations | nr | 2.1(1.0-3.8) | |
| Chemical-industry occupations | nr | 4.3(1.4-10.2) | |
| Persson et al., 1989 | Orebro (Sweden) Hospital patients (men and women) | Phenoxys /90% CI | |
| Farming | 6 | 1.2(0.4-3.5) | |
| Exposed to phenoxy acids | 4 | 3.8(0.7-21.0) | |
| Hardell and Bengtsson, 1983 | Umea (Sweden) Hospital patients—incidence | Phenoxys, chlorophenols | |
| Exposed to phenoxy acids | 14 | 5.0 (2.4-10.2) | |
| Exposed to high-grade chlorophenols | 6 | 6.5(2.2-19.0) | |
| Exposed to low-grade chlorophenols | 5 | 2.4 (0.9-6.5) | |
| Hardell et al., 1981 | Umea (Sweden) Hospital patients (all lymphomas)—incidence | Phenoxys, chlorophenols | |
| Exposed to phenoxy acids | 41 | 4.8(2.9-8.1) | |
| Exposed to chlorophenols | 50 | 4.3 (2.7-6.9) | |
| Reference | Study Populationa | Exposed Casesb |
Exposure of Interest/ Estimated Risk (95% CI)b |
| ENVIRONMENTAL Scvcso, Italy Residential Cohort |
TCDD | ||
| Consonni et al., 2008 | Seveso residents (men and women)—25-yr follow-up | ||
| Zone A | 0 | nr | |
| Zone B (Bertazzi et al. [12001, 1997] reported four HD cases in Zone B) | 3 | 2.2 (0.7-6.9) | |
| Zone R | 9 | 0.9(0.5-1.9) | |
| Pesatori et al., 2009 | Seveso—20-yr follow-up to 1996—incidence | ||
| Zone A | 0 | nr | |
| Zone B | 3 | 1.2(0.4-3.8) | |
| Zone R | 23 | 1.5(0.9-2.3) | |
| Bertazzi et al., 2001 | Seveso residents—20-yr follow-up Zone A, B—men | 2 | 2.6(0.6-10.9) |
| women | 2 | 3.7(0.9-16.0) | |
| Bertazzi et al., 1997 | Seveso residents—15-yr follow-up | ||
| Zone B—men | 2 | 3.3(0.4-11.9) | |
| women | 2 | 6.5 (0.7-23.5) | |
| Zone R—women | 4 | 1.9(0.5-4.9) | |
| Bertazzi et al., 1993 | Seveso residents—10-yr follow-up—incidence | ||
| Zone B—men | 1 | 1.7(0.2-12.8) | |
| women | 1 | 2.1 (0.3-15.7) | |
| Zone R—men | 4 | 1.1 (0.4-3.1) | |
| women | 3 | 1.0(0.3-3.2) | |
| Other Environmental Studies | 2.4.5-T | ||
| Read et al., 2007 | Residents of New Plymouth Territorial Authority, New Zealand near plant manufacturing 2,4,5-T (1962-1987) |
||
| Incidence | 49 | 1.1 (0.8-1.5)d | |
| 1970-1974 | 9 | 1.2(0.6-2.3) | |
| 1975-1979 | 9 | 1.1 (0.5-2.2) | |
| 1980-1984 | 8 | 1.1 (0.5-2.1) | |
| 1985-1989 | 9 | 1.3(0.6-2.5) | |
| 1990-1994 | 7 | 1.3(0.5-2.7) | |
| 1995-1999 | 4 | 0.7(0.2-1.7) | |
| 2000-2001 | 3 | 1.0(0.2-3.1) | |
| Mortality | 22 | 1.3(0.8-2.0)d | |
| 1970-1974 | 7 | 1.6(0.7-3.3) | |
| 1975-1979 | 4 | 1.2(0.3-3.0) | |
| 1980-1984 | 6 | 2.1 (0.8-0.5) | |
| 1985-1989 | 3 | 1.2(0.2-3.5) | |
| 1990-1994 | 1 | 0.6 (0.0-3.5) | |
| 1995-1999 | 1 | 0.6 (0.0-3.6) | |
| 2000-2001 | 0 | nr | |
| Reference | Study Populationa | Exposed Casesb |
Exposure of Interest/ Estimated Risk (95% CI)b |
| Italian case–control study—herbicide exposure in men, women with diagnosis of HD | 6 | Herbicides |
|
| Canadian men (at least 19 years old) in any of 6 provinces | Phenoxy Herbicides | ||
| Any phenoxy herbicide | 65 | 1.0 (0.7–1.4) | |
| 2,4-D | 57 | 1.0 (0.7–1.4) | |
| Mecoprop | 20 | 1.3 (0.7–2.2) | |
| MCPA | 11 | 1.2 (0.6–2.6) | |
| Residents around French municipal solid-waste incinerator—incidence | Dioxin | ||
| 9 | 1.5 (nr) | ||
ABBREVIATIONS: 2,4-D, 2,4-dichlorophenoxyacetic acid; 2,4,5-T, 2,4,5-trichlorophenoxyacetic acid; AHS, Agricultural Health Study; CDC, Centers for Disease Control and Prevention; CI, confidence interval; COI, chemical of interest; HD, Hodgkin disease; IARC, International Agency for Research on Cancer; MCPA, 2-methyl-4-chlorophenoxyacetic acid; MI, Michigan; NHL, non-Hodgkin lymphoma; NIOSH, National Institute for Occupational Safety and Health; nr, not reported; ns, not significant; NZ, New Zealand; PCDD, polychlorinated dibenzo-p-dioxin (highly chlorinated, if four or more chlorines); PM, proportionate mortality; SEA, Southeast Asia; TCDD, 2,3,7,8-tetrachlorodibenzo-p-dioxin; USDA, US Department of Agriculture; VA, US Department of Veterans Affairs; VES, Vietnam Experience Study.
aSubjects are male, and outcome is mortality unless otherwise noted.
bGiven when available; results other than estimated risk explained individually
cLymphopoietic cancers comprise all forms of lymphoma (including Hodgkin disease and non-Hodgkin lymphoma) and leukemia (ALL, AML, CLL, CML).
dCommittee computed total SMR and SIR by dividing sum of observed values by sum of expected values over all years, 95% CIs on these total ratios were computed with exact methods.
were potentially exposed to TCDD. Workers employed during January 1969–October 2003 were followed to the end of 2004, and SMRs were calculated by using national mortality figures.
Orsi et al. (2009) conducted a hospital-based case–control study in six counties in France in 2000–2004 to investigate the relationship between exposure to pesticides and the risk of lymphoid neoplasms. Exposures to pesticides— including insecticides, fungicides, and herbicides—were determined through
case-by-case expert reviews of responses to self-administered and face-to-face interviews. The exposure assessment was specific for particular pesticide groups (such as organochlorine insecticides and phenoxy herbicides). The risk of HL was somewhat increased after occupational exposure to herbicides in general (OR = 1.5, 95% CI 0.6–4.1) and increased by more after occupational exposure to phenoxy herbicides in particular (OR = 2.5, 95% CI 0.8–7.7). No association was observed, however, between HL and domestic use of herbicides (OR = 0.8, 95% CI 0.4–1.6). Those findings were consistent with the findings of previous studies.
Environmental Studies Pesatori et al. (2009) examined long-term effects of TCDD exposure in the 1976 accident in Seveso through mortality and cancer-incidence studies that covered the 20-year follow-up to 1996 and examined effects on males and females combined in three exposure zones. No cases of HL were identified in Zone A; there was a modest increase in HL risk in Zone R (RR = 1.46, 95% CI 0.91–2.29) and a less clear increase in risk in Zone B (RR = 1.20, 95% CI 0.38–3.78).
The grouped results for mortality from cancer of “lymphoid, haematopoietic and related tissue” in Finnish fishermen (33 cases) and their wives (10 cases) in the study by Turunen et al. (2008) are too nonspecific to be of use in evaluating an association with particular types of lymphohematopoietic malignancy.
Biologic Plausibility
HL arises from the malignant transformation of a germinal-center B cell and is characterized by malignant cells that have a distinctive structure and phenotype; these binucleate cells are known as Reed–Sternberg cells (Jaffe et al., 2008). No animal studies have shown an increase in HL after exposure to the chemicals of interest. Reed–Sternberg cells have not been demonstrated in mice or rats, so there is no good animal model of HL. Thus, there are no specific animal data to support the biologic plausibility of an association between the chemicals of interest and HL.
The biologic plausibility of the carcinogenicity of the chemicals of interest is discussed in general at the beginning of this chapter.
Synthesis
The relative rarity of HL complicates the evaluation of epidemiologic studies because their statistical power is generally low. Earlier studies (Eriksson et al., 1992; Hardell et al., 1981; Holmes et al., 1986; LaVecchia et al., 1989; Persson et al., 1993; Rix et al., 1998; Waterhouse et al., 1996; Wiklund et al., 1988) were generally well conducted and included excellent characterization of exposure, and they formed the basis of previous committees’ conclusions. Later findings have not contradicted those findings, especially given that most studies have had
low statistical power. The present committee notes that the four new studies for this update had uniformly increased risk estimates for HL—but with imprecise confidence intervals. Although it has not been demonstrated as clearly as for NHL, a positive association between the chemicals of interest and the development of HL is biologically plausible because of the common lymphoreticular origin of HL and NHL and their common risk factors.
Conclusion
On the basis of the evidence reviewed here and in previous VAO reports, the committee concludes that there is sufficient evidence of an association between exposure to at least one of the chemicals of interest and HL.
Non-Hodgkin lymphoma (ICD-9 200–200.8, 202–202.2, 202.8–202.9) is a general name for cancers of the lymphatic system other than HL or multiple myeloma. NHL comprises a large group of lymphomas that can be partitioned into acute and aggressive (fast-growing) or chronic and indolent (slow-growing) types of either B-cell or T-cell origin. B-cell NHL includes Burkitt lymphoma, diffuse large B-cell lymphoma, follicular lymphoma, large-cell lymphoma, precursor B-lymphoblastic lymphoma, and mantle-cell lymphoma. T-cell NHL includes mycosis fungoides, anaplastic large-cell lymphoma, and precursor T-lymphoblastic lymphoma.
As noted in earlier VAO updates, in response to requests from VA, CLL and HCL have been recognized as sharing many traits with NHL (including B-cell origin and immunohistochemical properties) and may progress to an acute aggressive form of NHL. The proposed WHO classification of NHL notes that CLL (ICD-9 204.1) and its lymphomatous form, SLL, are both derived from mature B cells (Chiorazzi et al., 2005; IARC, 2001). The current VAO committee has determined that it is more appropriate to consider these lymphatic malignancies with other forms of NHL. Therefore, discussion of CLL and HCL will no longer follow the general section on leukemia but have been moved into the NHL grouping.
ACS estimated that 35,380 men and 30,160 women would receive diagnoses of NHL in the United States in 2010 and that 10,710 men and 9,500 women would die from it (Jemal et al., 2010). The incidence of NHL is uniformly higher in men than in women and typically higher in whites than in blacks. In the groups that characterize most Vietnam veterans, incidence increases with age. In addition, ACS estimated that about 8,870 men and 6,120 women would receive diagnoses of CLL in the United States in 2010 and that 2,650 men and 1,740 women would die from it (Jemal et al., 2010). Nearly all cases occur after the age of 50 years. Average annual incidences of NHL are shown in Table 7-41 with the additional incidences of CLL.
TABLE 7-41 Average Annual Incidence (per 100,000) of Non-Hodgkin Lymphoma in United Statesa
|
|
|||||||||
| 55–59 Years Old | 60–64 Years Old | 65–69 Years Old | |||||||
| All Races | White | Block | All Races | White | Black | All Races | White | Black | |
|
|
|||||||||
| Men | 37.8 | 38.7 | 37.1 | 56.5 | 59.3 | 40.9 | 77.9 | 81.8 | 53.5 |
| Women | 27.7 | 29.5 | 21.7 | 40.0 | 41.9 | 35.7 | 53.0 | 56.8 | 35.9 |
|
|
|||||||||
aSurveillance, Epidemiology, and End Results program, nine standard registries, crude age-specific rates, 2004–2008 (NCI, 2010).
The causes of NHL are poorly understood. People who have suppressed or compromised immune systems are known to be at higher risk, and some studies show an increased incidence in people who have HIV, human T-cell leukemia virus type I, Epstein–Barr virus, or gastric Helicobacter pylori infections. The human retrovirus HTLV-1 causes adult T-cell lymphoma, but early reports that HTLV-2 might play a role in the etiology of HCL have not been substantiated. A broad spectrum of behavioral, occupational, and environmental risk factors have been proposed as contributors to the occurrence of NHL, but given the diversity of malignancies included under this name it is not too surprising that, aside from infectious agents, immune problems, and particular chemotherapies, specific risk factors have not been definitively established (Morton et al., 2008; Wang and Nieter, 2010).
Conclusions from VAO and Previous Updates
The committee responsible for VAO concluded that there was sufficient evidence to support an association between exposure to at least one of the chemicals of interest and NHL. Additional information available to the committees responsible for Update 1996, Update 1998, Update 2000, Update 2002, Update 2004, Update 2006, and Update 2008 did not change that conclusion. Table 7-42 summarizes the results of the relevant studies.
Update 2002 was the first to discuss CLL separately from other leukemias. The epidemiologic studies indicated that farming, especially with exposure to 2,4-D and 2,4,5-T, is associated with significant mortality from CLL. Many more studies support the hypothesis that herbicide exposure can contribute to NHL risk. Most cases of CLL and NHL reflect malignant transformation of germinal-center B cells, so these diseases could have a common etiology. Studies reviewed in Update 2002, Update 2004, Update 2006, Update 2008, and the present update are summarized in Table 7-43.
TABLE 7-42 Selected Epidemiologic Studies—Non-Hodgkin Lymphoma
| Reference | Study Populationa | Exposed Casesb |
Exposure of Interest/ Estimated Risk (95% CI)b |
| VIETNAM VETERANS | |||
| US Air Force Health Study-Ranch Hand veterans vs SEA veterans | All COIs | ||
| Akhtar et al., 2004 | White Air Force Ranch Hand veterans (lymphopoietic cancerc)-incidence | ||
| Ranch Hand veterans | 10 | 0.9 (0.4–1.5) | |
| Comparison Air Force veterans | 9 | 0.6 (0.3–1.0) | |
| AFHS, 2000 | Air Force Ranch Hand veterans—incidence | 1 | 0.2 (0.0-2.6) |
| Michalak | Air Force Ranch Hand veterans—mortality | ||
| etal., 1990 | Lymphatic and hematopoietic tissue | 0 | nr |
| Wolfe el al., | Air Force Ranch Hand veterans—incidence | 1 | nr |
| 1990 | |||
| US CDC Cohort of Army Chemical Corps | All COIs | ||
| Boehmer | Vietnam Experience Cohort | 6 | 0.9 (0.3-2.9) |
| et aL, 2004 | |||
| US CDC Vietnam Experience Study | All COIs | ||
| O’Brien etal.. 1991 | Army enlisted Vietnam veterans (all lymphomas) | 7 | 1.8 (nr) |
| US CDC Selected Cancers Study | All COIs | ||
| CDC, 1990b | US Vietnam veterans bom 1921-1953—incidence | 99 | 1.5(1.1-2.0) |
| Army Vietnam veterans | 45 | 1.2(0.8-1.8) | |
| Marine Vietnam veterans | 10 | 1.8(0.8-4.3) | |
| Air Force Vietnam veterans | 12 | 1.0(0.5-2.2) | |
| Navy Vietnam veterans | 32 | 1.9(1.1-3.2) | |
| Blue Water Navy Vietnam veterans | 28 | 2.2(1.2-3.9) | |
| US VA Mortality Study of Army and Marine Veterans (ground troops serving July 4. 1965-March 1.1973) | All COIs | ||
| Watanabe and Kang, 1996 | Marine Vietnam veterans (ICDA-8 200, 202) | 46 | 1.7(1.2-2.2) |
| Watanabe etal.. 1991 | Army Vietnam veterans vs non-Vietnam veterans (ICD-8 200, 202) | 140 | 0.8 (nr) |
| Army Vietnam veterans vs combined Army and | 140 | 0.9 (nr) | |
| Marine Vietnam-era veterans (ICD-8 200, 202) | |||
| Marine Vietnam veterans vs non-Vietnam veterans (ICD-8 200, 202) | 42 | 1.8(1.3-2.4) | |
| Marine Vietnam veterans vs combined Army and Marine Vietnam-era veterans (ICDA-8 200, 202) | 42 | 1.2 (nr) | |
| Breslin et al.. | Army Vietnam veterans (ICDA-8 200, 202) | 108 | 0.8(0.6-1.0) |
| 1988 | Marine Vietnam veterans (ICDA-8 200, 202) | 35 | 2.1 (1.2-3.8) |
| State Studies of US Vietnam Veterans | All COIs | ||
| Visintainer etal.. 1995 | PM study of deaths (1974-1989) of Michigan Vietnam-era veterans—deployed vs nondeployed | 32 | 1.5(1.0-2.1) |
| Reference | Study Populationa | Exposed Casesb |
Exposure of Interest/ Estimated Risk (95% CI)b |
| Clapp et al.. 1991 | Massachusetts Vietnam veterans | 1.2(0.6-2.4) | |
| Anderson etal.. 1986 | Wisconsin Vietnam veterans (includes lymphosarcoma, reticulosarcoma) | 4 | nr |
| Holmes etal.. 1986 | West Virginia Vietnam veterans vs West Virginia Vietnam-era veterans | 2 | 1.1(nr) |
| Lawrence etal.. 1985 | New York Vietnam veterans vs New York Vietnam-era veterans (all lymphomas) | 10 | 1.0(0.4-2.2) |
| US VA Cohort of Female Vietnam Veterans | All COIs | ||
| Cypel and Kang, 2008 | US Vietnam veterans—women (lymphopoietic cancersc) | 18 | 0.7(0.4-1.3) |
| Vietnam-veteran nurses | 14 | 0.7(0.3-1.3) | |
| Thomas etal., 1991 | US Vietnam veterans—women (NHL, ICD-8 200, 200-203, 208) | 3 | 1.3(0.3-1.8) |
| VA Case-Control Studies | All COIs | ||
| Dalager etal.. 1991 | US Vietnam veterans—incidence | 100 | 1.0(0.7-1.5) |
| US Navy Enlisted Personnel (January 1,1974-December 31, 1983) | All COIs | ||
| Garland et al., 1988 | Navy enlisted personnel (white males)—incidence | 68 | 0.7 (0.5-0.9) |
| US VA Marine Post-Service Mortality Study (ground troops i July serving 4,1965-March 1,1973) | All COIs | ||
| Burt etal.. | Army combat Vietnam veterans | 39 | 1.1(0.7-1.5) |
| 1987 | Marine combat Vietnam veterans | 17 | 3.2(1.4-7.4) |
| Army Vietnam veterans (service 1967-1969) | 64 | 0.9(0.7-1.3) | |
| Marine Vietnam veterans (service 1967-1969) | 17 | 2.5(1.1-5.8) | |
| Feu et al.. 1987 | Australian Vietnam veterans (ICD-8 200, 202) | 4 | 1.8(0.4-8.0) |
| Australian Vietnam Veterans vs Australian Population | All COIs | ||
| ADVA, | Australian male Vietnam veterans vs Australian | 126 | 0.7 (0.6-0.8) |
| 2005a | population—incidence | ||
| Navy | 31 | 0.8(0.5-1.0) | |
| Army | 86 | 0.7 (0.5-0.8) | |
| Air Force | 9 | 0.5 (0.2-0.9) | |
| ADVA, 2005b | Australian male Vietnam veterans vs Australian population—incidence | 70 | 0.8(0.6-1.0) |
| Navy | 10 | 0.5 (0.3-0.9) | |
| Army | 52 | 0.9(0.6-1.1) | |
| Air Force | 8 | 0.9(0.4-1.6) | |
| AIHW, 1999 | Australian Vietnam veterans—incidence (validation study) | Expected number of exposed cases 195% CI) | |
| 62 | 48 (34-62) | ||
| CDVA, 1998a | Australian Vietnam veterans—self-reported incidence | 137 | 48 (34-62) |
| Reference | Study Populationa | Exposed Casesb |
Exposure of Interest/ Estimated Risk (95% CI)b |
| CDVA, 1998b | Australian Vietnam veterans (women)—self-reported incidence | 2 | 0(0-4) |
| CDVA, 1997a | Australian military Vietnam veterans NHL deaths, 1980-1994 |
33 | 0.9(0.6-1.2) |
| Australian Conscripted Army National Service (deployed vs nondeployed) | All COIs | ||
| ADVA, 2005c | Australian male conscripted Army National Service Vietnam-era veterans: deployed vs nondeployed | ||
| Incidence | 35 | 1.1(0.7-1.9) | |
| Mortality | 21 | 1.4(0.7-2.8) | |
| OCCUPATIONAL | |||
| IARC Phenoxy Herbicide Cohort (mortality vs national mortality rates) | Dioxin. phenoxy herbicides | ||
| Kogevinas et al., 1997 | IARC cohort, male and female workers exposed to any phenoxy herbicide or chlorophcnol | 34 | 1.3(0.9-1.8) |
| Exposed to highly chlorinated PCDDs | 24 | 1.4(0.9-2.1) | |
| Not exposed to highly chlorinated PCDDs | 9 | 1.0(0.5-1.9) | |
| Kogevinas | IARC cohort (men and women)—incidence | ||
| etal., 1995 | Exposed to 2,4,5-T | 10 | 1.9(0.7-4.8) |
| Exposed to TCDD | 11 | 1.9(0.7-5.1) | |
| Kogevinas | IARC cohort (men and women) | ||
| etal., 1992 | Workers exposed to any phenoxy herbicide or chlorophenol | 11 | 1.0(0.5-1.7) |
| NIOSH Mortality Cohort (12 US plants, production 1942-1984) (included in IARC cohort) | Dioxin, phenoxy herbicides | ||
| Steenland etal., 1999 | US chemical production workers | 12 | 1.1(0.6-1.9) |
| Dow Chemical Company—Midland, MI (included in IARC and NIOSH cohorts) | Dioxin, phenoxy herbicides | ||
| Collins et al.. 2009a | Trichlorophenol workers | 9 | 1.3(0.6-2.5) |
| Collins et al.. 2009b | Pentachlorophenol workers | 8 | 2.4(1.0-4.7) |
| Bodner et al.. 2003 | Dow chemical production workers | nr | 1.4(0.6-2.7) |
| Burns et al.. 2001 | Dow 2,4-D production workers | 3 | 1.0(0.2-2.9) |
| Reference | Study Populationa | Exposed Casesb |
Exposure of Interest/ Estimated Risk (95% CI)b |
| Ramlow | Dow pentachlorophenol production workers | ||
| etal.. 1996 | All lymphopoietic cancer (ICDA-8 200-209) | ||
| 0-yr latency | 7 | 1.4(0.6-2.9) | |
| 15-yr latency | 5 | 1.3(0.4-3.1) | |
| Other, unspecified lymphopoietic cancer (ICDA-8 200, 202-203, 209) | |||
| 0-yr latency | 5 | 2.0 (0.7-4.7) | |
| 15-yr latency | 4 | 2.0(0.5-5.1) | |
| Bloemen etaL, 1993 | Dow 2,4-D production workers | 2 | 2.0(0.2-7.1) |
| Danish Production Workers (included in I ARC cohort) | Dioxin, phenoxy herbicides | ||
| Lynge, 1993 | Danish male and female production workers— updated incidence | ||
| Exposure to phenoxy herbicides (men) | 10 | 1.7(0.5-4.5) | |
| Dutch Production Workers (included in IARC cohort) | Dioxin, phenoxy herbicides | ||
| Boers et aL, | Dutch chlorophenoxy workers | ||
| 2010 | Factory A (MR for exposed vs unexposed) | 4 vs 3 | 0.9 (0.2-4.5) |
| Factory B (MR for exposed vs unexposed) | 1 vs 0 | nr | |
| Hooiveld etal.. 1998 | Dutch phenoxy herbicide workers | 3 | 3.8(0.8-11.0) |
| Bueno de Mcsquita etal.. 1993 | Dutch phenoxy herbicide workers | 2 | 3.0(0.4-10.8) |
| German Production Workers (included in IARC cohort) | Dioxin, phenoxy herbicides | ||
| Becher et al.. 1996 | German production workers | 6 | 3.3(1.2-7.1) |
| New Zealand Production Workers—Dow plant in Plymouth, NZ (included in IARC cohort) | Dioxin, phenoxy herbicides | ||
| McBride et al.. 2009a | 1,599 production workers (men and women) vs national rates—mortality 1969 through 2004 | ||
| Ever exposed | 3 | 1.6(0.3-4.7) | |
| Never exposed | 1 | 1.6(0.0-8.7) | |
| 't Mannetje et al.. 2005 | New Zealand phenoxy herbicide producers, sprayers | ||
| Phenoxy herbicide producers (men and women) | 1 | 0.9 (0.0-4.9) | |
| Phenoxy herbicide sprayers (> 99% men) | 1 | 0.7 (0.0-3.8) | |
| Reference | Study Populationa | Exposed Casesb |
Exposure of Interest/ Estimated Risk (95% CI)b |
| Agricultural Health Study | Herbicides | ||
| Samara et al., 2006 | Pesticide applicators in AHS—NHL incidence from enrollment through 2002 | ||
| Dicamba—lifetime days exposure | |||
| None | 39 | 1.0 | |
| l-<20 | 18 | 1.8 (1.0-3.2) | |
| 20-<56 | 14 | 1.3 (0.7-2.5) | |
| 56-<116 | 7 | 0.9 (0.4-2.2) | |
| ≥ 116 | 7 | 1.2 (0.5-2.9) p-trend = 0.92 |
|
| US AHS—incidence | |||
| Private applicators (men and women) | 114 | 1.0 (0.8-1.2) | |
| Spouses of private applicators (> 99% women) | 42 | 0.9 (0.6-1.2) | |
| Commercial applicators (men and women) | 6 | 1.0 (0.4-2.1) | |
| US AHS | |||
| Private applicators (men and women) | 33 | 0.9 (0.6-1.2) | |
| Spouses of private applicators (> 99% women) | 16 | 1.2 (0.7-2.0) | |
| California United Farm Workers | Herbicides | ||
| Nested case-control analyses of Hispanic workers in cohort of 139,000 California Uniicd Farm Workers | |||
| Ever used 2,4-D | nr | 3.8 (1.9-7.8) | |
| Other Agricultural Studies | Herbicides | ||
| Hospital-based case-control study in France—incidence (males only) | |||
| Occupational use of herbicides | 25 | 1.3 (0.7-2.2) | |
| Phenoxy herbicides | 11 | 0.9 (0.4-1.9) | |
| Domestic use of herbicides | 86 | 1.0 (0.7-1.5) | |
| Danish gardeners (lymphohematopoietic, ICD-7 200-205)—incidence | |||
| 10-yr follow-up (1975-1984) reported in |
15 | 1.4 (0.8-2.4) | |
| NHL (ICD-7 200, 202, 205) | 6 | 1.7 (0.6-3.8) | |
| HD (ICD-7 201) | 0 | nr | |
| Multiple myeloma (ICD-7 203) | 0 | nr | |
| CLL (ICD-7 204.0) | 6 | 2.8 (1.0-6.0) | |
| Other leukemias (ICD-7 204.1-204.4) | 3 | 1.4 (0.3-4.2) | |
| 25-yr follow-up (1975-2001) | |||
| Born before 1915 (high exposure) | 16 | 1.4 (0.9-2.3) | |
| Born 1915-1934 (medium exposure) | 25 | 1.2 (0.8-1.8) | |
| Born after 1934 (low exposure) | 1 | 0.2 (0.0-1.0) | |
| Reference | Study Populationa | Exposed Casesb |
Exposure of Interest/ Estimated Risk (95% CI)b |
| Chiu et al.. | Herbicide use—incidence | ||
| 2004 | Fanners (no herbicide use) | 294 | 1.2(1.0-1.5) |
| Farmers (herbicide use) | 273 | 1.0(0.8-1.2) | |
| Lee ct al.. | Asthmatics—incidence | ||
| 2004b | Herbicide exposure—phenoxyacetic acid Exposures among farmers | 17 | 1.3(0.7-2.4) |
| 2,4-D | 17 | 1.3(0.7-2.5) | |
| 2.4,5-T | 7 | 2.2(0.8-6.1) | |
| Nonasthmatics—incidence | |||
| Herbicide exposure—phenoxyacetic acid | 176 | 1.0(0.8-1.3) | |
| Exposures among farmers | |||
| 2,4-D | 172 | 1.0(0.8-1.3) | |
| 2,4.5-T | 36 | 1.1(0.7-1.8) | |
| Gambini elal., 1997 | Italian rice growers | 4 | 1.3(0.3-3.3) |
| Keller-Byrne elal.. 1997 | Farmers in central United States | nr | 1.3(1.2-1.6) |
| Nanni et al.. 1996 | Italian farming and animal-breeding workers (men and women) (NHL other than lymphosarcoma and reticulosarcoma)—incidence | ||
| Exposure to herbicides | 3 | 1.4(0.4-5.7) | |
| Amadori etal.. 1995 | Italian farming, animal-breeding workers (men and women)—incidence | ||
| NHL, CLL combined | 164 | 1.8(1.2-2.6) | |
| Dean, 1994 | Irish farmers and farm workers Other malignant neoplasms of lymphoid and histiocytic tissue (including some types of NHL) (ICD-9 202) | ||
| Men | 244 | nr | |
| Women | 84 | nr | |
| Morrison | Farm operators in three Canadian provinces | ||
| etal., 1994 | All farm operators | nr | 0.8 (0.7-0.9) |
| Highest quartile of herbicides sprayed | 19 | 2.1(1.1-3.9) | |
| Highest quartile of herbicides sprayed relative to no spraying | 6 | 3.0(1.1-8.1) | |
| Blair et al.,1993 | US farmers in 23 states (white men) | 843 | 1.2(1.1-1.3) |
| Zahm et al.,1993 | Females on eastern Nebraska farms | 119 | 1.0(0.7-1.4) |
| Ronco et al., | Danish farm workers—incidence | 147 | 1.0 (nr) |
| 1992 | Italian farm workers—mortality | 14 | 1.3 (nr) |
| Wigle et al., | Canadian farmers | ||
| 1990 | All farmers | 103 | 0.9(0.8-1.1) |
| Spraying herbicides on 250+ acres | 10 | 2.2(1.0-4.6) | |
| Reference | Study Populationa | Exposed Casesb |
Exposure of Interest/ Estimated Risk (95% CI)b |
| Zahm cl al., | Eastern Nebraska residents—incidence | ||
| 1990 | Ever done farm work | 147 | 0.9(0.6-1.4) |
| Ever mixed or applied 2,4-D | 43 | 1.5(0.9-2.5) | |
| Corrao et al., | Italian farmers licensed to apply pesticides | ||
| 1989 | Lymphatic tissue (ICD-8 200-202.9) | ||
| Licensed pesticide users and nonusers | 45 | 1.4(1.0-1.9) | |
| Farmers in arable land areas | 31 | 1.8(1.2-2.5) | |
| LaVecchia | Residents of Milan, Italy, area Imen and | ||
| etal., 1989 | women)—incidence | ||
| Agricultural occupations | nr | 2.1 (L3-3.4) | |
| Alavanja | USDA agricultural extension agents | nr | 1.2(0.7-2.3) |
| elal., 1988 | |||
| Dubrow | Hancock County, Ohio, residents—farmers | 15 | 1.6(0.8-3.4) |
| etal., 1988 | |||
| Hoar cl al., | Kansas residents—incidence | ||
| 1986 | Farmers compared with nonfarmers | 133 | 1.4(0.9-2.1) |
| Farmers using herbicides at least 21 days/ | 7 | 6.0(1.9-19.5) | |
| year | |||
| Burmeisler | Iowa residents—farming exposures | 1,101 | 1.3 (nr) |
| etal., 1983 | |||
| Wiklund, | Swedish male and female agricultural | 99% CI | |
| 1983 | workers—incidence | 476 | 1.1(0.9-1.2) |
| Cantor. 1982 | Wisconsin residents—farmers | ||
| (ICD-8 200.0, 200.1,202.2) | 175 | 1.2(1.0-1.5) | |
| Other Studies of Herbicide and Pesticide Applicators | Herbicides | ||
| Torch io | Italian licensed pesticide users (ICD-8 | 15 | 0.9(0.5-1.5) |
| etal., 1994 | 202.0-202.9) | ||
| Asp et al., | Finnish herbicide applicators—incidence | ||
| 1994 | No latency | 1 | 0.4 (0.0-2.0) |
| 10-yr latency | 1 | 0.4 (0.0-2.4) | |
| Swaen et al., | Dutch herbicide applicators | 0 | nr |
| 1992 | |||
| Wiklund | Swedish pesticide applicators (men and | 27 | 1.1(0.7-1.6) |
| etal., 1989b | women)—incidence | ||
| Pearce et al., | New Zealand residents—incidence | ||
| 1987 | Farming occupations | 33 | 1.0(0.7-1.5) |
| Fencing work | 68 | 1.4(1.0-2.0) | |
| Woods et al., | Washington state residents—incidence | ||
| 1987 | Phenoxy herbicide use | nr | 1.1(0.8-1.4) |
| Chlorophenol use | nr | 1.0(0.8-1.2) | |
| Farming occupations | nr | 1.3(1.0-1.7) | |
| Forestry herbicide appliers | nr | 4.8(1.2-19.4) | |
| Pearce et al., | New Zealand residents (ICD-9 202 | ||
| 1986 | only)—incidence | ||
| Agricultural sprayers (phenoxy herbicides) | 19 | 1.5(0.7-3.3) | |
| Reference | Study Populationa | Exposed Casesb |
Exposure of Interest/ Estimated Risk (95% CI)b |
| Pcarce el al., | New Zealand residents with agricultural | nr | 1.4(0.9-2.0) |
| 1985 | occupations, 20-64 yrs of age—incidence | ||
| Riihimaki | Finnish herbicide applicators | 0 | nr |
| etaL, 1982 | |||
| Forestry Workers | Herbicides | ||
| Thorn et al., | Swedish lumberjacks exposed to phenoxyacetic | 2 | 2.3 (0.3-8.5) |
| 2000 | herbicides—incidence | ||
| Persson | Swedish NHL patients | ||
| etaL, 1993 | Exposure to phenoxy herbicides | 10 | 2.3 (0.7-7.2) |
| Occupation as lumberjack | 9 | 6.0(1.1-31.0) | |
| Alavanja | USDA forest, soil conservationists | 22 | 2.4(1.5-3.6) |
| et al., 1989 | |||
| Reif et al., | New Zealand forestry workers—nested case- | 7 | 1.8(0.9-4.0) |
| 1989 | control (ICD-9 200, 202)—incidence | ||
| Wiklund | Swedish agricultural, forestry workers (men | ||
| et al., 1988 | and women) | ||
| Workers in land, animal husbandry | 1.0(0.9-1.1) | ||
| Timber cutters | 0.9(0.7-1.1) | ||
| Paper and Pulp Workers | Dioxin | ||
| McLean | IARC cohort of pulp and paper workers—men. | ||
| et al., 2006 | women (ICD-9 200, 202) Exposure to nonvolatile organochlorine compounds | ||
| Never | 0.9(0.7-1.3) | ||
| Ever | 0.9(0.6-1.3) | ||
| Exposed to chlorophenols | 50 | 4.3 (2.7-6.9) | |
| Occupational Case-Control Studies | TCDD. Herbicides | ||
| Richardson | German case-control study, occupational | ||
| et al., 2008 | factors associated with MIL Chlorophenols | ||
| NHL—high-grade malignancy | 61 | 2.0(1.3-2.9) | |
| NHL—low-grade malignancy | 77 | 1.3(1.0-1.8) | |
| CLL | 44 | 0.9(0.6-1.3) | |
| Herbicides | |||
| NHL—high-grade malignancy | 56 | 2.2(1.4-3.3) | |
| NHL—low-grade malignancy | 79 | 1.4(1.0-1.9) | |
| CLL | 43 | 1.2(0.8-1.7) | |
| Fritschi | Population-based case—control study in New | Herbicides | |
| et al., 2005 | South Wales. Australia, 2000-2001 Phcnoxy herbicides | ||
| Nonsubstantial exposure | 10 | 0.7(0.3-1.7) | |
| Reference | Study Populationa | Exposed Casesb |
Exposure of Interest/ Estimated Risk (95% CI)b |
| Pooled analysis of Swedish case—control studies of NHL. hairy-cell leukemia | Herbicides | ||
| Herbicide exposure | 77 | 1.8 (1.3-2.4) | |
| Phenoxyacetic acids | 64 | 1.7 (1.2-2.3) | |
| MCPA | 21 | 2.6 (1.4-4.9) | |
| 2,4-D, 2,4,5-T | 48 | 1.5 (1.0-2.2) | |
| Other | 15 | 2.9 (1.3-6.4) | |
| Substantial exposure | 5 | 1.8 (0.4-7.4) | |
| Other Occupational Studies | Herbicides | ||
| Nebraska residents (men and women), NHL reclassified according to specific chromosomal translocation (t[14;18][q32;q21])—incidence | |||
| Translocation present in cases | |||
| Herbicides | 25 | 2.9 (1.1-7.9) | |
| Translocation absent in cases | |||
| Herbicides | 22 | 0.7 (0.3-1.2) | |
| Residents of 11 areas in Italy (NHL other than lymphosarcoma and reticulosarcoma)—incidence | Herbicides | ||
| Phcnoxy acid herbicides exposure | |||
| Men | 18 | 1.0 (0.5-2.0) | |
| Women | 11 | 1.3 (0.5-3.7) | |
| 2.4-D exposure | |||
| Men | 6 | 0.7 (0.3-1.9) | |
| Women | 7 | 1.5 (0.4-5.7) | |
| Umea (Sweden) 1 lospital patients—incidence | Herbicides | ||
| Exposure to phenoxy herbicides | 25 | 5.5 (2.7-11.0) | |
| Exposure to chlorophenols | 35 | 4.8 (2.7-8.8) | |
| Australian residents | Herbicides | ||
| Exposure > 1 day | 15 | 1.5 (0.6-3.7) | |
| Exposure > 30 days | 7 | 2.7 (0.7-9.6) | |
| Residents of seleeted Italian provinces | |||
| Male residents of contaminated areas | nr | 2.2 (1.4-3.5) | |
| Orebro (Sweden) Hospital (men and women)—incidence | Herbicides | ||
| Exposed to phenoxy acids | 6 | 4.9 (1.0-27.0) | |
| Lund (Sweden) Hospital patients—incidence | Herbicides | ||
| Exposed to herbicides | nr | 1.3 (0.8-2.1) | |
| Exposed to chlorophenols | nr | 1.2 (0.7-2.0) | |
| Umea (Sweden) Hospital patients (lymphoma and HD)—incidence | Phenoxy herbicides | ||
| Exposed to phenoxy acids | 41 | 4.8 (2.9-8.1) | |
| Reference | Study Populationa | Exposed Casesb |
Exposure of Interest/ Estimated Risk (95% CI)b |
| ENVIRONMENTAL | |||
| Seveso, Italy Residential Cohort | TCDD | ||
| Seveso residents—25-yr follow-up—men, women | |||
| Zone A | 3 | 3.4 (1.1–10.5) | |
| Zone B | 7 | 1.2 (0.6–2.6) | |
| Zone R | 40 | 1.0 (0.7–1.4) | |
| Seveso—20-yr follow-up to 1996—incidence | |||
| Zone A | 1 | 0.8 (0.1–5.7) | |
| Zone B | 12 | 1.5 (0.9–2.7) | |
| Zone R | 49 | 0.9 (0.7–1.2) | |
| Seveso residents—20-yr follow-up | |||
| Zone A, B— menwomen | 3 | 1.2 (0.4–3.9) | |
| 4 | 1.8 (0.7–4.9) | ||
| Seveso residents—15-yr follow-up | |||
| Zone B—men | 2 | 1.5 (0.2–5.3) | |
| Zone R— menwomen | 10 | 1.1 (0.5–2.0) | |
| 8 | 0.9 (0.4–1.7) | ||
| Seveso residents—10-yr follow-up—incidence | |||
| Zone B— menwomen | 3 | 2.3 (0.7–7.4) | |
| 1 | 0.9 (0.1–6.4) | ||
| Zone R— menwomen | 12 | 1.3 (0.7–2.5) | |
| 10 | 1.2 (0.6–2.3) | ||
| Seveso residents—incidence | |||
| Zones A, B— menwomen | 3 | 1.9 (0.6–6.1) | |
| 1 | 0.8 (0.1–5.5) | ||
| Zone R— menwomen | 13 | 1.4 (0.7–2.5) | |
| 10 | 1.1 (0.6–2.2) | ||
| Seveso residents—10-yr follow-up | |||
| Zone B—women (ICD-9 200–208) | 2 | 1.0 (0.3–4.2) | |
| Zone R— men (ICD-9 202)women (ICD-9 202) | 3 | 1.0 (0.3–3.4) | |
| 4 | 1.6 (0.5–4.7) | ||
| Populations with Residential Proximity to Chemical Plant or Incinerator | TCDD | ||
| Residents near French solid-waste incinerator—incidence | |||
| Highly exposed census group vs slightly exposed | 1.1 (1.0–1.3) | ||
| Residents of New Plymouth Territorial Authority, New Zealand near plant manufacturing 2,4,5-T (1962–1987) | All COIs | ||
| Incidence | 223 | 1.0 (0.9–1.1)d | |
| 1970–1974 | 33 | 1.8 (1.2–2.5) | |
| 1975–1979 | 29 | 1.3 (0.9–1.9) | |
| 1980–1984 | 22 | 0.8 (0.5–1.3) | |
| 1985–1989 | 24 | 0.7 (0.5–1.1) | |
| Reference | Study Populationa | Exposed Casesb |
Exposure of Interest/ Estimated Risk (95% CI)b |
| 1990-1994 | 35 | 0.8(0.6-1.1) | |
| 1995-1999 | 61 | 1.1 (0.8-1.4) | |
| 2000-2001 | 19 | 0.8 (0.5-1.3) | |
| Mortality | 138 | 1.1 (0.9-13)d | |
| 1970-1974 | 19 | 1.6(0.9-2.4) | |
| 1975-1979 | 24 | 1.6(1.0-2.4) | |
| 1980-1984 | 14 | 1.0(0.5-1.6) | |
| 1985-1989 | 25 | 1.3(0.9-2.0) | |
| 1990-1994 | 23 | 0.9(0.6-1.4) | |
| 1995-1999 | 21 | 0.7(0.4-1.1) | |
| 2000-2001 | 12 | 1.0(0.5-1.8) | |
| Floret et al, 2003 | Residents near French municipal solid-waste incinerator—incidence | TCDD | |
| High exposure category | 31 | 2.3(1.4-3.8) | |
| Viel et al., 2000 | Residents near French solid-waste incinerator—incidence | TCDD | |
| Spatial cluster | 286 | 1.3 (p = 0.00003) | |
| 1991-1994 | 109 | 1.8 (p = 0.00003) | |
| Environmental Case-Control Studies | Pesticides, herbicides | ||
| Eriksson et al., 2008 | NHL case—control study of exposure to pesticides in Sweden (men and women)—incidence | ||
| Herbicides, total | 74 | 1.7(1.2-2.5) | |
| ≤ 20 days | 36 | 1.6(1.0-2.7) | |
| > 20 days | 38 | 1.9(1.1-3.2) | |
| Phenoxyacetic acids | 47 | 2.0(1.2-3.4) | |
| ≤ 45 days | 32 | 2.8(1.5-5.5) | |
| > 45 days | 15 | 1.3(0.6-2.7) | |
| MCPA | 21 | 2.8(1.3-6.2) | |
| ≤ 32 days | 15 | 3.8(1.4-10.5) | |
| > 32 days | 6 | 1.7(0.5-6.0) | |
| 2,4,5-T, 2,4-D | 33 | 1.6(0.9-3.0) | |
| ≤ 29 days | 21 | 2.1 (1.0-4.4) | |
| > 29 days | 12 | 1.3(0.6-3.1) | |
| Spinelli et al., 2007 | Case-control study in British Columbia, Canada Total dioxin-like PCBs |
dl-PCBs | |
| Lowest quartile | 82 | 1.0 | |
| Second quartile | 96 | 1.4(0.9-2.2) | |
| Third quartile | 82 | 1.6(1.0-2.5) | |
| Highest quartile | 143 | 2.4(1.5-3.7) p-trend < 0.001 |
|
| Reference | Study Populationa | Exposed Casesb |
Exposure of Interest/ Estimated Risk (95% CI)b |
| Miligi et al., 2006 | Italian case-control study of hematolymphopoietic malignancies NHL or CLL—ever exposed to herbicides |
Herbicides, pesticides | |
| Men and women | 73 | 1.0(0.7-1.4) | |
| Men | 49 | 0.8(0.5-1.3) | |
| Women | 24 | 1.3(0.7-2.5) | |
| NHL (men and women) | |||
| Phenoxy herbicides—ever | 32 | 1.1 (0.6-1.8) | |
| Probability of use more than "low," lack of protective equipment | 13 | 2.4 (0.9-7.6) | |
| 2,4-D—ever | 17 | 0.9(0.5-1.8) | |
| Probability of use more than "low," lack of protective equipment | 9 | 4.4(1.1-29.1) | |
| MCPA—ever | 18 | 0.9(0.4-1.8) | |
| Probability of use more than "low," lack of protective equipment | 7 | 3.4 (0.8-23.2) | |
| Xu et al., 2006 | Case-control study of nasal NK/T-cell lymphomas in East Asia (men and women)—incidence | Herbicides, pesticides | |
| Pesticide use | 23 | 4.0 (2.0-8.1) | |
| Herbicide | 13 | 3.2(1.4-7.4) | |
| Insecticide | 20 | 3.5(1.7-7.1) | |
| Fungicide | 10 | 6.1 (2.0-18.5) | |
| Harlge el al., 2005 | NCI SEER case-control study (Iowa, Los Angeles County, Detroit, Seattle) 1998-2000 Exposures to 2,4-D in carpet dust (ng/g) |
2,4-D | |
| Under detection limit | 147 | 1.0 | |
| <500 | 257 | 1.1 (0.8-1.6) | |
| 500-999 | 86 | 0.9(0.6-1.5) | |
| 1,000-9,999 | 165 | 0.7(0.5-1.0) | |
| > 10,000 | 24 | 0.8 (0.4-1.7) | |
| Kato el al., 2004 | Population-based case—control study in upstate New York, women, 20-79 years old, 1995-1998 Home use only of herbicides, pesticides (times) |
Pesticides | |
| 0 | 231 | 1.0 | |
| 1-4 | 33 | 0.9(0.5-1.5) | |
| 5-17 | 30 | 0.7(0.4-1.3) | |
| 18-39 | 27 | 1.0(0.6-1.7) | |
| ≥40 | 40 | 0.9(0.5-1.5) | |
| Hardell | Case-control study of NHL—TEQ > 27.8, EA | Dioxin | |
| el al., 2001 | >80 | 8 | 2.8(0.5-18.0) |
| Reference | Study Populationa | Exposed Casesb |
Exposure of Interest/ Estimated Risk (95% CI)b |
| McDuffie et al., 2001 | Case-control study of NHL in Canada | Pesticides | |
| Exposed to phenoxy herbicides | 131 | 1.4(1.1-1.8) | |
| 2,4-D | 111 | 1.3(1.0-1.7) | |
| Mecoprop | 53 | 2.3(1.6-3.4) | |
| Lampi et al., 1992 | Finnish community exposed to chlorophenol contamination (men and women)—incidence |
16 | Chlorophenols / 2.8(1.4-5.6) |
ABBREVIATIONS: 2,4-D, 2,4-dichlorophenoxyacetic acid; 2,4,5-T, 2,4,5-trichlorophenoxyacetic acid; AHS, Agricultural Health Study; CDC, Centers for Disease Control and Prevention; CI, confidence interval; CLL, chronic lymphocytic leukemia; COI, chemical of interest; EA, Epstein–Barr virus early antigen; HD, Hodgkin disease; HR, hazard ratio; IARC, International Agency for Research on Cancer; ICD, International Classification of Diseases; ICDA, International Classification of Diseases, Adapted for Use in the United States; MCPA, 2-methyl-4-chlorophenoxyacetic acid; MI, Michigan; NCI, National Cancer Institute; NHL, non-Hodgkin lymphoma; NIOSH, National Institute for Occupational Safety and Health; nr, not reported; NZ, New Zealand; PCB, polychlorinated biphenyl; PCDD, polychlorinated dibenzo-p-dioxin (highly chlorinated, if four or more chlorines); PM, proportionate mortality; SEA, Southeast Asia; SEER, Surveillance, Epidemiology, and End Results; SIR, standard incidence ratio; TCDD, 2,3,7,8-tetrachlorodibenzo-p-dioxin; TEQ, toxicity equivalent quotient; USDA, US Department of Agriculture; VA, US Department of Veterans Affairs.
aSubjects are male, and outcome is mortality unless otherwise noted.
bGiven when available; results other than estimated risk explained individually.
cLymphopoietic cancers comprise all forms of lymphoma (including Hodgkin disease and non-Hodgkin lymphoma) and leukemia (ALL, AML, CLL, CML).
dCommittee computed total SMR and SIR by dividing sum of observed values by sum of expected values over all years; 95% CIs on these total ratios were computed with exact methods.
Update of the Epidemiologic Literature
Vietnam-Veteran Studies No studies concerning exposure to the chemicals of interest and NHL specifically in the Vietnam-veteran population have been published since Update 2008.
In their update of mortality in the ACC cohort through 2005, Cypel and Kang (2010) presented estimates of association between the chemicals of interest and all LHCs and leukemias in deployed and nondeployed veterans but no results for specific lymphoid cancers.
Occupational Studies Boers et al. (2010) followed up the mortality experience of retrospective cohorts in two Dutch chlorophenoxy herbicide manufacturing factories, which are included in the IARC cohort of phenoxy herbicide workers (Saracci et al., 1991). During 1955–1985, 1,167 workers in Factory A produced mainly 2,4,5-T. In Factory B, 1,143 workers produced 2,4-D, MCPA, and MCPP during 1965–1985. Determination of vital status through 2006 added
TABLE 7-43 Selected Epidemiologic Studies—Chronic Lymphocytic Leukemia
| Reference | Study Populationa | Exposed Casesb |
Exposure of Interest/ Estimated Risk (95% CI)b |
| VIETNAM VETERANS | |||
| Australian Vietnam Veterans vs Australian Population | All COIs | ||
| ADVA, 2005a | Australian Vietnam veterans vs Australian population—incidence | ||
| All branches | 58 | 1.2(0.7-1.7) | |
| Navy | 58 | 1.5(0.8-2.6 | |
| Army | 42 | 1.7(1.2-2.2) | |
| Air Force | 4 | 0.9 (0.2-2.2) | |
| OCCUPATIONAL | |||
| Residential Populations | Herbicides/pesticides | ||
| Richardson et al., 2008 | German residents, occupational factors associated with CLL—incidence | ||
| Chlorophenols | 44 | 0.9(0.6-1.3) | |
| Lowest tertile cumulative exposure | 12 | 0.9(0.4-1.8) | |
| Middle tertile | 15 | 0.9(0.5-1.8) | |
| Highest tertile | 17 | 0.9(0.5-1.6) p-trend = 0.770 |
|
| Herbicides | 43 | 1.2(0.8-1.7) | |
| Lowest tertile cumulative exposure | 13 | 1.3(0.7-2.7) | |
| Middle tertile | 15 | 1.3(0.7-2.5) | |
| Highest tertile | 15 | 1.0(0.5-1.9) p-trend = 0.755 |
|
| Waterhouse et al., 1996 | Residents of Tecumseh. Michigan (men and women)—incidence | 10 | 1.8(0.8-3.2) |
| Brown | Residents of Iowa, Minnesota | ||
| Ever farmed | 156 | 1.4(1.1-1.9) | |
| Any herbicide use | 74 | 1.4(1.0-2.0) | |
| Ever used 2,4,5-T | 10 | 1.6(0.7-3.4) | |
| Use at least 20 yrs before interview | 7 | 3.3(1.2-8.7) | |
| Other Agricultural Workers | Herbicides | ||
| Orsi et al., 2009 | Hospital-based case-control study in France—incidence (males only) | ||
| Occupational use of herbicides | 5 | 0.5(0.2-1.3) | |
| Phenoxy herbicides | 3 | 0.4(0.1-1.7) | |
| Amadori et al., 1995 | Workers in northeast Italy (men and women) | 15 | 2.3 (0.9-5.8) |
| Farming workers only | 5 | 1.6(0.5-5.2) | |
| Breeding workers only | 10 | 3.1 (1.1-8.3) | |
| Hansen et al., 1992 | Danish gardeners (men and women) | ||
| All gardeners | 6 | 2.5 (0.9-5.5) | |
| Male gardeners | 6 | 2.8(1.0-6.0) | |
| Blair and White, 1985 | 1,084 leukemia deaths in Nebraska 1957-1974 | ||
| Farmer usual occupation on death certificate | nr | 1.3 (p< 0.05) | |
| 248 CLL cases | nr | 1.7 (p< 0.05) | |
| Reference | Study Populationa | Exposed Casesb |
Exposure of Interest/ Estimated Risk (95% CI)b |
| Burmeister et al., 1982 | 1,675 leukemia deaths in Iowa 1968-1978 | ||
| Farmer usual occupation on death certificate | 1.2 (p < 0.05) | ||
| CLL | 132 | 1.7(1.2-2.4) | |
| Lived in 33 counties with highest herbicide use | nr | 1.9(1.2-3.1) | |
| Forestry Workers | Herbicides | ||
| Hertzman et al., 1997 | British Columbia sawmill worker with chlorophenate process (more hexa-, hepta-, and octa-chlorinated dibenzo-p-dioxins than TCDD), all leukemias—incidence |
47 | 1.2(0.9-1.5) |
| ALL | 2 | 1.0(0.2-3.1) | |
| CLL | 24 | 1.7(1.2-2.4) | |
| AML | 5 | 0.8 (0.3-1.7) | |
| CML | 7 | 1.1 (0.5-2.0) | |
| Other, unspecified | 5 | 0.5(0.2-1.0) | |
| ENVIRONMENTAL | |||
| Seveso, Italy Residential Cohort | TCDD | ||
| Consonni et al., 2008 | Seveso residents (men and women)—25-yr follow-up | ||
| Lymphatic leukemia (ICD-9 204) | |||
| Zone A | 0 | nr | |
| Zone B | 3 | 1.3(0.4-4.1) | |
| Zone R | 23 | 1.4(0.9-2.2) | |
| Pesatori et al., 2009 | Seveso—20-yr follow-up to 1996—incidence | ||
| Lymphatic leukemia (ICD-9 204) | |||
| Zone A | 1 | 2.8 (0.4-19.9) | |
| Zone B | 0 | nr | |
| Zone R | 13 | 0.8(0.5-1.5) | |
| pertazzi et al., 2001 | Seveso residents—20-yr follow-up | ||
| Lymphatic leukemia | |||
| Zones A, B—men | 2 | 1.6(0.4-6.8) | |
| women | 0 | nr | |
| Other Knvironmcntal Studies | 2,4,5-T | ||
| Read et al., 2007 | Residents of New Plymouth Territorial Authority, New Zealand near plant manufacturing 2,4,5-T (1962-1987) |
||
| Incidence | 104 | 1.3(l.l-1.6)c | |
| 1970-1974 | 16 | 2.5(1.4-4.1) | |
| 1975-1979 | 7 | 0.9(0.4-1.8) | |
| 1980-1984 | 21 | 2.6(1.6-3.9) | |
| 1985-1989 | 16 | 1.4(0.8-2.3) | |
| 1990-1994 | 13 | 0.9(0.5-1.6) | |
| 1995-1999 | 19 | 0.9(0.5-1.4) | |
| 2000-2001 | 12 | 1.1 (0.6-1.9) | |
| Reference | Study Populationa | Exposed Casesb |
Exposure of Interest/ Estimated Risk (95% CI)b |
| Mortality | 40 | 1.3 (0.9-1.8)c | |
| 1970-1974 | 7 | 1.7(0.7-3.5) | |
| 1975-1979 | 7 | 1.8(0.7-3.6) | |
| 1980-1984 | 6 | 1.4(0.5-3.0) | |
| 1985-1989 | 4 | 0.8 (0.2-2.2) | |
| 1990-1994 | 6 | 1.1 (0.4-2.5) | |
| 1995-1999 | 8 | 1.3(0.6-2.6) | |
| 2000-2001 | 2 | 0.8(0.1-2.8) | |
ABBREVIATIONS: 2,4,5-T, 2,4,5-trichlorophenoxyacetic acid; ALL, acute lymphocytic leukemia; AML, acute myelogenous leukemia; CI, confidence interval; CLL, chronic lymphocytic leukemia; CML, chronic myelogenous leukemia; COI, chemical of interest; ICD, International Classification of Diseases; nr, not reported; SIR, standard incidence ratio; SMR, standardized mortality ratio; TCDD, 2,3,7,8-tetrachlorodibenzo-p-dioxin.
aSubjects are male, and outcome is mortality unless otherwise noted.
bGiven when available; results other than estimated risk explained individually.
cThe total SMR/SIR were computed by dividing sum of observed values by sum of expected values over all years; 95% CIs on these total ratios were computed with exact methods.
15 years of follow-up to results reported previously (Bueno de Mesquita et al., 1993; Hooiveld et al., 1998). HRs were derived by using Cox proportional hazard models with attained age as the timescale. The two previous studies of this group had shown increased risks of death from NHL. Although increased risks of all cancers were observed previously in both Factory A (HR = 1.31, 95% CI 0.86–2.01) and Factory B (HR = 1.54, 95% CI 1.00–2.37), the later analysis no longer confirmed the increased risk of death from NHL (HR = 0.92, 95% CI 0.19–4.47) in Factory A. Only one case of NHL was observed in exposed workers in Factory B and none in the unexposed workers. That finding could not be attributed to the different statistical models that were used, inasmuch as the HR generated from Cox regression model was similar to the reported RR from the Poisson regression model that had been used in the second followup study. Perhaps an unknown latent period for NHL associated with the exposures has passed, and cases that would normally occur with increasing age of the controls now mask the previous finding.
Collins et al. (2008) estimated historical exposures by an evaluating serum dioxin in some of the workers exposed to dioxins at the Dow Chemical Company site that produced TCP and PCP in Midland, Michigan. There were 1,615 workers in the TCP cohort (Collins et al., 2009a) and 773 in the PCP cohort (Collins et al., 2009b), and 196 of the workers were exposed to both TCP and PCP. The vital status of the TCP workers was followed from 1942 to 2003 and that of the
PCP workers from 1940 to 2003, and cause-specific death rates and trends with exposure were evaluated. A modest or slight increase in NHL risk (SMR = 1.3, 95% CI 0.6–2.5) was observed in TCP production-site workers (Collins et al., 2009a), but a larger and almost statistically significant increase in risk was identified (SMR = 2.4, 95% CI 1.0–4.7) in PCP-plant workers (Collins et al., 2009b). As stated before, the potential chemicals of interest have been considered by the present committee in evaluating study findings.
McBride et al. (2009a,b) published an occupational mortality study of workers in the Dow AgroSciences plant in New Plymouth, New Zealand, who were potentially exposed to TCDD. Workers employed during January 1969– October 2003 were followed to the end of 2004, and SMRs were calculated by using national mortality figures. McBride et al. (2009a) examined the overall mortality in TCP manufacturing workers (1,599, employed during 1969–1988). The SMR and proportional hazards models were used to evaluate risk from exposure. The study reported a 60% increase in NHL risk (SMR = 1.6, 95% CI 0.3–4.7; three deaths in exposed workers); the wide confidence interval, including values substantially below 1, makes this finding inconclusive. The results in McBride et al. (2009b) have not been included because they were diluted by inclusion of a set of workers who had no opportunity for TCDD exposure and no observed deaths.
Orsi et al. (2009) conducted a hospital-based case–control study in six counties in France in 2000–2004 to investigate the relationship between occupational exposures to pesticides and the risk of lymphoid neoplasms categorized according to the WHO system, ICD-O-3 (International Classification of Diseases for Oncology, 3rd edition). The lymphoid neoplasms analyzed included HL, NHL, lymphoproliferative syndromes (CLL and HCL), and multiple myeloma. Exposures (both occupational and domestic) to pesticides—including insecticides, fungicides, and herbicides—were evaluated through specific interviews and case-by-case expert reviews. The exposure assessment specified particular pesticide groups (such as organochlorine insecticides and phenoxy herbicides). The risk of NHL was somewhat increased after occupational exposure to herbicides in general (OR = 1.3, 95% CI 0.7–2.2), but no association was observed between occupational exposure to phenoxy herbicides and NHL risk (OR = 0.9, 95% CI 0.4–1.9). A modest association was observed between garden pesticide use and NHL (OR = 1.4, 95% CI 1.0–2.0) but not between domestic use of herbicides and NHL (OR = 1.0, 95% CI 0.7–1.5). No association was observed between occupational exposure to herbicides and CLL (OR = 0.5, 95% CI 0.2–1.3) or between phenoxy herbicides and CLL (OR = 0.4, 95% CI 0.1–1.7).
Environmental Studies Pesatori et al. (2009) examined long-term effects of TCDD exposure in the 1976 accident in Seveso through a cancer-incidence study that covered the 20-year follow-up to 1996 and examined effects on males and females separately in three exposure zones. A positive association was not identified in Zone A (RR = 0.80, 95% CI 0.11–5.69) or in Zone R (RR = 0.90, 95% CI
0.66–1.22), but a modest, statistically nonsignificant increase in NHL risk was detected in Zone B (RR = 1.51, 95% CI 0.85–2.69). Nonsignificant increases in lymphatic leukemia (ICD-9 204) were seen in Zone A (RR = 2.78, 95% CI 0.39–19.9) and Zone R (RR = 0.83, 95% CI 0.46–1.48) on the basis of 1 and 13 cases, respectively. No cases of lymphatic leukemia were reported in Zone B.
Viel et al. (2008) studied exposure to dioxin emissions from municipal solid-waste incinerators, the major source of dioxin exposure of public concern in France. The study examined an association of dioxin exposure and NHL incidence in 3,974 people in 1990–1999 in the populations residing in the vicinity of 13 French municipal waste incinerators. The study area incorporated four French administrative departments, comprising a total of 2,270 block groups, and the cumulative ground-level dioxin concentrations were calculated for each block group on the basis of modeling of sparse 1972–1985 emmisions data. A statistically significant relationship was found at the block-group level between dioxin exposure and risk of NHL (RR = 1.12, 95% CI 1.00–1.25) in persons who lived in highly exposed census blocks compared with those who lived in slightly exposed block groups. Although the observed increase in RR is small, a dose–response relationship with increased exposure to dioxin was observed.
Additional analyses of NHL in several previously studied populations have been published since Update 2008, but they did not present new information with sufficient specificity for the chemicals of interest in the VAO series. McDuffie et al. (2009) investigated the interaction of family history with pesticide exposure in the Canadian case–control study reported on earlier by McDuffie et al. (2001) and Pahwa et al. (2006). Ng et al. (2010) explored the role of AHR polymorphisms in response to several dioxin-like PCBs in another Canadian case–control study of NHL reported on by Spinelli et al. (2007). Colt et al. (2009) reported on the influence of polymorphisms in 36 immune genes and toxic equivalents in the National Cancer Institute SEER case–control study of NHL (De Roos et al., 2005a; Hartge et al., 2005).
The grouped results for mortality from cancer of “lymphoid, haematopoietic and related tissue” in Finnish fishermen (33 cases) and their wives (10 cases) in the study by Turunen et al. (2008) are too nonspecific to be of use in evaluating an association with particular types of lymphohematopoietic malignancy.
The temporal correspondence of the years of greatest PCB use with marked increase and then plateauing in NHL incidence and several epidemiology studies reporting association of NHL with total serum concentrations of PCB motivated a series of nested case–control studies on NHL analyzing the levels of individual PCB congeners and other organochlorines (not including dioxins or furans) in existing biologic samples from prospective cohorts (Bertrand et al., 2010; Engel et al., 2007; Laden et al., 2010). Engel et al. (2007) conducted parallel nested analyses on three cohorts: more than 87,000 Norwegian men and women assembled in the 1970s; almost 24,000 residents of Washington County, Maryland, gathered in 1974; and a pilot sample from the Nurses’ Health Study with bloods
drawn in 1989. PCB-118, a dioxin-like PCB, is among the congeners most consistently detected in human samples; it and the two other PCBs measured most reliably in these three cohorts (PCB-138 and -153) were the targets of statistical analysis. Significant dose–response relationships were found for each of these congeners in all three cohorts, with the results being strongest for PCB-118. Working from the cohort established in 1982 for the Physicians’ Health Study, Bertrand et al. (2010) found less pronounced results for PCB-118 and a set of six “immunotoxic PCBs” (PCB-66, -74, -105, -118, -156, and -167, of which four are dioxin-like) suggested by Wolff et al. (1997) as a suitable hypothesis-driven group for analysis in epidemiology studies. The findings of Laden et al. (2010) from an analogous nested case–control study on the full Nurses’ Health Study were not supportive of an association. The findings of these PCB-focused studies are consistent with the associations with NHL repeatedly observed for the chemicals of interest in the VAO series, but the extent of intercorrelation of these persistent organic pollutants greatly curtails the degree to which any effect could be specifically attributed to “dioxin-like activity.”
Biologic Plausibility
The diagnosis of NHL encompasses a wide variety of lymphoma subtypes. In humans, about 85% are of B-cell origin and 15% of T-cell origin. In commonly used laboratory mice, the lifetime incidence of spontaneous B-cell lymphomas is about 30% in females and about 10% in males. Although researchers seldom note the subtypes of B lymphomas observed, lymphoblastic, lymphocytic, follicular, and plasma-cell lymphomas are seen in mice and are similar to types of NHL seen in humans. Laboratory rats are less prone to develop lymphomas, but Fisher 344 rats have an increased incidence of spontaneous mononuclear-cell leukemia of nonspecific origin. The lifetime incidence of leukemia is about 50% in male rats and about 20% in female rats. Neither mice nor rats develop T-cell lymphomas spontaneously at a predictable incidence, but T-cell–derived tumors can be induced by exposure to some carcinogens.
Several long-term feeding studies of various strains of mice and rats have been conducted over the past 30 years to determine the effects of TCDD on cancer incidence. Few of them have shown effects of TCDD on lymphoma or leukemia incidence. The NTP (1982a) reported no increase in overall incidence of lymphoma in female B6C3F1 mice exposed to TCDD at 0.04, 0.2, or 2.0 µg/kg per week for 104 weeks but found that histiocytic lymphomas (now considered to be equivalent to large B-cell lymphomas) were more common in the high-dose group. No effects on lymphoma incidence were seen in Osborne–Mendel rats treated with TCDD at 0.01, 0.05, or 0.5 µg/kg per week. Sprague–Dawley rats treated with TCDD at 0.003, 0.010, 0.022, 0.046, or 0.100 µg/kg per day showed no change in incidence of malignant lymphomas. Long-term exposure to phenoxy herbicides or cacodylic acid also has not resulted in an increased incidence
of lymphomas in laboratory animals. Thus, few laboratory animal data support the biologic plausibility of promotion of NHL by TCDD or other chemicals of interest.
In contrast, more recent studies at the cellular level indicate that activation of the AHR by TCDD inhibits apoptosis, a mechanism of cell death that controls the growth of cancer cells. Vogel et al. (2007) studied human cancer cells in tissue culture and showed that addition of TCDD inhibited apoptosis in histiocytic-lymphoma cells, Burkitt-lymphoma cells, and NHL cell lines. The reduction in apoptosis was associated with an increase in the expression of Cox-2, C/EBP β, and Bcl-xL mRNA in the cells. Those expressed genes code for proteins that protect cells from apoptosis. The effects of TCDD on apoptosis were blocked when an AHR antagonist or a Cox-2 inhibitor was added to the culture; this demonstrated the underlying AHR-dependent mechanism of the effects. More important, when C57Bl/10J mice were given multiple doses of TCDD over a period of 140 days, premalignant lymphoproliferation of B cells was induced in the TCDD-treated mice before the appearance of any spontaneous lymphomas in the control mice. When the B cells were examined, they were found to manifest changes in gene expression similar to those induced by TCDD in the human cell lines, which provided support for this mechanism of lymphoma promotion by TCDD.
Recent evidence has shown that AHR activation by TCDD in human breast and endocervical cell lines induces sustained high concentrations of the IL-6 cytokine, which has tumor-promoting effects in numerous tissues (Hollingshead et al., 2008). IL-6 plays a roll in B-cell maturation and induces a transcriptional inflammatory response. It is known to be increased in B-cell neoplasms, including multiple myeloma and various lymphomas, especially diffuse large B-cell lymphomas (Hussein et al., 2002; Kato et al., 1998; Kovacs, 2006).
An alternative link that could help to explain the association between TCDD and NHL has been explored in human studies. Chromosomal rearrangements, with consequent expression dysregulation of various genes, are prevalent in B-cell lymphomas, and the t(14;18) reciprocal translocation, which juxtaposes the BCL2 with the locus of the immunoglobin heavy chain, is found in tumor cells in most cases of follicular lymphoma. Roulland et al. (2004) investigated the prevalence of the t(14;18) translocation that is characteristic of most cases of follicular lymphoma in 53 never-smoking and pesticide-using men in a cohort of French farmers whose pesticide exposures and confounding information had previously been well characterized; 21 blood samples had been gathered during periods of high pesticide use, and samples from the other 32 were drawn during a period of low pesticide use. The authors found a higher prevalence of cells carrying this translocation in the farmers whose blood had been drawn during a period of high pesticide use than in those whose blood had been drawn during a low-use period. Baccarelli et al. (2006) reported an increase in t(14;18) chromosomal translocation in lymphocytes from humans exposed to TCDD in the Seveso accident. In most cases of follicular lymphoma, tumor cells carry the t(14;18) chromosomal
translocation, and there is evidence to suggest that an increased frequency of lymphocytes from the peripheral blood carrying this tumor marker may be a necessary but not sufficient step toward development of follicular lymphoma (Roulland et al., 2006).
Synthesis
The first VAO committee found the evidence to be sufficient to support an association between exposure to at least one of the chemicals of interest and NHL. The evidence was drawn from occupational and other studies in which subjects were exposed to a variety of herbicides and herbicide components. As has generally been the case in previous updates, the new studies were largely concordant with the conclusion that there is an association with the chemicals of interest. For the present update, with the exception of the case–control study by Orsi et al. (2009), the new occupational studies of herbicide production workers (Boers et al., 2010; Collins et al., 2009a,b; McBride et al., 2009a) were largely supportive of earlier conclusions. Much of the earlier epidemiologic evidence suggests that 2,4-D or 2,4,5-T, rather than TCDD, might be responsible for the associations observed in occupational cohorts, but the new positive findings for NHL in residents around a municipal waste incinerator (Viel et al., 2008) support an association with TCDD exposure. The nonpositive findings on the incidence of NHL in the 20-year follow-up of the Seveso population (Pesatori et al., 2009) are contrary to the increasingly strong association with NHL mortality observed in the 25-year follow-up of the same population (Consonni et al., 2008) reviewed in Update 2008.
Individual findings on CLL are fairly few compared with the considerable number of studies supporting an association between exposure to the chemicals of interest and NHL. Some high-quality studies show that exposure to 2,4-D and 2,4,5-T appears to be associated with CLL, including the incidence study of Australian veterans (ADVA, 2005a), the case–control study by Hertzman et al. (1997) of British Columbia sawmill workers exposed to chlorophenates, the Danish-gardener study (Hansen et al., 1992), and the population-based case–control study in two US states by Brown et al. (1990) that showed increased risks associated with any herbicide use and specifically use of 2,4,5-T for at least 20 years before interview. Other studies that showed positive associations but do not contribute greatly to the overall conclusion include the population-based case–control study by Amadori et al. (1995) that made use of occupational titles but did not include specific assessments of exposure to the chemicals; the cancer-incidence study in Tecumseh County, Michigan, in which no exposure assessments were available (Waterhouse et al., 1996); and proportionate-mortality studies by Blair and White (1985) and Burmeister et al. (1982).
Conclusions
On the basis of the evidence reviewed here and in previous VAO reports, the committee concludes that there is sufficient evidence of an association between exposure to at least one of the chemicals of interest and NHL.
Multiple myeloma (ICD-9 203) is characterized by proliferation of bone-marrow stem cells that results in an excess of neoplastic plasma cells and in the production of excess abnormal proteins, usually fragments of immunoglobulins. Multiple myeloma is sometimes grouped with other immunoproliferative neoplasms (ICD-9 203.8). ACS estimated that 11,170 men and 9,010 women would receive diagnoses of multiple myeloma in the United States in 2010 and that 5,760 men and 4,890 women would die from it (Jemal et al., 2010). The average annual incidence of multiple myeloma is shown in Table 7-44.
The incidence of multiple myeloma is highly age-dependent and is relatively low in people under 40 years old. The incidence is slightly higher in men than in women, and the difference becomes more pronounced with age.
An increased incidence of multiple myeloma has been observed in several occupational groups, including farmers and other agricultural workers and those with workplace exposure to rubber, leather, paint, and petroleum (Riedel et al., 1991). People who have high exposure to ionizing radiation and those who suffer from other plasma-cell diseases, such as monoclonal gammopathy of unknown significance or solitary plasmacytoma, are also at greater risk.
Conclusions from VAO and Previous Updates
The committee responsible for VAO concluded that there was limited or suggestive evidence of an association between exposure to the chemicals of interest and multiple myeloma. Additional information available to the committees responsible for Update 1996, Update 1998, Update 2000, Update 2002, Update
TABLE 7-44 Average Annual Incidence (per 100,000) of Multiple Myeloma in United Statesa
| 55-59 Years Old | 60-64 Years Old | 65-69 Years Old | |||||||
| All Races | White | Black | All Races | White | Black | All Races | White | Black | |
| Men | 11.7 | 10.8 | 23.0 | 18.7 | 17.1 | 43.7 | 27.8 | 26.1 | 59.9 |
| Men | 8.0 | 7.3 | 15.1 | 13.0 | 11.2 | 31.6 | 18.5 | 16.6 | 39.5 |
aSurveillance, Epidemiology, and End Results program, nine standard registries, crude age-specific rates, 2004–2008 (NCI, 2010).
2004, Update 2006, and Update 2008 did not change that conclusion. Table 7-45 summarizes the results of the relevant studies.
Update of the Epidemiologic Literature
Vietnam-Veteran Studies No studies concerning exposure to the chemicals of interest and multiple myeloma specifically in the Vietnam-veteran population have been published since Update 2008.
In their update of mortality in the ACC cohort through 2005, Cypel and Kang (2010) presented estimates of an association between the chemicals of interest and all LHCs and leukemias in deployed and nondeployed veterans but gave no results for specific lymphoid cancers.
Occupational Studies McBride et al. (2009a,b) published an occupational mortality study of workers in the Dow AgroSciences plant in New Plymouth, New Zealand, who were potentially exposed to TCDD. Workers who were employed during January 1969–October 2003 were followed to the end of 2004, and SMRs were calculated by using national mortality figures. McBride et al. (2009a) examined overall mortality in 1,599 TCP manufacturing workers who were employed during 1969–1988. The SMR and proportional hazards models were used to evaluate risk posed by exposure. The study reported an increase in multiple myeloma (SMR = 2.2) that is statistically nonsignificant and inconclusive (95% CI 0.2–8.1; two deaths in the exposed). The results in McBride et al. (2009b) have not been included because they were diluted by inclusion of a set of workers who had no opportunity for TCDD exposure and no observed deaths.
Orsi et al. (2009) conducted a hospital-based case–control study in six counties in France in 2000–2004 to investigate the relationship between exposures to pesticides and the risk of various lymphoid neoplasms, including multiple myeloma. Exposures to pesticides were evaluated through specific interviews and case-by-case expert reviews. The exposure assessment specified particular pesticide groups (such as organochlorine insecticides and phenoxy herbicides). The risk of multiple myeloma was significantly increased in association with total occupational herbicide use (OR = 2.9, 95% CI 1.3–6.5), and a positive association was observed between exposure to phenoxy herbicides and multiple myeloma (OR = 2.6, 95% CI 0.9–7.1). However, no association between domestic use of herbicides and multiple myeloma was observed (OR = 1.0, 95% CI 0.6–2.0).
A nested case–control study of male pesticide applicators in the AHS (Landgren et al., 2009) found a statistically nonsignificant increase in monoclonal gammopathy of undetermined significance (MGUS) in association with exposure to 2,4-D (OR = 1.8, 95% CI 0.7–4.8) but not dicamba (OR = 0.9, 95% CI 0.5–1.8). MGUS is a benign clonal expansion of plasma cells that converts into multiple myeloma in a modest proportion of cases.
TABLE 7-45 Selected Epidemiologic Studies—Multiple Myeloma
| Reference | Study Populationa | Exposed Casesb |
Exposure of Interest/ Estimated Risk (95% CI)b |
| VIETNAM VETERANS | |||
| US Air Force Health Study—Ranch Hand veterans vs SEA veterans | All COIs | ||
| While Air Force Vietnam veterans (lymphopoietic cancers)—incidence | |||
| Ranch Hand veterans—incidence | 10 | 0.9 (0.4-1.5) | |
| Comparison Air Force veterans—incidence | 9 | 0.6 (0.3-1.0) | |
| Air Force Ranch Hand veterans | 2 | 0.7 (0.1-5.0) | |
| US CDC Vietnam Experience Study | All COIs | ||
| Follow-up of CDC VES cohort | 1 | 0.4 (nr) | |
| US VA Mortality Study of Army and Marine Veterans (ground troops serving July 4, 1965–March 1, 1973) | All COIs | ||
| Walanabe and Kang, 1996 | Army Vietnam veterans | 36 | 0.9 (nr) |
| Marine Vietnam veterans | 4 | 0.6 (nr) | |
| Army Vietnam veterans | 18 | 0.8 (0.2-2.5) | |
| Marine Vietnam veterans | 2 | 0.5 (0.0-17.1) | |
| US VA Cohort of Female Vietnam Veterans | All COIs | ||
| US Vietnam veterans—women (lymphopoietic cancers) vs nondeployed | 18 | 0.7 (0.4-1.3) | |
| Vietnam-veteran nurses only | 14 | 0.7 (0.3-1.3) | |
| Australian Vietnam Veterans vs Australian Population | All COIs | ||
| Australian male Vietnam veterans vs Australian population—incidence | 31 | 0.7 (0.4-0.9) | |
| Navy | 4 | 0.4 (0.1-1.0) | |
| Army | 21 | 0.7 (0.4-1.0) | |
| Air Force | 6 | 1.1 (0.4-2.4) | |
| Australian male Vietnam veterans vs Australian populat ion—mortality | 24 | 0.9 (0.5-1.2) | |
| Navy | 3 | 0.5 (0.1-1.5) | |
| Army | 15 | 0.8 (0.4-1.3) | |
| Air Force | 6 | 1.7 (0.6-3.6) | |
| Australian military Vietnam veterans | 6 | 0.6 (0.2-1.3) | |
| Australian Conscripted Army National Service (deployed vs nondeployed) | All COIs | ||
| Australian male conscripted Army National | |||
| Service Vietnam-era veterans—deployed vs nondeployed | |||
| Incidence | 8 | 2.1 (0.7-6.0) | |
| Mortality | 5 | 0.9 (0.2-3.4) | |
| Australian military Vietnam veterans | 0 | ||
| Reference | Study Populationa | Exposed Casesb |
Exposure of Interest/ Estimated Risk (95% CI)b |
| OCCUPATIONAL | |||
| IARC Phenoxy Herbicide Cohort (mortality vs national mortality rates) | Dioxin, phenoxy herbicides | ||
| Kogevinas et al., 1997 | IARC cohort, male and female workers exposed to any phenoxy herbicide or chlorophenol |
17 | 1.3(0.8-2.1) |
| Exposed to highly chlorinated PCDDs | 9 | 1.2(0.6-2.3) | |
| Not exposed lo highly chlorinated PCDDs | 8 | 1.6(0.7-3.1) | |
| Saracci et al., 1991 | IARC cohort (men and women)—exposed subcohort | 4 | 0.7(0.2-1.8) |
| NIOSH Mortality Cohort (12 US plants, production 1942–1984) (included in IARC cohort) | Dioxin, phenoxy herbicides | ||
| Steenland et al., 1999 | US chemical production workers | 10 | 2.1 (1.0-3.8) |
| Fingerhut et al., 1991 | NIOSH cohort—entire cohort | 5 | 1.6(0.5-3.9) |
| ≥ 1-yr exposure, ≥ 20-yr latency | 3 | 2.6 (0.5-7.7) | |
| Dow Chemical Company—Midland, MI (included in IARC and NIOSH cohorts) | Dioxin, phenoxy herbicides | ||
| Burns et al., 2001 | Dow 2,4-D production workers | 1 | 0.8 (0.0-4.5) |
| Danish Production Workers (included in IARC cohort) | Dioxin, phenoxy herbicides | ||
| Lynge, 1993 | Danish production workers—updated incidence | ||
| Men | 0 | nr | |
| Women | 2 | 12.5(1.5-45.1) | |
| Dutch Production Workers (included in IARC cohort) | Dioxin, phenoxy herbicides | ||
| Hooiveld et al., 1998 | Dutch phenoxy herbicide workers | 0 | 0.0 (nr) |
| German Production Workers (included in IARC cohort) | Dioxin, phenoxy herbicides | ||
| Becher et al., 1996 | German production workers—Plant I | 3 | 5.4(1.1-15.9) |
| New Zealand Production Workers—Dow plant in Plymouth, NZ (included in IARC cohort) | Dioxin, phenoxy herbicides | ||
| McBride et al., 2009a | 1,599 production workers (male and female) vs national rates—mortality 1969 through 2004 | ||
| Ever exposed | 2 | 2.2(0.2-8.1) | |
| Never exposed | 0 | 0.0(0.0-12.2) | |
| ’t Mannetje et al., 2005 | New Zealand phenoxy herbicide producers, sprayers | ||
| Phenoxy herbicide producers (men and women) | 3 | 5.5(1.1-16.1) | |
| Phenoxy herbicide sprayers (> 99% men) | 0 | 0.0 (0.0-5.3) | |
| Reference | Study Populationa | Exposed Casesb |
Exposure of Interest/ Estimated Risk (95% CI)b |
| Agricultural Health Study | Herbicides | ||
| Landgren et al., 2009 | US AHS—nested case-control study of MGUS among male private and commercial applicators | ||
| 2,4-D | 33 | 1.8(0.7-1.8) | |
| Dicamba | 17 | 0.9(0.5-1.8) | |
| Alavanja et al., 2005 | US AHS—incidence | ||
| Private applicators (men and women) | 43 | 1.3(1.0-1.8) | |
| Spouses of private applicators (> 99% women) | 13 | 1.1 (0.6-1.9) | |
| Commercial applicators (men and women) | 0 | 0.0 (0.0-2.7) | |
| Blair el al., 2005a | US AHS | ||
| Private applicators (men and women) | 11 | 0.6(0.3-1.2) | |
| Spouses of private applicators (> 99% women) | 5 | 0.9(0.3-2.1) | |
| Other Agricultural Workers | Herbicides | ||
| Orsi et al., 2009 | Hospital-based case-control study in France—incidence (males only) | ||
| Occupational use of herbicides | 12 | 2.9(1.3-6.5) | |
| Phenoxy herbicides | 7 | 2.6 (0.9-7.0) | |
| Domestic use of herbicides | 22 | 1.0(0.6-2.0) | |
| Gambini et al., 1997 | Italian rice growers | 0 | nr |
| Dean, 1994 | Irish farmers and farm workers (men and women) | ||
| Men | 171 | 1.0 (nr) | |
| Semenciw et al., 1994 | Farmers in Canadian prairie provinces | 160 | 0.8(0.7-1.0) |
| Blair et al., 1993 | US farmers in 23 states | 413 | 1.2(1.0-1.3) |
| Boffetta et al., 1989 | ACS Prevention Study II subjects | 12 | 2.1 (1.0-4.2) |
| Farmers using herbicides, pesticides | 8 | 4.3(1.7-10.9) | |
| LaVecchia et al., 1989 | Residents (men and women) of Milan, Italy, area | ||
| Agricultural occupations | nr | 2.0(1.1-3.5) | |
| Cantor and Blair, 1984 | Wisconsin residents—farmers in counties with highest herbicide use | nr | 1.4(0.8-2.3) |
| Burmeister et al., 1983 | Iowa residents—farming exposures | ||
| Born 1890-1900 | nr | 2.7 (p < 0.05) | |
| Born after 1900 | nr | 2.4 (p< 0.05) | |
| Other Herbicide and Pesticide Applicators | Herbicides | ||
| Swaen et al., 2004 | Dutch licensed herbicide applicators (included in IARC cohort, NIOSH Dioxin Registry) |
3 | 2.1 (0.4-6.1) |
| Asp et al., 1994 | Finnish herbicide applicators | ||
| Incidence | 2 | 1.5(0.2-5.2) | |
| Mortality | 3 | 2.6 (0.5-7.7) | |
| Torchio et al., 1994 | Italian licensed pesticide users | 5 | 0.4(0.1-1.0) |
| Reference | Study Populationa | Exposed Casesb |
Exposure of Interest/ Estimated Risk (95% CI)b |
| Swaen et al., 1992 | Dutch herbicide applicators | 3 | 8.2(1.6-23.8) |
| Pearce et al., 1986 | New Zealand residents—agricultural sprayers | ||
| Use of agricultural spray | 16 | 1.3(0.7-2.5) | |
| Likely sprayed 2,4,5-T | 14 | 1.6(0.8-3.1) | |
| Riihimaki et al., 1982 | Finnish herbicide applicators | 1 | Expected number of exposed cases 0.2 (nr) |
| Forestry Workers | Herbicides | ||
| Thörn et al., 2000 | Swedish lumberjacks exposed to phenoxyacetic herbicides—incidence | 0 | nr |
| Alavanja et al., 1989 | USDA forest, soil conservationists | 6 | 1.3 (0.5-2.8) |
| Reif et al., 1989 | New Zealand forestry workers—nested case—control—incidence | 1 | 0.5(0.1-3.7) |
| Paper and Pulp Workers | Dioxin | ||
| McLean et al., 2006 | IARC cohort of pulp and paper workers | ||
| Exposure to nonvolatile organochlorine compounds | |||
| Never | 21 | 0.8 (0.5-1.3) | |
| Ever | 20 | 1.1 (0.7-1.7) | |
| Residential Studies | |||
| Brown et al., 1993 | Iowa residents who used pesticides or herbicides | 111 | 1.2(0.8-1.7) |
| Zahm et al., 1992 | Eastern Nebraska users of herbicides | ||
| Men | 8 | 0.6(0.2-1.7) | |
| Women | 10 | 2.3 (0.8-7.0) | |
| Eastern Nebraska users of insecticides | |||
| Men | 11 | 0.6(0.2-1.4) | |
| Women | 21 | 2.8(1.1-7.3) | |
| Eriksson and Karlsson, 1992 | Residents of northern Sweden | 20 | 90% CI2.2(1.2-4.7) |
| Morris et al., 1986 | Residents of four SEER program areas | 2.9(1.5-5.5) | |
| ENVIRONMENTAL | |||
| Seveso, Italy Residential Cohort | TCDD | ||
| Consonni et al., 2008 | Seveso residents—25-yr follow-up—men, women | ||
| Zone A | 2 | 4.3(1.1-17.5) | |
| Zone B | 5 | 1.7(0.7-4.1) | |
| Zone R | 24 | 1.1 (0.7-1.7) | |
| Reference | Study Populationa | Exposed Casesb |
Exposure of Interest/ Estimated Risk (95% CI)b |
| Pesatori et al., 2009 | Seveso—20-yr follow-up to 1996—incidence | ||
| Zone A | 1 | 2.9 (0.4-20.7) | |
| Zone B | 6 | 2.8(1.2-6.3) | |
| Zone R | 18 | 1.2(0.7-1.9) | |
| Bertazzi et al., 2001 | Seveso residents—20-yr follow-up | ||
| Zone A, B—men | 1 | 0.6(0.1-4.3) | |
| women | 4 | 3.2(1.2-8.8) | |
| Bertazzi et al., 1997 | Seveso residents—15-yr follow-up | ||
| Zone B—men | 1 | 1.1 (0.0-6.2) | |
| women | 4 | 6.6(1.8-16.8) | |
| Zone R—men | 5 | 0.8(0.3-1.9) | |
| women | 5 | 1.0(0.3-2.3) | |
| Bertazzi et al., 1993 | Seveso residents—10-yr follow-up—incidence | ||
| Zone B—men | 2 | 3.2(0.8-13.3) | |
| women | 2 | 5.3(1.2-22.6) | |
| Zone R—men | 1 | 0.2(0.0-1.6) | |
| women | 2 | 0.6 (0.2-2.8) | |
| Pesatori et al., 1992 | Seveso residents—incidence | ||
| Zones A, B—men | 2 | 2.7(0.6-11.3) | |
| women | 2 | 4.4(1.0-18.7) | |
| Zone R—men | 1 | 0.2(0.0-1.5) | |
| women | 3 | 0.9(0.3-3.1) | |
| Other Environmental Studies | |||
| Miligi et al., 2006 | Italian case–control study—herbicide exposure among men, women with diagnosis of multiple myeloma |
11 | Herbicides 1.6(0.8-3.5) |
| Pahwa et al., 2006 | Canadian men (at least 19 yrs of age) in any of 6 provinces | Phenovy herbicides | |
| Any phenoxy herbicide | 62 | 1.2(0.8-1.8) | |
| 2,4-D | 59 | 1.3(0.9-1.9) | |
| Mecoprop | 16 | 1.2(0.7-2.8) | |
| MCPA | 7 | 0.5(0.2-1.2) | |
ABBREVIATIONS: 2,4-D, 2,4-dichlorophenoxyacetic acid; 2,4,5-T, 2,4,5-trichlorophenoxyacetic acid; ACS, American Cancer Society; AHS, Agricultural Health Study; CDC, Centers of Disease Control and Prevention; CI, confidence interval; COI, chemical of interest; IARC, International Agency for Research on Cancer; MCPA, 2-methyl-4-chlorophenoxyacetic acid; MGUS, monoclonal gammopathy of undetermined significance; MI, Michigan; NIOSH, National Institute for Occupational Safety and Health; nr, not reported; NZ, New Zealand; PCDD, polychlorinated dibenzo-p-dioxin (highly chlorinated, if four or more chlorines); SEA, Southeast Asia; SEER, Surveillance, Epidemiology, and End Results; TCDD, 2,3,7,8-tetrachlorodibenzo-p-dioxin; USDA, US Department of Agriculture; VA, US Department of Veterans Affairs; VES, Vietnam Experience Study.
aSubjects are male, and outcome is mortality unless otherwise noted.
bGiven when available; results other than estimated risk explained individually.
Environmental Studies Pesatori et al. (2009) reported cancer incidence through 1996 in combined males and females exposed to TCDD in the 1976 accident in Seveso in three exposure Zones. The magnitude of multiple-myeloma risk increased with degree of exposure; the increases identified in Zone A (RR = 2.88, 95% CI 0.40–20.70) and Zone R (RR = 1.15, 95% CI 0.70–1.91) were not significant, but a statistically significant increase was observed in Zone B (RR = 2.77, 95% CI 1.2–6.32).
McDuffie et al. (2009) conducted additional analyses in the Canadian case– control study of multiple myeloma reported on earlier by McDuffie et al. (2001) and Pahwa et al. (2006). The investigation concerning the interaction of family history with pesticide exposure did not present new information with sufficient specificity for the chemicals of interest in the VAO series.
The grouped results for mortality from cancer of “lymphoid, haematopoietic and related tissue” among Finnish fishermen (33 cases) and their wives (10 cases) in the study by Turunen et al. (2008) are too nonspecific to be of use in evaluating an association between the chemicals of interest and particular types of lymphohematopoietic malignancy.
Biologic Plausibility
No animal studies have reported an association between exposure to the chemicals of interest and multiple myeloma. Thus, there are no specific animal data to support the biologic plausibility of an association between exposure to the chemicals of interest and multiple myeloma.
Recent evidence has shown that AHR activation by TCDD in human breast and endocervical cell lines induces sustained high concentrations of the IL-6 cytokine, which has tumor-promoting effects in numerous tissues (Hollingshead et al., 2008). IL-6 plays a roll in B-cell maturation and induces a transcriptional inflammatory response. It is known to be increased in B-cell neoplasms, including multiple myeloma and various lymphomas (Hussein et al., 2002; Kovacs, 2006).
In comparing the frequency of specific variants of several metabolic genes between multiple-myeloma cases and controls, Gold et al. (2009) found some indication of differences, particularly for CYP1B1 and AHR alleles, that might reflect increased suspectibility to myeloma after exposure to particular chemicals. A biochemical link to the chemicals of interest, however, is far from being established.
The biologic plausibility of the carcinogenicity of the chemicals of interest is discussed in general at the beginning of this chapter.
Synthesis
The three studies providing new information on an association between exposure to the components of the herbicides used in Vietnam and multiple my-
eloma had findings consistent with the conclusion of the first and all later VAO committees that there is evidence suggesting an association. The study of New Zealand production workers (McBride et al., 2009a) showed an increase in estimated risk with very wide confidence limits due to the fairly small sample. The incidence of multiple myeloma in the 20-year update of the Seveso population (Pesatori et al., 2009) was increased in all three exposure zones and achieved significance in the intermediate zone (Zone B). A well-conducted case–control study (Orsi et al., 2009) found an association between occupational exposure to herbicides in general and phenoxy herbicides in particular, but not domestic use of herbicides, and multiple myeloma. The nested case–control study of the precursor condition MGUS in the AHS male applicators (Landgren et al., 2009) also was consistent with the existing assigned category for multiple myeloma.
Conclusion
On the basis of the evidence reviewed here and in previous VAO reports, the committee concludes that there is limited or suggestive evidence of an association between exposure to at least one of the chemicals of interest and multiple myeloma.
The committee responsible for Update 2006 moved the discussion of AL amyloidosis from the chapter on miscellaneous nonneoplastic health conditions to the cancer chapter to put it closer to related neoplastic conditions, such as multiple myeloma and some types of B-cell lymphoma. The conditions share several biologic features, most notably clonal hyperproliferation of B-cell–derived plasma cells and production of abnormal amounts of immunoglobulins.
The primary feature of amyloidosis (ICD-9 277.3) is the accumulation and deposition in various tissues of insoluble proteins that were historically denoted by the generic term amyloid. Amyloid protein accumulates in the extracellular spaces of various tissues. The pattern of organ involvement depends on the nature of the protein; some amyloid proteins are more fibrillogenic than others. Amyloidosis is classified according to the biochemical properties of the fibril-forming protein. Excessive amyloid protein can have modest clinical consequences or can produce severe, rapidly progressive multiple–organ-system dysfunction. The annual incidence is estimated at 1/100,000; there are about 2,000 new cases each year in the United States. Amyloidosis occurs mainly in people 50–70 years old and occurs more often in males than in females.
AL amyloidosis is the most common form of systemic amyloidosis; the A stands for amyloid, and the L indicates that the amyloid protein is derived from immunoglobin light chains. That links AL amyloidosis with other B-cell disorders that involve overproduction of immunoglobin, such as multiple myeloma
and some types of B-cell lymphomas. AL amyloidosis results from the abnormal overproduction of immunoglobulin light-chain protein from a monoclonal population of plasma cells. Clinical findings can include excessive AL protein or immunoglobulin fragments in the urine or serum, renal failure with nephrotic syndrome, liver failure with hepatomegaly, heart failure with cardiomegaly, marcroglossia, carpal tunnel syndrome, and peripheral neuropathy. Bone marrow biopsies commonly show an increased density of plasma cells, which suggests a premalignant state. Historically, that test emphasized routine histochemical analysis, but modern immunocytochemistry and flow cytometry now commonly identify monoclonal populations of plasma cells with molecular techniques. AL amyloidosis can progress rapidly and is often far advanced by the time it is diagnosed (Buxbaum, 2004).
Conclusions from VAO and Previous Updates
VA identified AL amyloidoisis as of concern after the publication of Update 1998. The committees responsible for Update 2000, Update 2002, and Update 2004 concluded that there was inadequate or insufficient evidence to determine whether there is an association between exposure to the chemicals of interest and AL amyloidosis. Although there are few epidemiologic data specifically on AL amyloidosis, the committee responsible for Update 2006 changed the categorization to limited or suggestive evidence of an association on the basis of commonalities in its cellular lineage with multiple myeloma and B-cell lymphomas. The committee responsible for Update 2008 did not change that categorization.
Update of the Epidemiologic Literature
No studies concerning exposure to the chemicals of interest and amyloidosis of any sort have been published since Update 2008.
Biologic Plausibility
A 1979 study reported the dose-dependent development of a “generalized lethal amyloidosis” in Swiss mice that were treated with TCDD for 1 year (Toth et al., 1979). That finding has not been validated in 2-year carcinogenicity studies of TCDD in mice or rats. Thus, few animal data support an association between TCDD exposure and AL amyloidosis in humans, and no animal data support an association between the other chemicals of interest and AL amyloidosis.
It is known, however, that AL amyloidosis is associated with B-cell diseases, and 15–20% of cases of AL amyloidosis occur with multiple myeloma. Other diagnoses associated with AL amyloidosis include B-cell lymphoma (Cohen et al., 2004), monoclonal gammopathy, and agammaglobulinemia (Rajkumar et al., 2006).
Synthesis
AL amyloidosis is very rare, and it is not likely that population-based epidemiology will ever provide substantial direct evidence regarding its causation. However, the biologic and pathophysiologic features linking AL amyloidosis, multiple myeloma, and some types of B-cell lymphoma—especially clonal hyperproliferation of plasma cells and abnormal immunoglobulin production—indicate that AL amyloidosis is pathophysiologically related to these conditions.
Conclusion
On the basis of the evidence reviewed here and in previous VAO reports, the committee concludes that there is limited or suggestive evidence of an association between exposure to the chemicals of interest and AL amyloidosis.
Leukemias (ICD-9 202.4, 203.1, 204–204.9, 205–205.9, 206–206.9, 207– 207.2, 207.8, 208–208.9) have traditionally been divided into four primary types: acute and chronic lymphocytic leukemia and acute and chronic myeloid leukemia. There are numerous subtypes of AML (ICD-9 205), which is also called acute myelogenous leukemia, granulocytic leukemia, or acute nonlymphocytic leukemia.
ACS estimated that 24,690 men and 18,360 women would receive diagnoses of some form of leukemia in the United States in 2010 and that 12,660 men and 9,180 women would die from it (Jemal et al., 2010). Collectively, leukemia was expected to account for 3.1% of all new diagnoses of cancer and 3.8% of deaths from cancer in 2010. The different forms of leukemia have different patterns of incidence and in some cases different risk factors. The incidences of the various forms of leukemia are presented in Table 7-46.
Myeloid Leukemias
In adults, acute leukemia is nearly always in the form of AML (ICD-9 205, 207, 207.2). ACS estimated that about 6,590 men and 5,740 women would receive new diagnoses of AML in the United States in 2010 and that 5,280 men and 3,670 women would die from it (Jemal et al., 2010). In the age groups that include most Vietnam veterans, AML makes up roughly one-fourth of cases of leukemia in men and one-third in women. Overall, AML is slightly more common in men than in women. Risk factors associated with AML include high doses of ionizing radiation, occupational exposure to benzene, and exposure to some medications used in cancer chemotherapy (such as melphalan). Fanconi anemia and Down syndrome are associated with an increased risk of AML, and tobacco use is thought to account for about 20% of AML cases.
TABLE 7-46 Average Annual Incidence (per 100,000) of Leukemias in United Statesa
| 55—59 Years Old | 60—64 Years Old | 65—69 Years Old | |||||||
| All Races | White | Black | All Races | White | Black | All Races | White | Black | |
| All leukemias: | |||||||||
| Men | 20.5 | 21.4 | 17.0 | 31.3 | 33.0 | 31.0 | 48.3 | 51.8 | 30.8 |
| Women | 12.8 | 13.4 | 10.2 | 18.4 | 19.5 | 15.5 | 27.1 | 29.0 | 22.6 |
| Acute lymphocytic leukemia: | |||||||||
| Men | 0.9 | 1.0 | 0.3 | 1.1 | 1.2 | 0.4 | 1.5 | 1.5 | 1.2 |
| Women | 0.8 | 0.9 | 0.6 | 1.0 | 1.0 | 0.6 | 1.2 | 1.1 | 1.3 |
| Acute myeloid leukemia: | |||||||||
| Men | 4.9 | 4.9 | 5.0 | 6.9 | 7.0 | 7.2 | 10.1 | 10.5 | 6.4 |
| Women | 4.3 | 4.4 | 3.6 | 4.6 | 4.8 | 4.4 | 7.9 | 8.2 | 6.2 |
| Chronic lymphocytic leukemia: | |||||||||
| Men | 9.8 | 10.4 | 6.8 | 16.8 | 17.4 | 14.7 | 26.1 | 28.8 | 14.5 |
| Women | 5.1 | 5.6 | 2.8 | 9.2 | 10.3 | 5.4 | 12.5 | 13.8 | 8.4 |
| Chronic myeloid leukemia: | |||||||||
| Men | 2.5 | 2.4 | 3.1 | 3.3 | 3.4 | 4.4 | 5.7 | 6.0 | 4.1 |
| Women | 1.5 | 1.5 | 1.1 | 1.8 | 1.8 | 3.2 | 2.8 | 3.1 | 1.8 |
| All other leukemia:b | |||||||||
| Men | 0.6 | 0.6 | 0.8 | 1.2 | 1.1 | 2.0 | 2.0 | 2.0 | 2.3 |
| Women | 0.4 | 0.4 | 0.6 | 0.8 | 0.6 | 1.6 | 1.4 | 1.2 | 3.6 |
aSurveillance, Epidemiology, and End Results program, nine standard registries, crude age-specific rates, 2004—2008 (NCI, 2010).
bIncludes leukemic reticuloendotheliosis (hairy cell leukemia), plasma-cell leukemia, monocytic leukemia, and acute and chronic erythremia and erythroleukemia.
Vietnam veterans have expressed concern about whether myelodysplastic syndromes, most often precursors to AML, are associated with Agent Orange exposure. However, no results on those conditions in conjunction with the chemicals of interest have been found by VAO literature searches. Epidemiologic research on those hematologic disorders has been undertaken fairly recently; for instance, the LATIN Case–Control Study (Maluf et al., 2009) has undertaken investigation of aplastic anemia in South America, but the reported exposures have been only as specific as “herbicides” and “agricultural pesticides.”
The incidence of CML increases steadily with age in people over 30 years old. Its lifetime incidence is roughly equal in whites and blacks and is slightly higher in men than in women. CML accounts for about one-fifth of cases of leukemia in people in the age groups that include most Vietnam veterans. It is associated with an acquired chromosomal abnormality known as the Philadelphia chromosome, for which exposure to high doses of ionizing radiation is a known risk factor.
Lymphoid Leukemias
ALL is a disease of young children (peak incidence at 2–5 years old) and of people over 70 years old. It is relatively uncommon in the age groups that include most Vietnam veterans. The lifetime incidence of ALL is slightly higher in whites than in blacks and higher in men than in women. Exposure to high doses of ionizing radiation is a known risk factor for ALL, but there is little consistent evidence on other factors.
CLL shares many traits with lymphomas (such as immunohistochemistry, B-cell origin, and progression to an acute, aggressive form of NHL), so the committee now considers it in the section above on NHL, as classified in the WHO system.
Conclusions from VAO and Previous Updates
The committee responsible for VAO concluded that there was inadequate or insufficient information to determine whether there is an association between exposure to the chemicals of interest and all types of leukemia. Additional information available to the committees responsible for Update 1996, Update 1998, Update 2000, Update 2002, Update 2004, Update 2006, and Update 2008 did not change that conclusion. The committee responsible for Update 2002, however, considered CLL separately and judged that there was sufficient evidence of an association with the herbicides used in Vietnam and CLL alone, and Update 2008 noted that HCL is closely related to CLL. The committee responsible for Update 2006 and Update 2008 considered AML individually but did not find evidence to suggest that its occurrence is associated with exposure to the chemicals of interest, so it was retained with other non-CLL leukemias in the category of inadequate and insufficient evidence. Table 7-47 summarizes the results of the relevant studies.
Update of the Epidemiologic Literature
Vietnam-Veteran Studies Cypel and Kang (2010) examined the risk of disease-related mortality in the ACC veterans (2,872) who handled or sprayed herbicides in Vietnam and in nondeployed Vietnam-era ACC veterans (2,737). Vital status was determined through December 31, 2005. As would be consistent with a healthy-warrior effect, deployed veterans had a lower rate of leukemia than males in the US population (SMR = 0.42, 95% CI 0.05–1.51) and significantly lower mortality from all LHCs (SMR = 0.46, 95% CI 0.17–0.99). Comparing Vietnam veterans with nondeployed Vietnam veterans and adjusting for race, rank, duration of military service, and age at entry into follow-up, the study found that mortality was not significantly increased for all LHCs (ARR = 1.10, 95% CI 0.35–3.48) or more specifically for leukemia (adjusted RR = 0.56, 95% CI 0.10–3.20).
TABLE 7-47 Selected Epidemiologic Studies—Leukemia
| Reference | Study Populationa | Exposed Casesb |
Exposure of Interest/ Estimated Risk (95% CI)b |
| VIETNAM VETERANS | |||
| US Air Force Health Study—Ranch Hand veterans vs SEA veterans | All COIs | ||
| White Air Force Ranch Hand veterans—lymphopoietic cancersc | |||
| All Ranch Hand veterans | |||
| Incidence | 10 | 0.9 (0.4–1.5) | |
| Mortality | 6 | 1.0 (0.4–2.0) | |
| Veterans with tours in 1966–1970—incidence | 7 | 0.7 (0.3–1.4) | |
| White Air Force Comparison veterans—lymphopoietic cancersc | |||
| All comparison veterans | |||
| Incidence | 9 | 0.6 (0.3–1.0) | |
| Mortality | 5 | 0.6 (0.2–1.2) | |
| Veterans with tours in 1966–1970—incidence | 4 | 0.3 (0.1–0.8) | |
| Air Force Ranch Hand veterans | 2 | 0.7 (0.1–5.0) | |
| US VA Cohort of Army Chemical Corps | All COIs | ||
| ACC—deployed vs nondeployed and vs US men (Vietnam-service status through 2005) | |||
| All Lymphopoietic | |||
| Deployed vs nondeployed | 6 vs 6 | 1.1 (0.4–2.5) | |
| ACC veterans vs US men | |||
| Vietnam cohort | 6 | 0.5 (0.2–0.99) | |
| Non-Vietnam cohort | 6 | 0.6 (0.2–1.4) | |
| Leukemia | |||
| Deployed vs nondeployed | 2 vs 4 | 0.6 (0.1–3.2) | |
| ACC veterans vs US men | |||
| Vietnam cohort | 2 | 0.4 (0.1–1.5) | |
| Non-Vietnam cohort | 4 | 1.2 (0.3–3.0) | |
| ACC veterans | 1.0 (0.1–3.8) | ||
| US CDC Vietnam Experience Study | All COIs | ||
| Vietnam Experience Cohort | 8 | 1.0 (0.4–2.5) | |
| US VA Cohort of Female Vietnam Veterans | All COIs | ||
| US Vietnam veterans (women)—lymphopoietic cancers |
18 | 0.7 (0.4–1.3) | |
| Deployed vs nondeployed | |||
| Nurses only | 14 | 0.7 (0.3–1.3) | |
| State Studies of US Vietnam Veterans | |||
| PM study of deaths (1974–1989) of Michigan Vietnam-era veterans—deployed vs nondeployed | 30 | 1.0 (0.7–1.5) | |
| Reference | Study Populationa | Exposed Casesb |
Exposure of Interest/ Estimated Risk (95% CI)b |
| Australian Vietnam Veterans vs Australian Population | All COIs | ||
| ADVA, | Australian Vietnam veterans vs Australian | ||
| 2005a | population—incidence | ||
| All branches | 130 | 1.1 (1.0-1.4) | |
| Lymphocytic leukemia | 72 | 1.4(1.1-1.7) | |
| Myeloid leukemia | 54 | 1.0(0.8-1.3) | |
| Navy | 35 | 1.5(1.0-2.0) | |
| Lymphocytic leukemia | 14 | 1.3(0.7-2.1) | |
| Myeloid leukemia | 19 | 1.7(1.0-2.6) | |
| Army | 80 | 1.1(0.8-1.3) | |
| Lymphocytic leukemia | 50 | 1.4(1.0-1.8) | |
| Myeloid leukemia | 28 | 0.8(0.5-1.1) | |
| Air Force | 15 | 1.2(0.7-2.0) | |
| Lymphocytic leukemia | 8 | 1.4(0.6-2.7) | |
| Myeloid leukemia | 7 | 1.3(0.5-2.6) | |
| ADVA, | Australian Vietnam veterans vs Australian | ||
| 2005b | population—mortality | ||
| All branches | 84 | 1.0(0.8-1.3) | |
| Lymphocytic leukemia | 24 | 1.2(0.7-1.7) | |
| Myeloid leukemia | 55 | 1.1(0.8-1.3) | |
| Navy | 17 | 1.3(0.8-1.8) | |
| Lymphocytic leukemia | 4 | 0.2(0.0-1.2) | |
| Myeloid leukemia | 11 | 1.6(0.9-2.5) | |
| Army | 48 | 0.1 (0.7-1.2) | |
| Lymphocytic leukemia | 17 | 1.3(0.7-2.0) | |
| Myeloid leukemia | 30 | 0.8(0.5-1.1) | |
| Air Force | 14 | 1.6(0.8-2.6) | |
| Lymphocytic leukemia | 6 | 2.7(1.0-5.8) | |
| Myeloid leukemia | 8 | 1.3(0.5-2.5) | |
| AIIIW, 1999 | Australian Vietnam veterans—incidence (validation study) |
Expected number of exposed cases (95% CI) | |
| 27 | 26(16-36) | ||
| CDVA. | Australian Vietnam veterans (men)—self- | 64 | 26(16-36) |
| 1998a | reported incidence | ||
| CDVA. | Australian Vietnam veterans (women)—self- | 1 | 0(0-4) |
| 1998b | reported incidence | ||
| CDVA. | Australian military Vietnam veterans | 33 | 1.3(0.8-1.7) |
| 1997a | |||
| Reference | Study Populationa | Exposed Casesb |
Exposure of Interest/ Estimated Risk (95% CI)b |
|||
| Australian Conscripted Army National Service (deployed vs nondeployed) |
All COIs | |||||
| ADVA, | Australian male conscripted Army National | |||||
| 2005c | Service Vietnam-era veterans: deployed vs nondeployed | |||||
| Incidence | 16 | 0.6(0.3-1.1) | ||||
| Lymphocytic leukemia | 9 | 0.8 (0.3-2.0) | ||||
| Myeloid leukemia | 7 | 0.5(0.2-1.3) | ||||
| Mortality | 11 | 0.6(0.3-1.3) | ||||
| Lymphocytic leukemia | 2 | 0.4 (0.0-2.4) | ||||
| Myeloid leukemia | 8 | 0.7(0.3-1.7) | ||||
| OCCUPATIONAL | ||||||
| IARC Phenoxy Herbicide Cohort (mortality vs national morlaliy rates) |
Dioxin, phenoxy herbicides |
|||||
| Kogevinas | IARC cohort, male and female workers exposed | 34 | 1.0(0.7-1.4) | |||
| etal., 1997 | to any phenoxy herbicide or chlorophenol | |||||
| Exposed to highly chlorinated PCDDs | 16 | 0.7(0.4-1.2) | ||||
| Not exposed to highly chlorinated PCDDs | 17 | 1.4(0.8-2.3) | ||||
| Kogevinas | IARC cohort (women only, myeloid leukemia) | 1 | 2.0(0.2-7.1) | |||
| etal., 1993 | ||||||
| Saracci | IARC cohort—exposed subcohort (men and | 18 | 1.2(0.7-1.9) | |||
| etal.. 1991 | women) | |||||
| MOSH Mortality Cohort (12 US plants, production 1942-1984) (included in IARC cohort) |
Dioxin. phenoxy herbicides |
|||||
| Steenland | US chemical production workers | 10 | 0.8(0.4-1.5) | |||
| etal.. 1999 | ||||||
| Fingerhut | NIOSH—entire cohort | 6 | 0.7(0.2-1.5) | |||
| etal.. 1991 | ||||||
| BASF Production Workers (included in IARC cohort) | Dioxin, phenoxy herbicides | |||||
| Zober | BASF employees at plant with 1953 explosion | |||||
| etal., 1990 | 90% CI | |||||
| All 3 cohorts (n = 247) | 1 | 1.7 (nr) | ||||
| Cohort 3 | 1 | 5.2(0.4-63.1) | ||||
| Incident case of AML in Cohort 1 | ||||||
| Dow Chemical Company—Midland. MI (included in IARC and NIOSH cohorts) |
Dioxin, phenoxy herbicides | |||||
| Collins | Trichlorophenol workers—leukemia, aleukemia | 13 | 1.9(1.0-3.2) | |||
| et al.. | Excluding subset with pentachlorophenol | 2 | 1.9(1.0-3.4) | |||
| 2009a | exposure | |||||
| Trichlorophenol workers—other lymphopoietic | 2 | 0.6(0.1-2.3) | ||||
| Excluding subset with pentachlorophenol exposure | 2 | 0.7(0.1-2.6) | ||||
| Reference | Study Populationa | Exposed Casesb |
Exposure of Interest/ Estimated Risk (95% CI)b |
| Collins | Pentachlorophenol workers—leukemia. | 2 | 0.6(0.1-2.0) |
| et al.. | aleukemia | ||
| 2009b | Excluding subset with TCP exposure | 1 | 0.4 (0.0-2.0) |
| Pentachlorophenol workers—other lymphopoietic | 2 | 1.3(0.2-4.6) | |
| Excluding subset with TCP exposure | 2 | 1.7(0.2-6.0) | |
| Burns | Dow 2.4-D production workers | ||
| el al., 2001 | Lymphopoietic mortality in workers with high | ||
| 2,4-D exposure | 4 | 1.3(0.4-3.3) | |
| Ram low | Dow pentachlorophenol production workers | ||
| et al., 1996 | 0-yr latency | 2 | 1.0(0.1-3.6) |
| 15-yr latency | 1 | nr | |
| Bond el al., | Dow 2.4-D production workers | 2 | 3.6(0.4-13.2) |
| 1988 | |||
| New Zealand Production Workers—Dow plant in Plymouth, NZ (included in IARC cohort) |
Dioxin, phenoxy herbicides | ||
| Mc Bride | 1,599 production workers (male and female) vs | ||
| et al., | national rates—mortality 1969 through 2004 | ||
| 2009a | Leukemia, aleukemia | ||
| Ever-exposed workers | 1 | 0.6(0.0-3.1) | |
| Never-exposed workers | 0 | 0.0 (0.0-6.0) | |
| ̓t Mannetje | Phenoxy herbicide producers (men and women) | 0 | 0.0 (0.0-5.3) |
| et al., 2005 | Phenoxy herbicide sprayers (> 99% men) (myeloid leukemia) | 1 | 1.2(0.0-6.4) |
| Dutch Production Workers (included in I ARC cohort) | Dioxin, phenoxy herbicides | ||
| Boers | Dutch chlorophenoxy workers | ||
| etal., 2010 | LHC | ||
| Factory A (HR for exposed vs unexposed) | 11 vs 7 | 0.9 (0.3-2.6) | |
| Factory B (HR for exposed vs unexposed) | 3 vs 3 | 1.5(0.3-7.5) | |
| Leukemia | |||
| Factory A (HR for exposed vs unexposed) | 2 vs 3 | 0.3 (0.0-2.6) | |
| Factory B (HR for exposed vs unexposed) | 2 vs 2 | 1.5(0.2-10.8) | |
| Hooiveld | Dutch chemical production workers | 1 | 1.0(0.0-5.7) |
| et al., 1998 | |||
| German Production Workers (included in IARC cohort) | Dioxin, phenoxy herbicides | ||
| Becher | German chemical production workers—Cohort 1 | 4 | 1.8(0.5-4.7) |
| et al., 1996 | |||
| Agricultural Health Study | Herbicides | ||
| Alavanja | US AHS—incidence | ||
| et al., 2005 | Private applicators (men and women) | 70 | 0.9(0.7-1.2) |
| Spouses of private applicators (> 99% women) | 17 | 0.7(0.4-1.2) | |
| Commercial applicators (men and women) | 4 | 0.9 (0.3-2.4) | |
| Blair et al., | US AHS | ||
| 2005a | Private applicators (men and women) | 27 | 0.8(0.5-1.1) |
| Spouses of private applicators (> 99% women) | 14 | 1.4(0.8-2.4) | |
| Reference | Study Populationa | Exposed Casesb |
Exposure of Interest/ Estimated Risk (95% CI)b |
| United Farm Workers | Herbicides | ||
| Mills et al., | Cohort study of 139,000 United Farm Workers. | ||
| 2005 | with nested case-control analyses restricted to Hispanic workers in California Ever used 2,4-D | ||
| Total leukemia | nr | 1.0(0.4-2.6) | |
| Lymphocytic leukemia | nr | 1.5(0.3-6.6) | |
| Granulocytic (myeloid) leukemia | nr | 1.3(0.3-5.4) | |
| Other Agricultural Workers | Herbicides | ||
| Hansen | Danish gardeners (all hematopoietic, ICD-7 | ||
| et al., 2007 | 200-205—incidence) | ||
| 10-yr follow-up (1975-1984) repotted in | 15 | 1.4(0.8-2.4) | |
| Hansen etal. (1992) | |||
| NHL (ICD-7 200, 202, 205) | 6 | 1.7(0.6-3.8) | |
| HD (ICD-7 201) | 0 | nr | |
| Multiple myeloma (ICD-7 203) | 0 | nr | |
| CLL (ICD-7 204.0) | 6 | 2.8(1.0-6.0) | |
| Other leukemias (204.1-204.4) | 3 | 1.4(0.3-4.2) | |
| 25-yr follow-up (1975-2001) | 42 | 1.1(0.8-1.4) | |
| Leukemia (ICD-7 204) | 22 | 1.4(0.9-2.1) | |
| Born before 1915 (high exposure) | 16 | 1.4(0.9-2.3) | |
| Leukemia (ICD-7 204) | 12 | 2.3 (1.3-4.1) | |
| Born 1915-1934 (medium exposure) | 25 | 1.2(0.8-1.8) | |
| Leukemia (ICD-7 204) | 9 | 1.0(0.5-2.0) | |
| Bom after 1934 (low exposure) | 1 | 0.2(0.0-1.0) | |
| Leukemia (ICD-7 204) | 1 | 0.5 (0.0-3.4) | |
| Gambini | Italian rice growers | 4 | 0.6(0.2-1.6) |
| et al., 1997 | |||
| Amadori | Italian farming, animal-breeding workers—CLL | 15 | 2.3 (0.9-5.8) |
| et al., 1995 | Farmers | 5 | 1.6(0.5-5.2) |
| Breeders | 10 | 3.1(1.1-8.3) | |
| Semenciw | Farmers in Canadian prairie provinces | 357 | 0.9(0.8-1.0) |
| et al., 1994 | Lymphatic | 132 | 0.9(0.8-1.1) |
| Myeloid | 127 | 0.8 (0.7-0.9) | |
| Blair et al.. | US farmers in 23 states | ||
| 1993 | White men | 1,072 | 1.3(1.2-1.4) |
| White women | 24 | 1.5(0.9-2.2) | |
| Hansen | Danish gardeners—incidence | ||
| et al., 1992 | All gardeners—CLL | 6 | 2.5 (0.9-5.5) |
| all other types of leukemia | 3 | 1.2(0.3-3.6) | |
| Men—CLL | 6 | 2.8(1.0-6.0) | |
| all other types of leukemia | 3 | 1.4(0.3-4.2) | |
| Reference | Study Populationa | Exposed Casesb |
Exposure of Interest/ Estimated Risk (95% CI)b |
| Ronco | Danish workers—incidence | ||
| eial., 1992 | Men—self-employed | 145 | 0.9 (nr) |
| employee | 33 | 1.0 (nr) | |
| Women—self-employed | 8 | 2.2 (p < 0.05) | |
| employee | 3 | 1.3 (nr) | |
| family worker | 27 | 0.9 (nr) | |
| Brown | Case-control study on white men in Iowa, | 578 | |
| etal., 1990 | Minnesota, all types of leukemia—incidence | ||
| Ever farmed | 335 | 1.2(1.0-1.5) | |
| AML | 81 | 1.2(0.8-1.8) | |
| CML | 27 | 1.1(0.6-2.0) | |
| CLL | 156 | 1.4(1.1-1.9) | |
| ALL | 7 | 0.9 (0.3-2.5) | |
| Myelodysplasias | 32 | 0.8(0.5-1.4) | |
| Any herbicide use | 157 | 1.2(0.9-1.6) | |
| AML | 39 | 1.3(0.8-2.0) | |
| CML | 16 | 1.3(0.7-2.6) | |
| CLL | 74 | 1.4(1.0-2.0) | |
| ALL | 2 | 0.5(0.1-2.2) | |
| Myelodysplasias | 10 | 0.7(0.3-1.5) | |
| Phenoxy acid use | 120 | 1.2(0.9-1.6) | |
| 2,4-D use | 98 | 1.2(0.9-1.6) | |
| 2,4,5-T use | 22 | 1.3(0.7-2.2) | |
| First use > 20 years before | 1! | 1.8(0.8-4.0) | |
| MCPA | 1! | 1.9(0.8-4.3) | |
| First use > 20 years before | 5 | 2.4 (0.7-8.2) | |
| Wigle | Canadian farmers | 138 | 0.9(0.7-1.0) |
| et al., 1990 | |||
| Alavanja | USDA agricultural extension agents | 23 | 1.9(1.0-3.5) |
| et al., 1988 | Lymphatic | nr | 2.1 (0.7-6.4) |
| Trend over years worked | (p<0.01) | ||
| Myeloid | nr | 2.8(1.1-7.2) | |
| Trend over years worked | (p<0.01) | ||
| Blair and | 1,084 leukemia deaths in Nebraska in 1957-1974 | ||
| White, | Farmer-usual occupation on death certificate | 1.3 (p< 0.05) | |
| 1985 | 99 ALL cases | nr | 1.3 (nr) |
| 248 CLL cases | nr | 1.7 (p< 0.05) | |
| 105 unspecified lymphatic cases | nr | 0.9 (nr) | |
| 235 AML cases | nr | 1.2 (nr) | |
| 96 CML cases | nr | 1.1 (nr) | |
| 39 unspecified myeloid cases | nr | 1.0 (nr) | |
| 39 acute monocytic cases | nr | 1.9 (nr) | |
| 52 acute unspecified leukemia cases | nr | 2.4 (nr) | |
| 65 unspecified leukemia cases | rn | 1.2 (nr) | |
| Reference | Study Populationa | Exposed Casesb |
Exposure of Interest/ Estimated Risk (95% CI)b |
| Burmeister | 1,675 leukemia deaths in Iowa 1968-1978 | ||
| et al., 1982 | Farmer-usual occupation on death certificate | 1.2 (p< 0.05) | |
| ALL | 28 | 0.7(0.4-1.2) | |
| CLL | 132 | 1.7(1.2-2.4) | |
| Lived in one of 33 counties with highest | nr | 1.9(1.2-3.1) | |
| herbicide use | |||
| Unspecified lymphatic | 64 | 1.7(1.0-2.7) | |
| AML | 86 | 1.0(0.8-1.5) | |
| CML | 46 | 1.0(0.7-1.7) | |
| Unspecified myeloid | 36 | 0.8(0.5-1.4) | |
| Acute monocytic | 10 | 1.1 (0.4-2.6) | |
| Unspecified leukemia | 31 | 1.1 (0.6-2.0) | |
| Other Herbicide and Pesticide Applicators | Herbicides | ||
| Swaen | Dutch licensed herbicide applicators—mortality | 3 | 1.3(0.3-3.7) |
| et al., 2004 | |||
| Asp et al., | Finnish herbicide applicators | ||
| 1994 | Mortality | 2 | nr |
| Lymphatic | 1 | 0.9(0.0-5.1) | |
| Myeloid | 1 | 0.7 (0.0-3.7) | |
| Incidence | |||
| Lymphatic | 3 | 1.0(0.2-3.0) | |
| Torchio | Italian licensed pesticide users | 27 | 0.8(0.5-1.1) |
| et al., 1994 | |||
| Bueno de Mesquita | Dutch phenoxy herbicide workers (included in IARC cohort) | ||
| et al., 1993 | Leukemia, aleukemia (ICD-9 204-207) | 2 | 2.2 (0.3-7.9) |
| Myeloid leukemia (ICD-8 205) | 2 | 4.2(0.5-15.1) | |
| Forestry Workers | Herbicides | ||
| Thörn | Swedish lumberjacks exposed to phenoxyacetic | 0 | nr |
| et al., 2000 | herbicides | ||
| Hertz man | British Columbia sawmill workers with | 47 | 1.2(0.9-1.5) |
| et al., 1997 | chlorophenate process (more hexa-. hepta-, octa-chlorinated dibenzodioxins than TCDD). all leukemias—incidence | ||
| ALL | 2 | 1.0(0.2-3.1) | |
| CLL | 24 | 1.7(1.2-2.4) | |
| AML | 5 | 0.8(0.3-1.7) | |
| CML | 7 | 1.1(0.5-2.0) | |
| Other, unspecified | 5 | 0.5(0.2-1.0) | |
| Reifet al., | Case—control study of all men with occupation | ||
| 1989 | indicated entered into New Zealand Cancer Registry 1980-1984 (all leukemias) | ||
| Forestry workers | 4 | 1.0(0.4-2.6) | |
| AML | 3 | 2.2 (nr) | |
| Reference | Study Populationa | Exposed Casesb |
Exposure of Interest/ Estimated Risk (95% CI)b |
| Paper and Pulp Workers | Dioxin | ||
| McLean | IARC cohort of pulp and paper workers | ||
| et al., 2006 | Exposure to nonvolatile organochlorme compounds | ||
| Never | 49 | 1.0(0.7-1.3) | |
| Ever | 35 | 0.9(0.6-1.2) | |
| Rix et al., 1998 | Danish paper-mill workers—incidence | ||
| Men | 20 | 0.8(0.5-1.2) | |
| Women | 7 | 1.3(0.5-2.7) | |
| ENVIRONMENTAL | |||
| Seveso. ltaly Residential Cohort | TCDD | ||
| Consonni et al., 2008 | Seveso residents—25-yr follow-up—men, women | ||
| Leukemia (ICD-9 204-208) | |||
| Zone A | 1 | 0.9(0.1-6.3) | |
| Zone B | 13 | 1.7(1.0-3.0) | |
| Zone R | 51 | 1.0(0.7-1.3) | |
| Lymphatic leukemia (ICD-9 204) | |||
| Zone A | 0 | nr | |
| Zone B | 3 | 1.3(0.4-4.1) | |
| Zone R | 23 | 1.4(0.9-2.2) | |
| Myeloid leukemia (ICD-9 205) | |||
| Zone A | 1 | 2.1 (0.3-15.2) | |
| Zone B | 6 | 2.0 (0.9-4.5) | |
| Zone R | 16 | 0.7(0.4-1.2) | |
| Monoccytic leukemia (ICD-9 206) | 0 | nr | |
| Leukemia, unspecified (ICD-9 208) | |||
| Zone A | 0 | nr | |
| Zone B | 4 | 2.4 (0.9-6.5) | |
| ZoneR | 10 | 0.8(0.4-1.6) | |
| Pesalori | Seveso—20-yr follow-up to 1996—incidence | nr | |
| et al., 2009 | Leukemia (ICD-9 204-208) | ||
| Zone A | 2 | 2.2 (0.5-8.8) | |
| Zone B | 8 | 1.4(0.7-2.7) | |
| Zone R | 31 | 0.8(0.5-2.1) | |
| Lymphatic leukemia (ICD-9 204) | |||
| Zone A | 1 | 2.8(0.4-19.9) | |
| Zone B | 0 | nr | |
| Zone R | 13 | 0.8(0.5-1.5) | |
| Myeloid leukemia (ICD-9 205) | |||
| Zone A | 1 | 2.2 (0.3-16.0) | |
| Zone B | 7 | 2.4(1.1-5.2) | |
| Zone R | 15 | 0.8(0.4-1.3) | |
| Reference | Study Populationa | Exposed Casesb |
Exposure of Interest/ Estimated Risk (95% CI)b |
| Leukemia, unspecified (ICD-9 208) | |||
| Zone A | 0 | nr | |
| Zone B | 1 | 2.2(0.3-16.1) | |
| Zone R | 2 | 0.6(0.1-2.6) | |
| Bertazzi | Seveso residents—20-yr follow-up | ||
| et al., 2001 | Zones A, B—men | 9 | 2.1(1.1-4.1) |
| women | 3 | 1.0(0.3-3.0) | |
| Berlazzi | Seveso residents—15-yr follow-up | ||
| et al., 1998 | Zone B—men | 7 | 3.1 (1.4-6.7) |
| women | 1 | 0.6(0.1-4.0) | |
| Zone R—males | 12 | 0.8(0.4-1.5) | |
| women | 12 | 0.9(0.5-1.6) | |
| Berlazzi | Seveso residents—15-yr follow-up | ||
| et al., 1997 | Zone B—men | 7 | 3.1 (1.3-6.4) |
| women | 1 | 0.6(0.0-3.1) | |
| Zone R—men | 12 | 0.8(0.4-1.4) | |
| women | 12 | 0.0(0.4-1.5) | |
| Berlazzi | Seveso residents—10-yr follow-up—incidence | ||
| et al., 1993 | Zone B—men | 2 | 1.6(0.4-6.5) |
| Myeloid leukemia (ICD-9 205) | 1 | 2.0(0.3-14.6) | |
| women | 2 | 1.8(0.4-7.3) | |
| Myeloid leukemia (ICD-9 205) | 2 | 3.7(0.9-15.7) | |
| Zone R—men | 8 | 0.0(0.4-1.9) | |
| Myeloid leukemia (ICD-9 205) | 5 | 1.4(0.5-3.8) | |
| women | 3 | 0.4(0.1-1.2) | |
| Myeloid leukemia (ICD-9 205) | 2 | 0.5(0.1-2.1) | |
| Berlazzi | Seveso residents—10-yr follow-up | ||
| et al., 1992 | Zones A, B, R—men | 4 | 2.1 (0.7-6.9) |
| women | 1 | 2.5 (0.2-27.0) | |
| Chapaevsk, Russia Residential Cohort | TCDD | ||
| Revich | Residents of Chapaevsk. Russia | ||
| et al., 2001 | Mortality standardized to Samara Region | ||
| Men | 11 | 1.5(0.8-2.7) | |
| Women | 15 | 1.5(0.8-2.4) | |
| Other Knvironmental Studies | Herbicides | ||
| Miligi | Case—control study of residents of 11 areas in | ||
| et al., 2003 | Italy—incidence of leukemia excluding CLL | ||
| Exposure to phenoxy herbicides | 6 | 2.1 (0.7-6.2) | |
| Walerhouse | Residents of Tecumseh, Michigan—incidence | Herbicides | |
| et al., 1996 | All leukemias | ||
| Men | 42 | 1.4(1.0-1.9) | |
| Women | 32 | 1.2(0.9-1.8) | |
| CLL | 10 | 1.4(1.0-1.9) | |
| Reference | Study Populationa | Exposed Casesb |
Exposure of Interest/ Estimated Risk (95% CI)b |
| Svensson | Swedish fishermen | Organochlorin compounds | |
| et al., 1995 | All leukemias—mortalily | ||
| East coast (higher serum TEQs) | 5 | 1.4(0.5-3.2) | |
| West coast (lower serum TEQs) | 24 | 1.0(0.6-1.5) | |
| Lymphocytic—incidence | |||
| East coast (higher serum TEQs) | 4 | 1.2(0.3-3.3) | |
| West coast (lower serum TEQs) | 16 | 1.3(0.8-2.2) | |
| Myeloid—incidence | |||
| East coast (higher serum TEQs) | 2 | 0.9(0.1-3.1) | |
| West coast (lower serum TEQs) | 6 | 0.5(0.2-1.1) | |
ABBREVIATIONS: 2,4-D, 2,4-dichlorophenoxyacetic acid; 2,4,5-T, 2,4,5-trichlorophenoxyacetic acid; ACC, Army Chemical Corps; AHS, Agricultural Health Study; ALL, acute lymphocytic leukemia; AML, acute myeloid leukemia; CDC, Centers for Disease Control and Prevention; CI, confidence interval; CLL, chronic lymphocytic leukemia; CML, chronic myeloid leukemia; COI, chemical of interest; HD, Hodgkin disease; HR, hazard ratio; IARC, International Agency for Research on Cancer; ICD, International Classification of Diseases; LHC, lymphohematopoietic cancers; MCPA, 2-methyl-4-chlorophenoxyacetic acid; MI, Michigan; NHL, non-Hodgkin lymphoma; NIOSH, National Institute for Occupational Safety and Health; nr, not reported; NZ, New Zealand; PCDD, polychlorinated dibenzo-p-dioxin (highly chlorinated, if four or more chlorines); PM, proportionate mortality; SEA, Southeast Asia; TCDD, 2,3,7,8-tetrachlorodibenzo-p-dioxin; TEQ, toxicity equivalent quotient; USDA, US Department of Agriculture; VA, US Department of Veterans Affairs.
aSubjects are male, and outcome is mortality unless otherwise noted.
bGiven when available; results other than estimated risk explained individually.
cLymphopoietic cancers comprise all forms of lymphoma (including Hodgkin lymphoma and non-Hodgkin lymphoma) and leukemia (ALL, AML, CLL, CML).
Occupational Studies Boers et al. (2010) presented results of an additional 15 years of follow-up of a retrospective cohort of workers in two Dutch chlorophenoxy herbicide manufacturing factories (2,4,5-T in Factory A and 2,4-D in Factory B). Analyses of HR were performed using the Cox proportional hazard models with attained age as the timescale. As in the results on all LHCs (HR = 0.89, 95% CI 0.31–2.61 in Factory A; HR = 1.52, 95% CI 0.31–7.45 in Factory B), associations for the smaller group of only leukemias differed considerably between Factory A (HR = 0.28, 95% CI 0.03–2.61) and Factory B (HR = 1.53, 95% CI 0.22–10.82), but were even less certain.
Collins et al. (2008) reported historical exposures estimated on the basis of serum dioxin measurements in some of the workers who were exposed to dioxins at the Dow Chemical Company site producing TCP and PCP in Midland, Michigan. There were 1,615 workers in the TCP cohort and 773 in the PCP cohort, and 196 of the workers were exposed to both TCP and PCP. The vital status
of the TCP workers was followed from 1942 to 2003, and that of the PCP workers from 1940 to 2003. Aleukemia, which can occur in any of the four major types of leukemia but presents with normal WBC counts, was grouped with leukemia. A significant increase in observed deaths from leukemia and aleukemia (SMR = 1.9, 95% CI 1.0–3.2) was observed in the TCP production workers (Collins et al., 2009a) but not in the PCP workers (SMR = 0.6, 95% CI 0.1–2.0) (Collins et al., 2009b).
McBride et al. (2009a,b) published two occupational mortality studies of workers in the Dow AgroSciences plant in New Plymouth, New Zealand, who were potentially exposed to TCDD. McBride et al. (2009a) examined the overall mortality in 1,599 TCP manufacturing workers who were employed during 1969–1988. The SMR and proportional hazards model were used to evaluate risk posed by exposure. The study did not detect any increase in leukemia or aleukemia risk (SMR = 0.6, 95% CI 0.0–3.1). The results in McBride et al. (2009b) have not been included because they were diluted by inclusion of a set of workers who had no opportunity for TCDD exposure and no observed deaths.
Environmental Studies Pesatori et al. (2009) examined cancer incidence through 1996 in the 20-year follow-up of TCDD exposure during the 1976 accident in Seveso. Effects in males and females combined in the three exposure zones were estimated. Nonsignificant positive associations with leukemia were identified in Zone A (RR = 2.18, 95% CI 0.54–8.76) and Zone B (RR=1.35, 95% CI 0.66-2.73), but there was no increase in leukemia risk in Zone R (RR = 0.77, 95% CI 0.53–2.12). When the leukemia cases were divided into myeloid leukemia (ML) and lymphoid leukemia (LL), a statistically significant increase in ML was detected in Zone B (seven cases; RR = 2.41, 95% CI 1.12–5.18), but the increased in risk in Zone A (RR = 2.23, 95% CI 0.31–15.99) was nonsignificant. That might be the first report of a positive association of TCDD exposure with ML. However, no association with ML (RR = 0.76, 95% CI 0.44–1.30) was observed in Zone R. Similarly, a nonsignificant increase in LL was detected in Zone A (1 case; RR = 2.78, 95% CI 0.39–19.9), but no association with LL (13 cases; RR = 0.83, 95% CI 0.46–1.48) was observed in Zone R. No cases were reported in Zone B.
The grouped results on mortality from cancer of “lymphoid, haematopoietic and related tissue” in Finnish fishermen (33 cases) and their wives (10 cases) in the study by Turunen et al. (2008) are too nonspecific to be of use in evaluating an association between the chemicals of interest and particular types of lympho-hematopoietic malignancy.
Biologic Plausibility
Leukemia is a relatively rare spontaneous tumor in mice, but it is less rare in some strains of rats. A small study reported that 5 of 10 male rats fed TCDD at 1
ng/kg per week for 78 weeks showed an increased incidence of various cancers, one of which was lymphocytic leukemia (Van Miller et al., 1977). Later studies of TCDD’s carcinogenicity have not shown an increased incidence of lymphocytic leukemia in mice or rats.
Two recent studies that used cells in tissue culture suggested that TCDD exposure does not promote leukemia. Proliferation of cultured human bone marrow stem cells (the source of leukemic cells) was not influenced by addition of TCDD to the culture medium (van Grevenynghe et al., 2005). Likewise, Mulero-Navarro et al. (2006) reported that the AHR promoter is silenced in ALL—an effect that could lead to reduced expression of the receptor, which binds TCDD and mediates its toxicity. No reports of animal studies have noted an increased incidence of leukemia after exposure to the phenoxy herbicides or other chemicals of interest.
The biologic plausibility of the carcinogenicity of the chemicals of interest is discussed in general at the beginning of this chapter.
Synthesis
The findings of Pesatori et al. (2009) on the incidence of myeloid leukemias in the 20-year follow-up of the Seveso cohort tracked the atypical results reported for myeloid leukemia mortality in the same population at the 25-year follow-up (Consonni et al., 2008), as reviewed in Update 2008. The committee has some concern about misclassification of leukemia types and finds the correspondence between intensity of exposure and magnitude of risk to be erratic, so it does not regard this isolated finding adequate to alter prior conclusions.
Conclusion
On the basis of the evidence reviewed here and in previous VAO reports, the committee concludes that there is inadequate or insufficient evidence to determine whether there is an association between exposure to the chemicals of interest and leukemias in general. An exception is the specific leukemia subtypes of chronic B-cell hematoproliferative diseases, including CLL and HCL, which are more appropriately grouped with lymphomas.
The committee had four categories available to classify the strength of the evidence from the veteran, occupational, and environmental studies that were reviewed regarding an association between exposure to the chemicals of interest and each kind of cancer. In categorizing diseases according to the strength of the evidence, the committee applied the same criteria (discussed in Chapter 2) that were used in VAO, Update 1996, Update 1998, Update 2000, Update 2002, Update 2004, Update 2006, and Update 2008. To be consistent with the charge
to the committee from the Secretary of Veterans Affairs in Public Law 102-4 and with accepted standards of scientific review, the committee distinguished among the four categories on the basis of statistical association, not causality.
Health Outcomes with Sufficient Evidence of an Association
For outcomes in this category, a positive association with at least one of the chemicals of interest must be observed in studies in which chance, bias, and confounding can be ruled out with reasonable confidence. The committee regarded evidence from several small studies that were free of bias and confounding and that showed an association that was consistent in magnitude and direction as sufficient evidence of an association.
Previous VAO committees found sufficient evidence of an association between exposure to at least one of the chemicals of interest and soft-tissue sarcoma, Hodgkin lymphoma, and non-Hodgkin lymphoma broadened to include chronic lymphocytic leukemia, hairy-cell leukemia, and other chronic B-cell neoplasms. The scientific literature continues to support the classification of those cancers in the category of sufficient evidence.
Health Outcomes with Limited or Suggestive Evidence of an Association
For outcomes in this category, the evidence must suggest an association with at least one of the chemicals of interest that could be limited because chance, bias, or confounding could not be ruled out with confidence. A high-quality study may have demonstrated a strong positive association amid a field of less convincing positive findings, or, more often, several studies yielded positive results but the results of other studies were inconsistent.
Previous VAO committees found limited or suggestive evidence of an association between exposure to at least one of the chemicals of interest and laryngeal cancer; cancer of the lung, bronchus, or trachea; prostatic cancer; multiple myeloma; and AL amyloidosis. The literature continues to support the classification of those diseases in the category of limited or suggestive evidence.
Health Outcomes with Inadequate or Insufficient Evidence to Determine Whether There Is an Association
This is the default category for any disease outcome for which there is not enough information on which to base a decision. For many of the kinds of cancer reviewed by the committee, scientific data were available but were inadequate or insufficient in quality, consistency, or statistical power to support a conclusion as to the presence or absence of an association. Some studies failed to control for confounding or failed to provide adequate exposure assessment. In addition to any specific kinds of cancer that have not been directly addressed in the
present report, this category includes hepatobiliary cancer (cancer of the liver, gallbladder, and bile ducts); cancer of the oral cavity, pharynx, and nasal cavity; cancer of the pleura, mediastinum, and other unspecified sites in the respiratory system and intrathoracic organs; cancer of the colon, rectum, esophagus, stomach, and pancreas; bone and joint cancer; melanoma and nonmelanoma skin cancer (including basal-cell carcinoma and squamous-cell carcinoma); breast cancer; cancer of the male and female reproductive systems (excluding prostate cancer); urinary bladder cancer; renal cancer (cancer of the kidney and renal pelvis); cancer of the brain and nervous system (including eye); and the various forms of leukemia other than chronic B-cell leukemias, including chronic lymphocytic leukemia and hairy-cell leukemia.
Health Outcomes with Limited or Suggestive Evidence of No Association
For outcomes in this category, several adequate studies covering the full known range of human exposure must be consistent in not showing a positive association with exposure to one of the chemicals of interest. The studies have relatively narrow confidence intervals. A conclusion of no association would inevitably be limited to the conditions, magnitude of exposure, and length of observation of the available studies. The possibility of a very small increase in risk associated with a given exposure can never be excluded. Inclusion in this category would presume evidence of a lack of association between each of the chemicals of interest and a particular health outcome, but virtually no cancer-epidemiologic studies have specifically evaluated the consequences of exposure to picloram or cacodylic acid.
On the basis of evaluation of the scientific literature, no kinds of cancer satisfy the criteria for inclusion in this category.
ACS (American Cancer Society). 2006. Cancer Facts and Figures 2006. Atlanta, GA: American Cancer Society. http://www.cancer.org/downloads/STT/CAFF2006PWSecured.pdf (accessed March 6, 2007).
ACS. 2007a. Colorectal cancer. Atlanta, GA: American Cancer Society. http://www.cancer.org/acs/groups/cid/documents/webcontent/003096-pdf.pdf (accessed September 18, 2007).
ACS. 2007b. Laryngeal and hypopharyngeal cancer. Atlanta, GA: American Cancer Society. http://www.cancer.org/acs/groups/cid/documents/webcontent/003108-pdf.pdf (accessed September 18, 2007).
ACS. 2007c. Lung cancer (small cell). Atlanta, GA: American Cancer Society. http://www.cancer.org/acs/groups/cid/documents/webcontent/003116-pdf.pdf (accessed September 18, 2007).
_____________________
1 Throughout the report the same alphabetic indicator following year of publication is used consistently for the same article when there were multiple citations by the same first author in a given year. The convention of assigning the alphabetic indicator in order of citation in a given chapter is not followed.
ACS. 2007d. Brain and spinal cord tumors in adults. Atlanta, GA: American Cancer Society. http://www.cancer.org/acs/groups/cid/documents/webcontent/003088-pdf.pdf (accessed September 18, 2007).
ACS. 2011a. Cancer Facts and Figures 2011. Atlanta, GA: American Cancer Society.
ACS. 2011b. Skin cancer: Basal and squamous cell. Atlanta, GA. American Cancer Society.
ADVA (Australia Department of Veterans’ Affairs). 2005a. Cancer Incidence in Australian Vietnam Veteran Study 2005. Canberra, Australia: Department of Veterans’ Affairs.
ADVA. 2005b. The Third Australian Vietnam Veterans Mortality Study 2005. Canberra, Australia: Department of Veterans’ Affairs.
ADVA. 2005c. Australian National Service Vietnam Veterans: Mortality and Cancer Incidence 2005. Canberra, Australia: Department of Veterans’ Affairs.
AFHS (Air Force Health Study). 1996. An Epidemiologic Investigation of Health Effects in Air Force Personnel Following Exposure to Herbicides. Mortality Update 1996. Brooks AFB, TX: Epidemiologic Research Division. Armstrong Laboratory. AL/AO-TR-1996-0068. 31 pp.
AFHS. 2000. An Epidemiologic Investigation of Health Effects in Air Force Personnel Following Exposure to Herbicides. 1997 Follow-up Examination Results. Brooks AFB, TX: Epidemiologic Research Division, Armstrong Laboratory. AFRL-HE-BR-TR-2000-02.
AIHW (Australian Institute of Health and Welfare). 1999. Morbidity of Vietnam Veterans: A Study of the Health of Australia’s Vietnam Veteran Community, Volume 3: Validation Study. Canberra, Australia.
Akhtar FZ, Garabrant DH, Ketchum NS, Michalek JE. 2004. Cancer in US Air Force veterans of the Vietnam War. Journal of Occupational and Environmental Medicine 46(2):123–136.
Alavanja MC, Blair A, Merkle S, Teske J, Eaton B. 1988. Mortality among agricultural extension agents. American Journal of Industrial Medicine 14(2):167–176.
Alavanja MC, Blair A, Merkle S, Teske J, Eaton B, Reed B. 1989. Mortality among forest and soil conservationists. Archives of Environmental Health 44:94–101.
Alavanja MC, Samanic C, Dosemeci M, Lubin J, Tarone R, Lynch CF, Knott C, Thomas K, Hoppin JA, Barker J, Coble J, Sandler DP, Blair A. 2003. Use of agricultural pesticides and prostate cancer risk in the Agricultural Health Study cohort. American Journal of Epidemiology 157(9):800–814.
Alavanja MCR, Sandler DP, Lynch CF, Knott C, Lubin JH, Tarone R, Thomas K, Dosemeci M, Barker J, Hoppin JA, Blair A. 2005. Cancer incidence in the Agricultural Health Study. Scandinavian Journal of Work, Environment and Health 31(Suppl 1):39–45.
Allen JR, Barsotti DA, Van MJP, Abrahamson LJ, Lalich JJ. 1977. Morphological changes in monkeys consuming a diet containing low levels of 2,3,7,8-tetrachlorodibenzo-p-dioxin. Food and Cosmetics Toxicology 15:401–410.
Amadori D, Nanni O, Falcini F, Saragoni A, Tison V, Callea A, Scarpi E, Ricci M, Riva N, Buiatti E. 1995. Chronic lymphocytic leukaemias and non-Hodgkin’s lymphomas by histological type in farming-animal breeding workers: A population case–control study based on job titles. Occupational and Environmental Medicine 52(6):374–379.
Ambolet-Camoit A, Bui L, Pierre S, Chevallier A, Marchand A, Coumoul X, Garlatti M, Andreau K, Barouki R, Aggerbeck M. 2010. 2,3,7,8-tetrachlorodibenzo-p-dioxin counteracts the p53 response to a genotoxicant by upregulating expression of the metastasis marker AGR2 in the hepatocarcinoma cell line HepG2. Toxicological Sciences 115(2):501–512.
Anderson HA, Hanrahan LP, Jensen M, Laurin D, Yick W-Y, Wiegman P. 1986. Wisconsin Vietnam Veteran Mortality Study: Final Report. Madison: Wisconsin Division of Health.
Andersson P, McGuire J, Rubioi C, Gradin K, Whitelaw ML, Pettersson S, Hanberg A, Poellinger L. 2002a. A constitutively active dioxin/aryl hydrocarbon receptor induces stomach tumors. Proceedings of the National Academy of Sciences of the United States 99(15):9990–9995.
Andersson P, Rubio C, Poellinger L, Hanberg A. 2005. Gastric hamartomatous tumours in a transgenic mouse model expressing an activated dioxin/Ah receptor. Anticancer Research 25(2A):903–911.
Andreotti G, Freeman LEB, Hou L, Coble J, Rusiecki J, JA H, Silverman DT, Alavanja MCR. 2009. Agricultural pesticide use and pancreatic cancer risk in the Agricultural Health Study cohort. International Journal of Cancer 124(10):2495–2500.
Androutsopoulos VP, Tsatsakis AM, Spandidos DA. 2009. Cytochrome P450 CYP1A1: Wider roles in cancer progression and prevention. BMC Cancer 9:187.
Arnold LL, Eldan M, Nyska A, van Gemert M, Cohen SM. 2006. Dimethylarsinic acid: Results of chronic toxicity/oncogenicity studies in F344 rats and in B6C3F1 mice. Toxicology 223(1-2):82–100.
Asp S, Riihimaki V, Hernberg S, Pukkala E. 1994. Mortality and cancer morbidity of Finnish chlorophenoxy herbicide applicators: An 18-year prospective follow-up. American Journal of Industrial Medicine 26(2):243–253.
Axelson O, Sundell L, Andersson K, Edling C, Hogstedt C, Kling H. 1980. Herbicide exposure and tumor mortality. An updated epidemiologic investigation on Swedish railroad workers. Scandinavian Journal of Work, Environment, and Health 6(1):73–79.
Baccarelli A, Hirt C, Pesatori AC, Consonni D, Patterson DG Jr, Bertazzi PA, Dolken G, Landi MT. 2006. t(14;18) translocations in lymphocytes of healthy dioxin-exposed individuals from Seveso, Italy. Carcinogenesis 27(10):2001–2007.
Bagga D, Anders KH, Wang HJ, Roberts E, Glaspy JA. 2000. Organochlorine pesticide content of breast adipose tissue from women with breast cancer and control subjects. Journal of the National Cancer Institute 92(9):750–753.
Balarajan R, Acheson ED. 1984. Soft tissue sarcomas in agriculture and forestry workers. Journal of Epidemiology and Community Health 38(2):113–116.
Barouki R, Coumoul X. 2010. Cell migration and metastasis markers as targets of environmental pollutants and the aryl hydrocarbon receptor. Cell Adhesion and Migration 4(1):72–76.
Baumann JL, Cohen S, Evjen AN, Law JH, Vadivelu S, Attia A, Schindler JS, Chung CH, Wirth PS, Meijer CJ, Yarbrough WG, Slebos RJ. 2009. Human papillomavirus in ealy laryngeal carcinoma. Laryngoscope 119:1531–1537.
Becher H, Flesch-Janys D, Kauppinen T, Kogevinas M, Steindorf K, Manz A, Wahrendorf J. 1996. Cancer mortality in German male workers exposed to phenoxy herbicides and dioxins. Cancer Causes and Control 7(3):312–321.
Beebe LE, Fornwald LW, Diwan BA, Anver MR, Anderson LM. 1995. Promotion of N-nitrosodiethylamine-initiated hepatocellular tumors and hepatoblastomas by 2,3,7,8-tetrachlorodibenzo-p-dioxin or Aroclor 1254 in C57BL/6, DBA/2, and B6D2F1 mice. Cancer Research 55(21):4875–4880.
Bender AP, Parker DL, Johnson RA, Scharber WK, Williams AN, Marbury MC, Mandel JS. 1989. Minnesota highway maintenance worker study: Cancer mortality. American Journal of Industrial Medicine 15(5):545–556.
Bertazzi PA, Zocchetti C, Pesatori AC, Guercilena S, Sanarico M, Radice L. 1989a. Mortality in an area contaminated by TCDD following an industrial incident. Medicina Del Lavoro 80(4):316–329.
Bertazzi PA, Zocchetti C, Pesatori AC, Guercilena S, Sanarico M, Radice L. 1989b. Ten-year mortality study of the population involved in the Seveso incident in 1976. American Journal of Epidemiology 129(6):1187–1200.
Bertazzi PA, Zocchetti C, Pesatori AC, Guercilena S, Consonni D, Tironi A, Landi MT. 1992. Mortality of a young population after accidental exposure to 2,3,7,8-tetrachlorodibenzodioxin. International Journal of Epidemiology 21(1):118–123.
Bertazzi A, Pesatori AC, Consonni D, Tironi A, Landi MT, Zocchetti C. 1993. Cancer incidence in a population accidentally exposed to 2,3,7,8-tetrachlorodibenzo-para-dioxin. Epidemiology 4(5):398–406.
Bertazzi PA, Zochetti C, Guercilena S, Consonni D, Tironi A, Landi MT, Pesatori AC. 1997. Dioxin exposure and cancer risk: A 15-year mortality study after the “Seveso accident.” Epidemiology 8(6):646–652.
Bertazzi PA, Bernucci I, Brambilla G, Consonni D, Pesatori AC. 1998. The Seveso studies on early and long-term effects of dioxin exposure: A review. Environmental Health Perspectives 106(Suppl 2):625–633.
Bertazzi PA, Consonni D, Bachetti S, Rubagotti M, Baccarelli A, Zocchetti C, Pesatori AC. 2001. Health effects of dioxin exposure: A 20-year mortality study. American Journal of Epidemiology 153(11):1031–1044.
Bertrand KA, Spiegelman D, Aster JC, Altshul LM, Korrick SA, Rodig SJ, Zhang SM, Kurth T, Laden F. 2010. Plasma organochlorine levels and risk of non-Hodgkin lymphoma in a cohort of men. Epidemiology 21(2):172–180.
Birnbaum LS, Fenton SE. 2003. Cancer and developmental exposure to endocrine disruptors. Environmental Health Perspectives 111(4):389–394.
Blair A, White DW. 1985. Leukemia cell types and agricultural practices in Nebraska. Archives of Environmental Health 40(4):211–214.
Blair A, Grauman DJ, Lubin JH, Fraumeni JF Jr. 1983. Lung cancer and other causes of death among licensed pesticide applicators. Journal of the National Cancer Institute 71(1):31–37.
Blair A, Dosemeci M, Heineman EF. 1993. Cancer and other causes of death among male and female farmers from twenty-three states. American Journal of Industrial Medicine 23(5):729–742.
Blair A, Sandler DP, Tarone R, Lubin J, Thomas K, Hoppin JA, Samanic C, Coble J, Kamel F, Knott C, Dosemeci M, Zahm SH, Lynch CF, Rothman N, Alavanja MC. 2005a. Mortality among participants in the Agricultural Health Study. Annals of Epidemiology 15(4):279–285.
Blair A, Sandler D, Thomas K, Hoppin JA, Kamel F, Coble J, Lee WJ, Rusiecki J, Knott C, Dosemeci M, Lynch CF, Lubin J, Alavanja M. 2005b. Disease and injury among participants in the Agricultural Health Study. Journal of Agricultural Safety and Health 11(2):141–150.
Bloemen LJ, Mandel JS, Bond GG, Pollock AF, Vitek RP, Cook RR. 1993. An update of mortality among chemical workers potentially exposed to the herbicide 2,4-dichlorophenoxyacetic acid and its derivatives. Journal of Occupational Medicine 35(12):1208–1212.
Blot WJ, McLaughlin JK. 1999. The changing epidemiology of esophageal cancer. Seminars in Oncology 26(5 Suppl 15):2–8.
Bodner KM, Collins JJ, Bloemen LJ, Carson ML. 2003. Cancer risk for chemical workers exposed to 2,3,7,8-tetrachlorodibenzo-p-dioxin. Occupational and Environmental Medicine 60(9):672–675.
Boehmer TK, Flanders WD, McGeehin MA, Boyle C, Barrett DH. 2004. Postservice mortality in Vietnam veterans: 30-year follow-up. Archives of Internal Medicine 164(17):1908–1916.
Boers D, Portengen L, Bueno de Mesquita HB, Heederik D, Vermeulen R. 2010. Cause-specific mortality of Dutch chlorophenoxy herbicide manufacturing workers. Occupational and Environmental Medicine 67(1):24–31.
Boffetta P, Stellman SD, Garfinkel L. 1989. A case–control study of multiple myeloma nested in the American Cancer Society prospective study. International Journal of Cancer 43(4):554–559.
Bond GG, Wetterstroem NH, Roush GJ, McLaren EA, Lipps TE, Cook RR. 1988. Cause specific mortality among employees engaged in the manufacture, formulation, or packaging of 2,4-dichlorophenoxyacetic acid and related salts. British Journal of Industrial Medicine 45(2):98–105.
Bonneterre V, Deschamps E, Persoons R, Bernardet C, Liaudy S, Maitre A, de Gaudemaris R. 2007. Sino-nasal cancer and exposure to leather dust. Occupational Medicine 57(6):438–443.
Borlak J, Jenke HS. 2008. Cross-talk between aryl hydrocarbon receptor and mitogen-activated protein kinase signaling pathway in liver cancer through c-raf transcriptional regulation. Molecular Cancer Research 6(8):1326–1336.
Bosl GJ, Motzer RJ. 1997. Testicular germ-cell cancer. New England Journal of Medicine 337(4):242–253.
Boutros PC, Yan R, Moffat ID, Pohjanvirta R, Okey AB. 2008. Transcriptomic responses to 2,3,7,8-tetrachlorodibenzo-p-dioxin (TCDD) in liver: Comparison of rat and mouse. BMC Genomics 9:419.
Boutros PC, Bielefeld KA, Pohjanvirta R, Harper PA. 2009. Dioxin-dependent and dioxin-independent gene batteries: Comparison of liver and kidney in ahr-null mice. Toxicological Sciences 112(1):245–256.
Boyle C, Decoufle P, Delaney RJ, DeStefano F, Flock ML, Hunter MI, Joesoef MR, Karon JM, Kirk ML, Layde PM, McGee DL, Moyer LA, Pollock DA, Rhodes P, Scally MJ, Worth RM. 1987. Postservice Mortality Among Vietnam Veterans. Atlanta, GA: Centers for Disease Control. CEH 86-0076. 143 pp.
Bradlow H. 2008. Review. Indole-3-carbinol as a chemoprotective agent in breast and prostate cancer. In Vivo 22(4):441–445.
Bredhult C, Backlin BM, Olovsson M. 2007. Effects of some endocrine disruptors on the proliferation and viability of human endometrial endothelial cells in vitro. Reproductive Toxicology 23(4):550–559.
Brenner J, Rothenbacher D, Arndt V. 2009. Epidemiology of stomach cancer. Methods in Molecular Biology 472:467–477.
Breslin P, Lee Y, Kang H, Burt V, Shepard BM. 1986. A Preliminary Report: The Vietnam Veterans Mortality Study. Washington, DC: Veterans Administration, Office of Environmental Epidemiology.
Breslin P, Kang H, Lee Y, Burt V, Shepard BM. 1988. Proportionate mortality study of US Army and US Marine Corps veterans of the Vietnam War. Journal of Occupational Medicine 30(5):412–419.
Brown LM, Blair A, Gibson R, Everett GD, Cantor KP, Schuman LM, Burmeister LF, Van Lier SF, Dick F. 1990. Pesticide exposures and other agricultural risk factors for leukemia among men in Iowa and Minnesota. Cancer Research 50(20):6585–6591.
Brown LM, Burmeister LF, Everett GD, Blair A. 1993. Pesticide exposures and multiple myeloma in Iowa men. Cancer Causes and Control 4(2):153–156.
Brunnberg S, Andersson P, Lindstam M, Paulson I, Poellinger L, Hanberg A. 2006. The constitutively active Ah receptor (CA-Ahr) mouse as a potential model for dioxin exposure—Effects in vital organs. Toxicology 224(3):191–201.
Bueno de Mesquita HB, Doornbos G, Van der Kuip DA, Kogevinas M, Winkelmann R. 1993. Occupational exposure to phenoxy herbicides and chlorophenols and cancer mortality in the Netherlands. American Journal of Industrial Medicine 23(2):289–300.
Bullman TA, Kang HK, Watanabe KK. 1990. Proportionate mortality among US Army Vietnam veterans who served in Military Region I. American Journal of Epidemiology 132(4):670–674.
Bullman TA, Watanabe KK, Kang HK. 1994. Risk of testicular cancer associated with surrogate measures of Agent Orange exposure among Vietnam veterans on the Agent Orange Registry. Annals of Epidemiology 4(1):11–16.
Burmeister LF. 1981. Cancer mortality in Iowa farmers, 1971–1978. Journal of the National Cancer Institute 66(3):461–464.
Burmeister LF, Van Lier SF, Isacson P. 1982. Leukemia and farm practices in Iowa. American Journal of Epidemiology 115(5):720–728.
Burmeister LF, Everett GD, Van Lier SF, Isacson P. 1983. Selected cancer mortality and farm practices in Iowa. American Journal of Epidemiology 118(1):72–77.
Burns CJ, Beard KK, Cartmill JB. 2001. Mortality in chemical workers potentially exposed to 2,4-dichlorophenoxyacetic acid (2,4-D) 1945–1994: An update. Occupational and Environmental Medicine 58(1):24–30.
Burt VL, Breslin PP, Kang HK, Lee Y. 1987. Non-Hodgkin’s Lymphoma in Vietnam Veterans. Washington, DC, Department of Medicine and Surgery, Veterans Administration, 33 pp.
Buxbaum JN. 2004. The systemic amyloidoses. Current Opinion in Rheumatology 16(1):67–75.
Campo E, Swerdlow SH, Harris NL, Pileri S, Stein H, Jaffe ES. 2008. The 2008 WHO classification of lymphoid neoplasms and beyond: Evolving concepts and practical applications. Blood 117(19):5019–5032.
Cantor KP. 1982. Farming and mortality from non-Hodgkin’s lymphoma: A case–control study. International Journal of Cancer 29(3):239–247.
Cantor KP, Blair A. 1984. Farming and mortality from multiple myeloma: A case control study with the use of death certificates. Journal of the National Cancer Institute 72(2):251–255.
Caplan LS, Hall HI, Levine RS, Zhu K. 2000. Preventable risk factors for nasal cancer. Annals of Epidemiology 10(3):186–191.
Carlson E, McCulloch C, Koganti A, Goodwin S, Sutter T, Silkworth J. 2009. Divergent transcriptomic responses to aryl hydrocarbon receptor agonists between rat and human primary hepatocytes. Toxicological Sciences 112(1):257–272.
Carreon T, Butler MA, Ruder AM, Waters MA, Davis-King KE, Calvert GM, Schulte PA, Connally B, Ward EM, Sanderson WT, Heineman EF, Mandel JS, Morton RF, Reding DJ, Rosenman KD, Talaska G, Brain Cancer Collaborative Group. 2005. Gliomas and farm pesticide exposure in women: The Upper Midwest Health Study. Environmental Health Perspectives 113(5):546–551.
CDC (Centers for Disease Control and Prevention). 1990a. The association of selected cancers with service in the US military in Vietnam. III. Hodgkin’s disease, nasal cancer, nasopharyngeal cancer, and primary liver cancer. The Selected Cancers Cooperative Study Group. Archives of Internal Medicine 150(12):2495–2505.
CDC. 1990b. The association of selected cancers with service in the US military in Vietnam. I. Non-Hodgkin’s lymphoma. Archives of Internal Medicine 150:2473–2483.
CDVA (Commonwealth Department of Veterans’ Affairs). 1997a. Mortality of Vietnam Veterans: The Veteran Cohort Study. A Report of the 1996 Retrospective Cohort Study of Australian Vietnam Veterans. Canberra, Australia: Department of Veterans’ Affairs.
CDVA. 1997b. Mortality of National Service Vietnam Veterans: A Report of the 1996 Retrospective Cohort Study of Australian Vietnam Veterans. Canberra, Australia: Department of Veterans’ Affairs.
CDVA. 1998a. Morbidity of Vietnam Veterans: A Study of the Health of Australia’s Vietnam Veteran Community. Volume 1: Male Vietnam Veterans Survey and Community Comparison Outcomes. Canberra, Australia: Department of Veterans’ Affairs.
CDVA. 1998b. Morbidity of Vietnam Veterans: A Study of the Health of Australia’s Vietnam Veteran Community. Volume 2: Female Vietnam Veterans Survey and Community Comparison Outcomes. Canberra, Australia: Department of Veterans’ Affairs.
Chamie K, deVere White R, Volpp B, Lee D, Ok J, Ellison L. 2008. Agent Orange exposure, Vietnam War veterans, and the risk of prostate cancer. Cancer 113(9):2464–2470.
Charles JM, Bond DM, Jeffries TK, Yano BL, Stott WT, Johnson KA, Cunny HC, Wilson RD, Bus JS. 1996. Chronic dietary toxicity/oncogenicity studies on 2,4-dichlorophenoxyacetic acid in rodents. Fundamental and Applied Toxicology 33:166–172.
Chiorazzi N, Rai KR, Ferrarini M. 2005. Mechanisms of disease: Chronic lymphocytic leukemia. The New England Journal of Medicine 352(8):804–815.
Chiu BC, Weisenburger DD, Zahm SH, Cantor KP, Gapstur SM, Holmes F, Burmeister LF, Blair A. 2004. Agricultural pesticide use, familial cancer, and risk of non-Hodgkin lymphoma. Cancer Epidemiology, Biomarkers and Prevention 13(4):525–531.
Chiu BC, Dave BJ, Blair A, Gapstur SM, Zahm SH, Weisenburger DD. 2006. Agricultural pesticide use and risk of t(14;18)-defined subtypes of non-Hodgkin lymphoma. Blood 108(4):1363–1369.
Chlebowski RT, Hendrix SL, Langer RD, Stefanick ML, Gass M, Lane D, Rodabough RJ, Gilligan MA, Cyr MG, Thomson CA, Khandekar J, Petrovitch H, McTiernan A, WHI Investigators. 2003. Infleunce of estrogen plus progestin on breast cancer and mammography in healthy post-menopausal women: The Women’s Health Initiative Randomized Trial. Journal of the American Medical Association 289(24):3243–3253.
Chopra M, Dharmarajan AM, Meiss G, Schrenk D. 2009. Inhibition of UV-C light-induced apoptosis in liver cells by 2,3,7,8-tetrachlorodibenzo-p-dioxin. Toxicological Sciences 111(1):49–63.
Chung CJ, Huang CJ, Pu YS, Su CT, Huang YK, Chen YT, Hsueh YM. 2008. Urinary 8-hydroxydeoxyguanosine and urothelial carcinoma risk in low arsenic exposure area. Toxicology and Applied Pharmacology 226(1):14–21.
Clapp RW. 1997. Update of cancer surveillance of veterans in Massachusetts, USA. International Journal of Epidemiology 26(3):679–681.
Clapp RW, Cupples LA, Colton T, Ozonoff DM. 1991. Cancer surveillance of veterans in Massachusetts, 1982–1988. International Journal of Epidemiology 20(1):7–12.
Cocco P, Heineman EF, Dosemeci M. 1999. Occupational risk factors for cancer of the central nervous system (CNS) among US women. American Journal of Industrial Medicine 36(1):70–74.
Coggon D, Pannett B, Winter PD, Acheson ED, Bonsall J. 1986. Mortality of workers exposed to 2-methyl-4-chlorophenoxyacetic acid. Scandinavian Journal of Work, Environment, and Health 12(5):448–454.
Coggon D, Pannett B, Winter P. 1991. Mortality and incidence of cancer at four factories making phenoxy herbicides. British Journal of Industrial Medicine 48(3):173–178.
Cohen AD, Zhou P, Xiao Q, Fleisher M, Kalakonda N, Akhurst T, Chitale DA, Moscowitz MV, Dhodapkar J, Teruya-Feldstein D, Filippa D, Comenzo RL. 2004. Systemic AL amyloidosis due to non-Hodgkin’s lymphoma: An unusual clinicopathologic association. British Journal of Haematology 124:309–314.
Cohen SM, Arnold LL, Eldan M, Lewis AS, Beck BD. 2006. Methylated arsenicals: The implications of metabolism and carcinogenicity studies in rodents to human risk assessment. Critical Reviews in Toxicology 36(2):99–133.
Collins JJ, Strauss ME, Levinskas GJ, Conner PR. 1993. The mortality experience of workers exposed to 2,3,7,8-tetrachlorodibenzo-p-dioxin in a trichlorophenol process accident. Epidemiology 4(1):7–13.
Collins JJ, Bodner KM, Wilken M, Haidar S, Burns CJ, Budinsky RA, Martin GD, Carson ML, Rowlands JC. 2007. Serum concentrations of chlorinated dibenzo-p-dioxins and dibenzofurans among former Michigan trichlorophenol and pentachlorophenol workers. Journal of Exposure Science and Environmental Epidemiology 17(6):541–548.
Collins JJ, Bodner K, Haidar S, Wilken M, Burns CJ, Lamparski LL, Budinsky RA, Martin GD, Carson ML. 2008. Chlorinated dibenzo-p-dioxins, dibenzofurans, and biphenyl profiles of workers with trichlorophenol and pentachlorophenol exposures. Chemosphere 73(Suppl 1):S284–S289.
Collins JJ, Bodner K, Aylward LL, Wilken M, Bodner CM. 2009a. Mortality rates among trichlorophenol workers with exposure to 2,3,7,8-tetrachlorodibenzo-p-dioxin. American Journal of Epidemiology 170(4):501–506.
Collins JJ, Bodner K, Aylward LL, Wilken M, Swaen G, Budinsky R, Rowlands C, Bodnar CM. 2009b. Mortality rates among workers exposed to dioxins in the manufacture of pentachlorophenol. Journal of Occupational and Environmental Medicine 51(10):1212–1219.
Collins JJ, Bodner K, Aylward LL. 2010. Three authors reply. American Journal of Epidemiology 171(1):130–131.
Colt JS, Rothman N, Severson RK, Hartge P, Cerhan JR, Chatterjee N, Cozen W, Morton LM, De Roos AJ, Davis S, Chanock S, Wang SS. 2009. Organochlorine exposure, immune gene variation, and risk of non-Hodgkin lymphoma. Blood 113(9):1899–1905.
Comba P, Ascoli V, Belli S, Benedetti M, Gatti L, Ricci P, Tieghi A. 2003. Risk of soft tissue sarcomas and residence in the neighbourhood of an incinerator of industrial wastes. Occupational and Environmental Medicine 60(9):680–683.
Consonni D, Pesatori AC, Zocchetti C, Sindaco R, D’Oro LC, Rubagotti M, Bertazzi PA. 2008. Mortality in a population exposed to dioxin after the Seveso, Italy, accident in 1976: 25 Years of follow-up. American Journal of Epidemiology 167(7):847–858.
Cordier S, Le TB, Verger P, Bard D, Le CD, Larouze B, Dazza MC, Hoang TQ, Abenhaim L. 1993. Viral infections and chemical exposures as risk factors for hepatocellular carcinoma in Vietnam. International Journal of Cancer 55(2):196–201.
Corrao G, Caller M, Carle F, Russo R, Bosia S, Piccioni P. 1989. Cancer risk in a cohort of licensed pesticide users. Scandinavian Journal of Work, Environment, and Health 15(3):203–209.
Costani G, Rabitti P, Mambrini A, Bai E, Berrino F. 2000. Soft tissue sarcomas in the general population living near a chemical plant in northern Italy. Tumori 86(5):381–383.
Cypel Y, Kang H. 2008. Mortality patterns among women Vietnam-era veterans: Results of a retrospective cohort study. Annals of Epidemiology 18(3):244–252.
Cypel Y, Kang H. 2010. Mortality patterns of Army Chemical Corps veterans who were occupationally exposed to herbicides in Vietnam. Annals of Epidemiology 20(5):339–346.
Dai D, Oyana TJ. 2008. Spatial variations in the incidence of breast cancer and potential risks associated with soil dioxin contamination in Midland, Saginaw, and Bay counties, Michigan, USA. Environmental Health: A Global Access Science Source 7:49.
Dalager NA, Kang HK. 1997. Mortality among Army Chemical Corps Vietnam veterans. American Journal of Industrial Medicine 31(6):719–726.
Dalager NA, Kang HK, Burt VL, Weatherbee L. 1991. Non-Hodgkin’s lymphoma among Vietnam veterans. Journal of Occupational Medicine 33(7):774–779.
Dalager NA, Kang HK, Thomas TL. 1995. Cancer mortality patterns among women who served in the military: The Vietnam experience. Journal of Occupational and Environmental Medicine 37(3):298–305.
Davis BJ, McCurdy EA, Miller BD, Lucier GW, Tritscher AM. 2000. Ovarian tumors in rats induced by chronic 2,3,7,8-tetrachlorodibenzo-p-dioxin treatment. Cancer Research 60(19):5414–5419.
De Roos AJ, Hartge P, Lubin JH, Colt JS, Davis S, Cerhan JR, Severson RK, Cozen W, Patterson DG Jr, Needham LL, Rothman N. 2005a. Persistent organochlorine chemicals in plasma and risk of non-Hodgkin’s lymphoma. Cancer Research 65(23):11214–11226.
Dean G. 1994. Deaths from primary brain cancers, lymphatic and haematopoietic cancers in agricultural workers in the Republic of Ireland. Journal of Epidemiology and Community Health 48(4):364–368.
Degner SC, Papoutsis AJ, Selmin O, Romagnolo DF. 2009. Targeting of aryl hydrocarbon receptor-mediated activation of cyclooxygenase-2 expression by the indole-3-carbinol metabolite 3,3-di-indolylmethane in breast cancer cells. Journal of Nutrition 139(1):26–32.
Demers A, Ayotte P, Brisson J, Dodin S, Robert J, Dewailly E. 2000. Risk and aggressiveness of breast cancer in relation to plasma organochlorine concentrations. Cancer Epidemiology, Biomarkers and Prevention 9(2):161–166.
Dennis LK, Lynch CF, Sandler DP, Alavanja M. 2010. Pesticide use and cutaneous melanoma in pesticide applicators in the Agricultural Heath Study. Environmental Health Perspectives 118(6):812–817.
Dere E, Boverhof DR, Burgoon LD, Zacharewski TR. 2006. In vivo-in vitro toxicogenomic comparison of TCDD-elicited gene expression in Hepa1c1c7 mouse hepatoma cells and C57BL/6 hepatic tissue. BMC Genomics 7:80.
d’Errico A, Pasian S, Baratti A, Zanelli R, Alfonzo S, Gilardi L, Beatrice F, Bena A, Costa G. 2006. A case–control study on occupational risk factors for sino-nasal cancer. Occupational and Environmental Medicine 66(7):448–455.
Desaulniers D, Leingartner K, Russo J, Perkins G, Chittim BG, Archer MC, Wade M, Yang J. 2001. Modulatory effects of neonatal exposure to TCDD or a mixture of PCBs, p,p’-DDT, and p-p’-DDE on methylnitrosourea-induced mammary tumor development in the rat. Environmental Health Perspectives 109:739–747.
Desaulniers D, Leingartner K, Musicki B, Cole J, Li M, Charboneau M, Tsang BK. 2004. Lack of effects of postnatal exposure to a mixture of aryl hydrocarbon-receptor agonists on the development of methylnitrosourea-induced mammary tumors in Sprague-Dawley rats. Journal of Toxicology and Environmental Health, Part A 67(18):1457–1475.
Dich J, Wiklund K. 1998. Prostate cancer in pesticide applicators in Swedish agriculture. Prostate 34(2):100–112.
Dietrich C, Kaina B. 2010. The aryl hydrocarbon receptor (AHR) in the regulation of cell-cell contact and tumor growth. Carcinogenesis 31(8):1319–1328.
DiNatale BC, Schroeder JC, Francey LJ, Kusnadi A, Perdew GH. 2010. Mechanistic insights into the events that lead to synergistic induction of interleukin 6 transcription upon activation of the aryl hydrocarbon receptor and inflammatory signaling. Journal of Biological Chemistry 285(32):24388–24397.
Donna A, Betta P-G, Robutti F, Crosignani P, Berrino F, Bellingeri D. 1984. Ovarian mesothelial tumors and herbicides: A case–control study. Carcinogenesis 5(7):941–942.
Dopp E, Von Recklinghausen U, Hartmann LM, Stueckradt I, Pollok I, Rabieh S, Hao L, Nussler A, Katier C, Hirner AV, Rettenmeier AW. 2008. Subcellular distribution of inorganic and methylated arsenic compounds in human urothelial cells and human hepatocytes. Drug Metabolism and Disposition 36(5):971–979.
Dubrow R, Paulson JO, Indian RW. 1988. Farming and malignant lymphoma in Hancock County, Ohio. British Journal of Industrial Medicine 45(1):25–28.
Duell EJ, Millikan RC, Savitz DA, Newman B, Smith JC, Schell MJ, Sandler DP. 2000. A population-based case–control study of farming and breast cancer in North Carolina. Epidemiology 11(5):523–531.
Ekström AM, Eriksson M, Hansson L-E, Lindgren A, Signorello LB, Nyrén O, Hardell L. 1999. Occupational exposures and risk of gastric cancer in a population-based case–control study. Cancer Research 59:5932–5937.
Engel LS, Hill DA, Hoppin JA, Lubin JH, Lynch CF, Pierce J, Samanic C, Sandler DP, Blair A, Alavanja MC. 2005. Pesticide use and breast cancer risk among farmers’ wives in the Agricultural Health Study. American Journal of Epidemiology 161(2):121–135.
Engel LS, Laden F, Andersen A, Strickland PT, Blair A, Needham LL, Barr DB, Wolff MS, Helzlsouer K, Hunter DJ, Lan Q, Cantor KP, Comstock GW, Brock, JW, Bush D, Hoover RN, Rothman N. 2007. Polychlorinated biphenyl levels in peripheral blood and non-Hodgkin’s lymphoma: A report from three cohorts. Cancer Research 67(11):5545–5552.
Eriksson M, Karlsson M. 1992. Occupational and other environmental factors and multiple myeloma: A population based case–control study. British Journal of Industrial Medicine 49(2):95–103.
Eriksson M, Hardell L, Berg NO, Moller T, Axelson O. 1979. Case–control study on malignant mesenchymal tumor of the soft tissue and exposure to chemical substances. Lakartidningen 76(44):3872–3875.
Eriksson M, Hardell L, Berg NO, Moller T, Axelson O. 1981. Soft-tissue sarcomas and exposure to chemical substances: A case-referent study. British Journal of Industrial Medicine 38(1):27–33.
Eriksson M, Hardell L, Malker H, Weiner J. 1992. Malignant lymphoproliferative diseases in occupations with potential exposure to phenoxyacetic acids or dioxins: A register-based study. American Journal of Industrial Medicine 22:305–312.
Eriksson M, Hardell L, Carlberg M, Akerman M. 2008. Pesticide exposure as risk factor for non-Hodgkin lymphoma including histopathological subgroup analysis. International Journal of Cancer 123(7):1657–1663.
Fenton SE. 2006. Endocrine-disrupting compounds and mammary gland development: Early exposure and later life consequences. Endocrinology 147(6):S18–S24.
Fenton SE. 2009. The mammary gland: A tissue sensitive to environmental exposures. Reviews on Environmental Health 24(4):319–325.
Feron VJ, Arts JH, Kuper CF, Slootweg PJ, Woutersen RA. 2001. Health risks associated with inhaled nasal toxicants. Critical Reviews in Toxicology 31(3):313–347.
Fett MJ, Nairn JR, Cobbin DM, Adena MA. 1987. Mortality among Australian conscripts of the Vietnam conflict era. II. Causes of death. American Journal of Epidemiology 125(15):878–884.
Fingerhut MA, Halperin WE, Marlow DA, Piacitelli LA, Honchar PA, Sweeney MH, Greife AL, Dill PA, Steenland K, Suruda AJ. 1991. Cancer mortality in workers exposed to 2,3,7,8-tetrachlorodibenzo-p-dioxin. New England Journal of Medicine 324(4):212–218.
Fleming LE, Bean JA, Rudolph M, Hamilton K. 1999a. Mortality in a cohort of licensed pesticide applicators in Florida. Journal of Occupational and Environmental Medicine 56(1):14–21.
Fleming LE, Bean JA, Rudolph M, Hamilton K. 1999b. Cancer incidence in a cohort of licensed pesticide applicators in Florida. Journal of Occupational and Environmental Medicine 41(4):279–288.
Floret N, Mauny F, Challier B, Arveux P, Cahn J-Y, Viel J-F. 2003. Dioxin emissions from a solid waste incinerator and risk of non-Hodgkin lymphoma. Epidemiology 14(4):392–398.
Fritschi L, Benke G, Hughes AM, Kricker A, Turner J, Vajdic CM, Grulich A, Milliken S, Kaldor J, Armstrong BK. 2005. Occupational exposure to pesticides and risk of non-Hodgkin’s lymphoma. American Journal of Epidemiology 162(9):849–857.
Fritz WA, Lin TM, Moore RW, Cooke PS, Peterson RE. 2005. In utero and lactational 2,3,7,8-tetrachlorodibenzo-p-dioxin exposure: Effects on the prostate and its response to castration in senescent C57BL/6J mice. Toxicological Sciences 86(2):387–395.
Fritz WA, Lin T-M, Peterson RE. 2008. The aryl hydrocarbon receptor (AhR) inhibits vanadate-induced vascular endothelial growth factor (VEGF) production in TRAMP prostates. Carcinogenesis 29(5):1077–1082.
Fukuda Y, Nakamura K, Takano T. 2003. Dioxins released from incineration plants and mortality from major diseases: An analysis of statistical data by municipalities. Journal of Medical and Dental Sciences 50(4):249–255.
Fukushima S, Morimura K, Wanibuchi H, Kinoshita A, Salim EI. 2005. Current and emerging challenges in toxicopathology: Carcinogenic threshold of phenobarbital and proof of arsenic carcinogenicity using rat medium-term bioassays for carcinogens. Toxicology and Applied Pharmacology 207(Suppl 2):225–229.
Gallagher RP, Bajdik CD, Fincham S, Hill GB, Keefe AR, Coldman A, McLean DI. 1996. Chemical exposures, medical history, and risk of squamous and basal cell carcinoma of the skin. Cancer Epidemiology, Biomarkers and Prevention 5(6):419–424.
Gambini GF, Mantovani C, Pira E, Piolatto PG, Negri E. 1997. Cancer mortality among rice growers in Novara Province, northern Italy. American Journal of Industrial Medicine 31(4):435–441.
Gann PH. 1997. Interpreting recent trends in prostate cancer incidence and mortality. Epidemiology 8(2):117–120.
Garland FC, Gorham ED, Garland CF, Ferns JA. 1988. Non-Hodgkin’s lymphoma in US Navy personnel. Archives of Environmental Health 43(6):425–429.
Gillison ML, Shah KV. 2001. Human papillomavirus-associated head and neck squamous cell carcinoma: A mounting evidence for an etiologic role for human papillomavirus in a subset of head and neck cancers. Current Opinions in Oncology 13:183–188.
Giri VN, Cassidy AE, Beebe-Dimmer J, Smith DC, Bock CH, Cooney KA. 2004. Association between Agent Orange and prostate cancer: A pilot case–control study. Urology 63(4):757–760; discussion 760–761.
Gold LS, De Roos AJ, Brown EE, Lan Q, Milliken K, Davis S, Chanock SJ, Zhang Y, Severson R, Zahm SH, Zheng T, Rothman N, Baris D. 2009. Association of common varients in genes involved in metabolism and response to exogenous chemicals with risk of multiple myeloma. Cancer Epidemiology 33:276–280.
Green LM. 1991. A cohort mortality study of forestry workers exposed to phenoxy acid herbicides. British Journal of Industrial Medicine 48(4):234–238.
Greenwald P, Kovasznay B, Collins DN, Therriault G. 1984. Sarcomas of soft tissues after Vietnam service. Journal of the National Cancer Institute 73(5):1107–1109.
Grimsrud TK, Peto J. 2006. Persisting risk of nickel related lung cancer and nasal cancer among Clydach refiners. Occupational and Environmental Medicine 63(5):365–366.
Gupta A, Ketchum N, Roehrborn CG, Schecter A, Aragaki CC, Michalek JE. 2006. Serum dioxin, testosterone, and subsequent risk of benign prostatic hyperplasia: A prospective cohort study of Air Force veterans. Environmental Health Perspectives 114(11):1649–1654.
Hahn WC, Weinberg RA. 2002. Rules for making human tumor cells. New England Journal of Medicine 347(20):1593–1603.
Hallquist A, Hardell L, Degerman A, Boquist L. 1993. Occupational exposures and thyroid cancer: Results of a case–control study. European Journal of Cancer Prevention 2(4):345–349.
Halwachs S, Lakoma C, Gebhardt R, Schafer I, Seibel P, Honscha W. 2010. Dioxin mediates down-regulation of the reduced folate carrier transport activity via the arylhydrocarbon receptor signalling pathway. Toxicology and Applied Pharmacology 246(1-2):100–106.
Hansen ES, Hasle H, Lander F. 1992. A cohort study on cancer incidence among Danish gardeners. American Journal of Industrial Medicine 21(5):651–660.
Hansen ES, Lander F, Lauritsen JM. 2007. Time trends in cancer risk and pesticide exposure, a long-term follow-up of Danish gardeners. Scandinavian Journal of Work, Environment, and Health 33(6):465–469.
Hardell L. 1981. Relation of soft-tissue sarcoma, malignant lymphoma and colon cancer to phenoxy acids, chlorophenols and other agents. Scandinavian Journal of Work, Environment, and Health 7(2):119–130.
Hardell L, Bengtsson NO. 1983. Epidemiological study of socioeconomic factors and clinical findings in Hodgkin’s disease, and reanalysis of previous data regarding chemical exposure. British Journal of Cancer 48(2):217–225.
Hardell L, Eriksson M, Lenner P, Lundgren E. 1981. Malignant lymphoma and exposure to chemicals, especially organic solvents, chlorophenols and phenoxy acids: A case–control study. British Journal of Cancer 43:169–176.
Hardell L, Johansson B, Axelson O. 1982. Epidemiological study of nasal and nasopharyngeal cancer and their relation to phenoxy acid or chlorophenol exposure. American Journal of Industrial Medicine 3(3):247–257.
Hardell L, Bengtsson NO, Jonsson U, Eriksson S, Larsson LG. 1984. Aetiological aspects on primary liver cancer with special regard to alcohol, organic solvents and acute intermittent porphyria: An epidemiological investigation. British Journal of Cancer 50(3):389–397.
Hardell L, Eriksson M, Degerman A. 1994. Exposure to phenoxyacetic acids, chlorophenols, or organic solvents in relation to histopathology, stage, and anatomical localization of non-Hodgkin’s lymphoma. Cancer Research 54(9):2386–2389.
Hardell L, Nasman A, Ohlson CG, Fredrikson M. 1998. Case–control study on risk factors for testicular cancer. International Journal of Oncology 13(6):1299–1303.
Hardell L, Lindström G, van Bavel B, Hardell K, Linde A, Carlberg M, Liljegren G. 2001. Adipose tissue concentrations of dioxins and dibenzofurans, titers of antibodies to Epstein-Barr virus early antigen and the risk for non-Hodgkin’s lymphoma. Environmental Research 87(2):99–107.
Hardell L, Eriksson M, Nordstrom M. 2002. Exposure to pesticides as risk factor for non-Hodgkin’s lymphoma and hairy cell leukemia: Pooled analysis of two Swedish case–control studies. Leukemia and Lymphoma 43(5):1043–1049.
Hartge P, Colt JS, Severson RK, Cerhan JR, Cozen W, Camann D, Zahm SH, Davis S. 2005. Residential herbicide use and risk of non-Hodgkin lymphoma. Cancer Epidemiology, Biomarkers and Prevention 14(4):934–937.
Hayashi H, Kanisawa M, Yamanaka K, Ito T, Udaka N, Ohji H, Okudela K, Okada S, Kitamura H. 1998. Dimethylarsinic acid, a main metabolite of inorganic arsenics, has tumorigenicity and progression effects in the pulmonary tumors of A/J mice. Cancer Letters 125(1-2):83–88.
Hebert CD, Harris MW, Elwell MR, Birnbaum LS. 1990. Relative toxicity and tumor-promoting ability of 2,3,7,8-tetrachlorodibenzo-p-dioxin (TCDD), 2,3,4,7,8-pentachlorodibenzofuran (PCDF), and 1,2,3,4,7,8-hexachlorodibenzofuran (HCDF) in hairless mice. Toxicology and Applied Pharmacology 102(2):362–377.
Henneberger PK, Ferris BG Jr, Monson RR. 1989. Mortality among pulp and paper workers in Berlin, New Hampshire. British Journal of Industrial Medicine 46(9):658–664.
Hernández LG, van Steeg H, Luijten M, van Benthem J. 2009. Review: Mechanisms of non-genotoxic carcinogens and importance of a weight of evidence approach. Mutation Research 682:94–109.
Heron M, Hoyert D, Murphy S, Xu J, Kochanek K, Tejada-Vera B. 2009. Deaths: Final data for 2006. National Vital Statistics Reports 57(14):1–80.
Hertzman C, Teschke K, Ostry A, Hershler R, Dimich-Ward H, Kelly S, Spinelli JJ, Gallagher RP, McBride M, Marion SA. 1997. Mortality and cancer incidence among sawmill workers exposed to chlorophenate wood preservatives. American Journal of Public Health 87(1):71–79.
Hoar SK, Blair A, Holmes FF, Boysen CD, Robel RJ, Hoover R, Fraumeni JF. 1986. Agricultural herbicide use and risk of lymphoma and soft-tissue sarcoma. Journal of the American Medical Association 256(9):1141–1147.
Hobbs CG, Birchall MA. 2004. Human papillomavirus infection in the etiology of laryngeal carcinoma. Current Opinion in Otolaryngology and Head and Neck Surgery 12(2):88–92.
Hoffman RE, Stehr-Green PA, Webb KB, Evans RG, Knutsen AP, Schramm WF, Staake JL, Gibson BB, Steinberg KK. 1986. Health effects of long term exposure to 2,3,7,8-tetrachlorodibenzo-p-dioxin. Journal of the American Medical Association 255(15):2031–2038.
Holcombe M, Safe S. 1994. Inhibition of 7,12-dimethylbenzanthracene-induced rat mammary tumor growth by 2,3,7,8-tetrachlorodibenzo-p-dioxin. Cancer Letters 82(1):43–47.
Holford TR, Zheng T, Mayne ST, Zahm SH, Tessari JD, Boyle P. 2000. Joint effects of nine polychlorinated biphenyl (PCB) congeners on breast cancer risk. International Journal of Epidemiology 29(6):975–982.
Hollingshead BD, Beischlag TV, Dinatale BC, Ramadoss P, Perdew GH. 2008. Inflammatory signaling and aryl hydrocarbon receptor mediate synergistic induction of interleukin 6 in MCF-7 cells. Cancer Research 68(10):3609–3617.
Holmes AP, Bailey C, Baron RC, Bosanac E, Brough J, Conroy C, Haddy L. 1986. West Virginia Department of Health Vietnam-Era Veterans Mortality Study: Preliminary Report. Charles Town, WV: West Virginia Health Department.
Hooiveld M, Heederik DJ, Kogevinas M, Boffetta P, Needham LL, Patterson DG Jr, Bueno de Mesquita HB. 1998. Second follow-up of a Dutch cohort occupationally exposed to phenoxy herbicides, chlorophenols, and contaminants. American Journal of Epidemiology 147(9):891–901.
Høyer AP, Jørgensen T, Brock JW, Grandjean P. 2000. Organochlorine exposure and breast cancer survival. Journal of Clinical Epidemiology 53(3):323–330.
Hsu EL, Yoon D, Choi HH, Wang F, Taylor RT, Chen N, Zhang R, Hankinson O. 2007. A proposed mechanism for the protective effect of dioxin against breast cancer. Toxicological Sciences 98(2):436–444.
Huang YK, Pu YS, Chung CJ, Shiue HS, Yang MH, Chen CJ, Hsueh YM. 2008. Plasma folate level, urinary arsenic methylation profiles, and urothelial carcinoma susceptibility. Food and Chemical Toxicology 46(3):929–938.
Hussein MA, Juturi JV, Lieberman I. 2002. Multiple myeloma: Present and future. Current Opinions in Oncology 14(1):31–35.
IARC (International Agency for Research on Cancer). 2001. Pathology and genetics of tumours of the haemopoietic and lymphoid tissues. In: Jaffe NL, Harris H, Stein, Vardiman JW, eds. World Health Organization, IARC.
Ikuta T, Namiki T, Fujii-Kuriyama Y, Kawajiri K. 2009. AHR protein trafficking and function in the skin. Biochemical Pharmacology 77(4):588–596.
IOM (Institute of Medicine). 1994. Veterans and Agent Orange: Health Effects of Herbicides Used in Vietnam. Washington, DC: National Academy Press.
IOM. 1996. Veterans and Agent Orange: Update 1996. Washington, DC: National Academy Press.
IOM. 1999. Veterans and Agent Orange: Update 1998. Washington, DC: National Academy Press.
IOM. 2001.Veterans and Agent Orange: Update 2000. Washington, DC: National Academy Press.
IOM. 2003. Veterans and Agent Orange: Update 2002. Washington, DC: The National Academies Press.
IOM. 2005. Veterans and Agent Orange: Update 2004. Washington, DC: The National Academies Press.
IOM. 2006. Asbestos: Selected Cancers. Washington, DC: The National Academies Press.
IOM. 2007. Veterans and Agent Orange: Update 2006. Washington, DC: The National Academies Press.
IOM. 2009. Veterans and Agent Orange: Update 2008. Washington, DC: The National Academies Press.
Ishida M, Mikami S, Kikuchi E, Kosaka T, Miyajima A, Nakagawa K, Mukai M, Okada Y, Oya M. 2010. Activation of the aryl hydrocarbon receptor pathway enhances cancer cell invasion by upregulating the MMP expression and is associated with poor prognosis in upper urinary tract urothelial cancer. Carcinogenesis 31(2):287–295.
Jaffe ES. 2009. The 2008 WHO classification of lymphomas: Implications for clinical practice and translational research. Hematology 1:523–531.
Jaffe ES, Harris NL, Stein H, Isaacson PG. 2008. Classification of lymphoid neoplasms: The microscope as a tool for disease discovery. Blood 112(12):4384–4397.
Jemal A, Thun MJ, Ries L, Howe H, Weir HK, Center MM, Ward E, Wu X-C, Eheman C, Anderson R, Ajani UA, Kohler B, Edwards BK. 2008. Annual report to the nation on the status of cancer, 1975–2005, featuring trends in lung cancer, tobacco use, and tobacco control. Journal of the National Cancer Institute 100(23):1672–1694.
Jemal A, Siegel R, Xu J, Ward E. 2010. Cancer statistics, 2010. CA: A Cancer Journal for Clinicians 60(5):277–300.
Jenkins S, Rowell C, Wang J, Lamartiniere CA. 2007. Prenatal TCDD exposure predisposes for mammary cancer in rats. Reproductive Toxicology 23(3):391–396.
Johnstone SE, Baylin SB. 2010. Stress and the epigenetic landscape: A link to the pathobiology of human diseases? Nature Reviews Genetics 11(11):806–812.
Kang HK, Weatherbee L, Breslin PP, Lee Y, Shepard BM. 1986. Soft tissue sarcomas and military service in Vietnam: A case comparison group analysis of hospital patients. Journal of Occupational Medicine 28(12):1215–1218.
Kang HK, Mahan CM, Lee KY, Magee CA, Selvin S. 2000. Prevalence of gynecologic cancers among female Vietnam veterans. Journal of Occupational and Environmental Medicine 42(11):1121–1127.
Kato H, Kinshita T, Suzuki S, Nagasaka T, Hatano S, Murate T, Saito H, Hotta T. 1998. Production and effects of interleukin–6 and other cytokines in patients with non-Hodgkin’s lymphoma. Leukemia and Lmphoma 29(1–2):71–79.
Kato I, Watanabe-Meserve H, Koenig KL, Baptiste MS, Lillquist PP, Frizzera G, Burke JS, Moseson M, Shore RE. 2004. Pesticide product use and risk of non-Hodgkin lymphoma in women. Environmental Health Perspectives 112(13):1275–1281.
Keller-Byrne JE, Khuder SA, Schaub EA, McAfee O. 1997. A meta-analysis of non-Hodgkin’s lymphoma among farmers in the central United States. American Journal of Industrial Medicine 31(4):442–444.
Ketchum NS, Michalek JE, Burton JE. 1999. Serum dioxin and cancer in veterans of Operation Ranch Hand. American Journal of Epidemiology 149(7):630–639.
Key TJ, Schatzkin A, Willett WC, Allen NE, Spencer EA, Travis RC. 2004. Diet, nutrition and the prevention of cancer. Public Health Nutrition 7(1A):187–200.
Kim S, Dere E, Burgoon LD, Chang C-C, Zacharewski TR. 2009. Comparative analysis of AHR-mediated TCDD-elicited gene expression in human liver adult stem cells. Toxicological Sciences 112(1):229–244.
Knerr S, Schrenk D. 2006. Carcinogenicity of 2,3,7,8-tetrachlorodibenzo-p-dioxin in experimental models. Molecular Nutrition and Food Research 50(10):897–907.
Kociba RJ, Keys DG, Beyer JE, Careon RM, Wade CE, Dittenber DA, Kalnins RP, Frauson LE, Park CN, Barnar SD, Hummel RA, Humiston CG. 1978. Results of a two-year chronic toxicity and oncogenicity study of 2,3,7,8-tetrachlorodibenzo-p-dioxin in rats. Toxicology and Applied Pharmacology 46:279–303.
Kogan MD, Clapp RW. 1988. Soft tissue sarcoma mortality among Vietnam veterans in Massachusetts, 1972 to 1983. International Journal of Epidemiology 17(1):39–43.
Kogevinas M, Saracci R, Bertazzi PA, Bueno de Mesquita BH, Coggon D, Green LM, Kauppinen T, Littorin M, Lynge E, Mathews JD, Neuberger M, Osman J, Pearce N, Winkelmann R. 1992. Cancer mortality from soft-tissue sarcoma and malignant lymphomas in an international cohort of workers exposed to chlorophenoxy herbicides and chlorophenols. Chemosphere 25:1071–1076.
Kogevinas M, Saracci R, Winkelmann R, Johnson ES, Bertazzi PA, Bueno de Mesquita BH, Kauppinen T, Littorin M, Lynge E, Neuberger M. 1993. Cancer incidence and mortality in women occupationally exposed to chlorophenoxy herbicides, chlorophenols, and dioxins. Cancer Causes and Control 4(6):547–553.
Kogevinas M, Kauppinen T, Winkelmann R, Becher H, Bertazzi PA, Bas B, Coggon D, Green L, Johnson E, Littorin M, Lynge E, Marlow DA, Mathews JD, Neuberger M, Benn T, Pannett B, Pearce N, Saracci R. 1995. Soft tissue sarcoma and non-Hodgkin’s lymphoma in workers exposed to phenoxy herbicides, chlorophenols and dioxins: Two nested case–control studies. Epidemiology 6(4):396–402.
Kogevinas M, Becher H, Benn T, Bertazzi PA, Boffetta P, Bueno de Mesquita HB, Coggon D, Colin D, Flesch-Janys D, Fingerhut M, Green L, Kauppinen T, Littorin M, Lynge E, Mathews JD, Neuberger M, Pearce N, Saracci R. 1997. Cancer mortality in workers exposed to phenoxy herbicides, chlorophenols, and dioxins. An expanded and updated international cohort study. American Journal of Epidemiology 145(12):1061–1075.
Köhle C, Schwarz M, Bock KW. 2008. Promotion of hepatocarcinogenesis in humans and animal models. Archives of Toxicology 82:623–631.
Kollara A, Brown TJ. 2009. Modulation of aryl hydrocarbon receptor activity by four and a half LIM domain 2. International Journal of Biochemistry and Cell Biology 41(5):1182–1188.
Korenaga T, Fukusato T, Ohta M, Asaoka K, Murata N, Arima A, Kubota S. 2007. Long-term effects of subcutaneously injected 2,3,7,8-tetrachlorodibenzo-p-dioxin on the liver of rhesus monkeys. Chemosphere 67(9):S399–S404.
Kovacs E. 2006. Multiple myeloma and B cell lymphoma: Investigation of IL–6, IL–6 receptor antagonist (IL–6RA), and GP130 antagonist (GP130A) using various parameters in an in vitro model. The Scientific World Journal 6:888–898.
Küppers R, Schwering I, Bräuninger A, Rajewsky K, Hansmann M. 2002. Biology of Hodgkin’s lymphoma. Annals of Oncology 13(Suppl 1):11–18.
Laden F, Bertrand KA, Altshul L, Aster JC, Korrick SA, Sagiv SK. 2010. Plasma organochlorine levels and risk of non-Hodgkin lymphoma in the Nurses’ Health Study. Cancer Epidemiology and Biomarkers of Prevention 19(5):1381–1384.
Lampi P, Hakulinen T, Luostarinen T, Pukkala E, Teppo L. 1992. Cancer incidence following chlorophenol exposure in a community in southern Finland. Archives of Environmental Health 47(3):167–175.
Landgren O, Kyle RA, Hoppin JA, Freeman LEB, Cerhan JR, Katzmann JA, Rajkumar SV, Alavanja MC. 2009. Pesticide exposure and tisk of monoclonal gammopathy of undetermined significance in the Agricultural Health Study. Blood 113(25):6386–6391.
LaVecchia C, Negri E, D’Avanzo B, Franceschi S. 1989. Occupation and lymphoid neoplasms. British Journal of Cancer 60(3):385–388.
Lawrence CE, Reilly AA, Quickenton P, Greenwald P, Page WF, Kuntz AJ. 1985. Mortality patterns of New York State Vietnam veterans. American Journal of Public Health 75(3):277–279.
Leavy J, Ambrosini G, Fritschi L. 2006. Vietnam military service history and prostate cancer. BMC Public Health 6:75.
Lee WJ, Lijinsky W, Heineman EF, Markin RS, Weisenburger DD, Ward MH. 2004a. Agricultural pesticide use and adenocarcinomas of the stomach and oesophagus. Occupational and Environmental Medicine 61(9):743–749.
Lee WJ, Cantor KP, Berzofsky JA, Zahm SH, Blair A. 2004b. Non-Hodgkin’s lymphoma among asthmatics exposed to pesticides. International Journal of Cancer 111(2):298–302.
Lee WJ, Colt JS, Heineman EF, McComb R, Weisenburger DD, Lijinsky W, Ward MH. 2005. Agricultural pesticide use and risk of glioma in Nebraska, United States. Occupational and Environmental Medicine 62(11):786–792.
Lee WJ, Sandler DP, Blair A, Samanic C, Cross AJ, Alavanja MC. 2007. Pesticide use and colorectal cancer risk in the Agricultural Health Study. International Journal of Cancer 121(2):339–346.
Lin PH, Lin CH, Huang CC, Chuang MC, Lin P. 2007. 2,3,7,8-tetrachlorodibenzo-p-dioxin (TCDD) induces oxidative stress, DNA strand breaks, and poly(ADP-ribose) polymerase-1 activation in human breast carcinoma cell lines. Toxicology Letters 172(3):146–158.
Lin PH, Lin CH, Huang CC, Fang JP, Chuang MC. 2008. 2,3,7,8-tetrachlorodibenzo-p-dioxin modulates the induction of DNA strand breaks and poly(ADP-ribose) polymerase-1 activation by 17beta-estradiol in human breast carcinoma cells through alteration of CYP1A1 and CYP1B1 expression. Chemical Research in Toxicology 21(7):1337–1347.
Lin TM, Rasmussen NT, Moore RW, Albrecht RM, Peterson RE. 2004. 2,3,7,8-tetrachlorodibenzo-p-dioxin inhibits prostatic epithelial bud formation by acting directly on the urogenital sinus. Journal of Urology 172(1):365–368.
Liu J, Singh B, Tallini G, Carlson DL, Katabi N, Shaha A, Tuttle RM, Ghossein RA. 2006. Follicular variant of papillary thyroid carcinoma: A clinicopathologic study of a problematic entity. Cancer 107:1255–1264.
Lo AC, Soliman AS, Khaled HM, Aboelyazid A, Greenson JK. 2010. Lifestyle, occupational, and reproductive factors and risk of colorectal cancer. Diseases of the Colon and Rectum 53(5):830–837.
Lynge E. 1985. A follow-up study of cancer incidence among workers in manufacture of phenoxy herbicides in Denmark. British Journal of Cancer 52(2):259–270.
Lynge E. 1993. Cancer in phenoxy herbicide manufacturing workers in Denmark, 1947–87—An update. Cancer Causes and Control 4(3):261–272.
Mack TM. 1995. Sarcomas and other malignancies of soft tissue, retroperitoneum, peritoneum, pleura, heart, mediastinum, and spleen. Cancer 75(1):211–244.
Magnani C, Coggon D, Osmond C, Acheson ED. 1987. Occupation and five cancers: A case–control study using death certificates. British Journal of Industrial Medicine 44(11):769–776.
Mahan CM, Bullman TA, Kang HK, Selvin S. 1997. A case–control study of lung cancer among Vietnam veterans. Journal of Occupational and Environmental Medicine 39(8):740–747.
Maluf E, Hamerschlak N, Cavalcanti AB, Avezum Júnlor A, Eluf-Neto J, Passetto Falcao R, Lorand-Metze IG, Goldenberg D, Leite Santana C, De Oliveira Werneck Rodrigues D, Nascimento Da Motta Passos L, Mange Rosenfeld LG, Pitta M, Loggetto S, Feitosa Ribeiro AA, Velloso ED, Kondo AT, De Miranda Coelho EO, Tostes Pintao MC, Moraes De Souza H, Borbolla JR, Pasquini R. 2009. Incidence and risk factors of aplastic anemia in Latin American countries: The Latin case–control study. Haematologica 94(9):1220–1226.
Mantovani A, Allavena P, Sica A, Balkwill F. 2008. Cancer-related inflammation. Nature 454:436–444.
Manz A, Berger J, Dwyer JH, Flesch-Janys D, Nagel S, Waltsgott H. 1991. Cancer mortality among workers in chemical plant contaminated with dioxin. Lancet 338(8773):959–964.
Marlowe JL, Fan Y, Chang X, Peng L, Knudsen ES, Xia Y, Puga A. 2008. The aryl hydrocarbon receptor binds to E2F1 and inhibits E2F1-induced apoptosis. Molecular Biology of the Cell 19:3263–3271.
Marur S, D’Souza G, Westra WH, Forastiere AA. 2010. HPV-associated head and neck cancer: A virus-related cancer epidemic. Lancet Oncology 11:781–789.
McBride DI, Collins JJ, Humphry NF, Herbison P, Bodner KM, Aylward LL, Burns CJ, Wilken M. 2009a. Mortality in workers exposed to 2,3,7,8-tetrachlorodibenzo-p-dioxin at a trichlorophenol plant in New Zealand. Journal of Environmental Medicine 51(9):1049–1056.
McBride DI, Burns CJ, Herbison GP, Humphry NF, Bodner K, Collins JJ. 2009b. Mortality in employees at a New Zealand agrochemical manufacturing site. Occupational Medicine 59(4):255–263.
McDuffie HH, Klaassen DJ, Dosman JA. 1990. Is pesticide use related to the risk of primary lung cancer in Saskatchewan? Journal of Occupational Medicine 32(10):996–1002.
McDuffie HH, Pahwa P, McLaughlin JR, Spinelli JJ, Fincham S, Dosman JA, Robson D, Skinnider LF, Choi NW. 2001. Non-Hodgkin’s lymphoma and specific pesticide exposures in men: Cross-Canada study of pesticides and health. Cancer Epidemiology, Biomarkers and Prevention 10(11):1155–1163.
McDuffie HH, Pahwa P, Karunanayake CP, Spinelli JJ, Dosman JA. 2009. Clustering of cancer among families of cases with Hodgkin lymphoma (HL), multiple myeloma (MM), non-Hodgkin’s lymphoma (NHL), soft tissue sarcoma (STS) and control subjects. BMC Cancer 9:70.
McGee SF, Lanigan F, Gilligan E, Groner B. 2006. Mammary gland biology and breast cancer. Conference on Common Molecular Mechanisms of Mammary Gland Development and Breast Cancer Progression. EMBO Reports 7(11):1084–1088.
McLean D, Pearce N, Langseth H, Jäppinen P, Szadkowska-Stanczyk I, Person B, Wild P, Kishi R, Lynge E, Henneberger P, Sala M, Teschke K, Kauppinen T, Colin D, Kogevinas M, Boffetta P. 2006. Cancer mortality in workers exposed to organochlorine compounds in the pulp and paper industry: An international collaborative study. Environmental Health Perspectives 114(7):1007–1012.
Mellemgaard A, Engholm G, McLaughlin JK, Olsen JH. 1994. Occupational risk factors for renal-cell carcinoma in Denmark. Scandinavian Journal of Work, Environment, and Health 20(3):160–165.
Merletti F, Richiardi L, Bertoni F, Ahrens W, Buemi A, Costa-Santos C, Eriksson M, Guenel P, Kaerlev L, Jockel K-H, Llopis-Gonzalez A, Merler E, Miranda A, Morales-Suarez-Varela, MM, Olsson H, Fletcher T, Olsen J. 2006. Occupational factors and risk of adult bone sarcomas: A multicentric case–control study in Europe. International Journal of Cancer 118(3):721–727.
Michalek JE, Pavuk M. 2008. Diabetes and cancer in Veterans of Operation Ranch Hand after adjustment for calendar period, days of sprayings, and time spent in Southeast Asia. Journal of Occupational and Environmental Medicine 50(3):330–340.
Michalek JE, Wolfe WH, Miner JC. 1990. Health status of Air Force veterans occupationally exposed to herbicides in Vietnam. II. Mortality. Journal of the American Medical Association 264(14):1832–1836.
Miligi L, Costantini AS, Bolejack V, Veraldi A, Benvenuti A, Nanni O, Ramazzotti V, Tumino R, Stagnaro E, Rodella S, Fontana A, Vindigni C, Vineis P. 2003. Non-Hodgkin’s lymphoma, leukemia, and exposures in agriculture: Results from the Italian Multicenter Case–Control Study. American Journal of Industrial Medicine 44:627–636.
Miligi L, Costantini AS, Veraldi A, Benvenuti A, WILL, Vineis P. 2006. Cancer and pesticides: An overview and some results of the Italian Multicenter Case–Control Study on hematolymphopoietic malignancies. Annals of the New York Academy of Sciences 1076:366–377.
Miller BA, Kolonel LN, Bernstein L, Young JL Jr, Swanson GM, West D, Key CR, Liff JM, Glover CS, Alexander GA, et al. (eds). 1996. Racial/Ethnic Patterns of Cancer in the United States 1988–1992. Bethesda, MD: National Cancer Institute. NIH Pub. No. 96-4104.
Mills PK, Yang R. 2005. Breast cancer risk in Hispanic agricultural workers in California. International Journal of Occupational and Environmental Health 11(2):123–131.
Mills PK, Yang RC. 2007. Agricultural exposures and gastric cancer risk in Hispanic farm workers in California. Environmental Research 104(2):282–289.
Mills PK, Yang R, Riordan D. 2005. Lymphohematopoietic cancers in the United Farm Workers of America (UFW), 1988–2001. Cancer Causes and Control 16(7):823–830.
Mitchell KA, Lockhart CA, Huang G, Elferink CJ. 2006. Sustained aryl hydrocarbon receptor activity attenuates liver regeneration. Molecular Pharmacology 70(1):163–170.
Morris PD, Koepsell TD, Daling JR, Taylor JW, Lyon JL, Swanson GM, Child M, Weiss NS. 1986. Toxic substance exposure and multiple myeloma: A case–control study. Journal of the National Cancer Institute 76(6):987–994.
Morrison H, Semenciw RM, Morison D, Magwood S, Mao Y. 1992. Brain cancer and farming in western Canada. Neuroepidemiology 11(4-6):267–276.
Morrison H, Savitz D, Semenciw RM, Hulka B, Mao Y, Morison D, Wigle D. 1993. Farming and prostate cancer mortality. American Journal of Epidemiology 137(3):270–280.
Morrison HI, Semenciw RM, Wilkins K, Mao Y, Wigle DT. 1994. Non-Hodgkin’s lymphoma and agricultural practices in the prairie provinces of Canada. Scandinavian Journal of Work, Environment, and Health 20(1):42–47.
Morton LM, Wang SS, Cozen W, Linet MS, Chatterjee N, Davis S, Severson RK, Colt JS, Vasef MA, Rothman N, Blair A, Berstein L, Cross AJ, De Roos AJ, Engels EA, Hein DW, Hill DA, Kelemen LE, Lim U, Lynch CF, Schenk M, Wacholder S, Ward MH, Zahm SH, Chanock SJ, Cerhan JR, Hartge P. 2008. Etiology among non-Hodgkin lymphoma subtypes. Blood 112(13):5150–5160.
Mulero-Navarro S, Carvajal-Gonzalez JM, Herranz M, Ballestar E, Fraga MF, Ropero S, Esteller M, Fernandez-Salguero PM. 2006. The dioxin receptor is silenced by promoter hypermethylation in human acute lymphoblastic leukemia through inhibition of Sp1 binding. Carcinogenesis 27(5):1099–1104.
Musicco M, Sant M, Molinari S, Filippini G, Gatta G, Berrino F. 1988. A case–control study of brain gliomas and occupational exposure to chemical carcinogens: The risks to farmers. American Journal of Epidemiology 128:778–785.
Nanni O, Amadori D, Lugaresi C, Falcini F, Scarpi E, Saragoni A, Buiatti E. 1996. Chronic lymphocytic leukaemias and non-Hodgkin’s lymphomas by histological type in farming-animal breeding workers: A population case–control study based on a priori exposure matrices. Occupational and Environmental Medicine 53(10):652–657.
Nascimento MG, Suzuki S, Wei M, Tiwari A, Arnold LL, Lu X, Le XC, Cohen SM. 2008. Cytotoxicity of combinations of arsenicals on rat urinary bladder urothelial cells in vitro. Toxicology 249(1):69–74.
NCI (National Cancer Institute). 2010. Surveillance, Epidemiology, and End Results (SEER) Incidence and US Mortality Statistics: SEER Incidence—Crude Rates for White/Black/Other 2004–2008. http://www.seer.cancer.gov/canques/incidence.html (accessed May 9, 2011).
Ng C, Janoo-Gilani R, Sipahimalani P, Gallagher R, Gascoyne R, Connors J, Weber J, Lai A, Leach S, Le N, Brooks-Wilson A, Spinelli J. 2010. Interaction between organochlorines and the AHR gene, and risk of non-Hodgkin lymphoma. Cancer Causes and Control 21:11–22.
Nielsen GD, Wolkoff P. 2010. Cancer effects of formaldehyde: A proposal for an indoor air guideline value. Archives of Toxicology 84(6):423–446.
Nikiforov YE. Molecular analysis of thyroid tumors. Modern Pathology (Suppl 2):S34–S43.
Nordby KC, Andersen A, Kristensen P. 2004. Incidence of lip cancer in the male Norwegian agricultural population. Cancer Causes and Control 15(6):619–626.
NTP (National Toxicology Program). 1982a. Technical Report Series No. 209. Carcinogenesis Bioassay of 2,3,7,8-Tetrachlorodibenzo-p-dioxin (CAS No. 1746-01-6) in Osborne-Mendel Rats and B6c3F1 Mice (Gavage Study). NIH Publication No. 82-1765. 195 pp. National Toxicology Program, Research Triangle Park, NC, and Bethesda, MD.
NTP. 1982b. Technical Report Series No. 201. Carcinogenesis Bioassay of 2,3,7,8-Tetrachlorodibenzo-p-dioxin (CAS No. 1746-01-6) in Swiss-Webster Mice (Dermal Study). National Toxicology Program, Research Triangle Park, NC, and Bethesda, MD.
NTP. 2006. NTP Technical Report on the Toxicology and Carcinogenesis Studies of 2,3,7,8-Tetrachlorodibenzo-p-dioxin (TCDD) (CAS No. 1746-01-6) in Female Harlan Sprague-Dawley Rats (Gavage Studies). Issue 521:4–232. National Toxicology Program, Research Triangle Park, NC, and Bethesda, MD.
Nyska A, Jokinen MP, Brix AE, Sells DM, Wyde ME, Orzech D, Haseman JK, Flake G, Walker NJ. 2004. Exocrine pancreatic pathology in female Harlan Sprague-Dawley rats after chronic treatment with 2,3,7,8-tetrachlorodibenzo-p-dioxin and dioxin-like compounds. Environmental Health Perspectives 112(8):903–909.
Nyska A, Yoshizawa K, Jokinen MP, Brix AE, Sells DM, Wyde ME, Orzech DP, Kissling GE, Walker NJ. 2005. Olfactory epithelial metaplasia and hyperplasia in female Harlan Sprague-Dawley rats following chronic treatment with polychlorinated biphenyls. Toxicologic Pathology 33(3):371–377.
O’Brien TR, Decoufle P, Boyle CA.1991. Non-Hodgkin’s lymphoma in a cohort of Vietnam veterans. American Journal of Public Health 81:758–760.
Olsson H, Brandt L. 1988. Risk of non-Hodgkin’s lymphoma among men occupationally exposed to organic solvents. Scandinavian Journal of Work, Environment, and Health 14:246–251.
Orsi L, Delabre L, Monnerau A, Delva P, Berthou C, Fenaux P, Marti G, Soubeyran P, Huguet F, Mipied N, Leporrier M, Hemon D, Troussard X, Clavel J. 2009. Occupational exposure to pesticides and lymphoid neoplasms among men: Results of a French case–control study. Occupational and Environmental Medicine 66(5):291–298.
O’Toole BI, Catts SV, Outram S, Pierse KR, Cockburn J. 2009. The physical and mental health of Australian Vietnam veterans 3 decades after the war and its relation to military service, combat, and post-traumatic stress disorder. American Journal of Epidemiology 170(3):318–330.
Ott MG, Zober A. 1996. Cause specific mortality and cancer incidence among employees exposed to 2,3,7,8-TCDD after a 1953 reactor accident. Occupational and Environmental Medicine 53:606–612.
Pahwa P, McDuffie HH, Dosman JA, McLaughlin JR, Spinelli JJ, Robson D, Fincham S. 2006. Hodgkin lymphoma, multiple myeloma, soft tissue sarcomas, insect repellents, and phenoxyherbicides. Journal of Occupational and Environmental Medicine 48(3):264–274.
Park JY, Shigenaga MK, Ames BN. 1996. Induction of cytochrome P4501A1 by 2,3,7,8-tetrachlorodibenzo-p-dioxin or indolo(3,2-b)carbazole is associated with oxidative DNA damage. Proceedings of the National Academy of Sciences of the United States of America 93(6):2322–2327.
Pavuk M, Michalek JE, Schecter A, Ketchum NS, Akhtar FZ, Fox KA. 2005. Did TCDD exposure or service in Southeast Asia increase the risk of cancer in Air Force Vietnam veterans who did not spray Agent Orange? Journal of Occupational and Environmental Medicine 47(4):335–342.
Pavuk M, Michalek JE, Ketchum NS. 2006. Prostate cancer in US Air Force veterans of the Vietnam War. Journal of Exposure Science and Environmental Epidemiology 16(2):184–190.
Pearce NE, Smith AH, Fisher DO. 1985. Malignant lymphoma and multiple myeloma linked with agricultural occupations in a New Zealand cancer registry-based sudy. American Journal of Epidemiology 121:225–237.
Pearce NE, Smith AH, Howard JK, Sheppard RA, Giles HJ, Teague CA. 1986. Non-Hodgkin’s lymphoma and exposure to phenoxyherbicides, chlorophenols, fencing work, and meat works employment: A case–control study. British Journal of Industrial Medicine 43:75–83.
Pearce NE, Sheppard RA, Smith AH, Teague CA. 1987. Non-Hodgkin’s lymphoma and farming: An expanded case–control study. International Journal of Cancer 39:155–161.
Peng TL, Chen J, Mao W, Liu X, Tao Y, Chen LZ, Chen MH. 2009a. Potential therapeutic significance of increased expression of aryl hydrocarbon receptor in human gastric cancer. World Journal of Gastroenterology 15(14):1719–1729.
Peng TL, Chen J, Mao W, Song X, Chen MH. 2009b. Aryl hydrocarbon receptor pathway activation enhances gastric cancer cell invasiveness likely through a c-Jun-dependent induction of matrix metalloproteinase-9. BMC Cell Biology 10:27.
Percy C, Ries GL, Van Holten VD. 1990. The accuracy of liver cancer as the underlying cause of death on death certificates. Public Health Reports 105:361–368.
Persson B, Dahlander AM, Fredriksson M, Brage HN, Ohlson CG, Axelson O. 1989. Malignant lymphomas and occupational exposures. British Journal of Industrial Medicine 46:516–520.
Persson B, Fredriksson M, Olsen K, Boeryd B, Axelson O. 1993. Some occupational exposures as risk factors for malignant lymphomas. Cancer 72:1773–1778.
Pesatori AC, Consonni D, Tironi A, Landi MT, Zocchetti C, Bertazzi PA. 1992. Cancer morbidity in the Seveso area, 1976–1986. Chemosphere 25:209–212.
Pesatori AC, Baccarelli A, Consonni D, Lania A, Beck-Peccoz P, Bertazzi PA, Spada A. 2008. Aryl hydrocarbon receptor-interacting protein and pituitary adenomas: A population-based study on subjects exposed to dioxin after the Seveso, Italy, accident. European Journal of Endocrinology 159(6):699–703.
Pesatori AC, Consonni D, Rubagotti M, Grillo P, Bertazzi PA. 2009. Cancer incidence in the population exposed to dioxin after the “Seveso accident”: Twenty years of follow-up. Environmental Health 8:1–11.
Piaggi S, Novelli M, Martino L, Masini M, Raggi C, Orciuolo E, Masiello P, Casini A, De Tata V. 2007. Cell death and impairment of glucose-stimulated insulin secretion induced by 2,3,7,8-tetrachlorodibenzo-p-dioxin (TCDD) in the beta-cell line INS-1e. Toxicology and Applied Pharmacology 220(3):333–340.
Pu YS, Yang SM, Huang YK, Chung CJ, Huang SK, Chiu AW, Yang MH, Chen CJ, Hsueh YM. 2007. Urinary arsenic profile affects the risk of urothelial carcinoma even at low arsenic exposure. Toxicology and Applied Pharmacology 218(2):99–106.
Rajkumar SV, Dispenzieri A, Kyle RA. 2006. Monoclonal gammopathy of undetermined significance, Waldenstrom macroglobulinemia, AL amyloidosis, and related plasma cell disorders: Diagnosis and treatment. Mayo Clinic Proceedings 81(5):693–703.
Ramlow JM, Spadacene NW, Hoag SR, Stafford BA, Cartmill JB, Lerner PJ. 1996. Mortality in a cohort of pentachlorophenol manufacturing workers, 1940–1989. American Journal of Industrial Medicine 30:180–194.
Ray S, Swanson HI. 2009. Activation of the aryl hydrocarbon receptor by TCDD inhibits senescence: A tumor promoting event? Biochemical Pharmacology 77(4):681–688.
Read D, Wright C, Weinstein P, Borman B. 2007. Cancer incidence and mortality in a New Zealand community potentially exposed to 2,3,7,8-tetrachlorodibenzo-p-dioxin from 2,4,5-trichlorophenoxyacetic acid manufacture. Australian and New Zealand Journal of Public Health 31(1):13–18.
Reif JS, Pearce N, Fraser J. 1989. Occupational risks of brain cancer: A New Zealand cancer registry-based study. Journal of Occupational Medicine 31(10):863–867.
Revich B, Aksel E, Ushakova T, Ivanova I, Zhuchenko N, Klyuev N, Brodsky B, Sotskov Y. 2001. Dioxin exposure and public health in Chapaevsk, Russia. Chemosphere 43(4-7):951–966.
Reynolds P, Hurley SE, Goldberg DE, Anton-Culver H, Bernstein L, Deapen D, Horn-Ross PL, Peel D, Pinder R, Ross RK, West D, Wright WE, Ziogas A. 2004. Residential proximity to agricultural pesticide use and incidence of breast cancer in the California Teachers Study cohort. Environmental Research 96(2):206–218.
Reynolds P, Hurley SE, Petreas M, Goldberg DE, Smith D, Gilliss D, Mahoney ME, Jeffrey SS. 2005. Adipose levels of dioxins and risk of breast cancer. Cancer Causes and Control 16(5):525–535.
Richardson DB, Terschuren C, Hoffmann W. 2008. Occupational risk factors for non-Hodgkin’s lymphoma: A population-based case–control study in Northern Germany. American Journal of Industrial Medicine 51(4):258–268.
Riedel D, Pottern LM, Blattner WA. 1991. Etiology and epidemiology of multiple myeloma. In: Wiernick PH, Camellos G, Kyle RA, Schiffer CA, eds. Neoplastic Disease of the Blood and Blood Forming Organs. New York: Churchill Livingstone.
Riihimaki V, Asp S, Hernberg S. 1982. Mortality of 2,4-dichlorophenoxyacetic acid and 2,4,5-trichlorophenoxyacetic acid herbicide applicators in Finland: First report of an ongoing prospective cohort study. Scandinavian Journal of Work, Environment, and Health 8:37–42.
Rix BA, Villadsen E, Engholm G, Lynge E. 1998. Hodgkin’s disease, pharyngeal cancer, and soft tissue sarcomas in Danish paper mill workers. Journal of Occupational and Environmental Medicine 40(1):55–62.
Robinson CF, Waxweiler RJ, Fowler DP. 1986. Mortality among production workers in pulp and paper mills. Scandinavian Journal of Work, Environment, and Health 12:552–560.
Ronco G, Costa G, Lynge E. 1992. Cancer risk among Danish and Italian farmers. British Journal of Industrial Medicine 49:220–225.
Roth MJ, Wei WQ, Baer J, Abnet CC, Wang GQ, Sternberg LR, Warner AC, Johnson LL, Lu N, Giffen CA, Dawsey SM, Qiao YL, Cherry J. 2009. Aryl hydrocarbon receptor expression is associated with a family history of upper gastrointestinal tract cancer in a high-risk population exposed to aromatic hydrocarbons. Cancer Epidemiology Biomarkers and Prevention 18(9):2391–2396.
Roulland S, Lebailly P, Lecluse Y, Briand M, Pottier D, Gauduchon P. 2004. Characterization of the t(14;18) BCL2-IGH translocation in farmers occupationally exposed to pesticides. Cancer Research 64(6):2264–2269.
Roulland S, Navarro J-M, Grenot P, Milili M, Agopian J, et al. 2006. Follicular lymphoma-lie B cell in healthy individuals: A novel intermediate step in early lymphomagenesis. The Journal of Experimental Medicine 203(11):2425–2431.
Rowland RE, Edwards LA, Podd JV. 2007. Elevated sister chromatid exchange frequencies in New Zealand Vietnam War veterans. Cytogenetic and Genome Research 116(4):248–251.
Ruder AM, Waters MA, Butler MA, Carreon T, Calvert GM, Davis-King KE, Schulte PA, Sanderson WT, Ward EM, Connally LB, Heineman EF, Mandel JS, Morton RF, Reding DJ, Rosenman KD, Talaska G. 2004. Gliomas and farm pesticide exposure in men: The Upper Midwest Health Study. Archives of Environmental Health 59(12):650–657.
Salehi F, Turner MC, Phillips KP, Wigle DT, Krewski D, Aronson KJ. 2008. Review of the etiology of breast cancer with special attention to organochlorines as potential endocrine disruptors. Journal of Toxicology and Environmental Health—Part B: Critical Reviews 11(3–4):276–300.
Samanic C, Rusiecki J, Dosemeci M, Hou L, Hoppin JA, Sandler DP, Lubin J, Blair A, Alavanja MC. 2006. Cancer incidence among pesticide applicators exposed to dicamba in the Agricultural Health Study. Environmental Health Perspectives 114(10):1521–1526.
Samanic CM, De Roos AJ, Stewart PA, Rajaraman P, Waters MA, Inskip PD. 2008. Occupational exposure to pesticides and risk of adult brain tumors. American Journal of Epidemiology 167(8):976–985.
Saracci R, Kogevinas M, Bertazzi PA, Bueno de Mesquita BH, Coggon D, Green LM, Kauppinen T, L’Abbe KA, Littorin M, Lynge E, Mathews JD, Neuberger M, Osman J, Pearce N, Winkelmann R. 1991. Cancer mortality in workers exposed to chlorophenoxy herbicides and chlorophenols. Lancet 338:1027–1032.
Schlezinger JJ, Liu D, Farago M, Seldin DC, Belguise K, Sonenshein GE, Sherr DH. 2006. A role for the aryl hydrocarbon receptor in mammary gland tumorigenesis. Biological Chemistry 387(9):1175–1187.
Semenciw RM, Morrison HI, Morison D, Mao Y. 1994. Leukemia mortality and farming in the prairie provinces of Canada. Canadian Journal of Public Health 85:208–211.
Senft AP, Dalton TP, Nebert DW, Genter MB, Puga A, Hutchinson RJ, Kerzee JK, Uno S, Shertzer HG. 2002. Mitochondrial reactive oxygen production is dependent on the aromatic hydrocarbon receptor. Free Radical Biology and Medicine 33(9):1268–1278.
Shah SR, Freedland SJ, Aronson WJ, Kane CJ, Presti JC Jr, Amling CL, Terris MK. 2009. Exposure to Agent Orange is a significant predictor of prostate-specific antigen (PSA)-based recurrence and a rapid PSA doubling time after radical prostatectomy. BJU International 103:1168–1172.
Sharma-Wagner S, Chokkalingam AP, Malker HS, Stone BJ, McLaughlin JK, Hsing AW. 2000. Occupation and prostate cancer risk in Sweden. Journal of Occupational and Environmental Medicine 42(5):517–525.
Shertzer HG, Dalton TP, Talaska G, Nebert DW. 2002. Decrease in 4-aminobiphenyl-induced methemoglobinemia in CYP1A2(-/-) knockout mice. Toxicology and Applied Pharmacology 181(1):32–37.
Siemiatycki J, Wacholder S, Dewar R, Wald L, Bégin D, Richardson L, Rosenman K, Gérin M. 1988. Smoking and degree of occupational exposure: Are internal analyses in cohort studies likely to be confounded by smoking status? American Journal of Industrial Medicine 13(1):59–69.
Simanainen U, Haavisto T, Tuomisto JT, Paranko J, Toppari J, Tuomisto J, Peterson RE, Viluksela M. 2004a. Pattern of male reproductive system effects after in utero and lactational 2,3,7,8-tetrachlorodibenzo-p-dioxin (TCDD) exposure in three differentially TCDD-sensitive rat lines. Toxicological Sciences 80(1):101–108.
Simanainen U, Adamsson A, Tuomisto JT, Miettinen HM, Toppari J, Tuomisto J, Viluksela M. 2004b. Adult 2,3,7,8-tetrachlorodibenzo-p-dioxin (TCDD) exposure and effects on male reproductive organs in three differentially TCDD-susceptible rat lines. Toxicological Sciences 81(2):401–407.
Singh NP, Nagarkatti M, Nagarkatti P. 2008. Primary peripheral t cells become susceptible to 2,3,7,8-tetrachlorodibenzo-p-dioxin-mediated apoptosis in vitro upon activation and in the presence of dendritic cells. Molecular Pharmacology 73(6):1722–1735.
Smith AH, Pearce NE. 1986. Update on soft tissue sarcoma and phenoxyherbicides in New Zealand. Chemosphere 15:1795–1798.
Smith AH, Fisher DO, Giles HJ, Pearce NE. 1983. The New Zealand soft tissue sarcoma case–control study: Interview findings concerning phenoxyacetic acid exposure. Chemosphere 12:565–571.
Smith AH, Pearce NE, Fisher DO, Giles HJ, Teague CA, Howard JK. 1984. Soft tissue sarcoma and exposure to phenoxyherbicides and chlorophenols in New Zealand. Journal of the National Cancer Institute 73:1111–1117.
Smith JG, Christophers AJ. 1992. Phenoxy herbicides and chlorophenols: A case control study on soft tissue sarcoma and malignant lymphoma. British Journal of Cancer 65:442–448.
Smith-Warner SA, Spiegelman D, Yaun SS, van den Brandt PA, Folsom AR, Goldbohm RA, Graham S, Holmberg L, Howe GR, Marshall JR, Miller AB, Potter JD, Speizer FE, Willett WC, Wolk A, Hunter DJ. 1998. Alcohol and breast cancer in women: A pooled analysis of cohort studies. Journal of the American Medical Association 279(7):535–540.
Solet D, Zoloth SR, Sullivan C, Jewett J, Michaels DM. 1989. Patterns of mortality in pulp and paper workers. Journal of Occupational Medicine 31:627–630.
Spinelli JJ, Ng CH, Weber JP, Connors JM, Gascoyne RD, Lai AS, Brooks-Wilson AR, Le ND, Berry BR, Gallagher RP. 2007. Organochlorines and risk of non-Hodgkin lymphoma. International Journal of Cancer 121(12):2767–2775.
Steenland K, Piacitelli L, Deddens J, Fingerhut M, Chang LI. 1999. Cancer, heart disease, and diabetes in workers exposed to 2,3,7,8-tetrachlorodibenzo-p-dioxin. Journal of the National Cancer Institute 91(9):779–786.
Stott WT, Johnson KA, Landry TD, Gorzinski SJ, Cieszlak FS. 1990. Chronic toxicity and oncogenicity of picloram in Fischer 344 rats. Journal of Toxicology and Environmental Health 30:91–104.
Svensson BG, Mikoczy Z, Stromberg U, Hagmar L. 1995. Mortality and cancer incidence among Swedish fishermen with a high dietary intake of persistent organochlorine compounds. Scandinavian Journal of Work, Environmental, and Health 21(2):106–115.
Swaen GM, van Vliet C, Slangen JJM, Sturmans F. 1992. Cancer mortality among licensed herbicide applicators. Scandinavian Journal of Work, Environment, and Health 18:201–204.
Swaen GM, van Amelsvoort LG, Slangen JJ, Mohren DC. 2004. Cancer mortality in a cohort of licensed herbicide applicators. International Archives of Occupational and Environmental Health 77(4):293–295.
Szentirmay Z, Polus K, Tamas L, Szentkuti G, Kurcsics J, Csernak E, Toth E, Kasler M. 2005. Human papilomavirus in head and neck cancer: Molecular biology and climicopathological correlations. Cancer Metastasis Review 24:19–34.
’t Mannetje A, McLean D, Cheng S, Boffetta P, Colin D, Pearce N. 2005. Mortality in New Zealand workers exposed to phenoxy herbicides and dioxins. Occupational and Environmental Medicine 62(1):34–40.
Tarone RE, Hayes HM, Hoover RN, Rosenthal JF, Brown LM, Pottern LM, Javadpour N, O’Connell KJ, Stutzman RE. 1991. Service in Vietnam and risk of testicular cancer. Journal of the National Cancer Institute 83:1497–1499.
Teitelbaum SL, Gammon MD, Britton JA, Neugut AI, Levin B, Stellman SD. 2007. Reported residential pesticide use and breast cancer risk on Long Island, New York. American Journal of Epidemiology 165(6):643–651.
Thomas TL. 1987. Mortality among flavour and fragrance chemical plant workers in the United States. British Journal of Industrial Medicine 44:733–737.
Thomas TL, Kang HK. 1990. Mortality and morbidity among Army Chemical Corps Vietnam veterans: A preliminary report. American Journal of Industrial Medicine 18:665–673.
Thomas TL, Kang H, Dalager N. 1991. Mortality among women Vietnam veterans, 1973–1987. American Journal of Epidemiology 134:973–980.
Thompson IM, Goodman PJ, Tangen CM, Lucia MS, Miller GJ, Ford LG, Lieber MM, Cespedes RD, Atkins JN, Lippman SM, Carlin SM, Ryan A, Szczepanek CM, Crowley JJ, Coltman CA Jr. 2003. The influence of finasteride on the development of prostate cancer. New England Journal of Medicine 349(3):215–224.
Thörn Å, Gustavsson P, Sadigh J, Westerlund-Hännerstrand B, Hogstedt C. 2000. Mortality and cancer incidence among Swedish lumberjacks exposed to phenoxy herbicides. Occupational and Environmental Medicine 57:718–720.
Torchio P, Lepore AR, Corrao G, Comba P, Settimi L, Belli S, Magnani C, di Orio F. 1994. Mortality study on a cohort of Italian licensed pesticide users. The Science of the Total Environment 149(3):183–191.
Toth K, Somfai-Relle S, Sugar J, Bence J. 1979. Carcinogenicity testing of herbicide 2,4,5-trichlorophenoxyethanol containing dioxin and of pure dioxin in Swiss mice. Nature 278(5704):548–549.
Tritscher AM, Mahler J, Portier CJ, Lucier GW, Walker NJ. 2000. Induction of lung lesions in female rats following chronic exposure to 2,3,7,8-tetrachlorodibenzo-p-dioxin. Toxicologic Pathology 28(6):761–769.
Tuomisto JT, Pekkanen J, Kiviranta H, Tukiainen E, Vartiainen T, Tuomisto J. 2004. Soft-tissue sarcoma and dioxin: A case–control study. International Journal of Cancer 108(6):893–900.
Turunen AW, Verkasalo PK, Kiviranta H, Pukkala E, Jula A, Mannisto S, Rasanen R, Marniemi J, Vartiainen T. 2008. Mortality in a cohort with high fish consumption. International Journal of Epidemiology 37(5):1008–1017.
van Grevenynghe J, Bernard M, Langouet S, Le Berre C, Fest T, Fardel O. 2005. Human CD34-positive hematopoietic stem cells constitute targets for carcinogenic polycyclic aromatic hydrocarbons. Journal of Pharmacology and Experimental Therapeutics 314(2):693–702.
Van Miller JP, Lalich JJ, Allen JR. 1977. Increased incidence of neoplasms in rats exposed to low levels of 2,3,7,8-tetrachlorodibenzo-p-dioxin. Chemosphere 9:537–544.
Viel JF, Arveux P, Baverel J, Cahn JY. 2000. Soft-tissue sarcoma and non-Hodgkin’s lymphoma clusters around a municipal solid waste incinerator with high dioxin emission levels. American Journal of Epidemiology 152(1):13–19.
Viel JF, Clement MC, Hagi M, Grandjean S, Challier B, Danzon A. 2008. Dioxin emissions from a municipal solid waste incinerator and risk of invasive breast cancer: A population-based case–control study with GIS-derived exposure. International Journal of Health Geographics [Electronic Resource] 7:4.
Villeneuve PJ, Steenland K. 2010. Re: “Mortality rates among trichlorophenol workers with exposure to 2,3,7,8-tetrachlorodibenzo-p-dioxin.” American Journal of Epidemiology 171(1):129–130; author reply 130–131.
Vineis P, Terracini B, Ciccone G, Cignetti A, Colombo E, Donna A, Maffi L, Pisa R, Ricci P, Zanini E, Comba P. 1986. Phenoxy herbicides and soft-tissue sarcomas in female rice weeders. A population-based case-referent study. Scandinavian Journal of Work, Environment, and Health 13:9–17.
Vineis P, Faggiano F, Tedeschi M, Ciccone G. 1991. Incidence rates of lymphomas and soft-tissue sarcomas and environmental measurements of phenoxy herbicides. Journal of the National Cancer Institute 83:362–363.
Visintainer PF, Barone M, McGee H, Peterson EL. 1995. Proportionate mortality study of Vietnam-era veterans of Michigan. Journal of Occupational and Environmental Medicine 37(4):423–428.
Vogel CF, Li W, Sciullo E, Newman J, Hammock B, Reader JR, Tuscano J, Matsumura F. 2007. Pathogenesis of aryl hydrocarbon receptor-mediated development of lymphoma is associated with increased cyclooxygenase-2 expression. American Journal of Pathology 171(5):1538–1548.
Vorderstrasse BA, Fenton SE, Bohn AA, Cundiff JA, Lawrence BP. 2004. A novel effect of dioxin: Exposure during pregnancy severely impairs mammary gland differentiation. Toxicological Sciences 78(2):248–257.
Walker NJ, Wyde ME, Fischer LJ, Nyska A, Bucher JR. 2006. Comparison of chronic toxicity and carcinogenicity of 2,3,7,8-tetrachlorodibenzo-p-dioxin (TCDD) in 2-year bioassays in female Sprague-Dawley rats. Molecular Nutrition and Food Research 50(10):934–944.
Walker NJ, Yoshizawa K, Miller RA, Brix AE, Sells DM, Jokinen MP, Wyde ME, Easterling M, Nyska A. 2007. Pulmonary lesions in female Harlan Sprague-Dawley rats following two-year oral treatment with dioxin-like compounds. Toxicologic Pathology 35(7):880–889.
Wang A, Kligerman AD, Holladay SD, Wolf DC, Robertson JL. 2009. Arsenate and dimethylarsinic acid in drinking water did not affect DNA damage repair in urinary bladder transitional cells or micronuclei in bone marrow. Environmental and Molecular Mutagenesis 50(9):760–770.
Wang SL, Chang YC, Chao HR, Li CM, Li LA, Lin LY, Papke O. 2006. Body burdens of polychlorinated dibenzo-p-dioxins, dibenzofurans, and biphenyls and their relations to estrogen metabolism in pregnant women. Environmental Health Perspectives 114(5):740–745.
Wang SS, Nieters A. 2010. Unraveling the interactions between environmental factors and genetic polymorphisms in non-Hodgkin lymphoma risk. Expert Reviews in Anticancer Therapy 10(3):403–413.
Wanibuchi H, Salim E, Kinoshita A, Shen J, Wei M, Morimura K, Yoshida K, Kuroda K, Endo G, Fukushima S. 2004. Understanding arsenic carcinogenicity by the use of animal models. Toxicology and Applied Pharmacology 198(3):366–376.
Warner M, Eskenazi B, Mocarelli P, Gerthoux PM, Samuels S, Needham L, Patterson D, Brambilla P. 2002. Serum dioxin concentrations and breast cancer risk in the Seveso Women’s Health Study. Environmental Health Perspectives 110(7):625–628.
Watanabe KK, Kang HK. 1995. Military service in Vietnam and the risk of death from trauma and selected cancers. Annals of Epidemiology 5:407–412.
Watanabe KK, Kang HK. 1996. Mortality patterns among Vietnam veterans: A 24-year retrospective analysis. Journal of Occupational and Environmental Medicine 38(3):272–278.
Watanabe KK, Kang HK, Thomas TL. 1991. Mortality among Vietnam veterans: With methodological considerations. Journal of Occupational Medicine 33:780–785.
Waterhouse D, Carman WJ, Schottenfeld D, Gridley G, McLean S. 1996. Cancer incidence in the rural community of Tecumseh, Michigan: A pattern of increased lymphopoietic neoplasms. Cancer 77(4):763–770.
Wei M, Wanibuchi H, Morimura K, Iwai S, Yoshida K, Endo G, Nakae D, Fukushima S. 2002. Carcinogenicity of dimethylarsinic acid in make F344 rats and genetic alterations in incuded urinary bladder tumors. Carcinogenesis 23(8):1387–1397.
Weiderpass E, Adami HO, Baron JA, Wicklund-Glynn A, Aune M, Atuma S, Persson I. 2000. Organochlorines and endometrial cancer risk. Cancer Epidemiology, Biomarkers and Prevention 9:487–493.
Weinberg RA. 2008. Twisted epithelial-mesenchymal transition blocks senescence. Nature Cell Biology 10(9):1021–1023.
Weiss C, Faust D, Schreck I, Ruff A, Farwerck T, Melenberg A, Schneider S, Oesch-Bartlomowicz B, Zatloukalova J, Vondracek J, Oesch F, Dietrich C. 2008. TCDD deregulates contact inhibition in rat liver oval cells via AH receptor, junD and cyclin A. Oncogene 27(15):2198–2207.
Wen S, Yang FX, Gong Y, Zhang XL, Hui Y, Li JG, Liu AIL, Wu YN, Lu WQ, Xu Y. 2008. Elevated levels of urinary 8-hydroxy-2’-deoxyguanosine in male electrical and electronic equipment dismantling workers exposed to high concentrations of polychlorinated dibenzo-p-dioxins and dibenzofurans, polybrominated diphenyl ethers, and polychlorinated biphenyls. Environmental Science and Technology 42(11):4202–4207.
WHO (World Health Organization). 2008. WHO Classification of Tumours of Haematopoietic and Lymphoid Tissue (4th edition). Lyon, France: World Health Organization.
Wigle DT, Semenciw RB, Wilkins K, Riedel D, Ritter L, Morrison HI, Mao Y. 1990. Mortality study of Canadian male farm operators: Non-Hodgkin’s lymphoma mortality and agricultural practices in Saskatchewan. Journal of the National Cancer Institute 82:575–582.
Wiklund K. 1983. Swedish agricultural workers: A group with a decreased risk of cancer. Cancer 51:566–568.
Wiklund K, Lindefors BM, Holm LE. 1988. Risk of malignant lymphoma in Swedish agricultural and forestry workers. British Journal of Industrial Medicine 45:19–24.
Wiklund K, Dich J, Holm LE, Eklund G. 1989a. Risk of cancer in pesticide applicators in Swedish agriculture. British Journal of Industrial Medicine 46:809–814.
Wiklund K, Dich J, Holm LE. 1989b. Risk of soft tissue sarcoma, Hodgkin’s disease and non-Hodgkin’s lymphoma among Swedish licensed pesticide applicators. Chemosphere 18:395–400.
Wolfe WH, Michalek JE, Miner JC, Rahe A, Silva J, Thomas WF, Grubbs WD, Lustik MB, Karrison TG, Roegner RH, Williams DE. 1990. Health status of Air Force veterans occupationally exposed to herbicides in Vietnam. I. Physical health. Journal of the American Medical Association 264:1824–1831.
Wolff MS, Camann D, Gammon M, Stellman SD. 1997. Proposed PCB congener groupings for epidemiological studies. Environmental Health Perspectives 105(1):13–14.
Woods JS, Polissar L, Severson RK, Heuser LS, Kulander BG. 1987. Soft tissue sarcoma and non-Hodgkin’s lymphoma in relation to phenoxy herbicide and chlorinated phenol exposure in western Washington. Journal of the National Cancer Institute 78:899–910.
Wrensch M, Minn Y, Chew T, Bondy M, Berger MS. 2002. Epidemiology of primary brain tumors: Current concepts and review of the literature. Neuro-Oncology 4(4):278–299.
Wyde ME, Braen AP, Hejtmancik M, Johnson JD, Toft JD, Blake JC, Cooper SD, Mahler J, Vallant M, Bucher JR, Walker NJ. 2004. Oral and dermal exposure to 2,3,7,8-tetrachlorodibenzo-p-dioxin (TCDD) induces cutaneous papillomas and squamous cell carcinomas in female hemizygous Tg. AC transgenic mice. Toxicological Sciences 82(1):34–45.
Xu JX, Hoshida Y, Yang WI, Inohara H, Kubo T, Kim GE, Yoon JH, Kojya S, Bandoh N, Harabuchi Y, Tsutsumi K, Koizuka I, Jia XS, Kirihata M, Tsukuma H, Aozasa K. 2006. Life-style and environmental factors in the development of nasal NK/T-cell lymphoma: A case–control study in East Asia. International Journal of Cancer 120(2):406–410.
Yamamoto S, Konishi Y, Matsuda T, Murai T, Shibata MA, Matsui-Yuasa I, Otani S, Kuroda K, Endo G, Fukushima S. 1995. Cancer incidence by an organic arsenic compound, dimethylarsinic acid (cacodylic acid), in F344/DuCrj rats after pretreatment with five carginogens. Cancer Research 55(6):1271–1276.
Yamanaka K, Ohtsubo K, Hasegawa A, Hayashi H, Ohji H, Kanisawa M, Okada S. 1996. Exposure to dimethylarsinic acid, a main metabolite of inorganic arsenics, strongly promotes tumorigenesis initiated by 4-nitroquinoline 1-oxide in the lungs of mice. Carcinogenesis 17(4):767–770.
Yang X, Solomon S, Fraser LR, Trombino AF, Liu D, Sonenshein GE, Hestermann EV, Sherr DH. 2008. Constitutive regulation of CYP1B1 by the aryl hydrocarbon receptor (AhR) in pre-malignant and malignant mammary tissue. Journal of Cellular Biochemistry 104(2):402–417.
Yoshizawa K, Walker NJ, Jokinen MP, Brix AE, Sells DM, Marsh T, Wyde ME, Orzech D, Haseman JK, Nyska A. 2005a. Gingival carcinogenicity in female Harlan Sprague-Dawley rats following two-year oral treatment with 2,3,7,8-tetrachlorodibenzo-p-dioxin and dioxin-like compounds. Toxicological Sciences 83(1):64–77. [erratum appears in Toxicological Sciences 2005; 83(2):405–406].
Yoshizawa K, Marsh T, Foley JF, Cai B, Peddada S, Walker NJ, Nyska A. 2005b. Mechanisms of exocrine pancreatic toxicity induced by oral treatment with 2,3,7,8-tetrachlorodibenzo-p-dioxin in female Harlan Sprague-Dawley rats. Toxicological Sciences 85(1):594–606.
Yoshizawa K, Heatherly A, Malarkey DE, Walker NJ, Nyska A. 2007. A critical comparison of murine pathology and epidemiological data of TCDD, PCB126, and PeCDF. Toxicologic Pathology 35(7):865–879.
Yoshizawa K, Brix AE, Sells DM, Jokinen MP, Wyde M, Orzech DP, Kissling GE, Walker NJ, Nyska A. 2009. Reproductive lesions in female Harlan Sprague-Dawley rats following two-year oral treatment with dioxin and dioxin-like compounds. Toxicologic Pathology 37(7):921–937.
Zack JA, Suskind RR. 1980. The mortality experience of workers exposed to tetrachlorodibenzodioxin in a trichlorophenol process accident. Journal of Occupational Medicine 22:11–14.
Zahm SH, Fraumeni JF Jr. 1997. The epidemiology of soft tissue sarcoma. Seminars in Oncology 24(5):504–514.
Zahm SH, Weisenburger DD, Babbitt PA, Saal RC, Vaught JB, Cantor KP, Blair A. 1990. A case– control study of non-Hodgkin’s lymphoma and the herbicide 2,4-dichlorophenoxyacetic acid (2,4-D) in eastern Nebraska. Epidemiology 1:349–356.
Zahm SH, Blair A, Weisenburger DD. 1992. Sex differences in the risk of multiple myeloma associated with agriculture. British Journal of Industrial Medicine 49:815–816.
Zahm SH, Weisenburger DD, Saal RC, Vaught JB, Babbitt PA, Blair A. 1993. The role of agricultural pesticide use in the development of non-Hodgkin’s lymphoma in women. Archives of Environmental Health 48:353–358.
Zambon P, Ricci P, Bovo E, Casula A, Gattolin M, Fiore AR, Chiosi F, Guzzinati S. 2007. Sarcoma risk and dioxin emissions from incinerators and industrial plants: A population-based case– control study (Italy). Environmental Health: A Global Access Science Source 6:19.
Zhong Y, Rafnsson V. 1996. Cancer incidence among Icelandic pesticide users. International Journal of Epidemiology 25(6):1117–1124.
Zober A, Messerer P, Huber P. 1990. Thirty-four-year mortality follow-up of BASF employees exposed to 2,3,7,8-TCDD after the 1953 accident. International Archives of Occupational and Environmental Health 62:139–157.


