
4
Consumers’ Use of Nutrition Information and Product Choices
Chronic diseases, such as heart disease, cancer, stroke, and diabetes, are among the leading causes of death in the United States, accounting for at least 6 out of every 10 deaths each year (Kochanek et al., 2011) and placing a substantial burden on the nation’s healthcare spending (Schoenberg et al., 2007; Vogeli et al., 2007; Cunningham, 2009). The literature on epidemiological, clinical, and laboratory studies linking behavioral risk factors and mortality suggests that poor diet and lack of physical activity are strongly associated with mortality and may soon replace tobacco as a leading cause of death (Mokdad et al., 2004). Poor dietary practices include excess energy intake (Wright et al., 2004), high intakes of saturated fat and sodium (USDA, 2008), and low intakes of fruits, vegetables, and fiber (Serdula et al. 2004; Guenther et al., 2006). Because many risk factors that contribute to the development of chronic diseases, such as poor diet and physical inactivity, are preventable (USDA, 2010b), federal and state agencies have undertaken several initiatives to educate the public about nutrition and health, with the objectives of preventing disease and promoting health. Underlying these efforts is the rationale that an educated public will select healthier diets to reduce the likelihood of premature onset of diet-related chronic disease. This chapter reviews evidence on consumer food choice and barriers to using front-of-package (FOP) nutrition rating systems and symbols, as well as approaches to developing FOP systems by food manufacturers as well as by the U.S. Food and Drug Administration (FDA) of the U.S. Department of Health and Human Services (HHS). This chapter discusses the recent proliferation of FOP systems and the impact that multiple types of systems has had on consumer food choice and purchasing decisions. Finally, this chapter concludes by drawing on lessons learned from existing FOP nutrition rating systems and how they can be applied to the development of a more effective system.
PROVISION OF NUTRITION INFORMATION AT THE POINT OF PURCHASE
Since the passage of the Nutrition Labeling and Education Act (NLEA) in 1990, nutrition labeling has become an important policy tool to provide consumers with nutrition information that will assist them in making nutritionally appropriate food choices and in maintaining sound dietary practices.1 The cornerstone of labeling regulations under the NLEA’s mandate is the Nutrition Facts panel (NFP), an important source of nutrition information that almost all packaged food products are required to carry. By providing information about the nutritional attributes
![]()
1 Nutrition Labeling and Education Act of 1990. Public Law 101-535, 104 Stat 2353.
of a food in a credible, distinctive, standardized, and easy-to-read format at the point of purchase, the NFP was anticipated to help consumers choose healthier and more nutritious diets (Guthrie et al., 1995).
The committee identified several studies suggesting a correlation between reading the NFP and engaging in desired behaviors. Kreuter et al. (1997), for example, showed that label readers have diets that are higher in fruit, vegetables, and fiber and lower in fat compared to non-label readers. Moreover, among label readers, those with lower fat diets report looking for fat information more often than those with higher fat diets. Similarly, those with higher fiber diets report looking for fiber information more often than those with lower fiber diets. Similar results have been reported by other studies (Kim et al., 2000; Lin and Lee, 2003; Macon et al., 2004; Satia et al., 2005; Neuhauser et al., 2007). It has also been shown that label users have diets that are lower in cholesterol relative to non-users (Guthrie et al., 1995). In a review of existing evidence, Kim et al. (2000) concluded that food labels are indeed useful tools for individuals to make healthier food choices, resulting in better health outcomes. The committee noted, however, that the studies employed correlative data, which cannot be used to demonstrate a cause-and-effect relationship between label use and food intake. In particular, because the studies did not account for selection bias, unobserved individual difference variables might have affected both label use and food intake. For example, using a quasi-experimental approach to control for unobserved selection effects, Variyam (2008) found that label use has only a modest association with diet quality. In contrast to Kim et al. (2000), this study found no evidence that label use is associated with a lower intake of total fat, saturated fat, or cholesterol.
The NFP provides a lot of detailed nutrition information that is likely to be crucial for individuals with dietary restrictions due to health conditions such as diabetes, hypertension, heart disease, etc. In fact, label readers frequently reported using nutrition labels for the purposes of avoiding certain nutrients and assessing the nutrition profile (Cowburn and Stockley, 2005). More generally, research on nutrition labeling showed that consumers report high levels of label use. However, studies that employed verbal protocols (as opposed to self-reports) showed that consumers simply look at the NFP without processing the information (Higginson et al., 2002; Cowburn and Stockley, 2005).
A necessary precondition for the NFP’s effectiveness is that consumers use and comprehend the information on food labels. Evidence reviewed by the committee, however, revealed that actual label use is much less than what is reported, and that consumers are often confused by the information on the food label and have difficulty understanding serving sizes (Cowburn and Stockley, 2005). Systematic reviews of studies conducted in the European Union (Grunert and Wills, 2007; Wills et al., 2009) and in Australia and New Zealand (Mhurchu and Gorton, 2007) reached the same conclusions.
Taken together, these studies suggest that consumers may have difficulty understanding the role of various nutrients and may not interpret the information from the perspective of how nutrients in foods may impact their daily diet. The literature offers a number of reasons for why nutrition labels are not used by consumers, including lack of time (Barreiro-Hurle et al., 2010), difficulty with the presentation of information, and lack of understanding of food label information (Cowburn and Stockley, 2005). In addition, consumers may not understand which nutrients are important, attending solely to fat or calorie information (Higginson et al., 2002). A study by Cowburn and Stockley (2005) indicated that consumers use numerical information on labels to perform simple calculations, but their ability to accurately interpret the label declines as the complexity of the task increases, especially consumers with lower levels of educational attainment.
The Role of Consumer Education Campaigns
Nutrition labeling alone is likely to offer limited success as a strategy to improve the population’s dietary health. Poor nutrition knowledge may reduce the ability of some consumers to interpret and use the nutrition information provided. When the NLEA was implemented, the federal government, along with other public- and private-sector groups, initiated a major multi-year education campaign to help consumers use the new label (Kulakow, 1995). The goal was to educate consumers about the availability of nutrition information on the food label and about the importance of using that information to maintain healthy dietary practices. However, the campaign stopped after the initial years, and nutrition labeling efforts have not been supplemented by other education strategies, which has resulted in adverse consequences for consumer use of the NFP.
A study by Todd and Variyam (2008) showed that label use declined between 1995-1996 and 2005-2006 for all population groups, particularly among consumers aged 20-29 years and new residents of the country, who likely did not benefit from the public awareness and education campaigns that occurred when the new labels were introduced. Even for the other groups, some depreciation in the value or salience of the information could have occurred, which highlights the need for new campaigns.
The importance of public education as a supplement to regulation was reinforced when trans fat was added as a mandatory NFP declaration in 2006. Kozup et al. (2006) stated that without education efforts to increase consumer understanding of trans fat levels, the new requirement’s effects would be limited. However, FDA had little funding for education, and the resulting education gap hindered at-risk consumers’ ability to correctly interpret trans fat levels in terms of their daily diet. Howlett et al. (2008) noted, “[M]aximizing the effectiveness of incremental additions to the panel depends on a coordinated attempt at educating consumers about the dangers and levels of a high-trans fat diet.” However, funding for public education efforts to accompany the labeling regulation has been almost nonexistent.
Barriers to Nutrition Label Use
There are a number of barriers to consumers’ use of nutrition labels. First, a lack of nutrition knowledge is a major barrier to effective use of the NFP (Barreiro-Hurle et al., 2010) and may actually lower the motivation of some consumers to use the nutrition information on the food label. In real-world purchase situations, when consumers are pressed for time, the motivation to process and use nutrition information is even more adversely affected (Grunert and Wills, 2007). This finding has led some investigators to conclude that restrictions in the amount of time consumers’ have to process nutrition information on the food label limits its effectiveness (Berning et al., 2010).
Other studies reported that some racial groups, e.g., African-Americans, Asians, and Hispanics, are less likely than Whites to use and understand nutrition labels (Lang et al., 2000; Sullivan, 2003; Satia et al., 2005), primarily because of lack of time to read labels and lack of understanding of the nutrition information. Low numeracy and literacy skills have also been identified as factors related to poorer understanding of food labels, even after adjusting for age, gender, education, race, and income (Rothman et al., 2006). A estimated 90 million U.S. adults have literacy and numeracy skills that are inadequate to function in the current health care environment, so this is not a trivial problem (IOM, 2004). Adults with low health literacy skills are less inclined to use nutrition labels and are at greater risk for diet-related health outcomes. Therefore, the nutrition label is not serving the needs of those who would benefit most from it.
These findings have led to calls to improve nutrition labeling at the point of purchase to encourage selection of healthier products by consumers (Rothman et al., 2006). Researchers have suggested that interpretational aids that make the nutrition label easier to use and enhance the ability to compare products may help consumers better understand how a food product fits into their overall diet (Vishwanathan and Hastak, 2002; Cowburn and Stockley, 2005). A recent systematic review of 58 studies conducted in the European Union showed that consumers favor simplified information on the front of the package that supplements the more complex nutrition table on the back (Grunert and Wills, 2007) for the following reasons: (1) they generally do not have time to process detailed nutrition information; and (2) they lack the cognitive skills needed to use the nutrition information to compare products and interpret the nutrients in the context of their total diet.
In the supermarket shopping environment, consumers often have limited time to process nutrition information, so they do so in a cursory manner (Higginson et al., 2002). Time constraints highlight the need for a simplified FOP label that summarizes key aspects of the nutritional profile, is relevant to consumer concerns about diet-related chronic disease risk, and facilitates product comparisons and healthier food choices. Moreover, understanding such a label would not require substantial nutritional knowledge, time, and cognitive effort to process, compared to the NFP, for example. Such a nutrition rating system would be most effective in the supermarket, where consumers make quick purchasing decisions and must choose from a wide array of products.
SIMPLIFYING CONSUMER DECISIONS WITH
FRONT-OF-PACKAGE NUTRITION INFORMATION LABELS
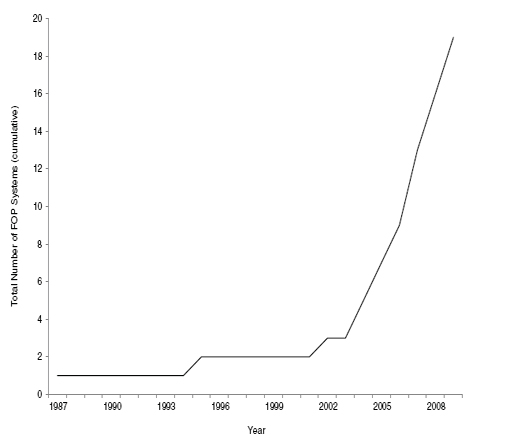
During the past three decades, there has been substantial growth in the number of FOP symbols and rating systems designed to summarize the nutritional profiles of food products. All of these systems attempt to make the nutrition information on packages easier to understand and thereby simplify the decision-making process. They utilize a range of strategies—from simple symbols to more complex and detailed information on key nutrients in an easier-to-use format than the NFP. They have been developed by food manufacturers and retailers, governments and nonprofit organizations, industry consortia, and non-industry experts (IOM, 2010). Manufacturers placed their rating systems on the front of the food package; food retailers placed them on their own store brands or on grocery store shelves and display cases. The Phase I report provided a timeline for the development of these FOP systems (IOM, 2010; Chapter 3). Figure 4-1 depicts the proliferation of FOP nutrition rating systems over the past three decades.
The first FOP nutrition rating systems to appear (during the late 1980s and early 1990s) were largely developed by nonprofit organizations. In 1987 the American Heart Association (AHA) created the Heart Guide symbol to signal to the consumer that a food was “heart friendly.” The Keyhole symbol was developed in Sweden in 1989, and then expanded to Denmark and Norway. In 1995 the AHA developed a new version of its FOP system, the Heart Check program. The Canadian Heart and Stroke Foundation created the Health Check program in 1999. All
these programs used a single symbol that appeared on qualifying products. At that time, food manufacturers were not yet involved in the creation of these programs or in the development of the criteria used by them.
Since 2004 the food industry has attempted to respond to the growing consumer interest in nutrition and to increase the visibility of FDA-approved health and nutrition claims in product packaging and marketing (Kunkel and McKinley, 2007). Manufacturers and retailers developed FOP nutrition rating systems to provide consumers with easy-to-use summaries of the nutrition profile of the product and thereby help them make healthier choices. For example, in 2002 Wegman’s supermarkets developed a series of symbols based on FDA and U.S. Department of Agriculture (USDA) nutrient content and health claims that were featured only on the store brand products, effectively differentiating the store brand from competing brands. From 2002 to 2007 other manufacturers, e.g., Kraft, General Mills, Unilever, Kellogg’s, and PepsiCo, developed their own FOP systems with the goal of directing consumers to their healthier food products.
In 2006 the UK Food Standards Agency (FSA) recommended that UK food manufacturers and retailers place traffic light (TL) labels on the front of food packages to help consumers to make healthier food choices. The labeling format consists of four, separate, color-coded lights indicating the level of fat, saturated fat, sugar, and sodium in the product. Reflecting criteria determined by FSA, a red light indicates a high level of a specified nutrient, an amber light indicates a medium level, and a green light indicates a low level.
In 2006 algorithm-based summary symbols were introduced into the marketplace. Hannaford Supermarkets’ Guiding Stars system uses a proprietary algorithm; based on both positive and negative nutrients, it gives ratings of zero to three stars, which are displayed on shelf tags, to foods that meet the minimum nutrient standards. The NuVal Nutrition scoring system, introduced in 2007, is also based on a proprietary algorithm that considers and weights both positive and negative nutrients, and presents the final score as a number between 1 and 100.
In 2008 ConAgra introduced the Start Making Choices program, an FOP nutrition rating system based on USDA’s MyPyramid, which illustrates the contribution of various food groups to a healthier diet. Also in 2008 a consortium of industry, public health, and academic nutrition leaders developed the Smart Choice program, a summary indicator system. In 2009 the retailer Giant Food introduced the Healthy Ideas program in its Giant and Stop & Shop stores.
In January 2011 America’s leading food and beverage manufacturers and retailers announced the launch of a new system, Nutrition Keys,2 which summarizes important nutrition information (calories, saturated fat, sodium, and total sugars content) on the front of food packages. For some products, the Nutrition Keys icon also displays information about “nutrients to encourage,” such as potassium, fiber, vitamin A, vitamin C, vitamin D, calcium, iron, and protein.
In summary, FOP nutrition rating systems and symbols have proliferated since the AHA created the Heart Guide symbol in 1987. The Phase I committee reviewed 20 systems that were representative of systems that had been introduced into the marketplace. They fall into three categories: (1) nutrient-specific systems, (2) summary indicator systems, and (3) food group information systems (IOM, 2010; Chapter 6). Although the systems use different criteria to rate foods, their primary goal is to provide consumers with easy-to-use information that enables them to quickly determine if a food is a healthy choice and to compare foods within a category. Some systems, particularly within the food group information category, were found to be more helpful in enabling consumers to make healthier food choices.
Consumer Research Underpinning the Development of Front-of-Package Systems
As part of its exploratory research into the background of FOP systems, the Phase I committee contacted several FOP system developers, with the goal of better understanding the (1) rationale behind the FOP systems; (2) benefits that the FOP systems have provided to consumers; (3) consumer research that preceded and followed introduction of the FOP systems; and (4) outcomes of these FOP systems. The Phase I committee also conducted telephone interviews with several representatives from nongovernmental organizations and the food industry. One of the themes to emerge from these interviews was that food manufacturers were responding to consumer inter-
![]()
2 Now called “Facts up Front.”
est in information. In addition, food manufacturers worked from the hypothesis that consumers shop under time constraints, and, therefore, designed their FOP nutrition rating systems to provide consumers with information that they considered to be easily identifiable, accessible, and relevant to making healthier food choices.
The telephone interviews also revealed that most FOP system developers conducted qualitative and quantitative research to test various versions before choosing the FOP system that performed best with consumers. Importantly, however, most did not test their systems with non-English speaking or with low health literacy populations. Moreover, they did not conduct follow-up research to determine whether the FOP systems were being used by those segments of the consumer population. Regardless of the benefits or limitations of individual FOP nutrition rating systems, spokespersons for the industry groups and other organizations believed that the type of system they developed offered the greatest benefit to the consumer. Developers of summary indicator systems focused on the simplicity of their systems when making comparisons, while developers of nutrient-specific systems considered fact-based systems to be superior to symbol-based systems. In contrast, developers of food group information systems asserted that their type of system was best designed to help consumers eat a more balanced diet by making it easier to track consumption of specific food groups.
Consumer Confusion from Divergent Front-of-Package Systems
FOP systems were developed with the goal of making it easier for consumers to assess information on the nutritional qualities of a food and thereby facilitate healthier choices. However, in the absence of any consistent guiding standards, the outcome has been a proliferation of systems based on varying underlying criteria. The report Food Marketing to Children and Youth (IOM, 2006) expressed concern about the likelihood of consumer confusion surrounding the variety of food rating approaches and recommended that FDA issue guidance on the future development of FOP labeling and grocery shelf signage systems. Public interest groups have also called on FDA to develop standards to ensure more consistency across the various voluntary rating approaches, or to mandate the use of a standard nutrition rating system.
Studies conducted in countries outside the United States provide support for the argument that multiple rating systems actually confuse the consumer. A review of studies from Australia and New Zealand, for example, concluded that multiple labeling systems are likely to cause rather than alleviate consumer confusion (Mhurchu and Gorton, 2007). Research conducted in the United Kingdom also suggested that the presence of multiple FOP systems causes problems for consumers trying to interpret nutrition information from a label (Clegg and Lawless, 2008; Malam et al., 2009) and called for further research on this topic. In 2009, a study conducted for the UK Food Standards Agency examined how the existence of a range of FOP label formats impacts accurate interpretation of FOP labels. Results showed that the coexistence of various FOP labels makes it more difficult and time consuming for consumers to understand the labels and compare products. This report concluded that a standardized FOP labeling system would enhance consumer comprehension and use of FOP labels (BMRB, 2009).
FDA shared with the committee information resulting from activities they conducted to improve understanding of consumer response to FOP nutrition rating systems, including a request for comment, information, and data on FOP labeling.3 In the committee’s judgment, FOP labeling or corresponding shelf labeling concerning the nutritional attributes of a food product can be an effective way to promote healthier choices and to help consumers to make food choices that are more consistent with the recommendations of the Dietary Guidelines for Americans. In its analysis of evidence the committee considered FDA’s appraisal that an FOP or shelf labeling system that is consistent with the NFP responds to the needs of the market and provides usable nutrition information at the point of purchase. FDA strongly believes that “the criteria and symbols used in FOP and shelf-labeling systems be nutritionally sound, well-designed to help consumers make informed and healthy food choices, and not be false
![]()
3 75 FR 22602.
or misleading.”4 Finally, FDA expressed concern that the proliferation of competing FOP symbols and systems could result in consumer confusion and thus be counterproductive.
LIMITATIONS TO A COGNITIVE APPROACH TO FOP SYMBOL SYSTEMS
Over the past several decades, the chief policy response to the problem of poor dietary intake patterns has been to increase access to information to encourage people to eat a more healthful diet; the NFP and the Dietary Guidelines for Americans are examples of such efforts. Many of these nutritional strategies have adopted a “cognitive” approach (Petty et al., 2002), which assumes that the consumer is highly motivated to eat a healthful diet and that access to nutrition information is the main barrier to dietary improvement. Hence, policy initiatives have focused on providing information to increase consumers’ nutrition knowledge, with the expectation that this will lead them to select healthier diets.
The results of such an approach have been mixed. On the one hand, there is evidence that some aspects of the American diet have improved during this period. For example, the percentage of calories from total and saturated fat has decreased (CDC, 2004), suggesting that the cognitive approach of providing more information has been somewhat successful. However, during the same period, the average calorie intake has increased significantly (CDC, 2004), and the sodium intake exceeds the maximum level established by the 2005 Dietary Guidelines (IOM, 2010). In addition, further improvements are needed even for many dietary aspects that have moved in the desired direction since the 1970s. An examination of some of the factors underlying food choice provides insights into the reasons why simply increasing access to information may have only a limited association with dietary improvement in the population.
“Nutrition knowledge” is only one of the many environmental and individual variables that can affect an individual’s food choices (Worsley, 2002). In addition to nutrition, taste, cost, and convenience are also significant predictors of an individual’s food choices. Additionally, different population subgroups can vary in terms of the importance placed on each of these factors (Glanz et al., 1998; French et al., 1999). For example, individuals in lower socioeconomic groups and those living in areas without access to a variety of foods may place greater importance on the availability and cost of food, whereas those who have fewer resource constraints may place greater importance on the nutritional quality of foods. However, in general, the majority of studies indicate that taste is a stronger predictor of food choice than health and nutrition; and consumers are most likely to choose foods that they consider tasty (Aikman et al., 2006; Drichoutis et al., 2006). Additionally, cost may outweigh nutrition in times of economic hardship, especially for consumers with limited resources. In other words, they may choose the tastier and cheaper, but less nutritious, food, even though they are knowledgeable about healthy food choices. This finding is consistent with research by Darmon at al. (2002), who showed that when food selection is constrained by economic considerations, healthy eating patterns will necessarily be compromised.
In light of this evidence, it is not surprising that the cognitive approach of providing more information about the nutrition characteristics of a food has not been consistently effective across consumer groups (Baltas, 2001). As discussed above, certain factors might compromise consumers’ ability to use nutrition information in food selection, assuming that they are motivated to do so. But motivation is crucial, for without it, nutrition knowledge has minimal impact on consumers’ food choice and purchasing decisions. Also as discussed above, nutrition information on food labels is more likely to be read by consumers who are motivated by health concerns, so the label may indeed assist this group in making healthier food choices. In contrast, cognitive approaches are unlikely to motivate the use of nutrition information on the food label by consumers who find the label difficult to understand. This is precisely the group that might benefit from an effective FOP system and whose needs are not being served by the NFP. However, the committee recognizes that any FOP system is likely to have a narrow influence on the food purchase decisions of consumers whose access or resources to purchase healthier foods are impacted by economic and/or geographic limitations.
![]()
4 Available online: http://www.fda.gov/Food/GuidanceComplianceRegulatoryInformation/GuidanceDocuments/FoodLabelingNutrition/ucm187208.htm (accessed May 23, 2011).
Findings
For the past 20 years, food labels have provided nutrition information through a variety of formats at the point of purchase, with the goal of helping consumers to make healthier food choices. However, concerns remain about whether nutrition rating systems are actually furthering the NLEA’s goals of encouraging healthier food choice and purchase behavior. Studies suggest that many consumers have difficulty understanding the NFP and, therefore, would prefer a simplified FOP label that provides information that will help them to assess the nutritional characteristics of the food product.
Conclusions
In response to the perceived need for a better way to convey nutrition information about a food product, food manufacturers and retailers have developed various FOP nutrition rating systems. However, there is scant evidence to support that the proliferation of FOP nutrition rating systems has encouraged healthier food choices and purchase decisions. In fact, one UK study of the use of FOP labeling found that the coexistence of a number of label formats in the market caused consumer confusion about the levels of key nutrients (BMRB, 2009). Thus, there is a need for a standardized FOP nutrition rating system that moves beyond providing information to encouraging product comparison and healthier food choices by consumers at the point of purchase. Such an FOP symbol system could not only help consumers with food choice and purchase decisions, but also serve as a catalyst for product reformulation, a further benefit to consumers.
Because many consumers have difficulty evaluating product healthfulness based on the NFP, a well-designed FOP symbol system could be a more effective indicator of product healthfulness. Such an indicator is more likely to be used by consumers who are less able or less motivated to use the NFP to evaluate the nutritional qualities of a food product (Zeithaml, 1988; Srivastava and Mitra, 1998). For example, qualitative research in four European countries has shown that consumers have a preference for a simple FOP symbol system, standardized across food products (van Kleef et al., 2007). Too much detailed information on food package labels is not useful for consumers who lack nutrition knowledge or have low literacy and numeracy skills (Fuenkes et al., 2008). The need for a simple FOP symbol system is especially relevant in the grocery store environment, where consumers spend little time in deciding what to buy (USDA, 2008). Research on consumer use of the NFP and on the recent trans fat regulation (Kozup et al., 2006; Howlett et al., 2008; Todd and Variyam, 2008) indicate that an FOP system can only reach its full potential and avoid unintended consequences if it is accompanied by an ongoing public education and communication campaign to keep its relevance fresh in the minds of consumers.
Aikman, S. N, K. E. Min, and D. Graham. 2006. Food attitudes, eating behavior, and the information underlying food attitudes. Appetite 47:111-114.
Baltas, G. 2001. The effects of nutrition information on consumer choice. Journal of Advertising Research March/April:57-63.
Barreiro-Hurle, J., A. Gracia, and T. de-Magistris. 2010. Does nutrition information on food products lead to healthier food choices? Food Policy 35:221-229.
Berning, J. P., H. H. Chouniard, K. C. Manning, J. J. McCluskey, and D. E. Sprott. 2010. Identifying consumer preferences for nutrition information on grocery store shelf labels. Food Policy 35:429-436.
BMRB (British Market Research Bureau). 2009. Comprehension and Use of UK Nutrition Signpost Labelling Schemes. London: British Market Research Bureau.
CDC (Centers for Disease Control and Prevention). 2004. Trends in intake of energy and macronutrients—United States, 1971–2000. Morbidity and Mortality Weekly Report 53:80-82.
Clegg, S., and S. Lawless. 2008. Comprehension and Use of UK Nutrition Signpost Labelling Schemes: Initial Insights from the Qualitative Phase. London: Food Standards Agency.
Cowburn, G., and L. Stockley. 2005. Consumer understanding and use of nutrition labelling: A systematic review. Public Health Nutrition 8:21-28.
Cunningham, P. 2009. Chronic burdens: The persistently high out-of-pocket health care expenses faced by many Americans with chronic conditions. Commonwealth Fund Publication 1303. Washington, DC: The Commonwealth Fund.
Darmon, N., E. L. Ferguson, and A. Briend. 2002. A cost constraint alone has adverse effects on food selection and nutrient density: An analysis of human diets by linear programming. Journal of Nutrition 132:3764-3771.
Drichoutis, A. C., P. Lazaridis, R. M. Nayga, Jr. 2006. Consumers’ use of nutritional labels: A review of research studies and issues. Academy of Marketing Science Reviews 10(9). Available online: http://www.amsreview.org/articles/drichoutis09-2006.pdf.
Feunekes, G. I., I. A. Gortemaker, A. A. Willems, R. Lion, and M. van den Kommer. 2008. Front-of-pack nutrition labelling: Testing effectiveness of different nutrition labelling formats front-of-pack in four European countries. Appetite 50:57-70.
French, S. A., M. Story, P. Hannan, K. K. Breitlow, R. W. Jefferey, J. S. Baxter, M. P. Snyder. 1999. Cognitive and demographic correlates of low-fat vending snack choices among adolescents and adults. Journal of the American Dietetic Association 22:471-475.
Glanz, K., M. Basil, E. Maibach, J. Goldberg, and D. Snyder. 1998. Why Americans eat what they do: Taste, nutrition, cost, convenience, and weight control concerns as influences on food consumption. Journal of the American Dietetic Association 98:1118-1126.
Grunert, K. G., and J. M. Wills. 2007. A review of European research on consumer response to nutrition information on food labels. Journal of Public Health 15:385-399.
Guenther, P. M., K. W. Dodd, J. Reedy, and S. M. Krebs-Smith. 2006. Most Americans eat much less than recommended amounts of fruits and vegetables. Journal of the American Dietetic Association 106:1371-1379.
Guthrie, J., J. Fox, L. E. Cleveland, and S. Welsh. 1995. Who uses nutrition labeling and what effects does label use have on diet quality? Journal of Nutrition Education 27:153-172.
Higginson, C. S., M. J. Rayner, S. Draper, and T. R. Kirk. 2002. The nutrition label—which information is looked at? Nutrition and Food Science 32(2-3):92-99.
Howlett, E., S. Burton, and J. Kozup. 2008. How modification of the Nutrition Facts panel influences consumers at risk for heart disease: The case of trans fat. Journal of the American Marketing Association 27:83-97.
IOM (Institute of Medicine). 2004. Health Literacy: A Prescription to End Confusion. Washington, DC: The National Academies Press.
IOM. 2006. Food Marketing to Children and Youth: Threat or Opportunity? Washington, DC: The National Academies Press.
IOM. 2010. Examination of Front-of-Package Nutrition Rating Systems and Symbols: Phase I Report. Washington, DC: The National Academies Press.
IOM. 2010. Strategies to Reduce Sodium Intake in the United States. Washington, DC: The National Academies Press.
Kim, S. Y., R. M. Nayga Jr., and O. Capps Jr. 2000. The effect of food label use on nutrient intakes: An endogenous switching regression analysis. Journal of Agricultural and Resource Economics 25:215-231.
Kochanek, K. D., J. Xu, S. L. Murphy, A. M. Minino, and H. C. Kung. 2011. Deaths: Preliminary data for 2009. National Vital Statistics Report. Atlanta, GA: Centers for Disease Control and Prevention.
Kozup, J., S. Burton, and E. H. Creyer. 2006. Trans fat and the American diet. The Journal of Consumer Affairs 40:163-176.
Kreuter, M. W., L. K. Brennan, D. P. Scharff, and S. N. Lukwago. 1997. Do nutrition label readers eat healthier diets? Behavioral correlates of adults’ use of food labels. American Journal of Preventive Medicine 13:277-283.
Kulakow, N. 1995. NLEA: Linking education to regulation. In Nutrition Labeling Handbook, edited by R. Shapiro. New York: Marcel Dekker, Inc.
Kunkel, D., and C. McKinley. 2007. Developing ratings for food products: Lessons learned from media rating systems. Journal of Nutrition Education & Behavior 39(2 Suppl):S25-S31.
Lang, J. E., N. Mercer, D. Tran, and L. Mosca. 2000. Use of a supermarket shelf-labeling program to educate a predominately minority community about foods that promote heart health. Journal of the American Dietetic Association 100:804-809.
Lin, C. T. J., and J. Y. Lee. 2003. Dietary fat intake and search for fat information on food labels: New evidence. Consumer Interests Annual 49:1-3.
Macon, J. F., M. J. Oakland, H. H. Jensen, and P. A. Kissack. 2004. Food label use by older Americans: Data from the continuing survey of food intakes by individuals and the diet and health knowledge survey 1994-96. Journal of Nutrition for the Elderly 24:35-52.
Malam, S., S. Clegg, S. Kirwin, and S. McGinigal. 2009. Comprehension and Use of UK Nutrition Signpost Labelling Schemes. London: British Market Research Bureau.
Mhurchu, C. N., and D. Gorton. 2007. Nutrition labels and claims in New Zealand and Australia: A review of use and understanding. Australian & New Zealand Journal of Public Health 31:105-112.
Mokdad, A., J. Marks, D. Stroup, and J. Gerberding. 2004. Actual causes of death in the united states, 2000. Journal of the American Medical Association 291:1238-1245.
Neuhauser, L., R. Rothschild, and F. M. Rodríguez. 2007. Mypyramid.Gov: Assessment of literacy, cultural and linguistic factors in the USDA food pyramid web site. Journal of Nutrition Education and Behavior 39:219-225.
Petty, R. E., P. Briñol, and Z. L. Tormala. 2002. Thought confidence as a determinant of persuasion: The self-validation hypothesis. Journal of Personality & Social Psychology 82:722-741.
Rothman, R. L., R. Housam, H. Weiss, D. Davis, R. Gregory, T. Gebretsadik, A. Shintani, and T. A. Elasy. 2006. Patient understanding of food labels. The role of literacy and numeracy. American Journal of Preventive Medicine 31:391-398.
Satia, J. A., J. A. Galanko, and M. L. Neuhouser. 2005. Food nutrition label use is associated with demographic, behavioral, and psychosocial factors and dietary intake among african americans in north carolina. Journal of the American Dietetic Association 105:392-403.
Schoenberg, N. E., H. Kim, W. Edwards, and S. T. Fleming. 2007. Burden of common multiple-morbidity constellations on out-of-pocket medical expenditures among older adults. Gerontologist 47:423-437.
Serdula, M. K., C. Gillespie, L. Kettel-Khan, R. Farris, J. Seymour, and C. Denny. 2004. Trends in fruit and vegetable consumption among adults in the United States: Behavioral risk factor surveillance system, 1994-2000. American Journal of Public Health 94:1014-1018.
Srivastava, J., and A. Mitra. 1998. Warranty as a signal of quality: The moderating role of consumer knowledge on quality evaluations. Marketing Science 9:327-336.
Sullivan, A. D. 2003. Determining how low-income food shoppers perceive, understand, and use food labels. Canadian Journal of Dietetic Practice & Research 64:25-30.
Todd, J. E., and J. N. Variyam. 2008. The Decline in Consumer Use of Food Nutrition Labels, 1995-2006, Economic Research Report No. 63. Washington, DC: Economic Research Service, U.S. Department of Agriculture.
USDA (U.S. Department of Agriculture). 2008. Nutrient intakes: Mean amounts consumed per individual, one day, 2005-2006. USDA Agricultural Research Service. Available at: http://www.ars.usda.gov/ba/bhnrc/fsrg.
USDA. 2010a. Eating and Health Module (American Time Use Survey): 2008 Current Findings. USDA Economic Research Service. Available at http://www.ers.usda.gov/Data/ATUS/.
USDA. 2010b. Dietary Guidelines for Americans. Washington, DC: U.S. Government Printing Office.
van Kleef, E., H. van Trijp, F. Paeps, and L. Fernandez-Celemin. 2007. Consumer preferences for front-of-pack calories labeling. Public Health Nutrition 11:203-213.
Variyam, J. N. 2008. Do nutrition labels improve dietary outcomes? Health Economics 17:695-708.
Vishwanathan, M., and M. Hastak. 2002. The role of summary information in facilitating consumers’ comphrehension of nutrition information. Journal of Public Policy and Marketing 21:305-318.
Vogeli, C., A. E. Shields, T. A. Lee, T. B. Gibson, W. D. Marder, K. B. Weiss, and D. Blumenthal. 2007. Multiple chronic conditions: Prevalence, health consequences, and implications for quality care management, and costs. Journal of General Internal Medicine 22:391-395.
Wills, J. M., D. B. Schmidt, F. Pillo-Blocka, and G. Cairns. 2009. Exploring global consumer attitudes toward nutrition information on food labels. Nutrition Reviews 67(s1):S102-S106.
Worsley, A. 2002. Nutrition knowledge and food consumption: Can nutrition knowledge change food behavior? Asia Pacific Journal of Clinical Nutrition 11(Suppl):S579-S585.
Wright, J. D., J. Kennedy-Stephenson, C. Y. Wang, M. A. McDowell, and C. L. Johnson. 2004. Trends in intake of energy and macronutrients—United States, 1971-2000. Morbidity and Mortality Weekly Report 53:80-83.
Zeithaml, V. A. 1988. Consumer perceptions of price, quality, and value: A means-end model and synthesis of evidence. Journal of Marketing 52:2-22.


