
Appendix B
Commissioned Papers
SUMMARY OF BACKGROUND DATA ON THE ECCE WORKFORCE
Michelle L. Maroto and Richard N. Brandon
Prepared for the IOM Committee on the ECCE Workforce
INTRODUCTION AND PURPOSE
The National Research Council and Institute of Medicine (IOM) convened a Committee on the Early Childhood Care and Education Workforce, which is charged with holding a workshop to provide a clear definition of who is included in that workforce and to explore major issues regarding how to support the workforce and improve the quality of services it provides. A first step in that effort is to summarize the number and characteristics of the early childhood care and education (ECCE) workforce. This paper summarizes the currently available information about the number and characteristics of the ECCE workforce in the United States drawing mostly on published studies, tabulations from federal databases, and survey data compiled from multiple studies. Some previously unpublished data from several federal data sources provided by the U.S. Bureau of Labor Statistics have been included.
The first challenge in this task comes from the lack of a uniformly accepted definition of the ECCE workforce, with many studies including
workers who are not within the relevant standard federal occupational definitions and excluding others who are paid for similar work. This paper takes the approach first developed by Brandon and Whitebook for estimating the number of ECCE workers,1 which treats any individual who is paid for the care and education of children age birth through five and not in kindergarten as a member of the ECCE workforce. The definition of ECCE workforce used is derived from focusing on the function of being paid to provide care or instruction for young children, regardless of the setting or program in which it occurs. This definition is consistent with the federal concept of what constitutes an occupation, which is independent of the location in which the occupation is carried out.
It is common to divide ECCE into three broad categories reflecting the type of setting in which care and instruction occur: center-based (including community-based centers, preschools, and Head Start programs); formal home-based or Family Child Care (FCC), in which “formal” refers to being available in the open market and often licensed or registered; and informal home-based or Family, Friend, and Neighbor (FFN) care, where there is a relationship between the child and caregiver and access is not broadly available in the community. However, there are not clear demarcations among these types of settings. Family Child Care homes are often expanded to include many children and several staff, and are not distinguishable from small centers; some FFN caregivers function as small businesses not clearly separable from FCC.
In all three settings, some care or instruction is provided by unpaid individuals, who are not normally considered part of a workforce. An appropriate estimate of the size of the workforce therefore requires the ability to distinguish between paid and unpaid care and instruction. Because of the overlap and presence of unpaid caregivers, these three categories therefore serve as useful descriptors, but do not clearly define who is or is not included in the ECCE workforce.
We were able to identify 50 relevant studies providing information regarding the size and characteristics of the ECCE workforce. This summary presents broad findings regarding the numbers and characteristics of the ECCE workforce as suggested by these 50 studies, plus additional characteristics derived from several federal data sources provided by Dixie Sommers and Theresa Cosca at the U.S. Bureau of Labor Statistics (BLS). A description of these studies and their citations may be found at the end of this summary report. Detailed matrices summarizing the find-
![]()
1 A. Burton, R. N. Brandon, E. Maher, M. Whitebook, M. Young, D. Bellm, and C. Wayne, Estimating the Size and Components of the U.S. Child Care Workforce and Caregiving Population (Center for the Child Care Workforce [CCW] and Human Services Policy Center [HSPC], May 2002).
ings from the national and state studies will be made available on the IOM project website.
Twenty-five of these studies used national samples, and the rest came from different state-level studies. Because comprehensive surveys of the ECCE workforce that use nationally representative samples are rare, we combine multiple studies in our summary to present a broad picture of workers. This picture is partial, and we acknowledge a need for more recent representative data about the ECCE workforce.
In this summary, we relied on recent studies that provided the best descriptive information about workers. Generally, state-level studies provided the most detailed information, but we refrain from including them in this summary paper because they are not necessarily representative of the U.S. population. Two reviews of state workforce studies found wide variation in the robustness of methodology employed2 and in the reported levels of such essential characteristics as educational attainment.3
Much of this summary is based on new, unpublished tabulations of federal workforce data reflecting federal occupation and industry codes used by the BLS and the Census Bureau. We requested these data because the most recent nationally representative surveys of the ECCE workforce were conducted between 10 to 20 years ago.
We also include characteristics of subsets of the ECCE workforce from more recent, but limited, studies when items of interest are not available from nationally representative sources. Most of the federal databases and studies on the ECCE workforce were lacking in different ways, which complicates the summary. What we present is therefore somewhat of a “pastiche,” combining the best available data from numerous sources to address key questions. We have excluded any data that we consider unreliable or unrepresentative.
Michelle Maroto of the University of Washington identified 50 relevant studies, which we have divided into seven categories reflecting their relative strength for describing the characteristics of the ECCE workforce on a national scale. In order to address study limitations, but still present characteristics of the ECCE workforce, we ranked each study based upon the representativeness of its sample and the types of workers and settings it covered. The sampling structure of studies ranged from nationally
![]()
2 G. Stahr-Breunig, R. N. Brandon, and E. J. Maher, “Counting the Child Care Workforce: A Catalog of State Data Sources to Quantify and Describe Child Caregivers in the Fifty States and the District of Columbia,” report to the Child Care Bureau, Administration for Children and Families, U.S. Department of Health and Human Services, February 2004.
3 R. N. Brandon and I. Martinez-Beck, “Estimating the Size and Characteristics of the U.S. Early Care and Education Workforce,” in Critical Issues in Early Childhood Professional Development and Training, ed. M. Zaslow and I. Martinez-Beck (Brooks Publishing Company, 2005).
representative samples to multistate samples to state-level representative samples. The different settings of interest include center- and home-based care. In addition, studies used different language to refer to child care workers. Some studies divided child care workers into teachers, assistant teachers, and aids. Others only had divisions for center workers and FCC workers. Still others took a limited focus and only surveyed preschool teachers.
The studies summarized at the end of this report are categorized below; the number of studies in each category is shown in parenthesis:
I. Nationally representative; cover all children age B–5 (birth–age 5) and distinguish B–5 from school age; include most settings (2)
-
Profile of Child Care Settings (PCCS), 1990
-
National Households Education Survey (NHES); Human Services Policy Center (HSPC)/Center for the Child Care Workforce (CCW) Child Care Workforce Estimates Study, 2005
II. Nationally representative; include most settings; cover all B–5 but do not distinguish from school-age (7)
-
Current Population Survey (CPS), 2004
-
CPS; Occupation, 2010
-
CPS; Industry, 2010
-
American Community Survey (ACS); Occupation, 2009
-
ACS; Industry, 2009
-
Quarterly Census of Employment and Wages (QCEW), 2009
-
American Time Use Survey (ATUS); HSPC Estimating the Economic Value of Early Care and Education, 2005–2007
III. Nationally representative; cover a portion of B–5 workforce or settings; e.g., prekindergarten, Head Start (7)
-
Head Start Impact Study (HSIS), 2002–2006
-
Head Start: The Family and Child Experiences Survey (FACES), 2006–2007
-
Head Start: FACES, 2001
-
Head Start: FACES, 2000
-
Head Start: FACES, 1997
-
National Prekindergarten Study (NPS), 2003–2004
-
National Center for Early Development and Learning Survey (NCEDL-S), 1997
IV. Multistate; cover all of B–5 workforce by child age and setting (4)
-
National Child Care Staffing Study (NCCSS), 1988
-
Cost, Quality and Child Outcomes in Child Care Centers (CQCO), 1993
-
National Day Care Study (NDCS), 1976–1977
-
National Day Care Home Study (NDCHS), 1980
V. Multistate; cover portion of B–5 workforce and settings; e.g., prekindergarten (5)
-
National Institute of Child Health and Human Development (NICHD) Study of Early Child Care and Youth Development (SECCYD), 15 Months
-
NICHD SECCYD, 24 Months
-
NICHD SECCYD, 36 Months
-
Multi-State Study of Pre-Kindergarten (MSSPK), 2001
-
Statewide Early Education Programs Survey (SWEEP), 2001–2003
VI. Single state; cover all B–5 workforce (21)
VII. Single state; cover portion of B–5 workforce and settings; e.g., prekindergarten (4)
The first ranking tier includes studies that are: (1) nationally representative, (2) cover all child care workers for children birth through age 5, and (3) include most study settings. Within Tier I, the 1990 PCCS was the only study that was drawn from a nationally representative sample, covered child care workers for children birth through 5 years of age, and distinguished them from caregivers of school-aged children. It did not include the large FFN component of the workforce. However, this study was conducted in 1990, which makes it 20 years old and decreases its relevance for workers today. The HSPC analysis conducted in 2011 also meets these specifications, and includes the FFN component, but it only provides estimates of the size of the workforce and does not describe characteristics. Thus, we use the HSPC study for estimates of the size of the ECCE workforce, but rely on other studies to describe the characteristics of the workforce.
Most of the data presented in this report come from studies in the second category. This tier includes studies that are nationally representative and cover all child care workers for children birth through age 5, but do not distinguish these workers from those responsible for school-aged
children. Characteristics of child care workers provided by these studies come from Census occupational and industry classifications. We draw on previously unpublished tabulated data from the 2009 and 2010 CPS and the 2009 and 2010 ACS, and data from the HSPC demand-based estimate (Brandon et al., 2011), which used the 2005–2007 ATUS; this allowed identification of Family, Friend, or Neighbor caregivers. The application of federal occupation and industry codes in the surveys on which these studies were based allows us to report some descriptive information that is nationally representative. However, these data also include caregivers for school-aged children. We have only included such data where we do not think there is a likely systematic difference between the characteristics of caregivers of young children and those of school age.
The third tier consists of nationally representative studies that cover only a portion of the ECCE workforce. Thus, they yield information about some groups of child care workers and early education teachers, but not all of them. Some of the data come from the HSIS, which was conducted from 2002–2006 and the Head Start: FACES surveys from 1997 through 2001. Teachers and assistant teachers in these studies were all recruited from Head Start classrooms. This tier also includes the NPS and the NCEDL-S. Both of these studies only surveyed prekindergarten teachers and are thus restricted to children between ages 3 and 5. It should be noted that due to federal and state prekindergarten program standards, the educational level of the prekindergarten workforce reflected in these studies is higher than for the ECCE workforce in general.
The fourth tier consists of multistate studies that cover all of the B–5 child care workforce. Multistate studies often attempted to approximate a nationally representative sample by surveying workers in a diverse subset of states, but none has a sufficient number of states to effectively represent all regions of the United States. The 1988 NCCSS surveyed center workers in five cities (Atlanta, Boston, Detroit, Phoenix, and Seattle). The 1993 CQCO surveyed staff in 400 programs across four states (California, Colorado, Connecticut, and North Carolina). The 1976–1977 NDCS was constructed from state licensing lists and thus systematically under-represents unlicensed settings and providers in states that only require licensing of a small fraction of providers. The 1980 NDCHS consists of both regulated and unregulated family day care homes in three urban areas (Los Angeles, Philadelphia, and San Antonio). Most of these studies are older; therefore, we do not include much information from them in this report.
The fifth tier consists of multistate studies that cover only a portion of the ECCE workforce. The NICHD SECCYD at 15, 24, and 36 months surveyed caregivers for children in the NICHD study when the children were 15, 24, and 36 months old and thus excluded workers caring only
for children above that age. The 2001 MSSPK and the 2001–2003 SWEEP were both conducted by the National Center for Early Development and Learning (NCEDL). The MSSPK is based on a stratified random sample of teachers in state-funded prekindergarten classrooms from six states (California, Georgia, Illinois, Kentucky, New York, and Ohio). The SWEEP was based on state-funded prekindergarten classrooms from five states (Massachusetts, New Jersey, Texas, Washington, and Wisconsin).
The sixth and seventh tiers contain 25 single-state studies from 15 states at different time periods. We do not discuss these data in this summary, but these studies are included in the detailed data matrices. The detailed matrices provide the findings from these studies in much richer detail and discuss the nature of the studies, indicating their strengths and weaknesses for this purpose (which may not have been the primary purpose for which the studies were conducted). The print matrices provide an overview of this information, but the digital file includes estimates for each of the individual studies.
COUNTING THE ECCE WORKFORCE FOR CHILDREN AGE B–5, BY SETTING
The only study that encompassed and distinguished the workforce responsible for children B–5 and included all settings (center-based, formal home-based, and informal home-based) was the HSPC demand-based estimate (Brandon et al., 2011). This study updated and refined earlier work led by Brandon and Whitebook (CCW and HSPC, 2002). This approach is labeled demand-based because the essential data are derived from one of several large scale, nationally representative surveys that ask parents how many hours in a typical week each of their children spends in each type of non-parental care setting, including both formal and FFN care; and whether the care and instruction is paid or unpaid. The National Household Education Survey, Early Childhood Supplement (2005) was deemed most appropriate because it contains the most comprehensive and well-differentiated set of categories for type of care. It also asks parents the child:adult ratio for the setting where their child is in care. The demand-based estimate combines hours per child in care, child:adult ratios and average hours worked by ECE staff (from BLS Current Employment Statistics) to derive the full-time equivalent (FTE) number of adults caring for young children. Because the estimates are derived from samples of individual children with such known characteristics as age, it is possible to divide the workforce by such variables as the age of child and setting. Various other adjustments are made to convert FTEs to individuals and estimate the number of directors and other staff positions associated with that number of caregivers.
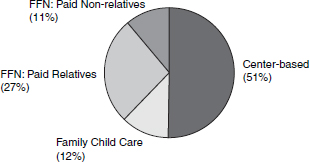
FIGURE B-1 Demand-based estimates of the ECCE workforce.
TABLE B-1 Formal ECCE Workforce by Role/Responsibility
| Total Persons in Typical Week |
Center-Based Staff | FCC Staff | ||||
| Center Staff: Total |
Directors/ Administrators |
Teachers |
Assistant Teachers and Aides |
FCC Providers |
FCC Assistants |
|
| 1,333,000 | 1,083,000 | 83,000 | 564,000 | 435,000 | 151,000 | 99,000 |
NOTE: ECCE: Early Childhood Care Education; FCC: Family Child Care.
SOURCE: HSPC demand-based estimates. Brandon et al., 2011.
These demand-based estimates are illustrated in Figure B-1. It should be noted that in addition to the 2.2 million paid ECCE workers shown here, the same estimates indicate an additional 3.2 unpaid workers, for a total caregiving population of 5.5 million.
Table B-1 provides a differentiation of the formal components of the ECCE workforce by role or responsibility. The FFN component is not shown because such a differentiation is not relevant.
An advantage of the demand-based approach is that it differentiates by the age of children served as well as by type of setting, as shown in Table B-2. It is useful to differentiate by age of children since different skills and orientations may be required to best meet children’s needs.
Differentiation by Occupation and Industry: BLS and Census Bureau Employment Data
The demand-based workforce estimates in the previous section have the advantages of covering all components of the ECCE workforce and
TABLE B-2 Estimated Number of Paid ECCE Workers in the United States in a Typical Week by Setting and Age of Child
| Total Paid | Center Care | FCC Providers |
Paid Relatives | Paid Non-Relatives | |
| Infants (0–18 mos.) | 490,000 | 223,000 | 78,000 | 111,000 | 78,000 |
| Toddlers (19–36 mos.) |
654,000 | 309,000 | 92,000 | 166,000 | 87,000 |
| Early Head Start | 13,000 | 13,000 | |||
| Private preschoolers (3–5 yrs) | 826,000 | 371,000 | 80,000 | 312,000 | 63,000 |
| Public preschoolers (3–5 yrs) | 79,000 | 79,000 | |||
| Head Start | 94,000 | 94,000 | |||
| All 0–5 year olds | 2,157,000 | 1,088,000 | 250,000 | 589,000 | 229,000 |
NOTE: FCC: Family Child Care.
SOURCE: HSPC demand-based estimates. Brandon et al., 2011.
of being restricted to caring for or instructing children age B–5. However, these estimates have many limitations. They can only be conducted at broad intervals when a demand survey is available. They also entail great uncertainty because they must link many different estimates from different data sources. Because they do not directly interview employees or employer, they lack many essential features included in standard federal workforce data such as the sector or industry in which they are employed, the number of hours worked, wages earned, separation or turnover rate. They also lack the educational and demographic characteristics of members of different occupations collected by the Census Bureau using the same federal occupational classification. In this section, and in Tables B-3A and B-3B below, we draw on relevant federal workforce data from the BLS to complete this initial portrait. In the next major section of the paper, we summarize studies using Census data to provide additional characteristics.
There are many challenges to using standard federal data from the BLS and the Census Bureau to describe the ECCE workforce, as discussed in Federal Data Sources for Understanding the Early Childhood Care and Education Workforce: A Background Paper, a second commissioned work
included in this report. The primary challenge is that for the largest share of the ECCE workforce, the federal occupational categorization does not differentiate between those employed to provide care and instruction to young children (B–5) and those responsible for school-aged children. However, there are several relevant pieces of data for which there is no particular reason to assume a different distribution of characteristics related to the age of children in care. It is therefore useful to examine those data, keeping in mind this caveat.
Relating ECCE Occupations and Industries
A particular advantage of the federal data system is that it cross-tabulates occupations with the industries or economic sectors in which they are employed. We can thus see that ECCE does not function as an isolated bubble in the U.S. economy, but is highly interwoven with other sectors. Tables B-3A and B-3B are based on BLS employment statistics, as opposed to the demand-based estimates shown in Tables B-1 and B-2. We also compare the size of the ECCE workforce as indicated by each of these sources.
Comparing BLS Employment Estimates to Demand-Based Estimates
As seen in Table B-3A, BLS identified 1.8 million jobs, of which 1.3 million are classified as child care workers and 0.5 million as preschool teachers.
The demand-based estimate exclusive of FFN caregivers was about 1.4 million. Because the BLS estimate of 1.8 million includes caregivers for school-aged children, it would be expected to be larger than the demand-based estimate for children under age 6. If, for example, one-third of child care workers identified by the BLS are working with school-aged children, that would reduce the 1.8 million to 1.3 million. The two estimates are therefore roughly similar for the components of the ECCE workforce that they share.
However, because the BLS estimate probably does not include most of the 0.8 million paid FFN workers in the demand-based estimate, it is reasonable that the 1.8 million is lower than the 2.2 million total in the demand-based estimate. If the 0.8 million demand-based estimate of paid FFN workers is added to the 1.3 million derived from assuming one-third of child care workers care only for school-aged children, the adjusted total would be 2.1 million, roughly comparable to the demand-based estimate of 2.2 million.
Industries Employing ECCE Workers
Of the 1.8 million employees reported by the BLS, 75 percent or 1.3 million are wage and salary employees, and the remaining 431,000 are self-employed, presumably as FCC proprietors. About 247,000 of the wage and salary employees are employed in private households. This estimate could include nannies and some paid FFN caregivers. Subtracting this number from the total wage and salary employees leaves a subtotal of 631,000 individuals who are employed out of the home, plus an additional 390,000 preschool teachers.
The balance between wage and salary and self-employment varies substantially between those classified as child care workers and those as preschool teachers. Almost a third of the child care workers are self-employed, compared to less than 2 percent of preschool teachers.
The industries employing child care workers and preschool teachers are quite different. Of interest is that only about 66,000 or 15 percent of preschool teachers work in public or private schools. More than two-thirds—69 percent—are in social assistance establishments. Presumably Head Start teachers who are employed by community-based contractors are considered social assistance employees.
Within the 631,000 child care workers whose employment is not home-based, the greatest number—253,000—work in child care services, what are commonly thought of as child care centers. But these workers comprise less than a third of such employees.
Child care workers are distributed across a wider range of economic sectors than preschool teachers. About 21 percent are in social assistance; 4 percent in health care, mostly residential facilities; 19 percent are in child day care services, such as community-based centers; 3 percent are in fitness and recreation centers, and 6 percent work for “religious, grantmaking, civic, professional, and similar organizations,” which are presumably centers operated by such entities. Less than 1 percent are in transportation (including school-bus drivers) and hotel or motel accommodations.
Almost 50,000 are employed in “residential care facilities,” of which the largest number—17,000—are in mental health, mental retardation, and substance abuse facilities. However, we cannot determine whether these workers are responsible for young children of parents residing in such facilities, for adolescent residents, or a combination of the two. This is one of the challenges of not differentiating child care workers by the age group of children served. Because such residential facilities are categorized within the health sector, they would not normally be identified as related to ECCE if the occupations were not specified within the sector.
This brief summary illustrates the value of the BLS system of relating occupations to industries. It allows policy makers to consider both how many employees there are and where they are employed. If large-scale
TABLE B-3A Employment by Occupation and Industry, 2008
| Child Care Workers | |||
| 2008 | |||
| Industry | Employment (thousands) | Percentage of Occupation | |
| Total employment, all workers | 1,301.9 | 100.00 | |
|
Self-employed and unpaid family workers, all jobs |
424.0 | 32.57 | |
| Total wage and salary employment | 877.8 | 67.43 | |
|
Transportation and warehousing (school and employee bus transportation) |
11.6 | 0.89 | |
| Educational services, public and private | 147.7 | 11.34 | |
| Health care and social assistance | 334.2 | 25.67 | |
| Health care | 57.3 | 4.40 | |
|
Residential care facilities (mental retardation, mental health, substance abuse, other) |
49.5 | 3.80 | |
| Social assistance | 276.9 | 21.27 | |
|
Individual, family, community, and vocational rehabilitation services |
23.2 | 1.79 | |
| Child day care services | 253.7 | 19.48 | |
|
Arts, entertainment, and recreation (including fitness and recreation centers) |
34.9 | 2.68 | |
|
Amusement, gambling, and recreation industries |
34.8 | 2.68 | |
|
Accommodation (hotels, motels) and food services |
1.0 | 0.08 | |
|
Other services (except government and private households) |
77.9 | 5.99 | |
|
Religious, grantmaking, civic, professional, and similar organizations |
77.5 | 5.96 | |
| Government | 17.6 | 1.35 | |
| Private households; all jobs | 246.5 | 18.93 | |
NOTE: CC: Child Care.
SOURCE: Bureau of Labor Statistics, Employment Projections, 2009.
quality improvement efforts are being planned, then knowing which establishments employ how many workers is essential.
Employment Projections
Obviously, if policy makers are looking to provide supports and incentives for professional development and quality improvement, locating the
| Preschool Teachers | CC Workers + Pre-K | ||
| 2008 | 2008 | ||
| Employment (thousands) |
Percentage of Occupation |
Employment (thousands) |
Percentage of Occupation |
| 457.2 | 100.00 | 1,759.1 | 100.00 |
| 7.0 | 1.53 | 431.0 | 24.50 |
| 450.2 | 98.47 | 1,328.0 | 75.49 |
| 11.6 | 0.66 | ||
| 66.3 | 14.51 | 214.0 | 12.17 |
| 317.3 | 69.40 | 651.5 | 37.04 |
| 2.8 | 0.62 | 60.1 | 3.42 |
| 0.5 | 0.10 | 50.0 | 2.84 |
| 314.5 | 68.78 | 591.4 | 33.62 |
| 17.4 | 3.81 | 40.6 | 2.31 |
| 297.1 | 64.97 | 550.8 | 31.31 |
| 0.7 | 0.16 | 35.6 | 2.02 |
| 0.6 | 0.13 | 35.4 | 2.01 |
| 1.0 | 0.06 | ||
| 58.5 | 12.80 | 136.4 | 7.75 |
| 58.5 | 12.80 | 136.0 | 7.73 |
| 5.5 | 1.19 | 23.1 | 1.31 |
| 0.3 | 0.07 | 246.8 | 14.03 |
places that employ workers is essential to arranging supports. Planning for both pre-service and in-service professional development, as well as for recruitment activities, is aided by projecting future job growth in different occupations and industries. BLS creates projections regularly for all occupations and industries, considering a variety of economic trends and factors. Table B-3B summarizes the BLS employment projections for
TABLE B-3B Projected Employment by Occupation and Industry, 2018
| Child Care Workers | |||
| 2018 | |||
| Industry | Employment (thousands) |
Percentage Change |
|
| Total employment, all workers | 1,443.9 | 10.91 | |
|
Self-employed and unpaid family workers, all jobs |
445.0 | 4.93 | |
|
Total wage and salary employment |
999.0 | 13.80 | |
|
Transportation and warehousing (school and employee bus transportation) |
13.9 | 19.83 | |
|
Educational services, public and private |
180.3 | 22.12 | |
|
Health care and social assistance |
375.2 | 12.27 | |
| Health care | 63.1 | 10.24 | |
|
Residential care facilities (mental retardation, mental health, substance abuse, other) |
54.1 | 9.40 | |
| Social assistance | 312.1 | 12.69 | |
|
Individual, family, community, and vocational rehabilitation services |
28.0 | 20.44 | |
|
Child day care services |
284.1 | 11.98 | |
|
Arts, entertainment, and recreation (including fitness and recreation centers) |
39.8 | 14.23 | |
|
Amusement, gambling, and recreation industries |
39.8 | 14.22 | |
|
Accommodation (hotels, motels) and food services |
1.1 | 7.75 | |
|
Other services (except government and private households) |
88.5 | 13.58 | |
|
Religious, grantmaking, civic, professional, and similar organizations |
88.0 | 13.54 | |
| Government | 19.0 | 8.12 | |
|
Private households; all jobs |
273.3 | 10.88 | |
NOTE: CC: Child Care
SOURCE: Bureau of Labor Statistics, Employment Projections, 2009.
ECCE workers, which incorporate both child care workers (which include school-aged care) and preschool teachers.
We examine ECCE employment by industry or sector because BLS projects employment growth at different rates for sectors reflecting
| Preschool Teachers | CC Workers + Pre-K | ||
| 2018 | 2018 | ||
| Employment (thousands) |
Percentage of Occupation |
Employment (thousands) |
Percentage of Occupation |
| 543.9 | 18-95 | 1,987.8 | 13.00 |
| 7.4 | 5.50 | 452.4 | 4.97 |
| 536.5 | 19-16 | 1,535.5 | 15.63 |
| 13.9 | 19.83 | ||
| 72.7 | 9.53 | 253.0 | 18.22 |
| 388-9 | 22.56 | 764.1 | 17.28 |
| 3.3 | 17-65 | 66.4 | 10.48 |
| 0.5 | 9-96 | 54.6 | 9.20 |
| 385-6 | 22.60 | 697.7 | 17.97 |
| 20.7 | 19-18 | 48.7 | 19.95 |
| 364.8 | 22.80 | 648.9 | 17.81 |
| 0.8 | 16.18 | 40.6 | 14.04 |
| 0.7 | 14-95 | 40.5 | 14.41 |
| 1.1 | 10.00 | ||
| 66-1 | 12.94 | 154.6 | 13.34 |
| 66-1 | 12.94 | 154.1 | 13.31 |
| 5-9 | 8.10 | 24.9 | 7.79 |
| 0.3 | 4.43 | 273.6 | 10.86 |
trends in the economy. Thus, the overall number of jobs for child care workers plus preschool teachers is projected to grow about 13 percent over a decade from 2008 to 2018. Within that overall projection, preschool employment is projected to grow 19 percent and child care employment
11 percent. Wage and salary employment is projected to grow 16 percent, and self-employment only 5 percent. Similarly, child day care employment in centers is projected to grow by 12 percent, but employment in fitness and recreation centers by 14 percent. The greatest projected growth—22 percent—is for child care workers in the educational services sector; employment of preschool teachers in educational establishments is projected to grow by 10 percent.
These are of course projections, and changes in economic trends, professional practice, or public policies could yield different results. Because the classification that differentiates child care workers from preschool teachers is not consistent with current professional concepts in the field of early care and education, the differences between these two occupations are likely to vary.
Injuries and Illnesses Involved in Missing at Least One Day of Work4
The annual rate of illnesses and injuries for child care services (including workers responsible for school-aged children) is somewhat higher than the national average (115 per 10,000 full-time workers versus 106 for all U.S. workers). The child care rate is much higher than that for elementary–secondary education (115 vs. 60 per 10,000 workers).
The rate of illness and injury for child care services has increased in the last 2–3 years, while the overall national rate has not, and the educational services rate has declined. However, the year-to-year variability may be due to reflecting a relatively small sample of child care workers. BLS staff has advised us that the data cannot be averaged across years to provide a more stable estimate.
CHARACTERISTICS OF THE ECCE WORKFORCE
We compiled data regarding the characteristics of the ECCE workforce from the 50 studies described above and describe the workforce using these characteristics and the relative study rankings. In this summary we gave preference to studies based upon their (1) representativeness of the population, (2) coverage of the ECCE workforce, and (3) year of data collection. Thus, the contents of each of the tables in this report are primarily based upon the second set of studies (II). These studies are nationally representative, include most child care settings (except FFN), cover all B–5 caregivers, but do not distinguish them from caregivers of
![]()
4 U.S. Bureau of Labor Statistics (BLS) runs provided 02-13-11. Occupational injury and illness data from the BLS Occupational Safety and Health Statistics program. Program information available at http://www.bls.gov/iif/.
school-aged children because they use Census occupational and industry codes.
We have added to these studies relevant data from two Census sources—the 2009 ACS and the 2010 CPS, which were specially tabulated for this study by the U.S. Bureau of Labor Statistics.5 These tabulations reflect application of the occupation and industry codes cited here.
The occupations used in these analyses are based on the two following broad federal occupational codes:
-
2300: Preschool and kindergarten teachers
-
4600: Child care workers
The industries used in these analyses are based on the two following federal industry codes:
-
8470: Child day care services
-
9290: Private households (broader Census code that includes FCC providers)
Thus, the data reflect a somewhat broader workforce definition than the B–5 focus of the ECCE committee, because child care workers (4600) include care for school-aged children and the private households industry code (9290) includes other household workers beyond FCC providers. However, they do not include the sizeable FFN component, because most FFN caregivers do not identify themselves as in the child care occupation. When data are not available from this set of studies, we use additional studies reviewed for this report.
The first column of each table indicates the type and study ranking (I–VII) and the number of studies in this type. The additional columns provide estimates for child care providers, preschool teachers, directors, and FCC providers. The child care worker data in the first column of each table do not necessarily reflect the specific total of the characteristics by position (child care worker, preschool teacher, or FCC provider). Rather, they are independent estimates calculated by the cited studies for U.S. Census occupational codes. In some cases we report the combination of preschool and kindergarten teachers, because Census data do not distinguish these categories. From BLS data, which do use this distinction, we know that about two-thirds of the combined category is preschool
![]()
5 U.S. Department of Labor, U.S. Bureau of Labor Statistics. Previously unpublished tabulations from the CPS (2010) and ACS (2009) conducted by the U.S. Census Bureau. These tabulations were from the PUMS files, which are a sample of the full microdata set. Personal communication with Dixie Sommers, assistant commissioner, February 11, 2011.
teachers, so the combined data are more reflective of preschool than kindergarten teachers.
Characteristics are divided into seven major areas:
-
Demographic characteristics: age, gender, race/ethnicity, marital status, and household composition and income
-
Qualifications: educational attainment, general and early childhood education (ECE)-specific, ECE experience, and bi- or multilingual communication
-
Professional development: training and credentials
-
Labor market characteristics: full-/part-time employment, hours worked per week, other employment
-
Compensation: wages, benefits
-
Staff stability: occupational and job turnover
-
Professional status: attitudes and orientation: union and professional organization membership
We describe each set of these characteristics below and present more detailed summaries of the studies included in a later section of this report. Detailed tables of characteristics of the ECCE workforce are available at http://www.iom.edu/Reports/2011/The-Early-Childhood-Care-and-Education-Workforce-Challenges-and-Opportunities.aspx.
Demographic Characteristics: Age, Gender, Race/Ethnicity, Marital Status, Household Composition and Income
Age of Workers
According to previously unpublished tabulations based on data from the CPS and the ACS, the median age for child care workers ranges from 35 to 39 years. The median age for preschool teachers is 39 years, but the median age for workers employed in private households, which include FCC providers, is higher—43 years.
The share of the workforce that may be considered adolescent baby-sitters has been an issue of interest. Across the studies, the percentage of caregivers under age 20 ranges from 5 to 9 percent. The percentage is highest for FCCs (about 7 percent) and lower for preschool teachers (<2 percent). The percentage of caregivers aged 65 years or older is also small, ranging from 4 to 5 percent. Table B-4 shows the median age of ECCE workers.
TABLE B-4 Median Age of Workers, 2009–2010
| Type and N Studies | Child Care Workers | Preschool and Kindergarten Teachers* | FCC Providers |
| (II) 3 | 35–39 | 39 | 43 |
NOTE: FCC: Family Child Care.
* Census categories combine preschool and kindergarten teachers.
SOURCES: Unpublished tabulations of data from the CPS (2010) and the ACS (2009). U.S. Bureau of Labor Statistics, February 2011.
TABLE B-5 Percentage Female in Workforce, 2009–2010
| Type and N Studies | Child Care Workers | Preschool and Kindergarten Teachers | FCC Providers |
| (II) 5 | 94.2–95.2 | 97.0–97.9 | 90.9–91.0 |
NOTE: FCC: Family Child Care. Data in this table reflect standard federal occupational and industry codes. Groups are not subsets of each other.
SOURCE: Unpublished tabulations of data from the CPS (2010) and the ACS (2009). U.S. Bureau of Labor Statistics, February 2011.
Gender
As shown in Table B-5, about 95 percent of the ECCE workforce is female. The percentage of women is highest for preschool and kindergarten teachers (97 percent).
Race/Ethnicity
Table B-6 shows data regarding the race and ethnicity of ECCE workers. The child care workforce is predominately white and non-Hispanic, with estimates ranging from 71 to 79 percent white for child care workers, 76 to 83 percent for preschool teachers, and 69 to 86 percent for FCC providers. A large minority of FCC providers (36 to 40 percent) are of Hispanic origin.
Additional comparisons of the race and ethnicity of child care workers with children age B–5 are available from the HSPC demand-based estimates study (Brandon et al., 2011), which used data from the ATUS. However, this summary does not include preschool teachers because they are not included in the Census occupational code for child care workers
TABLE B-6 Race/Ethnicity of Workers, 2009–2010
| Type and N Studies | Child Care Workers | Preschool and Kindergarten Teachers | FCC Providers | |
| White, non-Hispanic (%) | (II) 5 | 70.5–78.6 | 75.6–82.7 | 69.3–85.5 |
| African American, non-Hispanic (%) | (II) 5 | 15.8–18.0 | 13.4–16.5 | 8.7–10.1 |
| Hispanic/Latina (%) | (II) 5 | 16.2–19.1 | 9.6–11.4 | 35.5–39.5 |
| American Indian or Alaska Native (%) | (III) 2 | 0.9 (1997)–1.2 (2006) | ||
| Asian or Pacific Islander (%) | (II) 2 | 2.6–2.9 | 2.2 | 3.4 |
| Multiracial/biracial, other (%) | (II) 5 | 5.0–10.4 | 3.9–5.7 | 5.9–17.2 |
NOTE: FCC: Family Child Care. CPS and ACS data in this table reflect standard federal occupational and industry codes. Groups are not subsets of each other.
SOURCE: Except for estimates for percentage American Indian or Alaskan Native, which come from the Head Start FACES, data come from unpublished tabulations of data from the CPS (2010) and the ACS (2009). U.S. Bureau of Labor Statistics, February 2011.
and could not be distinguished from kindergarten teachers.6 As Table B-7 shows, when averaging data from 2005 through 2007, the estimates for the race/ethnicity of child care workers are similar to those above. The percentage of child care workers who are white (75.9 percent) is very close to the percentage of children ages B–5 who are white (76.5 percent). However, there are some small differences in the percentage of workers and children who describe their racial group as black, other, and Hispanic. Averaging data from 2005 through 2007, 17.4 percent of child care workers identified as black, 6.7 percent as a racial group not listed (other), and 17.8 percent as Hispanic. In the same time period, 14.8 percent of children ages B–5 were identified as black, 8.8 percent as other, and 22.3 percentage as Hispanic. The large percentage of young children who were Hispanic reflects the growing Hispanic population in the United States. It is possible that this summary overstates the share of the ECCE workforce from
![]()
6 Within the ATUS sample, 343 respondents (318 females and 25 males) listed their industry or occupation as child care worker. The industry code used for this analysis was 8470—child care day services—and the occupation code was 4600—child care workers. This sample is restricted to employed persons, but it did not have any other restrictions. This study did not use industry or occupation codes to define FFN caregivers. Caregiving was based on time spent in non-household childcare activities.
TABLE B-7 Race/Ethnicity for Child Care Workers and Children, 2005–2007 Average
| Child Care Workers | Children Ages Birth–5 | ||
| Percent | Percent | ||
| White | 75.9 | White | 76.5 |
| Black | 17.4 | Black | 14.8 |
| Other | 6.7 | Other | 8.8 |
| Hispanic | 17.8 | Hispanic | 22.3 |
SOURCE: HSPC demand-based estimates. Brandon et al., 2011.
minority groups. That is because the non-included preschool teachers are likely to have a greater share of white and smaller share of other racial/ ethnic backgrounds, because they often have higher formal education requirements, and the rate of college attendance is substantially higher for whites.
Marital Status
Almost half (48 percent) of the total child care workers are married, with another third (33 percent) that have never been married, and almost a fifth (18 percent) who indicate that they are separated, widowed, or divorced, as shown in Table B-8.
Household Composition and Income
About two-thirds of child care workers have children present in their homes. A minority live alone (16–22 percent) or live with their parents (19–24 percent). The mean household income for a child care worker in 1993 was $26,835, which translates to approximately $40,495 in 2010 dollars. The mean household income for a preschool teacher in 2004 was
TABLE B-8 Marital Status of Child Care Workers, 2007
| Type and N Studies | Child Care Workers | |
| Married (%) | (II) 1 | 48.3 |
| Never married (%) | (II) 1 | 33.3 |
| Formerly married (%) | (II) 1 | 18.4 |
SOURCE: HSPC demand-based estimates. Brandon et al., 2011.
TABLE B-9 Household Composition and Income
| Type and N Studies | Child Care Workers | Preschool Teachers | |
| Children present in household (%) | (II) 1 | 68.3 (2007) | |
| Mean household income (dollars) | (III) 1; (IV) 1 | 26,835 (1993) | 58,388 (2004) |
| Median household income (dollars) | (III) 1 | 52,000 (2004) |
SOURCE: Estimates for the percentage child care workers with children present come from HSPC demand-based estimates. Brandon et al., 2011. Estimates for the mean household income of child care workers come from the CQCO, 1993. All other estimates come from the NPS, 2004.
$58,388, which translates to $67,579 in 2010 dollars. The median household income in 2004 was $52,000, which is equivalent to $60,185 in 2010 dollars. These data are presented in Table B-9.
The estimates for prekindergarten teachers in this table come from the NPS, which only sampled teachers of 3–4-year-olds. Preschool and prekindergarten teachers have higher compensation than other child care workers, and are therefore likely to have higher family incomes. It should be noted that 30 percent had incomes that are considered to be below the criterion for self-sufficiency, which is below twice the federal poverty level.
Qualifications: Educational Attainment—General and ECE-Specific, Professional Development, ECCE Experience, and Bi- or Multilingual Communication
Many of the studies we reviewed focused on assessing child care workers’ qualifications and subsequently determining whether qualifications were correlated with quality of care. For this reason, there is a large amount of information on education attainment, early care and education training, and other types of professional development on the national and state level. However, few of the national studies, except those focused on preschool, restricted their samples to child care workers for B–5 children. The estimates summarized in Table B-10A come from provided tabulations of Current Population Survey data, which includes caregivers for school-aged children. The estimates summarized in Table B-10B come from the FACES studies and the MSSPK and SWEEP studies that only focused on prekindergarten teachers.
TABLE B-10A Educational Attainment, 2009–2010
| Type and N Studies | Child Care Workers | FCC Providers | |
| a. High school diploma or equivalent (%) | (II) 6 | 26.7–33.2 | 32.2–33.4 |
| b. Some college (%) | (II) 5 | 21.4–39.0 | 17.3–32.0 |
| c. Associate’s degree (%) | (II) 6 | 7.3–12.1 | 5.1–5.6 |
| d. Bachelor’s degree (%) | (II) 6 | 10.8–16.9 | 7.4–10.3 |
| e. Graduate or professional degree (%) | (II) 5 | 1.9–4.4 | 1.2–2.0 |
| f. Bachelor’s degree or higher (%) | (II) 5 | 12.7–21.2 | 8.6–12.2 |
NOTES: FCC: Family Child Care. CPS and ACS data in this table come from occupational and industry codes. Groups are not subsets of each other.
SOURCES: Unpublished tabulations of data fromtthe CPS (2010) and the ACS (2009). U.S. Bureau of Labor Statistics, February 2011.
TABLE B-10B Educational Attainment, 2009–2010
| Type and N Studies | Preschool Teachers | |
| a. High school diploma or equivalent (%) | (III) 5, (V) 2 | 2.0–22.0 |
| b. Some college (%) | (III) 5, (V) 2 | 13.0–32.5 |
| c. Associate’s degree (%) | (III) 5, (V) 2 | 12.0–18.0 |
| d. Bachelor’s degree (%) | (V) 2 | 18.1–49.0 |
| e. Graduate or professional degree (%) | (V) 2 | 24.0–25.6 |
| f. Bachelor’s degree or higher (%) | (III) 5, (V) 2 | 28.1–73.2 |
SOURCE: Data from (III) studies come from the Head Start FACES. Data from (V) study come from the MSSPK and the SWEEP.
Educational Attainment
Preschool teachers had the highest levels of educational attainment: 18 to 49 percent obtained a bachelor’s degree, and 24 to 26 percent obtained a graduate or professional degree. However, preschool teachers in these studies come from samples based on state-sponsored programs, so it is likely that they have higher education levels than other prekindergarten teachers. Education levels were lower for child care workers and FCC providers. Approximately a third of each of these groups did not attend college past high school. However, 11 to 18 percent of child care workers
TABLE B-11 ECCE-Specific Education
| Type and N Studies | Preschool Teachers | |
| Obtained associate’s degree in ECE (%) | (V)1 | 12 (2001) |
| Obtained bachelor’s degree in ECE (%) | (III) 1, (V) 1 | 31 (2001) |
| Obtained advanced degree in ECE (%) | (IV) 1, (V) 1 | 13 (2001) |
| Obtained CDA (%) | (I) 1, (III) 7 | 22.8 (2004)-76.1 (1997) |
| Obtained a state awarded certificate (%) | (III) 2 | 29.3 (2004)-57.2 (2006) |
| Obtained a teaching certificate/license (%) | (III) 3 | 34 (2000)-38.6 (2006) |
NOTE: CDA: Child Development Associate.
SOURCE: Data from (III) studies come from the Head Start FACES. Data from (V) study come from the MMSSPK and the SWEEP.
and 7 to 10 percent of FCC providers completed college with a bachelor’s degree.
ECE-Specific Education
Caregivers and teachers vary in the amount of ECE-specific education that they obtained, as shown in Table B-11. As of 2001, 12 percent of preschool teachers had obtained an associate’s degree in ECE, 31 percent obtained a bachelor’s in ECE, and 13 percent obtained an advanced degree in ECE. The percentage of prekindergarten teachers who obtained a child development associate (CDA) credential, state-awarded certificate, or other type of teaching certificate varied across studies. For example, 23 percent of teachers in the 2004 National Prekindergarten Study had obtained a CDA, but 76 percent of teachers in the 1997 Head Start Family and Child Experiences Survey reported obtaining one.
Professional Development
Several studies also recorded whether teachers engaged in other types of professional development. Teachers in the National Prekindergarten Study spent an average of 33 hours in training within the past year, while 39 to 47 percent of teachers in the different waves of the Head Start Family and Child Experiences Survey were currently enrolled in teacher-related training at the time of the survey. These data are presented in Table B-12.
TABLE B-12 Professional Development
| Type and N Studies | Preschool Teachers | |
| Mean hours in training in past 12 months (hours) | (III) 1 | 32.9 (2004) |
| Currently enrolled in teacher-related training (%) | (III) 3 | 38.7 (2006)–46.5 (2001) |
SOURCE: 2004 data come from the NPS. 2001 and 2006 data come from the Head Start FACES.
TABLE B-13 Mean Years in Caregiving Field
| Type and N Studies | Child Care Workers | Preschool Teachers |
| (I) 1, (III) 3, (V) 4 | 4.0–5.4 (1994) | 6.8 (1997)–11.8 (2000) |
SOURCES: 1994 data come from the NICHD SECCYD. 1997 data come from the NCEDL-S. 2000 data come from the Head Start FACES.
ECCE Experience
Across studies, child care workers reported having an average of 4 to 5 years of work experience in the ECCE field, while preschool teachers had an average of 7 to 12 years of experience. Head Start teachers had spent an average of 8 to 9 years teaching in Head Start classrooms.
Note that these data, shown in Table B-13, are estimates of current level of experience, not of the duration of time workers will remain in the field. They reflect questions asked of active workers, rather than of workers who had retired or left the field. The respondents would thus continue to work in the field for an underdetermined amount of time. Duration or tenure will thus exceed current years of experience, but we do not currently have data reflecting duration.
Labor Market Characteristics: Compensation (Wages, Benefits), Full-/Part-Time Employment, Hours Worked per Week, Other Employment, and Job and Occupational Turnover
Compensation
In this section we address two components of compensation: earnings and benefits (health and retirement).
Earnings The Bureau of Labor Statistics and the Current Population Survey provide median weekly earnings estimates for workers by occu-
TABLE B-14 Median Weekly Earnings (Dollars)
| Type and N Studies | Child Care Workers | Preschool and Kindergarten Teachers | FCC Providers |
| (II) 2 | 400.00 (2010) | 621.00 (2010) | 269.23 (2010) |
NOTE: FCC: Family Child Care. Data in this table reflect standard occupational and industry codes. Groups are not subsets of each other.
SOURCE: Child Care Worker and Preschool/Kindergarten Teacher data from the BLS (ftp://ftp.bls.gov/pub/special.requests/lf/aat39.txt). FCC studies based on unpublished tabulations of data from the CPS (2010), U.S. Bureau of Labor Statistics, February 2011.
pation and industry, which we include as our primary compensation estimates. As seen in Table B-14, child care workers earned an average of $400 per week in 2010, preschool and kindergarten teachers averaged $621 per week, and FCC providers earned the least—$269 per week.
As a point of comparison, for full-time, year-round workers, these median annual earnings would be approximately $20,800 for child care workers, $32,292 for teachers, and $14,000 for FCC providers if we were to multiply these estimates by 52 weeks in a year. By contrast, the median weekly wage across occupations in 2010 was $747 (or $38,844 annually).7 However, many ECCE staff are not employed full-time and do not work at their jobs for 12 months a year. As shown in Table B-15, less than half of FCC providers work full-time, and at most two-thirds of child care workers are employed full-time. Because of the lack of full-time employment for ECCE workers, the yearly earnings estimates will be lower than those provided for full-time, year-round workers.
Many child care workers are also employed in school-based or school-related programs, which only operate about 9 months of the year. Enrollment at community-based child care centers drops substantially in the summer as parents take vacations and move houses; some staff takes vacation, others are temporarily not employed. However, even though they are not working at their normal ECCE jobs, such staff may be employed in other occupations or locations. Some teachers are employed in summer sessions. Others may use the time to gain college credits, which can increase their earnings. Therefore, the net financial impact of compensation for individual workers for varying employment throughout the year is not fully captured by any standard data source that we are aware of.
![]()
7 U.S. Bureau of Labor Statistics, 2010, “Table 39: Median weekly earnings of full-time wage and salary workers by detailed occupation and sex,” Household Data Annual Averages, ftp://ftp.bls.gov/pub/special.requests/lf/aat39.txt.
TABLE B-15 Percentage Who Work Full Time, 2009–2010
| Type and N Studies | Child Care Workers | Preschool and Kindergarten Teachers | FCC Providers |
| (II) 4 | 51.0–64.7 | 71.3–74.2 | 37.8–42.6 |
NOTE: FCC: Family Child Care. Data in this table reflect standard federal occupational and industry codes. Groups are not subsets of each other.
SOURCE: Unpublished tabulations of data from the CPS (2010) and the ACS (2009). U.S. Bureau of Labor Statistics, February 2011; HSPC demand-based estimates. Brandon et al. (2011).
Weekly Hours and Full-Time/Part-Time Status
As shown in Table B-15, a large majority of the ECCE workforce, with the exception of FCC providers, worked full-time and many worked more than 40 hours per week. Preschool and kindergarten teachers as a group had the largest percentage of full-time workers (71–74 percent), child care workers (51–65 percent), and finally FCC providers (38–43 percent). These rates of full-time employment are all lower than the average for the total population of employed persons age 16 and older, which was approximately 80.3 percent in 2010.8
According to 2003–2007 data from the ATUS, child care workers reported working 34 hours per week on average; however in the BLS current employment series, employers report an average of 30.3 hours/week for child care workers. Teachers in the National Prekindergarten Study reported 37 hours per week of work. Teachers also reported spending an average of 4 hours per week in planning time for classes. About half of prekindergarten teachers (54 percent) performed 2 to 4 hours per week of unpaid planning time as well.
Benefits A major economic consideration for ECCE workforce is access to retirement and health benefits. In this section we summarize previously unpublished data from the 2010 National Compensation Survey provided specifically for this study.9 As for other BLS data, we note that Child Care Workers and Child Day Care Services includes school-aged as well as ECCE workers. It should also be noted that the data do not distinguish between full- and part-time workers. Because part-time workers often
![]()
8 Bureau of Labor Statistics, 2010, “Table 8: Employed and unemployed full- and part-time workers by age, sex, race, and Hispanic or Latino ethnicity,” Household Data Annual Averages, ftp://ftp.bls.gov/pub/special.requests/lf/aat8.txt.
9 U.S. Department of Labor, U.S. Bureau of Labor Statistics, Health and Retirement Benefit Access and Participation; Employer Costs for Employee Compensation, March 2010. Breakdown by selected occupations and industries. Personal communication with Philip M. Doyle, assistant commissioner, May 10, 2011.
receive fewer benefits, and the share of part-time workers is higher for ECCE than for the total population of civilian workers; the comparison between ECCE and total workers may be slightly overstated.
Tables B-16A through B-16F summarize employer-reported benefits for the two major components of the ECCE workforce regularly tracked by BLS: child care workers and preschool teachers. These are divided by the category of the establishment where they work: child day care services (column 2) versus elementary and secondary schools (column 3). Other workers in these establishments, such as directors or food service workers, are reflected in the first row—all workers—under the establishment category. Child care workers and preschool teachers in other types of establishments—e.g., health facilities—are reflected in rows 2–4 of the first column. For sake of comparison, the entry in the first row and first column shows the value for all civilian workers in all industries. It should be noted that the total includes the ECCE workers, but because they represent less than 1 percent (about 0.006) of the total workforce the error in the comparison is slight.
Health Benefits Table B-16A shows the share of child care and preschool workers with access to employer health benefits. Access for ECCE is slightly more than half the rate for all civilian employees: 38 versus 74 percent. Preschool teachers slightly exceed the national average, with 75
TABLE B-16A Percentage of Civilian Workers with Access to Employer-Provided Health Insurance
| All Industries | Child Day Care Services | Elementary and Secondary Schools | Child Day Care Services and Elementary and Secondary Schools | |
| All workers (in all occupations) | 74 | 49 | 88 | 84 |
| Child care workers and preschool teachers, except special education | 38 | 31 | 60 | 39 |
| Child care workers | 31 | 26 | 47 | 31 |
| Preschool teachers, except special education | 63 | 64 | 90 | 75 |
SOURCE: BLS National Compensation Survey, 2010.
TABLE B-16B Percentage of Civilian Workers Participating in Employer-Provided Health Insurance
| All Industries | Child Day Care Services | Elementary and Secondary Schools | Child Day Care Services and Elementary and Secondary Schools | |
| All workers (in all occupations) | 60 | 26 | 75 | 70 |
| Child care workers and preschool teachers, except special education | 22 | 12 | 44 | 20 |
| Child care workers | 16 | 9 | 37 | 15 |
| Preschool teachers, except special education | 43 | 29 | 60 | 43 |
SOURCE: BLS National Compensation Survey, 2010.
percent access having access to benefits. However, only 39 percent of child care workers have access.
Access varies greatly between workers in the community-based child day care services industry, for which access is 31 percent, and elementary-secondary schools, which have 60 percent access. Even within the schools, 90 percent of preschool teachers have access to health benefits, compared to 47 percent of child care workers. In child day care services, the rates are lower but the discrepancy just as great: 64 percent of preschool teachers have access versus 26 percent of child care workers.
However, not all employees participate in employer-sponsored plans to which they have access. For some, the contributions or co-payments may be too high. Others may be covered under their spouse or partner’s plan. Table B-16B shows the actual participation.
Thus, while 38 percent of all ECCE employees have access to health benefits, only 58 percent of those actually participate. For child care workers, the take-up rate is only 53 percent yielding 16 percent with employer coverage, while for preschool teachers it is 68 percent, yielding 43 percent participation.
Just as there are discrepancies in the percentage of workers having access to and participating in health benefits, there appear to be discrepancies in the amount contributed by employers to those benefits. It should be noted that the average cost includes hours worked by part-time
TABLE B-16C Average Hourly Cost to Employers per Worker Participating in Employer-Provided Health Insurance: Author’s Estimates
| All Industries | Child Day Care Services | Elementary and Secondary Schools | Child Day Care Services and Elementary and Secondary Schools | |
| All workers (in all occupations) | 3.06 | 1.30 | 5.62 | 5.30 |
| Child care workers and preschool teachers, except special education | 2.05 | 0.95 | 4.48 | 2.26 |
| Child care workers | 1.83 | 0.67 | 4.15 | 1.95 |
| Preschool teachers, except special education | 2.90 | 2.38 | 5.09 | 3.71 |
SOURCE: BLS National Compensation Survey, 2010.
employees who are likely to have fewer benefits. However, to the extent that ECCE employs a higher share of part-time employees than the overall civilian economy reflects part of the structural difference in employment and compensation.
Table B-16C shows that average hourly employer costs for ECCE are about one-third lower than for the average workers—$2.05 versus $3.06 per hour. The distribution within ECCE parallels that for access and participation. Employer costs for preschool teachers schools are close to the overall average—$2.90 versus $3.06. For those in elementary and secondary schools, the costs are close to that for all school employees—$5.09 versus $5.62 per hour.
Retirement Benefits Tables B-16D, B-16E, and B-16F show similar information regarding employer-based retirement benefits. While 69 percent of employees in all industries have access to retirement benefits, only 30 percent of child care workers and 47 percent of preschool teachers have such access. As with health benefits, access is much higher for workers in schools than in other facilities.
Of the 69 percent of all workers with access to retirement benefits, 55 percent participate. For child care workers, 18 percent out of the 30 percent with access participate, and for preschool teachers all of the 47 percent with access participate. Combining all ECCE workers—child care
TABLE B-16D Percentage of Civilian Workers with Access to Employer-Provided Retirement Benefits
| All Industries | Child Day Care Services | Elementary and Secondary Schools | Child Day Care Services and Elementary and Secondary Schools | |
| All workers (in all occupations) | 69 | 30 | 90 | 84 |
| Child care workers and preschool teachers, except special education | 34 | 18 | 67 | 31 |
| Child care workers | 30 | — | 64 | 27 |
| Preschool teachers, except special education | 47 | — | 74 | 49 |
NOTE: Dashes indicate no workers in this category or data did not meet publication criteria.
SOURCE: BLS National Compensation Survey, 2010.
TABLE B-16E Percentage of Civilian Workers Participating in Employer-Provided Retirement Plans
| All Industries | Child Day Care Services | Elementary and Secondary Schools | Child Day Care Services and Elementary and Secondary Schools | |
| All workers (in all occupations) | 55 | 21 | 87 | 80 |
| Child care workers and preschool teachers, except special education | 24 | 9 | 59 | 23 |
| Child care workers | 18 | — | 54 | 17 |
| Preschool teachers, except special education | 47 | — | 72 | 48 |
NOTE: Dashes indicate no workers in this category or data did not meet publication criteria.
SOURCE: BLS National Compensation Survey, 2010.
TABLE B-16F Average Hourly Cost to Employers per Worker Participating in Employer-Provided Retirement Benefits: Author’s Estimates
| All Industries | Child Day Care Services | Elementary and Secondary Schools | Child Day Care Services and Elementary and Secondary Schools | |
| All workers (in all occupations) | 1.65 | 0.27 | 3.32 | 3.05 |
| Child care workers and preschool teachers, except special education | 0.75 | 0.13 | 1.85 | 0.70 |
| Child care workers | 0.48 | — | 1.45 | 0.49 |
| Preschool teachers, except special education | 1.41 | — | 2.69 | 1.42 |
NOTE: Dashes indicate that no workers in this category or data did not meet publication criteria.
SOURCE: BLS National Compensation Survey, 2010.
and preschool, community-based and schools—23 percent actually participate in retirement benefits out of the 31 percent who have access.
Table B-16F shows the average hourly employer contribution to employee retirement plans. The pattern is similar to that for health insurance. Child care workers have average benefits that are less than a third of the average worker—$0.48 versus $1.65—while preschool teachers’ benefits are slightly lower. Benefits in schools are more generous than in community-based settings. Average retirement costs for all workers in schools are nearly double that for the average U.S. worker—$3.32 versus $1.65. Preschool teachers in schools receive about 20 percent lower retirement benefits—$2.69 per hour worked—which is still much higher than preschool teachers in non-school settings.
Other Employment
According to CPS data, a small percentage of child care workers (5 percent) also worked additional jobs outside of their main employment. Four percent of teachers and 3 percent of FCC providers had an additional job. Of those with additional employment, child care workers spent about
16 hours per week at an extra job and teachers spent about 15, according to the 1993 CQCO study. These data are presented in Table B-17.
Job and Occupational Turnover
Turnover is a concern for many researchers and policy makers in the child care field. It is important to distinguish between job turnover—changing jobs within the ECCE field—and occupational turnover—leaving ECCE for another field. National studies have generally showed annual job turnover rates to be about one-third of child care workers and 19 to 39 percent of teachers. Data from California, gathered as part of the 1994–2000 study, Then and Now: Changes in Childcare Staffing, indicate that job turnover between 1999 and 2000 for all teaching staff was about 32 percent and occupational turnover was about 16 percent. Teachers and staff in this study also experienced a 2 to 6 percent decrease in wages in this time period. Data on annual job turnover are presented in Table B-18.
Professional Attitudes and Orientation: Union and Professional Organization Membership
Various aspects of professionalism have been demonstrated to predict the observed quality of caregiving and child outcomes. We do not have reliable national data on attitudes and orientation. However, there are
TABLE B-17 Percentage of Workers With Additional Job, 2010
| Type and N Studies | Child Care Workers | Preschool and Kindergarten Teachers | FCC Providers |
| (II) 2 | 5.1 | 4.1 | 3.3 |
NOTE: FCC: Family Child Care. Data in this table reflect standard federal occupational and industry codes. Groups are not subsets of each other.
SOURCE: Unpublished tabulations of data from the CPS (2010) and the ACS (2009). U.S. Bureau of Labor Statistics, February 2011.
TABLE B-18 Annual Job Turnover (%)
| Type and N Studies | Child Care Workers | Center-Based Teachers |
| (I) 1, (IV) 1 | 33–36.4 (1993) | 19 (1990)–38.7 (1993) |
SOURCE: Data from 1990 come from the PCCS study. Data from 1993 come from the CQCO study.
data regarding the aspects of professionalism involved in deciding to join a union or professional association.
As expected, union participation was highest among preschool teachers. Twenty-one percent of teachers indicated that they were union members (Table B-19). Rates of union membership were lower for child care workers (4–6 percent) and lowest for FCC providers (<1 percent).
Additionally, 53 to 62 percent of teachers and 14 percent of total child care workers indicated that they were members of one or more professional associations (Table B-20).
TABLE B-19 Percentage of Workers Unionized, 2010
| Type and N Studies | Child Care Workers | Preschool and Kindergarten Teachers |
FCC Providers |
| (II) 2 | 3.5–6.3 | 20.8 | 0.80 |
NOTE: FCC: Family Child Care. Data in this table reflect standard federal occupational and industry codes. Groups are not subsets of each other.
SOURCE: Unpublished tabulations of data from the CPS (2010) and the ACS (2009). U.S. Bureau of Labor Statistics, February 2011.
TABLE B-20 Percentage of Members of Professional Organization
| Type and N Studies | Child Care Workers | Preschool Teachers |
| (III) 3, (IV) 1 | 14 (1988) | 52.9 (1997)–62 (2000) |
NOTE: Groups are not subsets of each other.
SOURCE: 1988 data come from the NCCSS. 1997 and 2000 data come from the Head Start FACES.
STUDY LIST
I. Nationally representative; cover all children age B–5 (birth–age 5) and distinguish B–5 from school age; include most settings (2)
-
Profile of Child Care Settings (PCCS), 1990
-
National Households Education Survey (NHES); Human Services Policy Center (HSPC)/Center for the Child Care Workforce (CCW) Child Care Workforce Estimates Study, 2005
II. Nationally representative; include most settings; cover all B–5 but do not distinguish from school-age (7)
-
Current Population Survey (CPS), 2004
-
CPS; Occupation, 2010
-
CPS; Industry, 2010
-
American Community Survey (ACS); Occupation, 2009
-
ACS; Industry, 2009
-
Quarterly Census of Employment and Wages (QCEW), 2009
-
American Time Use Survey (ATUS); HSPC Estimating the Economic Value of Early Care and Education, 2005–2007
III. Nationally representative; cover a portion of B–5 workforce or settings; e.g., prekindergarten, Head Start (7)
-
Head Start Impact Study (HSIS), 2002–2006
-
Head Start: The Family and Child Experiences Survey (FACES), 2006–2007
-
Head Start: FACES, 2001
-
Head Start: FACES, 2000
-
Head Start: FACES, 1997
-
National Prekindergarten Study (NPS), 2003–2004
-
National Center for Early Development and Learning Survey (NCEDL-S), 1997
IV. Multistate; cover all of B–5 workforce by child age and setting (4)
-
National Child Care Staffing Study (NCCSS), 1988
-
Cost, Quality and Child Outcomes in Child Care Centers (CQCO), 1993
-
National Day Care Study (NDCS), 1976–1977
-
National Day Care Home Study (NDCHS), 1980
V. Multistate; cover portion of B–5 workforce and settings; e.g., prekindergarten (5)
-
National Institute of Child Health and Human Development (NICHD) Study of Early Child Care and Youth Development (SECCYD), 15 Months
-
NICHD SECCYD, 24 Months
-
NICHD SECCYD, 36 Months
-
Multi-State Study of Pre-Kindergarten (MSSPK), 2001
-
Statewide Early Education Programs Survey (SWEEP), 2001–2003
VI. Single state: cover all B–5 workforce (21)
-
AZ: Survey of Arizona’s Early Education Workforce, 2004
-
CA: California Early Care and Education Workforce Study—Family Child Care Survey, 2005
-
CA: California Early Care and Education Workforce Study—Center Survey, 2005
-
FL: Child Care Workforce Study, 2006
-
IL: Illinois Department of Human Services (IDHS) Illinois Salary and Staffing Survey of Licensed Child Care Facilities, 2008
-
IN: Survey of Teachers and Directors Working in Licensed Child Care Centers and Unlicensed Child Care Ministries, 2007
-
ME: Maine Child Care Market Rate and Workforce Study, 2002
-
MN: Child Care Workforce in Minnesota, 2006–2007
-
MN: Child Care Workforce in Minnesota, 2006–2007
-
MN: Child Care Workforce in Minnesota, 2006–2007
-
NYC: New York City Early Childhood Educators Survey, 2006
-
NC: North Carolina Child Care Workforce Survey, 2003
-
OH: Workforce Study of Ohio Early Childhood Centers, Ohio Department of Job and Family Services (ODJFS), 2005
-
OH: Workforce Study of Ohio Early Childhood Centers, Ohio Department of Education (ODE), 2005
-
PA: Early Care and Education Provider Survey, 2002
-
UT: Study of Childcare Workforce in Utah, 2006
-
VA: Childcare Workforce Study in Metro Richmond, Virginia, 2003
-
WI: Statewide Child Care Surveys, 1980
-
WI: Statewide Child Care Surveys, 1988
-
WI: Statewide Child Care Surveys, 1994
-
WI: Statewide Child Care Surveys, 2001
VII. Single state: cover portion of B–5 workforce and settings; e.g., prekindergarten (4)
-
CA: Changes in Child Care Staffing Study, 2000
-
MA: Cost Quality (CQ) Center Study, 2000-2001
-
MA: CQ Public School Study, 2000-2001
-
MA: CQ FCCH Study, 2000-2001
DESCRIPTION
I. Nationally Representative Studies; Cover All Children Age B–5 (Birth–Age 5) and Distinguish B–5 from School Age; Include Most Settings
National Household Education Survey, Early Childhood Supplement (NHES); Human Services Policy Center (HSPC)/Center for the Child Care Workforce (CCW) Child Care Workforce Estimates Study
-
Study Dates: 1999, 2005
-
Agency: HSPC; CCW
-
Demand-based estimation of the early child care and education workforce
-
Uses 1999 and 2005 data from the NHES to calculate estimates of child care workforce
-
NHES is a large-scale, nationally representative survey that asks respondents questions about the hours spent in a variety of care arrangements in a typical week.
-
The NHES is a random-digit-dial telephone survey of the general population, with 7,198 household respondents with children age B–5.
-
Limitations:
ο Study itself does not sample ECCE workers.
Sources
Brandon, R. N., T. J. Stutman, and M. Maroto. 2011. The economic value of early care and education in the U.S. In Economic Analysis: The Early Childhood Sector, ed. E. Weiss and R. Brandon. Washington, DC: Partnership for America’s Economic Success.
Center for the Child Care Workforce and Human Services Policy Center. 2002. Estimating the size and components of the U.S. child care workforce and caregiving population: Key findings from the child care workforce estimate, executive summary: Preliminary report. Washington, DC: Center for the Child Care Workforce.
Profile of Child Care Settings (PCCS)
-
Study Date: 1990
-
Agency: Mathematica Policy Research Group
-
This study’s goal was to focus on the availability (supply side) of early education care.
-
The study is a nationally representative sample drawn from the universe of formal early education care programs.
-
Computer-assisted telephone interviewing (CATI) survey with nationally representative sample of center directors and regulated home-based child care providers that are licensed or registered by the state or county in which they are located.
-
Uses a two-stage clustered sample design: (1) 100 representative counties stratified according to region, metro status, and poverty level and (2) centers within counties.
-
Sample N: 2,089 centers and 583 regulated home-based child care providers
-
Provide weighted estimates in report
-
Limitations:
ο Year/age of study
Source
Kisker, E. E., S. L. Hofferth, D. A. Phillips, and E. Farquhar. 1991. A profile of child care settings: Early education and care in 1990. Princeton, NJ: Mathematica Policy Research, Inc.; Washington, DC: Department of Education.
II. Nationally Representative; Most Settings; Cover All B–5 But Do Not Distinguish from School-Age
American Community Survey (ACS)
-
Data Date: 2009 single-year estimates
-
Agency: U.S. Census Bureau
-
The ACS is a nationally representative survey based on housing units, with an additional survey for those persons living in group quarters.
-
The ACS uses monthly samples to produce annual data for the same small areas (census tracts and block groups) formerly surveyed via the decennial census long-form sample.
-
The Public Use Microdata Sample (PUMS) files contain records for a subsample of ACS housing units and group quarters persons, with information on the characteristics of these housing
units and group quarters persons plus the people in the selected housing units.
-
The ACS produces 1-year, 3-year, and 5-year samples; this project utilizes the 1-year samples.
-
Tabulations from PUMS data:
ο 2009 ACS demographics for Current Population Survey (CPS) aggregations of ECCE occupations, all detailed ECCE industries
ο Industries: elementary and secondary school, child day care services, private households
-
-
Limitations:
ο Estimates are based on Census industry and occupation codes, which are not restricted to ECCE caregivers. They may include caregivers for school-aged children as well.
ο Industry codes also not specific to child care workers
American Time Use Survey (ATUS); HSPC Estimating the Economic Value of Early Care and Education
-
Study Dates: 2005–2007
-
Agency: HSPC (analysis); Bureau of Labor Statistics (BLS) (data)
-
Provides characteristics of child care workers from the ATUS
-
The ATUS is conducted by the BLS and administered by the U.S. Census. Surveyors randomly select individuals from a subset of households from the CPS and interview these respondents about how they spent their time on the previous day, where they were, and whom they were with.
-
These estimates were calculated in relation to a project focused on hours of caregiving.
-
Sample N: 501 child care workers
-
Limitations:
ο Uses census categorization to define child care workers; therefore does not include preschool teachers and may include children of any age
Source
Brandon, R. N., T. J. Stutman, and M. Maroto. 2011. The economic value of early care and education in the U.S. In Economic Analysis: The Early Childhood Sector, ed. E. Weiss and R. Brandon. Washington, DC: Partnership for America’s Economic Success.
Current Population Survey
-
Study Dates: 1979-2004; 2010
-
Agency: Economic Policy Institute (analysis); U.S. Census Bureau (data)
-
CPS is a monthly survey of 60,000 U.S. households
-
Study using 1979–2004 data (Herzenberg et al., 2005):
ο This study uses three different CPS extracts to produce numbers of child care workers based on educational attainment, wages, and benefits.
ο Estimates and characteristics about child care providers based on census occupation and industry codes
■ 2000–2003 data: Industry Code = 8470 (child day-care services)
■ 2000–2003 data: Occupation Code = 4600 (child care workers)
ο Data are provided for child care workers from 1979 through 2004
-
-
Tabulations from PUMS data:
ο 2009 ACS and 2010 CPS demographics for CPS aggregations of ECCE occupations, all detailed ECCE industries
ο Occupations: education administrators, preschool and kindergarten teachers, special education teachers, teacher assistants, first line supervisors/managers, child care workers
ο Industry: elementary and secondary schools, child day care services, private households
-
-
Limitations:
ο Estimates are based on Census industry and occupation codes, which are not restricted to ECCE caregivers. They may include caregivers for school-aged children as well.
Source
Herzenberg, S., M. Price, and D. Bradley. 2005. Losing ground in early childhood education: Declining workforce qualifications in an expanding industry, 1979-2004. Washington, DC: Economic Policy Institute.
Quarterly Census of Employment and Wages (QCEW)
-
Date: 2009
-
Agency: BLS; U.S. Department of Labor
-
Near-census of monthly employment and quarterly wage information by six-digit North American Industry Classification System (NAICS) industry at the national, state, and county levels
-
Limitations:
ο Estimates are based on Census industry and occupation codes, which are not restricted to ECCE caregivers. They may include caregivers for school-aged children as well
III. Nationally Representative; Cover a Portion of B–5 Workforce or Settings, e.g., Prekindergarten, Head Start
Head Start: The Family and Child Experiences Survey (FACES)
-
Study Waves/Dates: 1997–2001, 2000–2001, 2003–2004, 2006–2007
-
Agency: U.S. Department of Health and Human Services, Administration on Children, Youth and Families
ο http://www.acf.hhs.gov/programs/opre/hs/faces/
-
This survey has multiple waves that are part of Head Start’s Program Performance Measures Initiative.
-
Each cohort survey of FACES employs a nationally representative sample of Head Start programs, centers, classrooms, children, and parents.
-
The sample is stratified by region (Northeast, Midwest, South, West), urbanicity, and percentage of minority families in the program
-
2006–2007 Cohort: National random sample of Head Start Programs from Head Start Program Information Report
ο Sample: 60 programs, 135 centers, 410 classroom, 365 teachers, 3,315 children (Fall 2006)
-
2003–2004 Cohort: National random sample of Head Start Programs from Head Start Program Information Report (follow-up child sample)
ο Sample: 63 programs; 2,400 children
-
2000–2001 Cohort: National random sample of Head Start Programs from Head Start Program Information Report (second sample)
ο Sample: 43 programs; 2,800 children; Fall 2000—257 teachers; Spring 2001—264 teachers
-
1997–2001 Cohort: National random sample of Head Start Programs from Head Start Program Information Report (first sample)
ο First cohort with six phases
■ Phase 1—field test of 2,400 children and parents in Spring 1997, Phases 2 and 3—survey interviews of 3,200 children and families and 437 teachers in Fall 1997; Phase 4—follow-up Spring 1999; Phase 5—follow-up Spring 2000; Phase 6—follow-up Spring 2001
ο Sample: 40 programs; 3,200 children and parents; 437 teachers
-
Limitations:
ο Data are restricted to Head Start programs, centers, classrooms, children, and parents
Sources
Aikens, N., L. Tarullo, L. Hulsey, C. Ross, J. West, and Y. Xue. 2010. ACF-OPRE report: A year in Head Start: Children, families, and programs. Washington, DC: U.S. Department of Health and Human Services, Administration for Children and Families, Office of Planning, Research and Evaluation.
Hulsey, L., N. Aiken, Y. Xue, L. Tarullo, and J. West. 2010. ACF-OPRE report: Data tables for FACES 2006 A Year in Head Start report. Washington, DC: U.S. Department of Health and Human Services, Administration for Children and Families, Office of Planning, Research and Evaluation.
U.S. Department of Health and Human Services, Administration for Children and Families. 2006. Head Start Performance Measures Center Family and Child Experiences Survey (FACES 2000) technical report. Washington, DC: U.S. Department of Health and Human Services.
Head Start Impact Study (HSIS)
-
Study Dates: 2002–2006
-
Agency: U.S. Department of Health and Human Services, Administration on Children, Youth and Families
ο http://www.acf.hhs.gov/programs/opre/hs/impact_study/index.html
-
Sampling process:
ο Identified grantee/delegate agencies using the Head Start Program Information Report (PIR) after excluding agencies that only serve special populations, those that were involved in the FACES study, and those that were “extremely new to the program” to create a list of 1,715 agencies;
ο Organized the list into 161 geographic clusters, then stratified it into 25 strata varying by region, location, race/ethnicity, policies, and other factors. Selected a cluster of programs from each of the 25 strata;
ο Determined eligibility of the agencies creating a pool of 223 agencies;
ο Grouped and stratified these along other regional conditions, to create a sample of 90 agencies across 23 states;
ο Agencies recruited and dropped 3;
ο Developed list of 1,427 Head Start Centers;
ο Determined eligibility of centers;
ο Re-stratified eligible centers;
ο Selected children and conducted random assignment
-
Sample N: 2,783 Head Start children and 1,884 control children for total sample of 4,667 children
-
Data collection included: direct child assessments, parent interviews, teacher surveys and child reports, center director setting interviews, and care setting observations
-
Caregiver information collected:
ο Certificates, education, experience
ο Beliefs and attitudes
-
Results are provided in terms of center setting for 3- and 4-year-old children in Head Start and control groups.
-
Limitations:
ο Data are restricted to Head Start programs, centers, classrooms, children, and parents.
Source
U.S. Department of Health and Human Services, Administration for Children and Families. 2010. Head Start Impact Study, final report. Washington, DC.
National Center for Early Development and Learning (NCEDL) Survey
-
Study Dates: 1997
-
Agency: National Center for Early Development and Learning
ο http://www.fpg.unc.edu/~ncedl/
-
The study consists of a stratified sample on eight levels of program type (national or local chain, independent for-profit, religious affiliate, Head Start, public school, independent nonprofit, other public agency, unknown) and four levels of program size (less than 40, 40-99, 100+children, unknown)
-
Sample Population: Sample selected from a population of 85,715 early childhood programs provided in a list purchased from a commercial firm
-
Mailed 4,979 surveys to a random stratified sample of the population
-
Sample N: Final sample of 1,920 ECE teachers of 3- and 4-year-olds
-
Directors filled out general questions about center; one teacher of 3–4-year-olds filled out the rest of the information.
-
Limitations:
ο Sample restricted to teachers of 3–4-year-olds.
ο Sample does not include all B–5 teachers.
Source
Saluja, G., D. M. Early, and R. M. Clifford. 2002. Demographic characteristics of early childhood teachers and structural elements of early care and education in the United States. Early Childhood Research and Practice 4(1):1-19, http://ecrp.uiuc.edu/v4n1/saluja.html.
National Prekindergarten Study (NPS)
-
Study Dates: 2003–2004
-
Agency: Yale Child Study Center
-
The study is a large-scale sample of prekindergarten teachers who had primary responsibility for a state-funded prekindergarten classroom.
-
Sample Population: all 40,211 state-funded prekindergarten classrooms in the nation
-
Sample N: National sample of 3,898 prekindergarten teachers
-
Limitations:
ο Sample of prekindergarten teachers.
ο Sample does not include all B–5 ECE workers.
Source
Gilliam, W. S., and C. M. Marchesseault. 2005. From capitols to classrooms, policies to practice: State-funded prekindergarten at the classroom level. Part 1: Who’s teaching our youngest students? Teacher education and training, experience, compensation and benefits, and assistant teachers. New Haven, CT: Yale University, Yale Child Study Center.
IV. Multistate; Cover All of B–5 Workforce by Child Age and Setting
Cost, Quality, and Child Outcomes in Child Care Centers
-
Study Dates: 1993–1994
-
Agency: University of Colorado, University of California, Los Angeles (UCLA), University of North Carolina at Chapel Hill, and Yale University
-
This study examines the relationship between cost and quality of early childhood care and education programs in four states: California, Colorado, Connecticut, and North Carolina.
-
The study uses a stratified random sample of 100 centers in each state (California, Colorado, Connecticut, and North Carolina).
-
Sample population: Drew child care facilities from state-level lists of licensed child care facilities, excluded family child care programs, and only included early childhood programs that served infants, toddlers, and/or preschoolers.
-
Sample N: 401 centers (200 for-profit and 201 non-profit), 228 infant/toddler classrooms, 521 preschool classrooms; 826 preschool children; 795 teachers
-
Administrators of programs in the sampling area participated in telephone interviews, then if given permission, researchers collected data at each of the centers.
-
Researchers observed classrooms at each center and collected most information about center and staff collected through a director interview.
-
Additionally, all staff observed in classrooms also completed staff questionnaires that were adapted from the National Child Care Staffing Study.
-
Limitations:
ο Multistate sample, not a random sample of the entire population
ο Date of study
Source
Helburn, S. W. 1995. Cost, quality, and child outcomes in child care centers, technical report. Denver, CO: University of Colorado, Department of Economics, Center for Research in Economic and Social Policy.
National Child Care Staffing Study (NCCSS)
-
Study Dates: 1988, 1992, and 1997
-
Agency: Center for Child Care Workforce
-
The study is based on a cross-section of 227 child care centers in Atlanta, Boston, Detroit, Phoenix, and Seattle.
-
Five sites were chosen because they varied based on: level of quality required by each state in child care regulations, geographic region, relative distributions of for-profit and non-profit centers, and the attention accorded to child care staffing issues in state and local policy initiatives.
ο Three sites participated in the Cost Effects Study of the National Day Care Study in 1977 (Atlanta, Detroit, Seattle)
-
Within each state pool of centers identified through lists of licensed child care centers
ο Pool within each state then divided into six groups: based on low-, middle-, and high-income tracts, and urban or suburban neighborhoods
-
1988 Sample N: 643 classrooms with 1,309 teaching personnel, 865 teachers (805 teachers and 60 teacher/directors), 444 assistants (286 asst teachers and 158 aides)
-
1992 Sample N: 193 centers, just re-interviewing directors
-
1997 Sample N: 157 centers, just interviewing directors
-
The study is not based on a national random sample, but does represent centers of varying population size, residential location, auspice, and quality.
-
Data were collected through classroom observations and interviews with center directors and staff.
-
Limitations:
ο Sample is not a national random sample
ο Multicity study
Sources
Whitebook, M., C. Howes, and D. Phillips. 1990. Who cares? Child care teachers and the quality of care in America. Final report: National Child Care Staffing Study. Oakland, CA: Child Care Employee Project.
Whitebook, M., D. Phillips, and C. Howes. 1993. National Child Care Staffing Study revisited: Four years in the life of center-based care. Oakland, CA: Child Care Employee Project.
Whitebook, M., C. Howes, and D. Phillips. 1998. Worthy work, unlivable wages: The National Child Care Staffing Study, 1988-1997. Oakland, CA: Child Care Employee Project.
National Day Care Study (NDCS)
-
Study Dates: 1976–1977
-
The study is a nationally representative survey of centers that restricted its coverage to centers operating at least 25 hours per week and 9 months per year, with a licensed capacity of 12 or more children and enrollments including 50 percent or fewer handicapped children.
-
Sample Population: Centers selected from national lists constructed from state licensing lists
ο 18,307 centers with 897,700 children met selection criteria
-
Sample N: 3,167 centers
-
Limitations:
ο Year of study
ο Multi-state study
Source
Kisker, E. E., S. L. Hofferth, D. A. Phillips, and E. Farquhar. 1991. A profile of child care settings: Early education and care in 1990. Princeton, NJ: Mathematica Policy Research, Inc.; Washington, DC: Department of Education.
National Day Care Home Study (NDCHS)
-
Study Dates: 1976–1980
-
The study consists of a series of case studies of home-based care.
-
The sample consists of both regulated and unregulated family day care homes in three urban areas (Los Angeles, Philadelphia, and San Antonio).
-
Sample N: 793 family day care providers
-
Limitations:
ο Year of study
ο Multistate study
Source
Kisker, E. E., S. L. Hofferth, D. A. Phillips, and E. Farquhar. 1991. A profile of child care settings: Early education and care in 1990. Princeton, NJ: Mathematica Policy Research, Inc.; Washington, DC: Department of Education.
V. Multistate; Cover Portion of B–5 Workforce and Settings; e.g., Prekindergarten
National Center for Early Development and Learning’s Multi-State Pre-Kindergarten Study
-
Study Dates: 2001–2002 school year
-
Agency: NCEDL
ο http://www.fpg.unc.edu/~ncedl/
ο http://www.fpg.unc.edu/~ncedl/pages/pre-k_study.cfm
-
The study is a stratified random sample of 237 lead teachers and 939 children in state-funded prekindergarten classrooms from six states (California, Georgia, Illinois, Kentucky, New York, and Ohio).
-
Sample Population: The sample was drawn from a list of programs/centers provided by each state department of education.
-
Researchers then stratified the sample in all states to maximize diversity with regard to teachers’ education, program location, and program length.
-
Sample N: 237 lead teachers and 939 children in state-funded prekindergarten classrooms from six states
-
Limitations:
ο Sample restricted to teachers in state-funded prekindergarten classrooms from six states
Sources
Early, D. M., D. M. Bryant, R. C. Pianta, R. M. Clifford, M. R. Burchinal, S. Ritchie, C. Howesc, and O. Barbarin. 2006. Are teachers’ education, major, and credentials related to classroom quality and children’s academic gains in prekindergarten? Early Childhood Research Quarterly 21:174-195.
Pianta, R., C. Howes, M. Burchinal, D. Bryant, R. Clifford, D. Early, and O. Barbarin. 2005. Features of prekindergarten programs, classrooms, and teachers: Prediction of observed classroom quality and teacher-child interactions. Applied Developmental Science 9(3):144-159.
National Center for Early Development and Learning’s Statewide Early Education Programs Survey (SWEEP)
-
Study Dates: 2003–2004 school year
-
Agency: NCEDL
-
This study is a stratified random sample of 465 lead teachers and 1,840 children in state-funded prekindergarten classrooms from five states (Massachusetts, New Jersey, Texas, Washington, and Wisconsin).
-
Sample Population: The sample was drawn from a list of programs/centers provided by each state department of education.
-
Researchers then stratified the sample in all states to maximize diversity with regard to teachers’ education, program location, and program length.
-
Prekindergarten programs in these five states were chosen because the states had models differing from those in the MSSPK study.
-
Sample N: 465 lead teachers and 1,840 children in state-funded prekindergarten classrooms from five states
-
Limitations:
ο Sample restricted to teachers in state-funded prekindergarten classrooms from five states
Source
Early, D., O. Barbarin, D. Bryant, M. Burchinal, F. Chang, R. Clifford, G. Crawford, W. Weaver, C. Howes, S. Ritchie, M. Kraft-Sayre, R. Pianta, and W. S. Barnett. 2005. Prekindergarten in eleven states: NCEDL’s multi-state study of pre-kindergarten and Study of State-Wide Early Education Programs (SWEEP): Preliminary descriptive report. NCEDL Working Paper [combined results for Multi-State Pre-K Study and SWEEP]. Chapel Hill, NC: Frank Porter Graham Child Development Institute.
NICHD Study of Early Child Care and Youth Development (SECCYD)
-
Study Dates: Five phases from 1991–2007
-
Agency: National Institute of Child Health and Human Development, Early Child Care Research Network
ο http://www.nichd.nih.gov/research/supported/seccyd/overview.cfm
-
Phase I, ages 0–3: 1991–1994 (1,364 children)
-
Phase II, through 1st grade: 1995–1999 (1,226)
-
Phase III, through 6th grade: 2000–2004 (1,061)
-
Phase IV, through 9th grade: 2005–2007 (1,009)
-
Caregivers of children in the study interviewed when children were at 15 months, 24 months, and 36 months
-
Sample N: Caregivers for 1,216 children; 907 caregivers for 15-month-olds; 976 caregivers for 24-month-olds; 1,109 caregivers for 36-month-olds
-
Limitations:
ο Sampling based on the children, not the caregivers
Sources
National Institute of Child Health and Human Development, Early Child Care Research Network. 1996. Characteristics of infant child care: Factors contributing to positive caregiving. Early Childhood Research Quarterly 11(3):269-306.
National Institute of Child Health and Human Development, Early Child Care Research Network. 2000. Characteristics and quality of child care for toddlers and preschoolers. Applied Developmental Science 4(3):116-135.
VI. Single State; Cover All B–5 Workforce
Arizona
Survey of Arizona’s Early Education Workforce
-
Survey Dates: 1997, 2001, 2004
-
Agency: Arizona State Board on School Readiness, Governor’s Office of Children, Youth, and Families, Association for Supportive Child Care, and Children’s Action Alliance
-
Telephone survey of all licensed early education employers in the state, excluding home-based businesses
-
Sample Population: 2,117 licensed sites in September 2004 that provided care
-
Sample N: 1,308 center administrators, 1,228 individual interviews in 2,142 programs
-
Data are provided for teachers, assistant teachers, teacher directors, administrative directors
Source
Compensation and credentials: A survey of Arizona’s early education workforce. 2005. Arizona State Board on School Readiness, Governor’s Office of Children, Youth, and Families, Association for Supportive Child Care, and Children’s Action Alliance, http://www.azchildren.org/MyFiles/PDF/CC_Compensation_Credentials.pdf.
California
California Early Care and Education Workforce Study
-
Study Date: 2005
-
Agency: Center for the Study of Child Care Employment and California Child Care Resource and Referral Network
-
Statewide survey of CA licensed child care workforce
-
Survey Population: Survey population included the 37,366 active licensed homes and 8,740 active licensed centers, serving children from birth to age 5, that were listed as of January 2004 with state-funded child care resource and referral agencies
-
Statewide random sample of 1,800 licensed family child care homes and 1,921 centers, using a CATI system.
-
Sample N: Center Survey
ο Sample population included 8,740 active licensed centers
ο 400 centers in four regions of the state
ο 1,921 total interviews with directors in centers that are licensed to care for children from birth to 23 months (infants) and/or from 2 to 5 years old and not yet in kindergarten (preschoolers)
ο Provide weighted estimates of the population of CA centers licensed to serve infants and/or preschoolers
-
Sample N: FCC Survey
ο Survey population included all 37,366 of the active licensed family child care homes
ο 400 homes in four regions
Sources
Whitebook, M., L. Sakai, F. Kipnis, Y. Lee, D. Bellm, M. Almaraz, and P. Tran. 2006. California Early Care and Education Workforce Study: Licensed child care centers. Statewide 2006. Berkeley, CA: Center for the Study of Child Care Employment; San Francisco, CA: California Child Care Resource and Referral Network, http://www.irle.berkeley.edu/cscce/2006/california-early-care-and-education-workforce-study/.
Whitebook, M., L. Sakai, F. Kipnis, Y. Lee, D. Bellm, R. Speiglman, M. Almaraz, L. Stubbs, and P. Tran. 2006. California Early Care and Education Workforce Study: Licensed family child care providers. Statewide 2006. Berkeley, CA: Center for the Study of Child Care Employment; San Francisco, CA: California Child Care Resource and Referral Network.
Whitebook, M., F. Kipnis, and D. Bellm. 2008. Diversity and stratification in California’s early care and education workforce. Berkeley, CA: Center for the Study of Child Care Employment, University of California.
Changes in Child Care Staffing Study
-
Study Dates: Three Waves, 1994, 1996, 2000
-
Agency: CCW
-
This study focuses on staffing crisis in early childhood education and conducts a survey of caregivers in three areas of CA.
-
Based in three Bay Area communities of Santa Cruz, San Mateo, and Santa Clara in Northern California
-
Longitudinal study of center caregivers from 1994 through 2000
-
Data come from interviews and classroom observations.
-
Sample Population: NAEYC-accredited centers in three CA communities
-
Sample N 1994 and 1996: 92 centers (observations and interviews in all), two preschool classrooms per center; 266 teaching staff observed in 1994; 260 staff observed in 1996
ο Generally classrooms serving 2.5- to 5-year-olds
-
Sample N 2000: 75 centers (85 percent of 1996 sample), 43 observed, 32 interview-only, observed 117 teaching staff, 83 teachers, 20 assistants, 14 teacher-directors; 75 directors—interviews providing information about staff at the center
-
Total staff at 75 centers: 435 teachers, 182 assistants, 42 teacher-directors
Source
Whitebook, M., L. Sakai, E. Gerber, and C. Howes. 2001. Then and now: Changes in child care staffing, 1994-2000. Berkeley, CA: Center for the Study of Child Care Employment; San Francisco, CA: California Child Care Resource and Referral Network.
Infrastructure Survey
-
Non-random and not a complete census survey
-
Online survey with SurveyMonkey
-
2009: surveyed a population of 1,588 persons who work in three types of early childhood infrastructure organizations in California—child care resource and referral programs, local First 5 commissions and as child care coordinators
-
1,091 completed interviews; 69 child care coordinators and staff, 285 First 5 staff, 737 R&R staff
Source
Whitebook, M. L., and F. Kipnis. 2010. Beyond homes and centers: The workforce in three California early childhood infrastructure organizations. Berkeley, CA: Center for the Study of Child Care Employment, Institute for Research on Labor and Employment, University of California, http://www.irle.berkeley.edu/cscce/wp-content/uploads/2010/08/beyond_homes_and_centers_es_100602-web-version.pdf.
Florida
Child Care Workforce Study
-
Study Date: 2006
-
Agency: Children’s Forum, Inc.
-
Sample Population: Beginning sample of 275 cases in May 2006, 136 child care centers (CCCs) and 139 family child care homes (FCCHs)
ο All centers were located in Seminole County, FL
-
Surveyed entire population and adapted surveys from the CCW
ο 132 surveys returned, 88 CCCs and 44 FCCHs
-
Sample N: 88 CCCs: 894 teachers, 334 assistant teachers, 71 teacher-directors, 94 directors (1,393 personnel)
Source
Esposito, B., and P. Kalifeh. 2006. Child Care Workforce Study. The Early Learning Coalition of Seminole and Children’s Forum, Inc. http://www.fcforum.org/downloads/publications/Seminole%20WorkforceStudy%202006.pdf.
Illinois
Illinois Department of Human Services (IDHS) Illinois Salary and Staffing Survey of Licensed Child Care Facilities
-
Study Dates: 2007, 2009
-
Agency: IDHS
-
Sample Population: all 13,953 facilities, 3,196 licensed child care centers and 10,757 licensed family child care home providers, who were listed in the Illinois Network of Child Care Resources & Referral Agencies (INCCRRA) database as providing care as of December 31, 2008
-
Sample N 2007: 2007 sample of 13,467 licensed child care providers
-
Sample N 2009: 2009 sample of 13,953 licensed child care providers
-
Survey invitations were sent to all 13,953 facilities, 3,196 licensed child care centers and 10,757 licensed family child care home providers, who were listed in the INCCRRA database as providing care as of December 31, 2008.
-
Of the 585 centers responding to the survey, 43 (7.14 percent) were completed by owners, 110 (18.27 percent) by owner/directors, 308 (51.16 percent) by directors, 72 (11.96 percent) by director/ teachers, and 52 (8.64 percent) by other personnel, including assistant/associate directors, human resources personnel, business/ fiscal personnel, executive directors, and site directors. Seventeen respondents did not report a title.
Sources
Garnier, P. C. 2008. IDHS Illinois Salary and Staffing Survey of Licensed Child Care Facilities: FY2007. Department of Human and Community Development, University of Illinois at Urbana-Champaign for the Illinois Department of Human Services, http://www.dhs.state.il.us/page.aspx?item=38614.
Wiley, A. R., S. King, and P. C. Garnier. 2009. IDHS Illinois Salary and Staffing Survey of Licensed Child Care Facilities: FY2009. Department of Human and Community Development, University of Illinois at Urbana-Champaign, http://www.dhs.state.il.us/page.aspx?item=49144.
Status of Early Childhood Workforce in Illinois, 2008
-
Reports results of IDHS Illinois Salary and Staffing Survey with some added surveys
-
Three statewide surveys: (1) 400 administrators of child care centers, (2) 800 lead teachers in community-based care and Head Start, (3) 150 teachers in public school settings
Source
Fowler, S., P. J. Bloom, T. Talan, S. Beneke, and R. Kelton. 2008. Who’s caring for the kids? The status of the early childhood workforce in Illinois. Wheeling, IL: McCormick Tribune Center for Early Childhood Leadership, National-Louis University, and Early Childhood Parenting Collaborative, University of Illinois, http://cecl.nl.edu/research/reports/whos_caring_report_2008.pdf.
Indiana
Survey of Teachers and Directors Working in Licensed Child Care Centers and Unlicensed Child Care Ministries
-
Study Date: 2007
-
Agency: Indiana Association for the Education of Young Children, Inc.
-
Study consists of a mail survey in Indiana in 2007
-
Sample Population: Originally mailed to all located centers: 1,235 directors and 14,834 teachers
-
Sample N: Final response: 5,102 teachers and 668 directors
Source
Indiana Association for the Education of Young Children. 2007 Working in child care in Indiana: 2007 special report on teachers and directors working in licensed child care centers and unlicensed registered child care ministries. Indiana Association for the Education of Young Children, http://editor.ne16.com/iaeyc/2007_Workforce_Study_SpecialReport.pdf.
Iowa
Early Care and Education Workforce Study, 2003
-
Little information about study design and sample in report
Source
Who’s caring for Iowa’s children: Early Care and Education Workforce Study 2003. Iowa Early Care & Education Professional Development Project, http://www.extension.iastate.edu/Publications/SP222.pdf.
Maine
Maine Child Care Market Rate and Workforce Study
-
Study Date: 2002
-
Agency: Mills Consulting Group, Inc.
-
Two surveys, distributed by mail to all licensed child care centers (N = 712) and to all licensed family child care providers (N = 2054) using the Office of Child Care and Head Start licensing list
-
Sample Population: all licensed centers and providers in Maine
-
Sample N: 1,878 surveys, 415 from centers completed and returned
-
Data based on telephone interviews and a focus group with child care providers
Source
Maine Child Care Market Rate and Workforce Study. 2002. Mills Consulting Group, funded by Office of Child Care and Head Start, Community Services Center, Department of Human Services, State of Maine, http://www.maine.gov/dhhs/ocfs/ec/occhs/workforcereport.pdf.
Minnesota
Child Care Workforce in Minnesota
-
Study Dates: 2006–2007
-
Agency: Minnesota Department of Human Services, Wilder Research
-
The Minnesota Child Care Resource and Referral (CCR&R) Network provided Wilder Research a data file with all the current licensed family child care providers, child care centers, preschool sites and school-age care sites, including names, addresses, and phone numbers. The lists were stratified by metro area and greater Minnesota and then randomized.
-
Surveys with 354 randomly selected licensed family child care providers and an over-sample of 149 American Indian, Hmong, Latino, and Somali licensed family child care providers; a two-part survey with 328 center-based programs and 1,162 directors and teaching staff; and nine focus groups with 77 providers and teachers
-
Estimated 12,334 licensed family child care providers and center-based programs
-
The estimated size of Minnesota’s child care workforce is 36,500, which includes about 14,700 providers and paid assistants in the licensed home-based workforce and about 21,800 staff in the center-based workforce, including 2,050 directors, 9,150 teachers, 5,000 assistant teachers, and 5,600 aides
Source
Chase, R., C. Moore, S. Pierce, and J. Arnold. 2007. Child care workforce in Minnesota, 2006 statewide study of demographics, training and professional development: Final report. Minnesota Department of Human Services, http://www.wilder.org/download.0.html?report=1985.
New York
New York City Early Childhood Educators Survey
-
Study Date: 2006
-
Agency: NYC Early Childhood Professional Development Institute
-
Surveyed directors, teachers, and assistant teachers in licensed community- and school-based early childhood centers in New York City serving children birth to 5 years old
-
Including Head Start/Early Head Start, Universal Pre-kindergarten (UPK), Administration for Children Services (ACS), private, and blended/multitype
-
A proportionate random sample of the centers was selected in such a way as to ensure sufficient representation from various types of community-based programs.
-
Sampling Population: 2,727 licensed community and school based centers
-
Sample N: 525 school-based UPK programs and 850 community-based centers within the 5 boroughs and 10 school districts
Source
Ochshorn, S., and M. Garcia. 2007. Learning about the workforce: A profile of early childhood educators in New York City’s community- and school-based centers. New York City Early Childhood Professional Development Institute and Cornell University Early Childhood Program, http://www.earlychildhoodnyc.org/pdfs/eng/FinalReport.pdf.
North Carolina
North Carolina Child Care Workforce Survey
-
Study Dates: Spring and Summer 2003
-
Agency: Child Care Services Association and FPG Child Development Institute
-
Sample N: Survey response rates were 78 percent of center directors (N = 2,203 director surveys collected), 52 percent of teachers (N = 13,120 teacher surveys collected), and 78 percent of family child care providers (N = 2,337 family child care provider surveys collected)
-
Sampling based on county workforce size was used to create representative samples within each county.
Sources
Working in child care in Durham County: Durham Workforce Study 2009. Durham’s Partnership for Children, a Smart Start Initiative, http://dpfc.net/Admin/uploads/photos/Documents/reports/WorkforceStudyFullReportFinal11.17.pdf.
Working in child care in North Carolina: The North Carolina Child Care Workforce Survey 2003. North Carolina Early Childhood Needs and Resources Assessment, Child Care Services Association, Frank Porter Graham Child Development Institute, http://www.childcareservices.org/_downloads/NC2003wfreport.pdf.
Ohio
Workforce Study of Ohio Early Childhood Centers
-
Study Date: April 2005
-
Agency: Ohio Child Care Resource and Referral Association
-
Survey packets were sent to 3,600 randomly selected centers in April 2005, representing centers licensed by the Ohio Department of Job and Family Services (ODJFS) and, for the first time, programs licensed by the Ohio Department of Education (ODE)
-
Overall, 989 centers responded, representing 388 ODE-licensed programs and 577 ODJFS-licensed programs. In the 2001 Ohio Association for the Education of Young Children (OAEYC) survey, 314 ODJFS-licensed centers responded.
Sources
2005 Workforce Study: Ohio early childhood centers, a profession divided. 2006. Columbus, OH: Ohio Child Care Resource and Referral Association.
2005 Workforce Study: Ohio early childhood centers, general analysis. 2006. Columbus, OH: Ohio Child Care Resource and Referral Association, http://www.ohpdnetwork.org/documents/workforce_general.pdf.
Oregon
-
Few study/data details
Source
Investing in young kids = investing in their teachers: Building Oregon’s early education workforce. 2008. Children’s Institute, http://www.childinst.org/images/stories/ci_publications/ci-investing-in-youg-kids-2008.pdf.
Pennsylvania
Early Care and Education Provider Survey
-
Study Date: 2002
-
Agency: University of Pittsburgh Office of Child Development and Universities Children’s Policy Collaborative (UCPC)
-
Sampling Population: 15,220 early care and education sites, including 5,067 potential legally unregulated providers, representing a potentially exhaustive list of licensed and registered facilities within the classifications
-
Attempted to contact 4,243 sites
-
Interviews with 600 representative provider sites (stratified by six categories of providers and three categories of the population density of the county)
Source
Etheridge, W. A., R. B. McCall, C. J. Groark, K. E. Mehaffie, and R. Nelkin. 2002. A baseline report of early care and education in Pennsylvania: The 2002 Early Care and Education Provider Survey. University of Pittsburgh Office of Child Development and the Universities Children’s Policy Collaborative (UCPC), http://www.prevention.psu.edu/ece/docs/FullReport1.pdf.
South Dakota
Child Care and Education Workforce Survey
-
Study Date: 2003
-
General report not very detailed, not summarized in table
-
Early childhood workforce survey conducted by South Dakota KIDS COUNT and the University of South Dakota School of Education
-
Survey mailed to child care centers, group family child care programs, Out-of-School-Time and Head Start programs in South Dakota
-
Did not include Family Child Care Home programs
-
156 surveys returned (response rate of 40 percent)
ο 70 child care centers
ο 43 group family child care programs
ο 36 Out-of-School-Time programs
ο 7 Head Start programs
-
Responding programs were located in 84 cities across the state, representing 46 counties.
-
The results portray factors that influence approximately 1,900 program employees and 2,499 children.
Source
Who cares for children in South Dakota? Child Care and Early Education Workforce Survey executive summary. 2004. South Dakota KIDS COUNT and the University of South Dakota School of Education, http://dss.sd.gov/childcare/docs/whoc%20cares%20for%20children%20in%20sd.pdf.
Utah
Study of the Childcare Workforce in Utah
-
Study Date: 2002
-
Agency: Mills Consulting Group, Inc. and Utah Office of Child Care
-
A statewide survey of all licensed child care centers, school-age child care programs, and legally licensed exempt providers, and a sampling of residential certificate holders and licensed family and group providers
-
Sampling Population: The survey sample was composed of all child care centers, school-age programs, and legally-licensed exempt programs.
-
April 2002, a total of 1,415 surveys were sent to all child care centers, school-age programs, and legally licensed exempt programs, and to the sample of residential certificate holders and licensed family child care provider
-
Two separate survey tools: one tailored for center-based, school-age and legally licensed exempt programs and another tailored for family child care providers and residential certificate holders
-
Sample N: Response rates: 44 percent of child care programs (199 of 457), 62 percent of child care providers (594 of 958)
Source
A study of the child care workforce in Utah: Summary. 2002. Utah Office of Child Care, http://jobs.utah.gov/opencms/occ/occ2/learnmore/other/workforcesummary.pdf.
Vermont
Too small, not random
Defining Our Workforce Survey
-
2007
-
106 surveys collected, 91 at May conference, 11 through other sources
Vermont Afterschool Professionals Survey
-
2007
-
291 surveys
Source
Feal-Staub, L., and H. Morehouse. 2008. Afterschool professionals report for the National Career Pathways Project: Data collection, analysis, and synthesis, http://dcf.vermont.gov/sites/dcf/fles/pdf/cdd/care/National_Career_Pathways_Project_Report.pdf.
Virginia
Child Care Workforce Study in Metro-Richmond, Virginia
-
Study Date: 2003
-
Agency: Voices for Virginia’s Children
-
There are approximately 350 child care centers in the metro-
Richmond region, providing early care and education to almost 11,000 children under the age of 6; there are an additional 332 family home providers in the metro-Richmond region, serving approximately 6,000 children.
-
Surveys were mailed to child care centers to be completed by the directors and teachers and to family home providers.
-
Between March 28, 2003, and July 15, 2003, 576 teacher surveys, 109 director surveys, and 121 family home provider surveys were completed and returned. The response rates were 17.4 percent (teacher surveys), 30.7 percent (director surveys), and 36.4 percent (family home provider surveys).
-
Although the response rates may not have been as high as desired, the teachers, directors, and family home providers were evenly spread over the entire geographic area, and they came from a balanced sample of for-profit, non-profit, faith-based, licensed, and voluntarily registered sites.
Source
Child care workforce study in metro Richmond, Virginia: A status report on the child care workforce. 2004. Voices for Virginia’s Children, http://www.vakids.org/pubs/Archives/ECE/workforce_study.pdf.
Wisconsin
Wisconsin Child Care Worker Survey
-
4 surveys: 1980, 1988, 1994, 2001
-
Agency: Wisconsin Early Childhood Association (WECA)
-
1980 (Edie and Frudden): 1,074 full-day child care centers and 278 family child care homes
-
1988 (Rily and Rodgers): 86 center directors, 171 teachers, 96 family day care providers
-
1994 (Burton et al.): stratified random sample of 104 center directors, 254 teachers, 185 licensed family care providers, 141 certified providers
-
2001 (Adams et al.): random sample of 2,000 child care programs; 342 center directors, 784 teachers, 452 family child care providers
Sources
Adams, D., M. Roach, D. Riley, and D. Edie. 2001. Losing ground or keeping up? A report on the Wisconsin early care and education workforce. Unpublished manuscript.
Adams, D., D. Durant, D. Edie, M. Ittig, D. Riley, M. Roach, S. Welsh, and D. Zeman. 2003. Trends over time: Wisconsin’s child care workforce. Madison, WI: Wisconsin Early Childhood Association (WECA), http://wisconsinearlychildhood.org/.
Burton, A., M. Whitebook, L. Sakai, M. Babula, and P. Haack. 1994. Valuable work, minimal rewards: A report on the Wisconsin child care work force. National Center for the Early Childhood Work Force. Unpublished manuscript.
Edie, D., and G. Frudden. 1980. A study of day care workers in Wisconsin. Unpublished manuscript.
Riley, D., and K. Rodgers. 1988. Pay, benefits, and job satisfaction of Wisconsin child care providers and early childhood teachers. Unpublished manuscript.
VII. Single State; Cover Portion of B–5 Workforce and Settings, e.g., Prekindergarten
California
Changes in Child Care Staffing Study
-
Study Date: Three waves, 1994, 1996, 2000
-
Agency: Center for the Child Care Workforce (CCW)
-
This study focuses on the staffing crisis in early childhood education and conducts a survey of caregivers in three areas of California.
-
Based in three Bay Area communities of Santa Cruz, San Mateo, and Santa Clara in Northern California
-
Longitudinal study of center caregivers from 1994 through 2000
-
Data come from interviews and classroom observations
-
Sample Population: NAEYC-accredited centers in three CA communities
-
Sample N 1994 and 1996: 92 centers (observations and interviews in all), 2 preschool classrooms per center; 266 teaching staff observed in 1994; 260 staff observed in 1996
ο Generally classrooms serving 2.5- to 5-year-olds
-
Sample N 2000: 75 centers (85 percent of 1996 sample), 43 observed, 32 interview only, observed 117 teaching staff, 83 teachers, 20 assistants, 14 teacher-directors; 75 directors—interviews providing information about staff at the center
-
Total staff at 75 centers: 435 teachers, 182 assistants, 42 teacher-directors
Source
Whitebook, M., L. Sakai, E. Gerber, and C. Howes. 2001. Then and now: Changes in child care staffing, 1994-2000. Berkeley, CA: Center for the Study of Child Care Employment; San Francisco, CA: California Child Care Resource and Referral Network.
Massachusetts
Massachusetts Cost Quality Studies
-
Study Dates: 2000–2001
-
Agency: Wellesley Centers for Women and Abt Associates Inc.
-
Studies in three parts: Center Study, Public Preschool Study, and Family Child Care Study
-
Focuses on those serving 3–5-year-olds
-
2004: centers with capacity to serve 91,232 3–5-year-olds, 7,369 family child care homes with capacity for 29,476; Head Start providing preschool education for 12,969 children in 163 programs; 22,533 children ages 3–5 enrolled in preschool classrooms in 466 public schools
Source
Marshall, N., J. Dennehy, C. Johnson-Staub, and W. Robeson. 2005. Massachusetts capacity study research brief: Characteristics of the current early education and care workforce serving 3–5-year-olds. Wellesley Centers for Women and Abt Associates Inc., http://www.wcwonline.org/earlycare/workforcefindings2005.pdf.
Cost Quality (CQ) Center Study
-
Study Date: 2000
-
Agency: Wellesley Centers for Women and Abt Associates Inc.
-
Random sample of 90 community-based centers serving preschoolers on a full-day full-year basis; 65 percent response rate
-
Drawn from across the state in proportion to the region’s market share of the state’s center-based ECE market
Source
Marshall, N. L., C. L. Creps, N. R. Burstein, F. B. Glantz, W. Wagner Robeson, and S. Barnett. 2001. The cost and quality of full-day, year-round early care and education in Massachusetts: Preschool classrooms. Wellesley, MA: Wellesley Centers for Women and Abt Associates Inc.
CQ Public Preschool Study
-
Study Date: 2000
-
Agency: Wellesley Centers for Women and Abt Associates Inc.
-
Random sample of 95 school-based, publicly administered preschool classrooms, from a list of all schools housing preschool classrooms, as reported to the Department of Education by school districts from around the state
Source
Marshall, N. L., C. L. Creps, N. R. Burstein, F. B. Glantz, W. Wagner Robeson, S. Barnett, J. Schimmenti, and N. Keefe. 2002. Early care and education in Massachusetts public school preschool classrooms. Wellesley, MA: Wellesley Centers for Women and Abt Associates Inc.
CQ Family Child Care Study
-
Study Dates: 2000–2001
-
Agency: Wellesley Centers for Women and Abt Associates Inc.
-
Random sample of licensed family child care homes (FCCHs) from MA Office for Child Care Services (OCCS)
-
203 participating in study (57 percent of those selected)
Source
Marshall, N. L., C. L. Creps, N. R. Burstein, K. E. Cahill, W. Wagner Robeson, S. Y. Wang, N. Keefe, J. Schimmenti, F. B. Glantz. 2005. Massachusetts family child care Today: A report of the findings of the Massachusetts Cost/Quality Study: Family child care homes. Wellesley, MA: Wellesley Centers for Women and Abt Associates Inc.
FEDERAL DATA SOURCES FOR UNDERSTANDING THE EARLY CHILDHOOD CARE AND EDUCATION WORKFORCE: A BACKGROUND PAPER
April 22, 2011
Prepared by Dixie Sommers, Assistant Commissioner, Bureau of Labor Statistics, for the Institute of Medicine–National Research Council’s Early Childhood Care and Education Workforce: Phase One Planning Committee
PURPOSE
This background paper provides information about data sources produced by the Bureau of Labor Statistics (BLS) and the Census Bureau relevant to understanding the Early Childhood Care and Education (ECCE) workforce. The information presented is based on discussions of the workshop planning committee.
The paper begins with descriptions of the two major classification systems used in BLS and Census data, the North American Industry Classification System (NAICS) and the Standard Occupational Classification (SOC). Both the occupational and industry dimensions of the workforce are useful in identifying ECCE jobs, workers, and establishments and understanding their characteristics and trends. In general, industry classifications depict the economy according to the type of products or services produced, while occupations are based on the type of work performed. Understanding the foundations of the classifications and how they are developed and revised will assist ECCE researchers both in their use of industry and occupational data and in preparing recommendations for the next NAICS and SOC revisions.
The descriptions of the NAICS and SOC are followed by a discussion of issues these classifications present for ECCE workforce analysis. Additional issues concerning BLS and Census data (referred to as the “standard data sources”) for ECCE purposes are also discussed.
The remainder of the paper profiles the relevant data sources from the Department of Labor and the Census Bureau, using a template format to present key metadata, and including a brief assessment of advantages and limitations of the data sources for ECCE purposes.
NORTH AMERICAN INDUSTRY CLASSIFICATION SYSTEM
Federal economic data often provide information about industries, such as manufacturing or retail trade. In federal statistics, the Office of
Management and Budget (OMB) requires that industries be classified using the North American Industry Classification System or NAICS.
NAICS groups establishments into industries based on the similarity of their production processes. An establishment, as defined by the BLS, is a physical location of a certain economic activity—for example, a factory, mine, store, or office. An enterprise10 (a private firm, government, or non-profit organization) can consist of a single establishment or multiple establishments. Depending on their products or activities, all establishments in an enterprise may be classified in one industry, or they may be classified in different industries. In the ECCE context, establishments include child care centers, schools, private homes, and any other type of establishment where ECCE services are provided.
The 2007 NAICS is a tiered system with five levels, ranging from 20 industry sectors to 1,175 detailed industries. Each establishment is classified into only one of the detailed industries based on its principal product or activity, usually determined by annual sales volume. Each detailed industry has a code, title, and definition; it may also have illustrative examples of products or services and cross-references to other industries. The coding system uses a six-digit code, with the first two digits indicating the major industry sector.
Developing and Revising the NAICS
The NAICS replaced the Standard Industry Classification, or SIC, in 1997, providing a common industry classification for use in the United States, Canada, and Mexico. The NAICS structure was developed through trilateral meetings to consider public proposals from each country. In the United States, OMB established the interagency Economic Classification Policy Committee (ECPC), chaired by the Census Bureau, to develop classification proposals.11
NAICS is developed to serve statistical purposes, such as collecting and tabulating statistical information; while it may be used for administrative, regulatory or taxation purposes, these purposes played no role in its development or revision.
The most recent edition is the 2007 NAICS.12 The ECPC has provided
![]()
10 “Enterprise” in this context is used differently from “enterprise” as defined in the conceptual definition presented at the workshop.
11 Information about the NAICS is available at http://www.census.gov/eos/www/naics/. Information about BLS application of the NAICS is available at http://www.bls.gov/bls/naics.htm.
12 In both the NAICS and SOC, the edition year is not the year of publication but the year in which implementation is expected, ideally the reference year of the first data on the new classification.
recommendations to OMB for the 2012 revision, and OMB is expected to publish the final 2012 NAICS soon. In preparing the 2012 revision, OMB and the ECPC solicited public input through three Federal Register Notices. The NAICS is revised on a 5-year cycle, with the next revision scheduled for implementation in 2017.
Standard Occupational Classification
Labor market data often provide information about occupations: the number of workers, trends in employment, pay and benefits, demographic characteristics, and other items. To ensure that occupational data from across the federal statistical system are comparable and can be used together in analysis, OMB has established the Standard Occupational Classification, or SOC.13
The 2010 SOC is a tiered system with four levels, ranging from 23 major groups to 840 detailed occupations. Each worker is classified into only one of the detailed occupations based on the tasks he or she performs. Each detailed occupation has a code, title, definition, and may have illustrative examples. The coding system uses a six-digit code, with the first two digits indicating the major occupation group. An online “direct match title file” provides job titles that should be assigned to one and only one detailed SOC occupation.
Developing and Revising the SOC The SOC was first issued in 1977, with a subsequent revision in 1980, but neither of these versions was widely used. With the implementation of the 2000 SOC, for the first time all major occupational data sources produced by the federal statistical system provided comparable data, greatly improving the usefulness of the data. The most recent revision resulted in the 2010 SOC, which is now being implemented in federal data collection programs.
As with the NAICS, the SOC is developed to serve statistical purposes. While the SOC may be used for other purposes, these purposes play no role in its development or revision.
Revising the SOC is a multiyear process, as demonstrated by the milestones for the 2010 revision. The process began in 2005, when OMB convened the interagency Standard Occupational Classification Policy Committee (SOCPC), chaired by the Bureau of Labor Statistics. The SOCPC is charged with developing recommendations to OMB for changes in the SOC. After receiving public comments in response to two Federal Register Notices, issued in May 2006 and May 2008, the SOCPC made final recom-
![]()
13 Much of this discussion of the SOC is drawn from the Introduction to the 2010 Standard Occupational Classification Manual. See http://www.bls.gov/soc/#publications.
mendations to OMB that were published in January 2009. The 2010 SOC Manual, which provided the definitions, was published in March 2009.
The SOCPC has proposed that the next revision of the SOC will result in a 2018 edition, with the revision work expected to begin in 2013. This revision schedule is intended to minimize disruption to data providers, producers, and users by promoting simultaneous adoption of revised occupational and industry classification systems for those data series that use both. This is best accomplished by timing revisions of the SOC for the years following NAICS revisions. The next such year is 2018, which has the additional benefit of coinciding with the beginning year of the American Community Survey’s next 5-year set of surveys. OMB intends to consider revisions of the SOC for 2018 and every 10 years thereafter.
SOC Classification Principles The Classification Principles listed in Box B-1 are the basis of SOC structure. The SOCPC referred to these principles in making decisions about the creation or modification of detailed occupations and their placement in the SOC. Thus, in considering any recommendation for changing or adding an occupation, the SOCPC needs information about how the recommendation is consistent with the Classification Principles.
Classification Principles 1 and 2 are fundamental to the SOC and apply across all occupations. Because the purpose of the SOC is for preparing statistical information on the workforce, it is important to specify its scope. Principle 1 does this by specifying that the SOC covers all work performed for pay or profit, and specifying that occupations unique to volunteer work are not included. In the ECCE context, the SOC is used to classify workers who provide early childhood care and instruction and who receive wage or salary pay or self-employment income for providing these services. Specific SOC occupations related to these activities are discussed later in this paper.
Classification Principle 2 establishes the work performed as the main criterion for establishing a detailed occupation and determining where to place it in the structure. Thus, the SOCPC needs information describing the tasks performed by workers in an occupation. The SOCPC uses this information to evaluate whether the tasks performed in a new occupation recommended for inclusion are sufficiently different from tasks performed in existing occupations, and to determine where in the classification structure an occupation should be placed. In revising existing occupations, the SOCPC considers whether tasks have changed since the last revision. As noted in Principle 2, skills, education, or training are sometimes used to guide the classification decisions.
Classification Principle 3 is critical for classification of managers,
BOX B-1
2010 SOC Classification Principles
-
The SOC covers all occupations in which work is performed for pay or profit, including work performed in family-operated enterprises by family members who are not directly compensated. It excludes occupations unique to volunteers. Each occupation is assigned to only one occupational category at the lowest level of the classification.
-
Occupations are classified based on work performed and, in some cases, on the skills, education, and/or training needed to perform the work at a competent level.
-
Workers primarily engaged in planning and directing are classified in management occupations in Major Group 11-0000. Duties of these workers may include supervision.
-
Supervisors of workers in Major Groups 13-0000 through 29-0000 usually have work experience and perform activities similar to those of the workers they supervise, and therefore are classified with the workers they supervise.
-
Workers in Major Group 31-0000 Health Care Support Occupations assist and are usually supervised by workers in Major Group 29-0000 Health Care Practitioners and Technical Occupations. Therefore, there are no first-line supervisor occupations in Major Group 31-0000.
-
Workers in Major Groups 33-0000 through 53-0000 whose primary duty is supervising are classified in the appropriate first-line supervisor category because their work activities are distinct from those of the workers they supervise.
-
Apprentices and trainees are classified with the occupations for which they are being trained, while helpers and aides are classified separately because they are not in training for the occupation they are helping.
-
If an occupation is not included as a distinct detailed occupation in the structure, it is classified in an appropriate “All Other,” or residual, occupation. “All Other” occupations are placed in the structure when it is determined that the detailed occupations comprising a broad occupation group do not account for all of the workers in the group. These occupations appear as the last occupation in the group with a code ending in “9” and are identified in their title by having “All Other” appear at the end.
-
The U.S. Bureau of Labor Statistics and the U.S. Census Bureau are charged with collecting and reporting data on total U.S. employment across the full spectrum of SOC major groups. Thus, for a detailed occupation to be included in the SOC, either the Bureau of Labor Statistics or the Census Bureau must be able to collect and report data on that occupation.
SOURCE: Standard Occupational Classification Manual 2010, Office of Management and Budget.
focusing on duties of “planning and directing.” The principle recognizes that managers may also supervise other workers. In the setting of a small child care center, for example, the center director would be classified as a manager, not a supervisor, although this individual may supervise some or all of the other workers in the center.
Classification Principle 4 indicates how supervisors of workers in classified in Major Occupation Groups 13 through 29 are classified. In these Major Groups, there are no specific supervisory occupations. Instead, supervisors who also perform work similar to that of the workers they supervise are classified with those workers. In the ECCE context, this principle is relevant for teaching occupations, found in Major Group 25. For example, a lead teacher who teaches preschool but also supervises other preschool teachers would be classified in one of the two preschool teaching occupations: 25-2011 Preschool Teachers, Except Special Education, or 25-5051 Special Education Teachers, Preschool.
Classification of supervisors of teachers is different from how supervisors of child care workers are classified. Child care workers are in Major Group 39, where Classification Principle 6 applies and specific supervisory occupations are included in the SOC. The supervisory detailed occupation relevant to ECCE is 39-1021 First-line Supervisors of Personal Care Workers.
Classification Principle 7 concerns the classification of apprentices. While the principle mentions helpers and aides, these are generally not child care helpers or aides. This principle is used, for example, to classify workers who perform tasks similar to those of a construction helper but who are in a carpenter apprentice program and are helping carpenters as part of the apprenticeship training. These workers would be classified as in the occupation for which they are being trained, i.e., carpenter.
SOC Coding Guidelines In addition to the Classification Principles, the SOCPC developed the Coding Guidelines show in Box B-2 to assist users in consistently assigning SOC codes and titles to survey responses and in other coding activities. The Coding Guidelines reflect the reality of many workplaces—that individual workers may perform a variety of tasks that could be classified into more than one occupation. The guidelines help produced consistent treatment of these situations.
Coding Guideline 2 is important in understanding how workers who perform a range of duties are classified, probably a common situation in smaller ECCE establishments. Except for teachers, the main criterion is the skill level required by the various tasks. For example, a child care center director who also teaches would be classified as 11-9031 Education Administrators, Preschool and Childcare Center/Program, if the directing tasks are regarded as requiring higher skills than the teaching tasks. If the
BOX B-2
2010 SOC Coding Guidelines
-
A worker should be assigned to an SOC occupation code based on work performed.
-
When workers in a single job could be coded in more than one occupation, they should be coded in the occupation that requires the highest level of skill. If there is no measurable difference in skill requirements, workers should be coded in the occupation in which they spend the most time. Workers whose job is to teach at different levels (e.g., elementary, middle, or secondary) should be coded in the occupation corresponding to the highest educational level they teach.
-
Data collection and reporting agencies should assign workers to the most detailed occupation possible. Different agencies may use different levels of aggregation, depending on their ability to collect data.
-
Workers who perform activities not described in any distinct detailed occupation in the SOC structure should be coded in an appropriate “All Other” or residual occupation. These residual occupational categories appear as the last occupation in a group with a code ending in “9” and are identified by having the words “All Other” appear at the end of the title.
-
Workers in Major Groups 33-0000 through 53-0000 who spend 80 percent or more of their time performing supervisory activities are coded in the appropriate first-line supervisor category in the SOC. In these same Major Groups (33-0000 through 53-0000), persons with supervisory duties who spend less than 80 percent of their time supervising are coded with the workers they supervise.
-
Licensed and non-licensed workers performing the same work should be coded together in the same detailed occupation, except where specified otherwise in the SOC definition.
SOURCE: Standard Occupational Classification Manual 2010, Office of Management and Budget.
skill levels are regarded as similar, time spent directing versus teaching should be used as a tie-breaker.
Teachers who teach at more than one level should be classified at the higher level. For example a teacher working at both the preschool and elementary levels should be classified in an elementary school teacher occupation.
Coding Guideline 5 deals with classification of supervisors who also perform non-supervisory work. For example, a worker who supervises child care workers may also perform child care tasks. Whether this worker is classified with 39-1021 First-line Supervisors of Personal Care Workers or with 39-9011 Childcare Workers should depend on the amount of time spent supervising versus providing care.
Using the NAICS and SOC to Understand the ECCE Workforce
Discussions with members of the workshop planning committee identified a number of difficulties in using data based on the NAICS and SOC to understand the ECCE workforce. The following issues are detailed here:
1. The 2010 SOC does not consistently distinguish workers who care for or instruct children from birth through age five (the B–5 population) from those who care for or instruct school-aged children.
2. The SOC distinction between child care worker and preschool teacher does not reflect the work performed.
3. The relevant NAICS industries do not identify child care or instructional services by age of the children served.
4. Industry data classified by NAICS cannot be used to identify preschool or child care services provided by establishments whose primary activity is not child day care services.
1. The 2010 SOC does not consistently distinguish workers who care for or instruct children from birth through age five (the B–5 population) from those who care for or instruct school-aged children.
ECCE researchers indicate that the duties and responsibilities involved in caring for or instructing younger children are different from those required for school-aged children. Programs for school-aged children may range from centers to school-based programs, and include recreational and after-school instruction programs. These activities may be staffed with workers classified in various SOC occupations, including teachers, child care workers, recreation workers, and others.
The 2010 SOC includes the occupations where workers who provide care or instruction to the B–5 population are classified, as well as relevant education administrators and the supervisors of child care workers. (See Table B-21.) Only two occupations listed specifically identify and are limited to the B–5 population: 25-2011 Preschool Teachers, Except Special Education, and 25-2051 Special Education Teachers, Preschool.
SOC 11-9031 Education Administrators, Preschool and Child Care Center/Program, likely serve mostly the B–5 population. However, “Child Care Center/Program” could include centers or programs serving mainly older children. The extent to which this is the case is not known from the standard data sources.
In all the remaining occupations listed, the occupational classification alone does not distinguish workers who serve only or primarily the B–5 population.
2. The SOC distinction between child care worker and preschool teacher does not reflect the work performed.
The SOC distinguishes 25-2011 Preschool Teachers, Except Special Education from 39-9011 Child Care Workers based on the work activities performed, which are described in the occupational definitions in Table B-21. Generally, the distinction is that Preschool Teachers provide instruction while Child Care Workers perform tasks other than instruction.
ECCE researchers indicate that this distinction does not reflect practices and standards in the field. For example, the National Association for the Education of Young Children (NAEYC) conducts a voluntary accreditation system that sets professional standards for early childhood education programs and accredits programs that prepare early childhood educators.14 NAEYC also has developed standards for “Developmentally Appropriate Practice” in early childhood programs that include practices and standards related to encouraging cognitive, social, and other development of young children.15 Similarly, the National Board for Professional Teaching Standards has developed standards for teaching children age 3 through 8, and conducts a teacher certification program.16
The Employment and Training Administration’s Occupational Information Network or O*NET program gathers information on tasks, skills, and many other data items from incumbent workers in specific SOC occupations. Of interest here is that the task list for Child Care Workers includes tasks that may be considered beyond custodial care activities. Examples include “Create developmentally appropriate lesson plans,” “Support children’s emotional and social development, encouraging understanding of others and positive self-concepts” and “Identify signs of emotional or developmental problems in children and bring them to parents’ or guardians’ attention.”17
3. The relevant NAICS industries do not identify child care or instructional services by age of the children served.
For each of the four components of ECCE, the relevant 2007 NAICS industries and their definitions are listed in Table B-22. The identification of specific NAICS for the first three components—school-based, center-based, and formal Family Child Care (FCC) home-based services—are rel-
![]()
14 See http://www.naeyc.org/positionstatements/dap.
15 See http://www.naeyc.org/positionstatements/dap.
16 See http://www.nbpts.org/.
17 O*NET Online, http://www.onetonline.org/.
TABLE B-21 2010 SOC Detailed Occupations Most Relevant to ECCE
| Code and Title | Definition | Direct Match Titles* |
| 11-9031 Education Administrators, Preschool and Childcare Center/Program | Plan, direct, or coordinate the academic and nonacademic activities of preschool and child care centers or programs. Exclude “Preschool Teachers” (25-2011). |
• Child care center administrator • Child care center director • Early Head Start director • Head Start director • Prekindergarten program coordinator • Preschool director |
| 25-2011 Preschool Teachers, Except Special Education | Instruct preschool-aged children in activities designed to promote social, physical, and intellectual growth needed for primary school in preschool, day care center, or other child development facility. Substitute teachers are included in “Teachers and Instructors, All Other” (25-3099). May be required to hold state certification. Excludes “Child Care Workers” (39-9011) and “Special Education Teachers” (25-2050). |
• Early childhood teacher • Head Start teacher • Nursery school teacher • Nursery teacher • Prekindergarten teacher • Preschool teacher |
| 25-2051 Special Education Teachers, Preschool | Teach preschool school subjects to educationally and physically handicapped students. Includes teachers who specialize and work with audibly and visually handicapped students and those who teach basic academic and life processes skills to the mentally impaired. Substitute teachers are included in “Teachers and Instructors, All Other” (25-3099). |
• Early childhood special education teacher • Early childhood special educator • Prekindergarten special education teacher |
| 25-9041 Teacher Assistants | Perform duties that are instructional in nature or deliver direct services to students or parents. Serve in a position for which a teacher has ultimate responsibility for the design and implementation of educational programs and services. Excludes “Graduate Teaching Assistants” (25-1191). |
• Basic skills improvement program instructional aide • Classroom aide • Educational assistant teacher • Gifted and talented student education aide • Instructional aide • Instructional assistant |
|
• Learning support aide • Paraeducator • Public health training assistant • Reading aide • Special education aide • Special education classroom aide • Special education instructional assistant • Special education paraeducator • Special education paraprofessional • Special education teaching assistant • Teacher aide |
||
| 39-1021 First-Line Supervisors of Personal Service Workers | Directly supervise and coordinate activities of personal service workers, such as flight attendants, hairdressers, or caddies. |
• Animal trainer supervisor • Caddy master • Head butler • Recreation attendant supervisor |
| 39-9011 Child Care Workers | Attend to children at schools, businesses, private households, and child care institutions. Perform a variety of tasks, such as dressing, feeding, bathing, and overseeing play. Excludes “Preschool Teachers, Except Special Education” (25-2011) and “Teacher Assistants” (25-9041). |
• Au pair • Baby sitter • Before and after school day care worker • Child care aide • Child care attendant • Child care worker • Day care attendant • Day care worker • Day care aide • Day care provider • Governess • Nanny • Nursery day care worker • Playground aide |
NOTE: ECCE: Early Childhood Care Education; SOC: Standard Occupational Classification; SOCPC: Standard Occupational Classification Policy Committee.
* Direct match titles are titles that the SOCPC has agreed match only one SOC occupation. These may not be the only job titles relevant to the detailed occupation, however.
TABLE B-22 2007 NAICS Detailed Industries Most Relevant to ECCE Components
| ECCE Component | NAICS Code and Title | NAICS Definition | NAICS Illustrative Examples |
| School-based | 611110 Elementary and secondary schools | This industry comprises establishments primarily engaged in furnishing academic courses and associated course work that comprise a basic preparatory education. A basic preparatory education ordinarily constitutes kindergarten through 12th grade. This industry includes school boards and school districts. |
• Elementary schools • Parochial schools, elementary • High schools • Primary schools • Kindergartens • Schools for the physically disabled, elementary or secondary • Military academies, elementary or secondary |
| Center-based Formal family child care (FCC) home-based services Family, friend, and neighbor (FFN): self-employed, providing care in own home. Family, friend, and neighbor (FFN): Workers receiving a wage from the householder (usually the parent) and providing care in the child’s home. |
624410 Child day care services | This industry comprises establishments primarily engaged in providing day care of infants or children. These establishments generally care for preschool children, but may care for older children when they are not in school and may also offer prekindergarten educational programs. |
• Child day care babysitting services • Nursery schools • Child or infant day care centers • Preschool centers |
| 814110 Private households | This industry comprises private households primarily engaged in employing workers on or about the premises in activities primarily concerned with the operation of the household. These private households may employ individuals, such as cooks, maids, nannies, butlers, and outside workers, such as gardeners, caretakers, and other maintenance workers. | None | |
NOTE: ECCE: Early Childhood Care Education; NAICS: North American Industry Classification System.
atively straightforward. The industry classification of the Family, Friend, and Neighbor (FFN) component is more complex, however.
The FFN component includes paid services provided in the caregiver’s home, with the payment from the parents or from a third party, such as a voucher program. Generally, these caregivers would be considered self-employed. FFN caregivers who are providing paid services in the child’s home, and who are paid by the householder (most likely the child’s parent) would be classified as working in the Private Households industry. In both instances, accurate measurement depends on these workers’ responses to the household survey questions discussed later in this paper.
As to the issue of services according to the age of the children served, only the description for NAICS 624410 Child Day Care Services references preschool age children, which is likely the dominant population served by establishments classified here. The illustrative examples for this industry, shown in Table B-22, suggest this may be the case: Child day care babysitting services, Nursery schools, Child or infant day care centers, and Preschool centers. However, the standard labor force and employment data sources provide no information on the actual mix of B–5 and older children served. The extent of the limitation of this NAICS code for ECCE purposes is not known but may be small.
4. Industry data classified by NAICS cannot be used to identify preschool or child care services provided by establishments whose primary activity is not child day care services.
Establishments are classified in the NAICS according to their primary activity. Thus, only establishments that provide child care services as their primary activity will be classified in NAICS 624410 Child Day Care Services. Child care centers are operated by establishments in other industries, and the number of such centers and their employment cannot be identified using standard industry data sources classified by the NAICS.
An important example is school-based ECCE programs operated by elementary and secondary schools. Preschools and child care centers are located in schools whose primary activities are providing elementary and secondary education and are classified in NAICS 611110, Elementary and Secondary Schools. Not all schools have ECCE programs, however. Thus, the NAICS designation alone is not sufficient to identify establishments providing ECCE services. Additional information about schools is needed.
Other Federal Data Issues for ECCE
In addition to issues related to the classifications, several measurement issues have been identified in using BLS and Census data sources for ECCE workforce analysis. The following issues are discussed here:
5. Where the 2010 SOC does distinguish workers who provide care or instruction to the B–5 population, the distinction is not available in data collected through household surveys.
6. The standard data sources provide little information on the type of preparation by early childhood care and education workers.
7. It is difficult to identify formal Family Child Care home-based care services and informal Family, Friend, and Neighbor care services in the standard data sources.
8. The Current Population Survey does not provide statistically reliable data for small domains because of the limited sample size.
5. Where the 2010 SOC does distinguish workers who provide care or instruction to the B–5 population, the distinction is not available in data collected through household surveys.
In general, household surveys provide less occupational and industry detail than establishment surveys, because there is less information available for assigning classification codes. An important example of this limitation is SOC 25-2011 Preschool Teachers, Except Special Education. The Current Population Survey (CPS) and the American Community Survey (ACS) provide data for SOC 25-2010 Preschool and Kindergarten Teachers, but not separately for preschool versus kindergarten teachers. Similar groupings of SOC occupations are made for education administrators and special education teachers, where no distinctions as to the level of education are indicated.
Because the CPS and ACS are the main sources of demographic information of workers by occupation, this limitation results in lack of data on educational attainment, gender, age, race/ethnicity, and other characteristics of workers in the occupations of interest to ECCE, and that facilitates comparison with other occupations. In addition, the CPS and ACS are the source of employment data by occupation for workers in private households.
The BLS Occupational Employment Statistics (OES) survey does produce data specifically for Education Administrators, Preschool and Child Care Center/Program and for Preschool Teachers, Except Special Education. With implementation of the 2010 SOC, BLS will also begin publishing data for 25-2051 Special Education Teachers, Preschool; these new data will be available starting in the spring of 2012. The OES survey
provides data on employment levels and wages, total and by industry and by geographic area; it does not provide demographic information, however, nor does it include private households.
6. The standard data sources provide little information on the type of preparation by early childhood care and education workers.
Some members of the workshop planning committee identified the need for information about the preparation of ECCE workers, such as general educational attainment, early childhood-specific education, professional development and training, and work experience. The standard household surveys (CPS and ACS) provide only data on formal educational attainment by occupation. The usefulness of this information is limited by the Census groupings of SOC occupations, as described in item 5 above.
The ACS recently began publishing data on bachelor’s degree field of study. These data can be tabulated by occupation and other characteristics. Field of degree data are used by the National Science Foundation to study the characteristics of the population with science and engineering degrees and occupations. The categories reported in the data are rather broad, but do include Education as a specific category.18
None of the standard labor force and employment surveys contain questions on more detailed preparation, such as types of courses taken, more specific information on field of study, or credentials obtained other than formal educational attainment. Other data sources must be used to obtain this type of data.
7. It is difficult to identify formal Family Child Care home-based care services and informal Family, Friend, and Neighbor care services in the standard data sources.
This issue poses different measurement problems for establishment versus household data, which are discussed separately below. In general, however, there are two difficulties: (1) whether and how formal FCC home-based services are captured in statistical sources and (2) the use of different concepts by ECCE researchers and statistical agencies regarding FFN care.
In the FCC case, care is provided for pay in a formal setting that is located at the caregiver’s home. The key distinction is the “formal setting,” that is, a home-based child care business, usually operated by a
![]()
18 See www.census.gov/acs/www/Downloads/data_documentation/SubjectDefinitions/2009_ACSSubjectDefinitions.pdf.
sole proprietor. The FCC concept is compatible with statistical concepts of establishment (the home-based business is the establishment) and the economic relationship between the FCC proprietor and the customer, who pays the proprietor directly or creates an arrangement for payment through a third party, such as voucher program. In practice, however, the standard establishment and household surveys do not distinguish home-based formal settings from other formal settings, such as center-based care.
The FFN concept is based on personal relationships between the caregiver, on the one hand, and the child and parent, on the other. The caregiver is a family member, friend, or neighbor of the child or parent, and is providing care on an informal paid basis, either in the caregiver’s home or the child’s home. In contrast, labor force concepts turn on the employment relationship, that is, whether a worker is paid through a wage or salary or earns income through self-employment, and the location of the activity. Measurement depends on either the coverage of the paid activity by the Unemployment Insurance (UI) system or on the way individuals respond to questions on household surveys. Neither establishment nor household surveys take personal or family relationships into account in employment concepts or measurement (except for “unpaid family workers” in household surveys).
Establishment Data Four components of the ECCE service delivery system are: center-based, school-based, formal FCC home-based services, and FFN services. Center-based and school-based programs are generally straightforward in where they are classified in the NAICS, as seen in Table B-22, and therefore in their inclusion in the BLS establishment list. The BLS establishment list is derived from the employer’s quarterly state UI payroll tax reports. Thus, whether the activity is covered by state UI laws determines whether the establishment is identified, coded, and included in the BLS universe for its establishment surveys. The UI tax reports provide data on the establishment’s total employment and payroll for workers covered by the UI system, and are coded by NAICS, geographic location, ownership (public or private), and a variety of other characteristics.
Formal FCC home-based services and informal FFN services are more complicated. Generally these complications turn on two questions: (1) whether the activity is covered by the state UI law, and (2) how proprietors of FCC home-based services are counted.
UI coverage of formal FCC home-based services and FFN services is depicted in Table B-23. This is a general view, as specific coverage varies somewhat from state to state. As noted in the chart, UI coverage is subject to meeting a threshold amount of wages paid in a recent period, and
TABLE B-23 Unemployment Insurance Coverage for FCC and FFN Child Care Services Workers
| Employment Relationship | Formal Family Child Care (FCC) Home-Based Care | Family, Friend, or Neighbor (FFN) Care | |
| Proprietors | |||
| Incorporated Not incorporated |
Covered Not covered, considered self-employed |
Not applicable Not applicable |
|
| Paid employees of proprietor |
|||
| Incorporated Not incorporated |
Covered Covered |
Not applicable Not applicable |
|
| Paid employees of householders | Not applicable | May be covered as “domestic service” | |
| Self-employed non-proprietors | Not applicable | Not covered | |
NOTE: UI coverage is subject to meeting the required amount of wages paid during a recent quarter or year, which varies by state. Wage requirements for “domestic service” are usually different than those for other types of workers. See http://www.ows.doleta.gov/unemploy/pdf/uilawcompar/2010/coverage.pdf.
requirements usually differ for “domestic service,” that is, employees paid by a householder.19
For FCC proprietors, whether they are UI-covered and therefore counted in the establishment’s reported employment depends on whether the home-based business is incorporated. Officers of incorporated businesses—in this case, proprietors of incorporated home-based businesses—are generally considered paid employees.20 These establishments would be classified according to the services provided, probably in NAICS 624410 Child Day Care Services, and would be in the universe for BLS establishment surveys. Proprietors are relevant only for FCC and not for FFN care. Paid employees of FCC proprietors are covered by UI, regardless of whether the business is incorporated.
The only instance where workers providing FFN services are covered by UI is where a householder pays the caregiver as an employee and
![]()
19 “Domestic service” is defined in Federal Unemployment Tax Act (FUTA) regulations to include babysitting. See http://edocket.access.gpo.gov/cfr_2010/aprqtr/pdf/26cfr31.3306(c)(2)-1.pdf. All state UI laws cover domestic service, although the specific provisions are different from the federal coverage in a few states.
20 For FUTA purposes, corporate officers are considered paid employees. Some states have enacted exclusions from state UI coverage. See page 11 of http://www.ows.doleta.gov/unemploy/pdf/uilawcompar/2010/coverage.pdf.
the wages paid meet the threshold level. The paid employee may be a family member, friend, or neighbor, but also could be a nanny, who is not included in the FFN concept. The household would be considered to be the establishment, and would be classified in NAICS 814110 Private Households. These establishments are on the BLS establishment list, but no BLS establishment survey includes this industry.
Household Data The CPS and ACS ask questions about the respondent’s employment status, occupation, industry, and class of worker status (wage and salary, unincorporated self-employed, and unpaid family workers). The classification of individual workers depends on how they respond to these questions and the amount of detail they provide. Table B-24 presents the relevant ACS questions21 and should be helpful in understanding how proprietors are counted in household data. Similar or identical questions are used on the CPS.
Proprietors of home-based FCC services may answer question 41 as either self-employed in an incorporated business or self-employed in an unincorporated business and will be classified as either wage and salary workers (if incorporated) or self-employed workers (if not incorporated). Employees working for the FCC proprietor would probably respond as employees of private for-profit business or individual, and would be classified as wage and salary workers.22 The Current Population Survey question similar to question 41, the first response item does not include working as an employee of an individual.
To code the industry and occupation responses, the Census Bureau maintains industry and occupation title indexes.23 For the industry questions, responses such as “child care” and “day care” are coded to the Census industry equivalent of NAICS 624410 Child Day Care Services. Census coding procedures may use occupational responses to aid in coding the industry. For example, responses indicating self-employed with the occupation babysitter, and working in the home of others, are coded to the Census industry equivalent of NAICS 814110 Private Households.
![]()
21 See http://www.census.gov/acs/www/Downloads/questionnaires/2011/Quest11.pdf.
22 CPS interviewer instructions include the following for child care workers: “Child care including foster parents WHERE a person works is important in determining the correct class of worker for child care workers. Persons who care for children in the child’s (that is the parent’s) home are private for profit employees. This includes a babysitter for an evening or a person regularly working during the day. One of the private categories is also correct for those who work in day care centers and other non-government institutional settings. The institution may be either for profit or not for profit. A person who cares for children in the caregiver’s home is self employed. This includes foster parents who receive a fee for caring for children.” http://www.census.gov/apsd/techdoc/cps/CPS_Interviewing_Manual_July2008rv.pdf, page C4-33.
TABLE B-24 American Community Survey Questions on Class of Worker, Industry, and Occupation
| Question | Question | Responses Coded to |
| 41 |
Was this person–Mart (X) ONE box.
|
Class of worker:
• Wage and salary • Unincorporated self-employed • Unpaid family workers • Federal • State • Local • Private |
| 42 | For whom did this person work? If now on active duty in the Armed Forces, mark (X) this box and print the branch of the Armed Forces. Name of company, business, or other employer |
Industry |
| 43 | What kind of business or industry was this? Describe the activity at the location where employed. (For example: hospital, newspaper publishing, mail order house, auto engine manufacturing, bank) |
|
| 44 |
Is this mainly-Mark (X) ONE box.
|
|
| 45 | What kind of work was this person doing? (For example: registered nurse, personnel manager, supervisor of order department, secretary, accountant) |
Occupation |
| 46 | What were this person’s most important activities or duties? (For example: patient care, directing hiring policies, supervising order clerks, typing and filing, reconciling financial records) |
|
For the occupation questions, responses such as “day care director” are reported in SOC 11-9030 Education Administrators. Census procedures also use industry information in assigning occupation codes. For example, a response of “director” where the industry Child Day Care Services was assigned would be reported in SOC 11-9030 Education Administrators.
Table B-25 summarizes where workers will be found in the household data by ECCE component. Note that for FCC proprietors, those in incorporated businesses will be found in the same categories as preschool directors in center-based programs: they are either wage and salary workers or self-employed (unincorporated) proprietors in the Child Day Care Services industry, in the occupation the Census occupational equivalent of 11-9030 Education Administrators. Similarly, FCC employees other than proprietors cannot be identified separately from wage and salary workers in center-based programs in the same occupation.
The upshot of this discussion is that, in Census household survey data, identifying formal FCC home-based center proprietors and workers requires cross-tabulating the data by class of worker, industry, and occupation. Identifying FFN caregivers requires a similar cross-tabulation. Cross-tabulations may be produced using the Public Use Microdata Sample (PUMS) files or by the Census Bureau from the full microdata set. Even this type of tabulation likely will include some child care service business owners who operate non-residential-based care services. However, this would be the closest proxy from household data for child care providers who operate out of their residences. Note that the Private Households industry can include only wage and salary workers, and no self-employed workers.
8. The Current Population Survey does not provide statistically reliable data for small domains because of the limited sample size.
Some analyses of CPS data in ECCE research examine information at fine levels of detail.24 Given the CPS sample size, relative standard errors (sampling error) on such data are likely high.
The Census Bureau began publishing data from the ACS with data for 2005. The ACS has a much larger sample and is designed to provide detailed information at various levels of geography for a set of data items similar to or identical to those found in the CPS. The disadvantage of the ACS compared to the CPS is that it is a relatively new survey and thus does not provide a long time series. Also, the ACS is not available
![]()
24 For example, Herzenberg et al. (2005). Losing Ground in Early Childhood Education: Declining Workforce Qualifications in an Expanding Industry, 1979-2004 used CPS data to identify home-based providers in California by highest level of education.
TABLE B-25 Locating Workers in Household Survey Data by ECCE Component
| Center-Based | School-Based | Family Child Care (FCC) Home-Based Services | Family, Friend, and Neighbor (FFN) Caregivers | |||
| Data Item | Proprietors | Employees | Employees | Proprietors | Employees | |
| Class of worker | ||||||
| Wage and salary worker | Proprietors of incorporated businesses | Proprietors of incorporated businesses | ||||
| Self-employed worker, not incorporated | Proprietors of unincorporated businesses | Proprietors of unincorporated businesses | ||||
| Industry | 624410 Child day care services | 624410 Child day care services | 611110 Elementary and secondary schools | 624410 Child day care services | 624410 Child day care services | 624410 Child day care services 814110 Private Households |
| Occupation | 11-9030 | 11-9030 | 11-9030 | 11-9030 | 39-9011 Child | 39-9011 Child |
| Education administrators | Education administrators 25-2010 Preschool and kindergarten teachers 25-2050 Special education teachers 39-9011 Child Care workers Other occupations | Education administrators 25-2010 Preschool and kindergarten teachers 25-2050 Special education teachers 39-9011 Child Care workers Other occupations | Education administrators | Care workers Other occupations | Care workers | |
as quickly as the CPS relative to its reference date, and for some levels of detail, the 3-year or 5-year datasets must be used instead of 1-year data.
Data Currently Available from Department of Labor and Census Bureau Sources
This section provides information about data sources produced by the Department of Labor and the Census Bureau from establishment and household surveys that are relevant to ECCE workforce analysis. Table B-26 lists the data sources reviewed. In the tables that follow, for each data source, certain metadata are identified, followed by a brief assessment of the advantages and limitations of the data source for ECCE purposes.
TABLE B-26 BLS and Census Bureau Data Sources Reviewed
| Source | Agency | Type | Description |
| American Community Survey (ACS) | Census | Household survey | Replaced decennial Census long form. More robust sample size than the CPS allows more data on demographics and wages by occupation, and other characteristics. Includes a question on health insurance coverage |
| American Time Use Survey (ATUS) | BLS | Household survey | Annual data on the amount of time people spend doing various activities, such as paid work, child care, volunteering, and socializing |
| Current Employment Statistics (CES) | BLS | Establishment survey | Monthly and annual industry time series on employment, hours, and wages |
| Current Population Survey (CPS) | BLS/Census | Household survey | Current overall trends in labor force participation, employment and unemployment, and demographics and wages by occupation and industry. Sample size limits demographic and other characteristics detail by occupation and industry |
| Employment Projections | BLS | Projections | Long-term employment projections by industry and occupation. Career information published in the Occupational Outlook Handbook |
| National Compensation Survey (NCS) | BLS | Establishment survey | Data on wages and benefits by occupation |
| Occupational Employment Statistics (OES) | BLS | Establishment survey | Occupational employment and wages, and industry staffing patterns |
| Occupational Information Network (O*NET) | ETA | Establishment survey of incumbent workers Subject Matter Experts | Comprehensive occupational descriptions and data in the form of rating scales on knowledge, skills, abilities, tasks, and other measures |
| Source | Agency | Type | Description |
| Quarterly Census of Employment and Wages (QCEW) | BLS | Establishment administrative data | Monthly, quarterly, and annual data on employment by detailed industry; quarterly and annual data on total payroll and payroll per employee |
| Survey of Occupational Injuries and Illnesses (SOII) | BLS | Establishment survey | Annual information on the rate, number and severity of work-related non-fatal injuries and illnesses, and how these statistics vary by incident, industry, geography, occupation, and other characteristics |
AMERICAN COMMUNITY SURVEY (ACS)
| Responsible agency | Census Bureau | ||
| Where to find it | http://www.census.gov/acs/www/ | ||
| Type of source | Household survey | ||
| Description | A relatively new survey using a series of monthly samples to produce annually updated data for the same small areas (census tracts and block groups) formerly surveyed via the decennial census long-form sample. Initially, 5 years of samples will be required to produce these small-area data. Once 5 years of data are collected, new small-area data will be produced annually. The ACS also provides 3-year and 1-year data products for larger geographic areas. | ||
| Periodicity of the data | Annual | ||
| Reference period | Annual | ||
| Frequency of publication | Annual | ||
| Scope | Total population, including people living in both housing units and group quarters | ||
| Classifications used and level of detail | Standard Occupational Classification adapted to Census Occupation Codes. For the 2010 SOC, provides 539 detailed occupations, including 4 military occupations North American Industry Classification System adapted to Census Industry Codes |
||
| Geographic detail | |||
| National | |||
| Region | |||
| State | |||
| Metropolitan Area | |||
| County | |||
| City | |||
| Urban/suburban/rural Other (describe) |
|||
| Data elements produced that relate to the desired information | 1.a Paid workforce (employment) in occupations related to ECCE 1.c Full-time vs. part-time. Provides usual weeks worked, usual hours per week 2.a Distribution of paid workforce (employment) by occupations and industry 2.c Role and responsibility, represented by occupations 3.a Demographic characteristics: age, education, gender, marital status/marital history, race/ ethnicity, income, household composition, poverty status, foreign born, language spoken at home and ability to speak English, and other items 3.b Qualifications: educational attainment, school enrollment, field of degree for bachelor’s degree 3.d Labor market information: earnings by type (wages and salaries, self-employment); health insurance coverage; usual weekly hours worked; full-time/part-time; journey to work; means of transportation to work; travel time to work 6.a Distribution by urban/rural location 6.b Socioeconomic status of community |
Advantages for ECCE purposes:
1. Along with the CPS, the ACS is a comprehensive source of demographic information of workers by occupation, including data on educational attainment, gender, age, race/ethnicity, and other characteristics of workers in the occupations of interest to ECCE.
2. Along with the CPS, the ACS is a source of employment data by occupation for workers in private households.
3. Compared to the CPS, the ACS provides much greater occupational, geographic, and other detail because of the larger sample sizes.
4. Cross-tabulations can be created using the Public Use Microdata Samples (PUMS).
Limitations for ECCE purposes:
1. The ACS is not as timely as the CPS.
2. Limitations of the SOC for identifying ECCE workforce. In addition, the Census Occupational Classification does not provide full SOC detail for preschool teachers or education administrators.
3. Limitations of the NAICS for ECCE purposes.
4. Compared to the OES, occupation by industry information not as detailed or current.
AMERICAN TIME USE SURVEY (ATUS)
| Responsible agency | Sponsored by Bureau of Labor Statistics, conducted by Census Bureau |
| Where to find it | http://www.bls.gov/tus |
| Type of source | Household survey |
| Description | Produces estimates of how people spend their time, including time spent doing child care, housework, and volunteering, as well as where and with whom each activity occurred, and whether the activities were done for one’s job or business. Demographic information—including sex, race, age, educational attainment, occupation, income, marital status, and the presence of children in the household—also is available for each respondent. Individuals are randomly selected from a subset of households that have completed their eighth and final month of interviews for the Current Population Survey (CPS) |
| Periodicity of the data | Annual |
| Reference period | Continuous collection asks one-time respondents about activities starting at 4 a.m. the previous day and ending at 4 a.m. on the interview day. |
| Frequency of publication | Microdata files published annually; Annual news release |
| Scope | All residents living in households in the United States that are at least 15 years of age, with the exception of active military personnel and people residing in institutions such as nursing homes and prisons |
| Classifications used and level of detail | Census 2007 industry classification derived from the NAICS Census 2002 Occupation classification derived from the SOC |
| Geographic detail | |
| National | |
| Region | |
| State | |
| Metropolitan Area | |
| County | |
| City | |
| Urban/suburban/rural | |
| Other (describe) | |
| Data elements produced that relate to the desired information | 1.b Unpaid caregivers and 2.a Type of setting. Use ATUS to identify sub-samples of adults who care for their own children and for other people’s children, but who do not list child care as their occupation. |
| Use ATUS to distinguish time spent doing primary from secondary care by both parents and other caregivers to adjust other data on parent-reported hours in parental or FFN care to reflect only primary caregiving hours. | |
| For parental and FFN caregivers, use ATUS for estimating the value of the wages foregone while they are caring for young children. | |
Advantages for ECCE purposes:
1. Time use data provide a proxy for more direct measures of FFN care and for estimating costs of care outside formal settings.
Limitations for ECCE purposes:
1. Not a direct measure of employment or wages.
CURRENT EMPLOYMENT STATISTICS (CES)
| Responsible agency | Bureau of Labor Statistics |
| Where to find it | http://www.bls.gov/ces |
| Type of source | Establishment survey |
| Description | Produces current detailed industry data on employment, hours, and earnings of workers on nonfarm payrolls |
| Periodicity of the data | Monthly, Annual |
| Reference period | Any part of the pay period that includes the 12th day of the month |
| Frequency of publication | Monthly, Annual |
| Scope | Excludes proprietors, the unincorporated self-employed, unpaid volunteer or family employees, farm employees, and domestic employees. Salaried officers of corporations are included. Government employment covers only civilian employees; military personnel are excluded. |
| Classifications used and level of detail | 2007 NAICS, Industry-specific estimates for NAICS sectors, 3-digit, 4-digit, and 5-digit |
| Geographic detail | |
| National | |
| Region | |
| State | |
| Metropolitan Area | |
| County | |
| City | |
| Urban/suburban/rural | |
| Other (describe) | |
| Data elements produced that relate to the desired information | 1.a Paid workforce. Monthly and annual estimates for industries relevant to ECCE, including employment, average weekly hours, average hourly earnings for both total and production and nonsupervisory workers. Number of women employees |
Advantages for ECCE purposes:
1. The CES is very timely.
2. Provides current employment trends for ECCE industries at the state and MSA levels, although availability may vary.
Limitations for ECCE purposes:
1. Limitations of the NAICS for identifying ECCE establishments.
2. Excludes wage and salary workers in private households.
3. Does not include self-employed workers.
4. Does not provide occupational data.
5. Does not provide information on worker demographics (except for gender), qualifications, or preparation.
CURRENT POPULATION SURVEY (CPS)
| Responsible agency | Joint program of the Bureau of Labor Statistics and the Census Bureau |
| Where to find it | http://www.census.gov/cps/ |
| Type of source | Household survey |
| Description | Monthly survey of about 60,000 households. Primary source of data on the labor force characteristics of the U.S. population, as well as income and poverty status |
| Periodicity of the data | Monthly, Annual |
| Reference period | Generally the week including the 12th of the month |
| Frequency of publication | Monthly, Quarterly, Annual |
| Scope | Civilian noninstitutional population. Respondents are interviewed to obtain information about the employment status of each member of the household 15 years of age and older. However, published data focus on those ages 16 and over. |
| Classifications used and level of detail | Standard Occupational Classification adapted to Census Occupation Codes. For the 2010 SOC, provides 539 detailed occupations. The NAICS adapted to Census Industry Codes. |
| Geographic detail | |
| National | |
| Region | Some regional data available |
| State | Some state data available |
| Metropolitan Area | |
| County | |
| City | |
| Urban/suburban/rural | |
| Other (describe) | |
| Data elements produced that relate to the desired information | 1.a Paid workforce (employment) in occupations related to ECCE 1.c Full-time vs. part-time. Provides usual weeks worked, usual hours per week 2.c Role and responsibility, represented by occupations 3.a Demographic characteristics: age, education, gender, marital status, race/ethnicity, income, foreign born, and other items 3.b Qualifications: educational attainment, school enrollment 3.d Labor market information: usual weekly earnings by type (for wage and salary workers); health insurance coverage; hours worked; at work part-time for economic reasons; multiple job-holding |
Advantages for ECCE purposes:
1. Along with the ACS, the CPS is a comprehensive source of demographic information of workers by occupation, including data on educational attainment, gender, age, race/ethnicity, and other characteristics.
2. Along with the ACS, the CPS is a source of employment data by occupation for workers in private households.
3. The CPS is very timely.
4. Cross-tabulations can be created using the Public Use Microdata Samples (PUMS). However, some results may be unreliable because of small sample size.
Limitations for ECCE purposes:
1. Compared to the ACS, the CPS provides much less occupational, geographic, and other detail because of the smaller sample size.
2. Limitations of the SOC for identifying ECCE workforce. In addition, the Census Occupational Classification does not provide full SOC detail for preschool teachers or education administrators.
NOTE: BLS: Bureau of Labor Statistics; ETA: Employment and Training Administration.
EMPLOYMENT PROJECTIONS (EP) PROGRAM
| Responsible agency | Bureau of Labor Statistics |
| Where to find it | http://www.bls.gov/emp/ |
| Type of source | Combines estimates from establishment and household surveys |
| Description | 10-year projections, by industry and occupation, developed primarily using data from the OES, CES, and CPS |
| Periodicity of the data | New projections produced every two years. |
| Reference period | 2008-2018 |
| Frequency of publication | Every 2 years |
| Scope | All employed workers are included in total employment as a count of jobs, all classes of worker |
| Classifications used and level of detail | SOC 2000 6-digit detailed occupations. Excludes military occupations (SOC Major Group 55) NAICS 2007 industry-specific estimates at 4-digit level, except Educational Services at 3-digit level. Selected 5-digit industry levels |
| Geographic detail | |
| National | |
| Region | |
| State | State and area projections produced by state agencies, not part of BLS program. See http://www.projectionscentral.com |
| Metropolitan Area | |
| County | |
| City | |
| Urban/suburban/rural | |
| Other (describe) | |
| Data elements produced that relate to the desired information | 1.a Paid workforce. Long-term projections of demand by occupation and industry |
Advantages for ECCE purposes:
1. Provides long-term projections of employment and job openings for occupations and employment by industry.
2. Career information products are available based on the employment projections analysis.
Limitations for ECCE purposes:
1. Limitations of the SOC for identifying ECCE workforce.
2. Limitations of the NAICS for ECCE purposes.
NATIONAL COMPENSATION SURVEY (NCS)
| Responsible agency | Bureau of Labor Statistics |
| Where to find it | http://www.bls.gov/ncs/ |
| Type of source | Establishment survey |
| Description | Provides comprehensive measures of occupational wages by detailed occupation. Employment cost trends; and benefit incidence and detailed plan provisions, by occupational grouping |
| Periodicity of the data | Continuous |
| Reference period | Varies. Data published in the 2009 national bulletin for occupational earnings were compiled from data collected between December 2008 and January 2010. The average reference period is July 2009 |
| Frequency of publication | Occupational pay and benefits incidence—Annual Employment costs—Monthly |
| Scope | Includes non-farm private, state government, and local government. Excludes federal, agricultural, and household workers, and self-employed workers |
| Classifications used and level of detail | Occupational pay—2000 SOC, 6-digit detailed occupations. Excludes military occupations (SOC major group 55) Employment cost trends; and benefit incidence and detailed plan provisions, by occupational grouping |
| Geographic detail | |
| National | |
| Region | |
| State | |
| Metropolitan Area | |
| County | |
| City | |
| Urban/suburban/rural | |
| Other (describe) | |
| Data elements produced that relate to the desired information | 3.d Labor market information: benefits; wages by full-time/part-time, and by union status |
Advantages for ECCE purposes:
1. Provides information on benefits by occupation, and relative wages by full-time/ part-time and union/nonunion status.
Limitations for ECCE purposes:
1. Occupational and geographic detail limited by small sample sizes.
2. Limitations of the SOC for identifying ECCE workforce.
3. Limitations of the NAICS for ECCE purposes.
4. Excludes self-employed workers.
5. Excludes private households.
OCCUPATIONAL EMPLOYMENT STATISTICS (OES) PROGRAM
| Responsible agency | Bureau of Labor Statistics |
| Where to find it | http://www.bls.gov/oes |
| Type of source | Establishment survey |
| Description | Produces employment and wage estimates for over 800 occupations, with breakouts by industry |
| Periodicity of the data | Annual |
| Reference period | May of reference year |
| Frequency of publication | Annual |
| Scope | Wage and salary employment in all industries except private households and most agriculture industries |
| Classifications used and level of detail | Standard Occupational Classification, 6-digit detailed occupations. Excludes military occupations (SOC Major Group 23) |
| The NAICS, industry-specific estimates for NAICS sectors, 3-digit, 4-digit, and selected 5-digit industry levels. | |
| Geographic detail | |
| National | |
| Region | |
| State | |
| Metropolitan Area | |
| County | |
| City | |
| Urban/suburban/rural | |
| Other (describe) | Balance of state areas composed of non-metropolitan geography in each state |
| Data elements produced that relate to the desired information | 1.a Paid workforce (employment) in detailed SOC occupations related to ECCE 2.a Distribution of paid workforce (employment) in occupations related to ECCE by industry, including especially NAICS 611110 Elementary and Secondary Schools, and 624410 Child Day Care Services 2.c Role and responsibility, represented by occupations 3.d Compensation, specifically hourly wages in occupations related to ECCE, total by geographic area, and nationally by industry 5.a Distribution of staffing by roles, represented by occupations, within industries 6.a Distribution by urban/rural location. OES data can be tabulated to urban/rural using the MSA and balance of state (non-metropolitan) area data |
Advantages for ECCE purposes:
1. Comprehensive source of employment and wage information by occupation for wage and salary workers.
2. Data available by occupation by industry, indicating variations in wages by industry as well as occupational distribution (staffing pattern) of employment in specific industries.
3. Large sample size results in data in significant occupational, industry, and geographic detail.
Limitations for ECCE purposes:
1. Limitations of the SOC for identifying ECCE workforce.
2. Limitations of the NAICS for identifying ECCE establishments.
3. Excludes wage and salary workers in private households.
4. Does not provide information on worker demographics, qualifications, or preparation.
OCCUPATIONAL INFORMATION NETWORK (O*NET)
| Responsible agency | Employment and Training Administration, U.S. Department of Labor |
| Where to find it | http://www.onetonline.org/ (provides O*NET data access, provides documentation, data downloads, and other information) |
| Type of source | Establishment survey (two-stage survey to obtain sample of job incumbents within sampled establishments) Subject matter experts |
| Description | Provides comprehensive occupational descriptions and data in the form of several hundred rating scales on knowledge, skills, abilities, tasks, and other measures. The O*NET Content Model was developed using research on job and organizational analysis and includes job-oriented descriptors and worker-oriented descriptors. |
| Periodicity of the data | Updates to database added approximately annual as data from recent collections are incorporated |
| Reference period | Not applicable |
| Frequency of publication | Approximately annually |
| Scope | Wage and salary employment in all industries except private households and most agriculture industries |
| Classifications used and level of detail | SOC, 6-digit detailed occupations with additional detail for some occupations. Excludes military occupations (SOC Major Group 55) |
| Geographic detail | |
| National | |
| Region | |
| State | |
| Metropolitan Area | |
| County | |
| City | |
| Urban/suburban/rural | |
| Other (describe) |
| Data elements produced that relate to the desired information | No specific data elements. However, O*NET information can be useful in understanding the child care workforce in terms of the characteristics in the O*NET Content Model: Worker Characteristics (Abilities, Interests, Work Styles, Work Values) Worker Requirements (Skills, Knowledge, Education) Experience Requirements (Experience and Training, Basic and Cross-functional Skills Entry Requirements, Licensing) Occupational Requirements (Generalized and Detailed Work Activities, Organizational and Work Context) Occupation-specific Information (Tasks, Tools and Technology) |
Advantages for ECCE purposes:
1. Comprehensive source of information on tasks performed, skills, abilities, and other measures.
Limitations for ECCE purposes:
1. Limitations of the SOC for identifying ECCE workforce.
2. No data collected from wage and salary workers in private households.
QUARTERLY CENSUS OF EMPLOYMENT AND WAGES (QCEW)
| Responsible agency | Bureau of Labor Statistics |
| Where to find it | http://www.bls.gov/cew |
| Type of source | Administrative |
| Description | Produces monthly, quarterly, and annual data on employment and wages. Quarterly and annual data on total payroll and payroll per employee. First quarter data on establishment size class |
| Periodicity of the data | Monthly, quarterly, and annual |
| Reference period | Any part of the pay period that includes the 12th day of the month |
| Frequency of publication | Quarterly |
| Scope | The QCEW program derives its data from quarterly tax reports submitted to State Employment Security Agencies by more than 8 million employers subject to state unemployment insurance (UI) laws and from federal agencies subject to the Unemployment Compensation for Federal Employees (UCFE) program. The QCEW program has data on nonagricultural industries, along with partial information on agricultural industries and employees in private households. For the first quarter of each year, data are tabulated by establishment size class. The size category of each establishment is determined by the March employment level. These size class data are available at the national level by NAICS industry, and at the state level by NAICS sector. |
| Classifications used and level of detail | 2007 NAICS, Industry-specific estimates for NAICS sectors, 3-digit, 4-digit, and 5-digit |
| Geographic detail | |
| National | |
| Region | |
| State | |
| Metropolitan Area | |
| County | |
| City | |
| Urban/suburban/rural | |
| Other (describe) | Individual establishment records are geo-coded. |
| Data elements produced that relate to the desired information | 1.a Paid workforce. Monthly and annual estimates for industries relevant to ECCE, including employment, number of establishments, total payroll, and payroll per employee |
Advantages for ECCE purposes:
1. Provides data on employment, number of establishments, total payroll, and payroll per employee for ECCE industries at full NAICS and geographic detail, except where data subject to protection of confidentiality.
2. Includes wage and salary workers in private households.
Limitations for ECCE purposes:
1. Compared to CES, QCEW is much less timely.
2. Limitations of the NAICS for identifying ECCE establishments.
3. Excludes employment not subject to unemployment insurance coverage, which may affect inclusion domestic workers in private households.
4. Does not include self-employed workers.
5. Does not provide occupational data.
6. Does not provide information on worker demographics (except for gender), qualifications, or preparation.
SURVEY OF OCCUPATIONAL INJURIES AND ILLNESSES (SOII)
| Responsible agency | Bureau of Labor Statistics |
| Where to find it | http://www.bls.gov/iif/home.htm |
| Type of source | Establishment survey |
| Description | Provides annual information on the rate, number, and severity of work-related non-fatal injuries and illnesses, and how these statistics vary by incident, industry, geography, occupation, and other characteristics |
| Periodicity of the data | Annual |
| Reference period | Calendar year |
| Frequency of publication | Annual |
| Scope | Employers having 11 employees or more in agricultural production, all employers in all other private industries and state and local government. Excludes self-employed persons and workers in private households (NAICS 814), the U.S. Postal Service (NAICS 491), and the federal government |
| Classifications used and level of detail | SOC 2000 6-digit detailed occupations. Does not include SOC residuals or military occupations (SOC major group 55) NAICS 2007 publishable data include 3-digit Educational Services, 4-digit Child Day Care Services |
| Geographic detail | |
| National | |
| Region | |
| State | 44 participating states, the District of Columbia, and territories (for 2009) |
| Metropolitan Area | |
| County | |
| City | |
| Urban/suburban/rural Other (describe) | |
| Data elements produced that relate to the desired information | 3.d Labor market information: number and rate of illnesses and injuries by occupation and industry |
Advantages for ECCE purposes:
1. Source of injury and illness information for occupations and industries of interest to ECCE.
Limitations for ECCE purposes:
1. Some states not participating, although national data include samples from all states.
2. Excludes self-employed workers.
3. Excludes private households, U.S. Postal Services, and federal workers.
4. Limitations of the SOC for identifying ECCE workforce.
5. Limitations of the NAICS for ECCE purposes.


