
Appendix F
Ionizing Radiation Exposure to the
U.S. Population, with a Focus on
Radiation from Medical Imaging1
Rebecca Smith-Bindman, M.D.
University of California, San Francisco School of Medicine
DEFINITION OF IONIZING RADIATION AND UNITS
Radiation is energy in the form of high-speed particles and electromagnetic waves. Radiation from electromagnetic waves is characterized by the wavelength and the amount of energy they transfer. In general, the shorter the wavelength, the greater the energy of the radiation, and the greater the potential for biological damage. The types of electromagnetic radiation and examples of sources of this radiation are shown in Figure F-1.
Ionizing Radiation
Radiation with enough energy to remove tightly bound electrons from their orbits (and enough energy to break chemical bonds) is called ionizing radiation (reflected by wave lengths to the right in Figure F-1, shown for electromagnetic radiation, including ultraviolet waves, X-rays and gamma rays). Wavelengths to the left of Figure F-1 (i.e., microwaves, radio waves, and low-frequency cell phone waves, which are extremely low frequency and energy) do not have this amount of energy and cannot break chemical bonds and are non-ionizing radiation. This does not confirm that they are safe, just that they do not cause biological damage through the mechanism of breaking chemical bonds. There are three main kinds of ionizing
____________
1The responsibility for the content of this article rests with the author and does not necessarily represent the views of the Institute of Medicine or its committees and convening bodies.
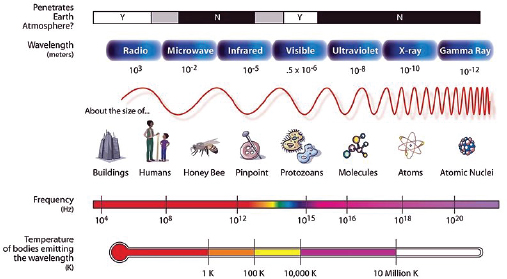
FIGURE F-1 Energy spectrum of radiation.
SOURCE: NASA (http://mynasadata.larc.nasa.gov/images/EM_Spectrum3-new.jpg).
radiation: alpha and beta particles (not electromagnetic), gamma rays, and X-rays.
There are many different naturally occurring sources of radiation, and radiation is used in many areas of industry and medicine. A few typical doses (exposure levels) and impacts of radiation are shown in Figure F-2.
Ionizing Radiation Used in Medical Imaging
Ionizing radiation used in medical imaging includes gamma rays and X-rays. Gamma rays are delivered through nuclear medicine examinations, when a small amount of radioactive material is inhaled, injected, or swallowed by a patient, and the resulting gamma waves that are emitted by the radio-pharmaceutical from within the patient are detected. A variety of imaging tests use X-ray technology, including radiographs (also known as conventional X-rays, plain films, and sometimes just X-rays for short even though each of these sources use X-rays), fluoroscopy, angiography, and computed tomography (CT). Ultrasound and magnetic resonance imaging utilize ultrasound waves and magnetic waves respectively, and neither delivers ionizing radiation.
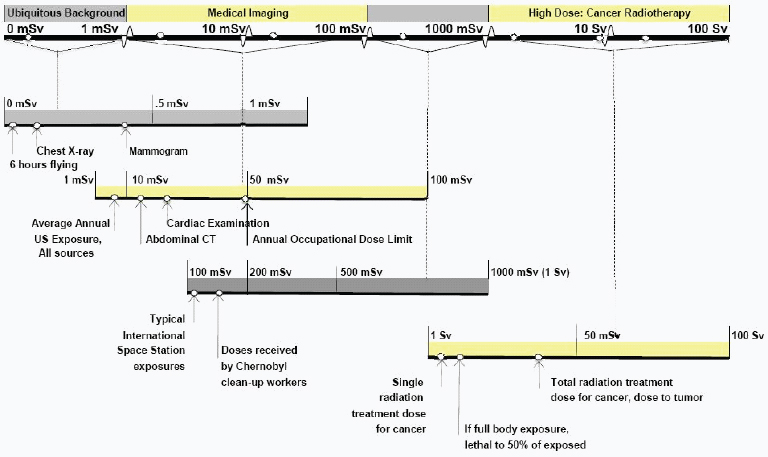
FIGURE F-2 Sample doses of and exposures to ionizing radiation.
Biological Effect of Ionizing Radiation
Ionizing radiation passes through air and will deposit energy into the tissue that absorbs it. Ionizing radiation deposits a relatively large amount of energy into a small area, and damage caused by the radiation varies with the dose. At low doses, cells repair the damage with no lasting effects. At moderate doses, cells can be changed permanently, leading to cancer or other abnormalities such as birth defects. At high doses, such as those delivered through radiation treatment for cancer or following the immediate effect of the atomic bombs dropped on Japan, tissues fail to function, severe burns result, and people who are exposed at these levels may die.
Predictability of Response to Ionizing Radiation
The severity of responses to high-dose radiation (generally considered a dose above 1 sievert, Sv) increases directly in proportion to the dose. There is generally a threshold for damage from the radiation: below a certain level the damage will not occur, and above the threshold, the higher the dose, the more extensive and severe the injury. These responses tend to be predictable, and are termed deterministic. Many of the earlier radiology pioneers developed erythema, burns, and radiation sickness from their exposures, as did individuals who lived near the atomic bomb explosions, and these are deterministic effects. At lower doses of radiation, generally below 1 Sv, the effect of the radiation is much less predictable, and no clear threshold exists. There is a chance that a person will experience an adverse outcome if exposed to the radiation, but it is not certain, and while the probability increases with increasing exposure, the severity may not. These effects tend to be all-or-none effects (either a cancer occurs or it does not). These effects are called stochastic effects. The types of effects included in this group are carcinogenesis and birth defects.
Mechanism of Carcinogenesis
The mechanism through which radiation exposure can lead to cancer is outside the scope of this review. However, carcinogenesis is believed to be multifactorial. Patient-related vulnerabilities are important, and a few patient groups have been identified who are particularly vulnerable to radiation-related carcinogenesis. Ionizing radiation has sufficient energy to break chemical bonds, can cause DNA damage, and therefore can contribute to how cancer may occur, but it is thought to act through various mechanisms rather than a single effect. Radiation can initiate gene mutations, promote the number of premalignant cells, and alter DNA repair.
There are believed to be important differences in cancer risks by age, almost certainly reflecting some of these differences.
Radiation Measurements
Several commonly used radiation measurements are described below, and the measures used in subsequent discussion are summarized in Table F-1.
The roentgen (R) describes the intensity of a beam of X-rays or gamma rays and the ionization of atoms in air as radiation passes through space. The roentgen also is the unit used in the calibration of X-ray generating equipment (CE Essentials, 2011).
The radiation absorbed dose (rad) describes radiation in a medium other than air. As ionizing radiation passes through matter (e.g., human tissue) it imparts energy into the medium ionizing it. One rad is equivalent to 100 ergs of energy absorbed in a gram of material (tissue). The comparable SI unit (International System of Units, adopted by nearly all countries) is the gray (Gy), which is expressed as joules per kilogram (1 Gy = 100 rad). The measure of rad or Gy describes the absorption of ionizing radiation in matter and is related to the biological damage in tissue; the greater the amount of energy transferred to tissue by ionizing radiation, the higher the rad or gray and the greater the biological damage (CE Essentials, 2011).
There are different types of radiation (e.g., X-rays, particle radiation), and these are associated with different amounts of energy and potential to cause biological damage; this variation in effect is attributed to the linear energy transfer (LET), which has to do with the type of radiation and the different biological effect on the tissue. Thus, while rads or grays measure the physical aspects of the energy, they do not reference the biological effect of various types of ionizing radiations and are not generally used as
TABLE F-1 Selected Units of Ionizing Radiation (measurements in bold are used in this summary)
|
|
|
| Measurement | Description |
|
|
|
| RAD / Gray (=100 rad) | Radiation in tissue |
| REM / Sievert (=100 rem) | Radiation in tissue, accounting for biologic sensitivity of tissue |
| Effective dose | Full body equivalent dose equal to a partial anatomic area radiation |
| EUS | Average effective dose per individual in the U.S. population, whether exposed to the specific exposure or not |
| EExp | Average effective dose to an individual in a group exposed to that source of radiation |
|
|
|
measures of exposure. The sievert (Sv) is the SI unit of dose that is used as a measure of exposure, as it attempts to reflect the biological effects of radiation. It is also measured in joules/kilogram (as is the gray), but it incorporates the biological effectiveness of different types of ionizing radiation in different types of tissues. For a given amount of radiation (measured in grays), the biological effect (measured in sieverts) can vary considerably as a result of the radiation-weighting factor (WR). The roentgen equivalent man (rem) is the older unit of equivalent dose, and 1 Sv = 100 rem. Rem remains the unit most widely used for occupational exposure.
Radiation exposures from medical imaging are rarely uniform—usually one area of the body is exposed much more than another (compare the tissue exposed to radiation from a mammogram to the tissue exposed for a head CT). This is very different from naturally occurring radiation, which often is more equally distributed across the body. To compare the radiation doses associated with different types of exposures, it would be most accurate to compare organ-specific exposures from different types of examinations. For example, comparison of the dose to the lungs from a chest X-ray and a chest CT would likely reflect the most accurate information regarding the potential for these two types of tests to cause harm. However, this is extremely impractical, as it would require creating a complex matrix of organ-specific doses for each medical procedure. This would make it difficult to compare different exposures, as some types of exposures involve partial-body irradiation, others full-body irradiation, and it makes it hard to compare overall exposures in this way.
In order to compare radiation doses to different body parts on an equivalent basis, it would be helpful to have a single metric that could be used to compare all radiation doses (even though this is imprecise as the mammogram is truly best summarized as a breast dose and a head CT a brain dose). The effective dose (E) is a metric for estimating a full-body dose that would be equivalent to an individual organ dose. It is estimated by calculating a weighted average of the doses (equivalent dose) to different organ systems. Thus, a large dose to a single organ might be similar (with respect to the stochastic cancer risks) to a smaller dose to the entire body. The weighting factors used to make these calculations reflect the different radio sensitivities of the tissues. Because of the ease of comparison, effective dose is an extremely useful measure of radiation exposure and will be the primary metric used in this summary.
The measurement of radiation emitted by radioisotopes used in nuclear medicine and positron emission tomography (PET) imaging, is the curie (Ci), which describes a quantity of radioactive material that disintegrates per second (CE Essentials, 2011). Decay or disintegration is a process by which a radioactive nucleus changes to another type of atomic nucleus. The SI unit of radioactivity is the becquerel (Bq). The becquerel is the activity of
a quantity of radioactive material in which one nucleus decays per second. The curie is an older, non-SI unit of radioactivity equal to the activity of 1 gram of radium-226.
Measurement of Absorbed Dose, Radiation Detriment, and Impact of Individual Factors on Radiation Detriment
The amount of radiation absorbed into the body, and the resulting doses to different parts of the body and organs, will depend on the person’s sex and size (including relative amounts of different tissues). Compared with an adult, a child exposed to a particular radiation dose will absorb more per unit of tissue, as there is less organ volume in which the radiation can dissipate. For example, compare a teaspoon of red dye added to a cup of water as compared with a gallon of water—the dye in the gallon of water will become much more dilute. The radiation detriment will relate both to the absorbed dose and to the type of tissue that has been irradiated, as some organs are much more vulnerable to the effects of radiation than other organs. A complete comparison of different sources of radiation exposure would try to estimate exposures to different organ systems and how this varies by age of exposure (as both will influence the detriment), but this level of detail would make it nearly impossible to provide an overview. Thus to keep the summary as simple as possible, I will use primarily the measurement of effective dose to describe the U.S. population’s exposures to radiation, variation within and across different imaging tests in the delivery of radiation, and radiation detriment.
Metrics of Population Exposure
The most useful metric to compare the population’s radiation exposure from different sources is the average exposure, measured in effective dose, per individual in the entire population. It is calculated by dividing the cumulative dose to the population by the number of individuals in the population (EUS) and does not consider whether an individual person is exposed or not. As an example, television (TV) exposes individuals to a small amount of ionizing radiation, and the average exposure from TV would be calculated by dividing the total radiation delivered by all hours of TV watched in the United States by the number of individuals in the United States. This will be an estimate (as individuals watch different amounts of TV), but it is useful for comparing average exposure to ionizing radiation from TV and other sources, such as the sun or radon. In contrast, certain types of radiation are received by a much smaller group of individuals, such as occurs with occupational exposures. For these exposures it is more reasonable to calculate the average dose to individuals exposed to that
source of radiation, rather than compute an overall effective dose for the population. This measurement, effective dose to those exposed (EExp), is calculated by dividing the cumulative dose to the individuals exposed by the number of individuals exposed. Both metrics will be used to describe population exposure.
WHAT IS KNOWN ABOUT CARCINOGENICITY OF IONIZING RADIATION
Ionizing radiation is widely used in industry and medicine, occurs in many different natural sources, and presents a health hazard. It causes microscopic damage to living tissue, and this results in elevated risks of cancer and birth defects at low exposures, and more substantial biological damage, including burns, radiation sickness and death, at higher exposures.
Radiation is one of the most heavily studied carcinogens, and extensive epidemiological and biological evidence supports the association of low and moderate doses of ionizing radiation with increased cancer risk. The epidemiological evidence of an increased risk of cancer comes from (1) cancer development among survivors of environmental and accidental exposures to radiation (i.e., survivors of atomic bombs, Chernobyl, and Soviet Union and United States weapons testing) (Pierce and Preston, 1993, 2000; Land, 1995; Ron et al., 1995b; NRC, 1996, 2003, 2006; Charles, 2001; Brenner et al., 2003; Preston et al., 2003, 2007; Preston, 2008); (2) populations medically irradiated for benign conditions such as scoliosis, tinea capitis, and tuberculosis (Ron et al., 1995a; Little, 2001; Modan et al., 2000; Ron, 2003); (3) patients receiving radiotherapy for malignant disease (Little, 2001; Neglia et al., 2001, 2006; Ron, 2003; Sachs and Benner, 2005; Sigurdson et al., 2005; Bassal et al., 2006; Ronckers et al., 2006); and (4) those who have received occupational exposures, including radiologists, radiological technologists, and nuclear power workers (Lewis, 1963; Matanoski et al., 1975; Muirhead et al., 1999, 2009; Berrington et al., 2001; Cardis et al., 2007; Linet et al., 2010). All of these groups received doses in the range of that delivered by current medical imaging and have been shown to be at increased risk of developing cancer. Evidence of radiation-induced cancer is strongest for leukemia, but an increased risk of all solid cancer types (e.g., breast, lung, colon) has been associated with exposure to doses of ionizing radiation in the same range as that delivered by medical imaging.
A full discussion of the data on the risks of ionizing radiation is outside the scope of the review; however, a comprehensive review of the published literature can be found in the report of the National Research Council, Biological Effects of Ionizing Radiation (BEIR) Subcommittee (BEIR VII; NRC, 2006). According to the BEIR subcommittee, the most accurate
current model of radiation carcinogenesis at low to moderate doses is the linear and nonthreshold model, which predicts that the risk of outcomes (primarily cancer) is directly proportional to the radiation dose received, is additive, and does not respect a minimum-risk threshold. This model assumes there is no safe level of radiation exposure. This theory is the basis for radiation protection recommendations by national and international committees tasked with ensuring radiation protection of workers and the general population (NRC, 1996; Charles, 2001; Gonzalez et al., 2007; NCRP, 2009). While this theory is widely endorsed within the radiation safety and protection communities, it is challenged by some who believe there is a threshold below which there is no cancer risk (Strzelczyk et al., 2007). Its important to emphasize that this theory is far less relevant for understanding the detrimental effects of radiation from many exposures, such as CT, where directly observed evidence shows that radiation doses delivered to patients in the range of CT are carcinogenic. The model is most helpful to understand the carcinogenicity of very low exposures that are below those that have been studied in epidemiological studies.
A number of different mathematical models have been developed to estimate the cancer risks associated with exposure to ionizing radiation across a range of doses. The dominant model that has been most widely adopted was used by National Academy of Sciences in the BEIR VII report (NRC, 2006). There are a large number of assumptions in this model, among them that the risk of solid cancer is linear and follows a nonthreshold model, and that the patterns of cancer outcomes among Japanese atomic bomb survivors are directly transferable to the U.S. population. The impact of these assumptions is often taken into account with creation of uncertainty limits around estimated risks.
SOURCES OF IONIZING RADIATION EXPOSURE TO THE U.S. POPULATION
The National Council on Radiation Protection and Measurements (NCRP, 2011) is a nongovernmental, not-for-profit corporation chartered by Congress to collect, analyze, develop, and disseminate to the public information and recommendations about radiation, radiation protection, and radiation measurements. The NCRP published two reports detailing the U.S. population’s exposure to ionizing radiation in two time periods; Report No. 93 was published in 1987 (NCRP, 1987b), and Report No. 160 was published in 2009 as an update to this earlier report and describes exposures through 2006 (NCRP, 2009). These two reports are comprehensive, and each reviewed hundreds of different data sources and references. They provide the most accurate overview of the magnitude of the U.S. population’s exposure to radiation and the distribution of exposure among
the various sources of radiation. Data from these two reports have been summarized to highlight current exposures, sources that deliver high radiation exposures, and sources that have changed over time.
Radiation from medical imaging is a large and growing source of radiation exposure to the U.S. population. I have led several analyses that describe medical imaging and associated radiation exposure within a large cohort of patients (approximately 2.5 million) enrolled across six integrated health plans in the United States (Burger et al., 2010a,b). These health plans participate in the Health Maintenance Organization (HMO) Research Network, and the National Cancer Institute (NCI)-funded Cancer Research Network (CRN), and as such, they have common data elements to permit assessing medical imaging within the HMO setting. The work was used to supplement the NCRP reports and to further characterize the U.S. population’s exposure to radiation from medical imaging. We had more detailed data on medical imaging at the patient (rather than population) level, allowing more accurate estimates of individual doses and the proportion of patients who exceed certain threshold doses.
Sources of Radiation
Radiation exposure is described within five broad categories: (1) ubiquitous background radiation, sometimes described as natural sources of radiation; (2) radiation from medical procedures; (3) radiation from consumer products or activities involving radiation sources; (4) radiation from industrial, security, medical, education and research activities; and (5) occupational exposure (see Table F-2).
Ubiquitous Background Radiation
There are four primary sources of radiation exposure that fall in this category: (1) external exposure from the sun and cosmic rays (space radiation); (2) external exposure emitted from the earth (terrestrial radiation, primarily from potassium, uranium, and thorium in surface soil and rocks); (3) internal exposure from inhaled radon (released from the earth); and (4) internal exposure from radionuclides in the body (particularly potassium). Exposure to radon is the largest contributor to this category, accounting for nearly 75 percent of ubiquitous background radiation. Radon gas comes from the breakdown of uranium in soil, rock, and water, and it is trapped in houses and inhaled.
TABLE F-2 Summary of U.S. Population’s Annual Exposure to Ionizing Radiation from Different Sources, 2006–2010
|
|
||
| Radiation Source | EUS (mSv) | EExp (mSv) |
|
|
||
| Ubiquitous background radiation | 3.11 | — |
| Radon and thoron (inhalation) | 2.28 | |
| Space | 0.33 | |
| Ingestion | 0.29 | |
| Terrestrial | 0.21 | |
| Medical radiation | 3.00 | 7.8 |
| Computed tomography | 1.47 | 5.1 |
| Nuclear medicine | 0.77 | 0.61 |
| Interventional radiology | 0.43 | 1.14 |
| Conventional X-rays* | 0.33 | 0.68 |
| Consumer | 0.13 | |
| Industrial, security, research, education | 0.003 | |
| Occupational | 0.005 | 1.1 |
| Medical | 0.8 | |
| Aviation | 3.1 | |
| Nuclear power | 1.9 | |
| Industry and commerce | 0.8 | |
| Education and research | 0.7 | |
| Government, Department of Energy, military | 0.6 | |
| TOTAL | 6.2 | |
|
|
||
NOTE: These numbers have been adapted from NCRP (2009) and from our research of radiation exposure across six integrated health care systems that participate in the NCI funded Cancer Research Network (calculations of EExp, medical imaging) (Burger et al., 2010a,b).
*Includes mammography.
SOURCES: NCRP (2009, p. 242–243; used with permission of the National Council on Radiation Protection and Measurements, http://NCRPpublications.org); Burger et al. (2010a,b).
Medical Exposure to Radiation
Radiation used for medical imaging Most medical imaging tests—radiography, fluoroscopy, angiography, and CT (all utilize X-rays), and nuclear medicine (utilizes gamma rays)—expose patients to ionizing radiation. In any given year, between 30 and 40 percent of the U.S. population will undergo one or more imaging tests that deliver radiation, varying by age and sex, and this has increased only slightly over time (Burger et al., 2010a,b). Numerically, conventional radiographs contribute the greatest number of imaging tests (58 percent), followed by CT (12 percent), and fluoroscopy, angiography, and nuclear medicine (2–5 percent each). However, because the doses are so much higher for CT, it contributes the majority (nearly 70 percent) of patients’ exposure to radiation from medical imaging (NCRP, 2009; Burger et al., 2010a,b). Currently, the average exposure to radiation from medical imaging is around 3 mSv per year
(NCRP, 2009; Burger et al., 2010a,b) and is thus approximately equal in magnitude to the exposure to ubiquitous background radiation (Table F-2). For medical radiation, around one-third of the population is exposed, and yet the average effective dose (EUS) is generally reported for the entire population. The NCRP (2009) explains this as a limitation of its report, as it did not have detailed information to permit calculation of individual exposures. In our work describing the radiation exposure to enrollees of six large integrated health plans, we had detailed information about imaging utilization and doses for individual patients. We were also able to calculate the average effective dose limited to those who underwent medical imaging that delivers ionizing radiation. We estimate the average effective dose among those who underwent imaging that delivers ionizing radiation to be 6.7 mSv in 2007, with the majority of that dose coming from CT (Burger et al., 2010a,b).
Radiation used in medical treatment for cancer Approximately 50 percent of patients diagnosed with cancer in the United States will undergo external beam radiation as part of the treatment and palliation of cancer. Given the severity of these patients’ underlying health conditions, the relatively small proportion of patients who are exposed (50 percent of cancer patients but 3 percent of the population) and the extremely high doses of radiation used in this setting, this radiation is generally not included in the calculations of population exposures. This radiation is carcinogenic, as cancer survivors who have undergone radiation treatment are at higher risk of second primary malignancies, but these risks are viewed as offset by the benefit of this radiation as treatment for their primary cancer.
Consumer Products and Activities
This category is a small contributor to the population’s annual dose of radiation, but it includes a broad range of exposures that consumers routinely encounter as part of daily life, including (in declining order on the basis of average population exposure) cigarette smoking, building materials, air travel, mining and agriculture, combustion of fossil fuels, road construction materials, and glass and ceramics. Of note, exposure from air travel reflects an increase in radiation exposure due to being at higher altitudes and not from exposure to the airport screening devices. These full-body-screening devices (backscatter X-ray devices) deliver an extremely small amount of radiation exposure.
Industrial, Security, Medical, Educational, and Research Activities
This category includes less common exposures to the U.S. population, that have been subdivided into six categories (in decreasing order based on average population exposure): caregiving or other contact with nuclear medicine patients (accounting for 75 percent of exposure in this category); nuclear power generation; industrial, medical, educational, and research activities; Department of Energy installations; decommissioning and radioactive waste; and security inspection systems. This category is for exposures among the general public, and not the occupational exposures of workers in these industries, which are included in the following group. This category also is a small contributor to the population dose, and while doses are averaged, exposure is limited to individuals who live in proximity to these activities.
Occupational Exposures
This category includes occupational exposures received by approximately 1.2 million employees in the medical, aviation, and nuclear power industries; in education and research; and some government employees, especially in the Department of Energy and the military. Although these exposures are not trivial for those individuals who are exposed (average 1.1 mSv annually across all occupational categories), they contribute very little to the total population’s average dose burden. These exposures are described in greater detail below.
Summary
In 2006, the majority of radiation exposure to the U.S. population (96 percent) came from two categories: ubiquitous background radiation and radiation from medical imaging. Occupational exposures, when divided among the entire U.S. population, are a small contributor to total dose, although among a small number of individuals who work in these fields, they contribute a large proportion of exposure.
TEMPORAL CHANGES IN EXPOSURE TO IONIZING RADIATION WITH FOCUS ON MEDICAL EXPOSURE
Between 1985 and 2006, the average annual effective radiation dose per individual in the U.S. population approximately doubled, and the increase was due to the dramatic growth of relatively high-dose medical imaging procedures, including CT and nuclear medicine (NCRP, 1987b, 2009). As a proportion of all radiation exposure, medical imaging con-
tributed approximately 25 percent of the population’s exposure to ionizing radiation in 1985; whereas its contribution had increased to 50 percent in 2006 (Figure F-3). The absolute radiation exposure from other sources did not change, and thus the population’s total exposure increased due to the increase in radiation from medical imaging.
Utilization of X-Rays, CT, and Nuclear Medicine
The utilization of medical imaging has increased dramatically over the last two decades, particularly using advanced imaging techniques including CT and nuclear medicine (Bhargavan and Sunshine, 2005; Smith-Bindman et al., 2008; Mettler et al., 2009; Burger et al., 2010a,b; Dinan et al., 2010). These examinations deliver considerably higher doses of ionizing radiation in comparison to conventional radiographs, and the increase in these examinations led to an approximate doubling of the population’s overall exposure to ionizing radiation (NCRP, 2009). Typical doses associated with common imaging examinations are shown in Table F-3 (Mettler et al., 2008). The effective dose is shown for each examination type for ease of comparison across study types, but organ doses are also important. For example, the effective dose for a mammogram is lower than that for an abdominal X-ray, but the breast dose from a mammogram is much higher than from an abdominal X-ray. The breast dose for a mammogram is
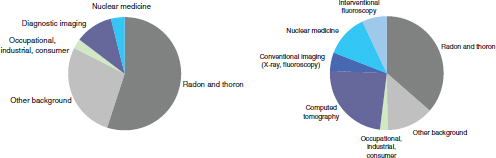
Figure F-3 Proportion of radiation from various sources, 1985 (left) and 2006 (right). The charts demonstrate that the proportion of exposure from medical imaging, shown in blue, increased substantially. Note: For each source of radiation, the NCRP took the product of the estimated number of people exposed and the average effective dose equivalent received from that source, to generate a collective dose from that source. The collective dose from each source was then divided by the entire U.S. population to obtain the contribution from that source to the average effective dose equivalent for a member of the U.S. population.
SOURCE: Data from NCRP (2009).
approximately 2 mGy, with film mammography (2.37 mGy) slightly higher than digital mammography (1.86 mGy) (Hendrick et al., 2010), but much higher than the overall effective dose of 0.4 mSv. Table F-3 highlights that CT delivers substantially higher radiation doses than conventional radiographs. For example, a single posterior-anterior (PA) view of the chest delivers an average radiation dose of 0.02 mSv, whereas a chest CT delivers an average dose of 7–15 mSv, depending on the indication (350–750 times higher). Dental X-rays, while common, deliver relatively small doses of radiation per examination (0.01 mSv). Bone density examinations (Dexa)
TABLE F-3 Typical Effective Doses of Radiation for Common Conventional X-ray and CT Procedures
|
|
|
| Examination | Average Effective Dose (mSv) |
|
|
|
| Adult Effective Doses for Various Diagnostic Radiology Procedures | |
| Skull | 0.1 |
| Cervical spine | 0.2 |
| Thoracic spine | 1.0 |
| Lumbar spine | 1.5 |
| Posteroanterior and lateral study of chest | 0.1 |
| Posteroanterior study of chest | 0.02 |
| Mammography | 0.4 |
| Abdomen | 0.7 |
| Pelvis | 0.6 |
| Hip | 0.7 |
| Shoulder | 0.01 |
| Knee | 0.005 |
| Other extremities | 0.001 |
| Adult Effective Doses for Various CT Procedures | |
| Head | 2 |
| Neck | 3 |
| Chest | 7 |
| Chest for pulmonary embolism | 15 |
| Abdomen | 8 |
| Pelvis | 6 |
| Three-phase liver study | 15 |
| Spine | 6 |
| Coronary angiography | 16 |
| Calcium scoring | 3 |
| Virtual colonoscopy | 10 |
|
|
|
SOURCE: Adapted from Mettler et al. (2008). Used with permission of the Radiological Society of North America. Mettler, F. A., Jr., W. Huda, T. T. Yoshizumi, and M. Mahesh. 2008. Effective doses in radiology and diagnostic nuclear medicine: A catalog. Radiology 248(1):254–263.
are also common and also deliver relatively small doses of radiation per examination (0.01 mSv).
Several studies have assessed patterns of medical imaging within fee-for-service or Medicare-insured populations (Bhargavan and Sunshine, 2005; Kuhn, 2006; Hackbarth, 2007; Baker et al., 2008; Fazel et al., 2009; Chen et al., 2010; Dorfman et al., 2011). These studies have demonstrated a dramatic increase in imaging over time. It has been widely believed that imaging rates may be lower among members of integrated health plans. We assessed patterns of medical imaging among members of six integrated health systems that participate in an NCI-funded consortium of health systems that include HMO models of care (Burger et al., 2010a,b). The availability of comprehensive data on all health care received—including detailed information on medical imaging—allowed us to assess patterns of imaging over time using very detailed methods. We found the frequency of CTs increased from approximately 50 CTs per 1,000 patients in 1994 to 197 CTs per 1,000 patients in 2007. Thus by 2007, for every 100 enrollees, nearly 20 CTs are obtained per year. We also found that among patients who underwent CT, the number of CTs per person doubled, so on average, patients who underwent CTs in 2007 had a mean of 2 scans. The rates of imaging increased with advancing age, and within each age stratum, imaging increased over time. Thus, patterns of imaging in the HMO-insured populations are similar to those seen among fee-for-service insured populations (Burger et al., 2010a,b).
Our work assessing patterns of imaging across the CRN allowed us to assess average radiation exposure among only those who underwent medical imaging, and to assess change in these exposures over time. These analyses demonstrated that between 1994 and 2007, exposures among those who underwent imaging that delivered ionizing radiation more than doubled (increasing from 3.3 to 6.7 mSv average exposure), and the majority of the increase was among patients who underwent CT (EExp increased from 0.97 to 4.1 mSv/year).
Several organizations are developing strategies to reduce the increasingly high exposures to radiation from medical imaging, including radiology professional societies (Amis et al., 2007; Hricak et al., 2011), public media campaigns (Alliance for Radiation Safety in Pediatric Imaging, 2009), government agencies such as the Food and Drug Administration (FDA, 2010), and federal and state legislative bodies (U.S. House of Representatives, 2010; State of California, 2010).
VARIATION IN MEDICAL RADIATION EXPOSURE
Variation in doses associated with all types of imaging examinations have been noted, including chest X-rays, mammography, fluoroscopy, angiography, and CT. The FDA Center for Devices and Radiological Health
collaborates with the Conference of Radiation Control Program Directors (from most U.S. states) to characterize the radiation doses patients receive from various medical imaging tests. Each year the Nationwide Evaluation of X-ray Trends (NEXT) survey program selects a particular radiological examination for study and captures radiation exposure data from a nation–ally representative sample of U.S. clinical facilities (Calicchia et al., 1991; Conference of Radiation Control Program Directors, 1992, 2007; Spelic et al., 2004; Spelic, 2007). Since 1973, NEXT has conducted surveys on examinations related to the adult chest, abdomen, lumbosacral spine, upper gastrointestinal fluoroscopy, mammography, CT, dental radiography, and pediatric chest radiography. These reports describe substantial variation in doses associated with a range of X-ray procedure types. The FDA reported on the doses associated with CT twice, once in 1990 and more recently in 2000. (The third NEXT study that included CT was conducted in 2005, and those results have not been fully reported.) For each NEXT CT study, they found variation in dose associated with head and abdominal CT (the two study types sampled).
Technical changes in CT have progressed rapidly in the last 10 years, including the development of multi-detector scanners that have led to a reduction in the time to complete a single evaluation. This in turn has permitted and encouraged the development of more complex protocols that have resulted in greater variation in doses associated with CT and higher doses (Foley et al., 2000; Rydberg et al., 2000; Hoeffner et al., 2004; Hurwitz et al., 2006, 2007; FDA, 2009; Smith-Bindman et al., 2009). For example, the time it takes to complete a CT examination has dramatically declined, so that it is now possible to scan the entire body in a second. This reduction in time has led to the creation of multiphase scanning protocols, which involve repeat imaging of a particular part of the body during different phases of the cardiac cycle; one CT is done during the arterial phase of the cardiac cycle, one is done during the venous phase, and one after a short delay. These scans give information about tissue blood flow that cannot be achieved in single-phase scanning. These three CTs take only seconds to at most minutes to complete, but in fact, they represent repeated scanning—and repeated exposure to radiation—of the same area of the body. The impact of multiphase scanning on the accuracy of diagnosis has not been well studied (i.e., it is not well known if this increases the accuracy of diagnosis), but it will increase the radiation dose a patient receives by as many times as phases of imaging. In the example given, the radiation dose the patient receives will be three times higher than a single-phase study. Multiphase scanning is becoming increasingly common, and as a result, the doses for a particular anatomic area that has been imaged increase.
CT coronary angiography has been studied in detail, and significant variation in radiation dose has been demonstrated for this examination
(Einstein et al., 2007a,b, 2008, 2010; Hausleiter et al., 2009). We completed a study assessing radiation dose associated with an additional 10 indications for routine CT (Smith-Bindman et al., 2009). Our study aimed to estimate the amount of radiation exposure associated with the types of CT examinations performed most commonly in the United States; to estimate variation across study types, patients, and institutions; and to use these data to estimate the lifetime attributable risk of cancer associated with these tests. Data were collected at four institutions in the San Francisco Bay Area. We abstracted radiation dose information on examinations conducted on 1,100 individuals—on average 100 patients who underwent each type of CT. We documented higher and more variable doses than typically quoted for the most common types of diagnostic CT studies performed in clinical practice. For example, the median effective dose of an abdomen and pelvis CT (the most common type of CT examination performed in the United States) is often quoted as 8–10 mSv, yet we found the median dose of an abdominal CT was 66 percent higher, and the median dose of a multiphase abdominal CT was nearly fourfold higher (Figure F-4). These multiphase abdomen and pelvis CTs are increasingly used as part of routine evaluation.
Further, we found substantial variation in doses within and across institutions, with a mean 13-fold variation between the highest and lowest dose for each CT study type included. For some procedure types, there was up to a 20-fold variation in dose between the patients who received the highest and lowest doses for the same procedure type. Thus, depending on where an individual patient received imaging and the specific technical parameters used, the effective dose received could substantially exceed the median. While some of this variation may have been clinically indicated to accommodate patients of different size or the specifics of the clinical question that was being addressed, the variation in effective dose was dramatic and of greater magnitude than is widely considered acceptable, particularly considering that the patients were already stratified within relatively well-defined clinical groups. The variation in dose across the four clinical sites reflects site-specific methods of choosing different technical parameters to answer the same clinical question. The results were striking in part because CT delivers relatively high radiation doses in comparison to conventional radiographs.
There has been little work characterizing dose and variation in dose for CT or nuclear medicine examinations, making it impossible to understand the true magnitude of the problem. However, preliminary reports presented by the American College of Radiology (describing results from the National Dose Registry for CT, a pilot program to collect dose data and from their CT certification program) (ACR, 2011) and from our ongoing work collecting dose data across the six sites of the CRN, suggest that the problem of variation in dose may be even greater than indicated by our earlier work.
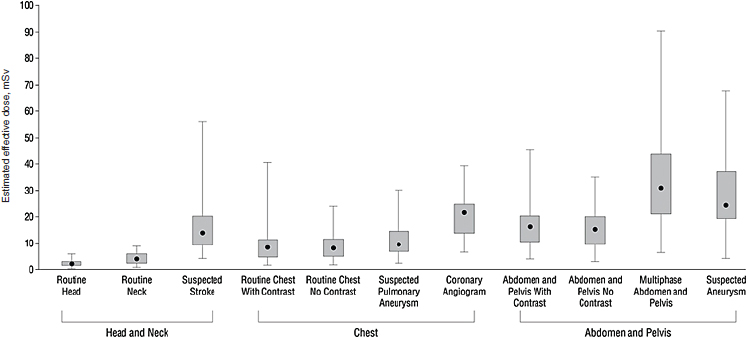
FIGURE F-4 Median effective radiation dose (interquartile range, minimum, and maximum) for each type of CT study.
SOURCE: Smith-Bindman et al. (2009, p. 2081). Reprinted with permission from Smith-Bindman, R., J. Lipson, R. Marcus, K. P. Kim, M. Mahesh, R. Gould, A. Berrington de Gonzalez, and D. L. Miglioretti. 2009. Radiation dose associated with common computed tomography examinations and the associated lifetime attributable risk of cancer. Arch Intern Med 169(22):2078–2086.
Of note, there have been successful efforts to try to standardize and minimize variation in radiation dose for mammography. The Mammography Quality Standards Act (MQSA) was passed by the U.S. Congress and signed into law in 1992, to establish national quality standards for mammography. The MQSA required that to perform mammography, facilities had to be certified by the FDA or the agency’s designate. Facilities are required to be accredited and certified, and they are required to pass annual surveys that include collection of radiation dose data associated with those examinations. Radiation doses associated with mammography have come down substantially since the creation of MQSA and enforcement of standards by FDA oversight. The MQSA is unique, and there is no FDA oversight for any other imaging examination. There are currently no guidelines in the United States on appropriate or target doses for CT.
REGULATORY EXPOSURE LIMITS FOR WORKERS
Several groups of workers are exposed to radiation though occupational exposures. The following broad categories are typically used to characterize occupational exposures: medical, aviation, commercial nuclear power, industry and commerce, education and research, and governmental/ Department of Energy/ military. The average annual occupational radiation exposure across all industries is 1.1 mSv per year, with considerable variation across industries (Table F-4). Aviation has the highest mean annual exposure (3.1 mSv), similar in magnitude to ubiquitous background radiation exposure for the U.S. population. Nuclear power workers are close behind (1.9 mSv annually). All other workers, on average, have occupational exposures substantially below 1 mSv per year.
Recommendations regarding occupational exposure limits have been developed by the International Commission on Radiological Protection
TABLE F-4 Typical Annual Occupational Exposures to Radiation
|
|
|
| Occupational Sector | EExp (mSv) |
|
|
|
| Average occupational exposure | 1.1 |
| Aviation | 3.1 |
| Nuclear power | 1.9 |
| Medical | 0.8 |
| Industry and commerce | 0.8 |
| Education and research | 0.7 |
| Government, Department of Energy, military | 0.6 |
|
|
|
SOURCE: NCRP (2009, p. 12). Used with permission of the National Council on Radiation Protection and Measurements, http://NCRPpublications.org.
(ICRP), the NCRP, and other groups focused on radiation protection, with the primary objectives being to prevent acute exposure and limit chronic exposure among workers, and to limit the general public’s exposures from these industries. However, while there are general guidelines for dose limits, adoption of many of the ICRP’s suggestions into federal laws, state laws, NCRP recommendations, and innumerable occupational guidelines in the United States, there is no single organization in the United States responsible for setting standards regarding dose limits, or with responsibility of oversight of radiation protection across all industries. Current regulation and oversight includes a patchwork of federal, state, and industry-based regulations, various techniques of monitoring and assessing dose exposures among workers, and various requirements for monitoring and for reducing exposures for workers who exceed limits. There is no consistency across states in education or training or credentialing for workers who may be exposed to ionizing radiation as part of their work. In general, the guidelines adopted are based on the assumption that there is no absolute safe level of exposure (no threshold) and that even the smallest exposure has some probability of causing cancer. While accepting that there is no dose without some risk, these guidelines vary in the level at which the risk is considered acceptably low.
Nuclear Power Industries
The Nuclear Regulatory Commission is a governmental organization whose leadership is appointed by the President and confirmed by the Senate. The Nuclear Regulatory Commission formulates policies, develops regulations governing nuclear reactor and nuclear material safety, and sets occupational dose limits for individuals employed in nuclear power industries. Annual occupational radiation exposure limits established by the Nuclear Regulatory Commission are found in Title 10, part 20 of the Code of Federal Regulations (http://www.nrc.gov/reading-rm/doc-collections/cfr/part020/). These limits include (but are not limited to) the following:
a. A total effective dose equivalent: 5 rems (50 mSv)/year
b. The sum of the deep-dose equivalent to any individual organ or tissue (other than the lens of the eye): 50 rems (500 mSv)
c. A lens dose equivalent: 15 rems (150 mSv)
d. Pregnant women, because of the increased health risks to the rapidly developing embryo and fetus, have a lower threshold: 0.5 rem (5 mSv/ gestation period)
e. Minors, because of the increased health risks to children, have a lower threshold: 0.5 rem (5 mSv/year).
The dose limit for nonradiation workers and members of the public from occupational exposures is 2 percent of the annual occupational dose limit. Therefore, a nonradiation worker can receive a whole-body dose of no more than 0.1 rem/year (1 mSv) from industrial ionizing radiation.
The Nuclear Regulatory Commission’s limits are a widely applicable standard, and they are closely aligned with the NCRP recommendations regarding occupational limits. The overall annual occupational exposure limit of 50 mSv/year full body total effective dose is the most widely adopted limit in the United States. Regulatory limits on occupational exposure can differ in other countries. For example, the European Union has adopted an exposure limit of 20 mSv/year as a full-body total effective dose (ICRP, 1991; IAEA, 1996).
Medicine
The NCRP mandates personnel monitoring programs for all individuals working with ionizing radiation within medicine, which includes radiologists, radiographers, physicians, biomedical repair personnel, and others who may occasionally be in proximity to ionizing radiation (i.e., surgical personnel who are involved in C-arm and cystofluroscopy). A designated qualified radiation safety officer and/or radiation safety committee is responsible for making sure that any person who is occupationally exposed to ionizing radiation is properly educated and understands the biological effects of ionizing radiation, and that monitoring programs are in place. Any individual who may reasonably be expected to receive 1 mSv per year or greater needs to be monitored. Medical personnel are monitored for evidence that their exposure exceeds occupational limits and receive progressive warnings and interventions to reduce their exposures if these limits are exceeded.
Effective dose limits are set by NCRP recommendations that are stated in their official reports. Dose limits for occupational exposure are based on NCRP reports No. 91, 105, and 116 (NCRP, 1987a, 1989, 1993). The whole-body dose in the United States is set at 50 mSv each year. Allowable whole-body doses are considerably lower than the dose allowed to specific tissues like the skin, extremities, and lens of the eye. Laws require the recording of occupational radiation exposures, typically as part of an annual report. Data on current radiation exposure, cumulative annual exposure, and lifetime cumulative exposure (from a single work location) must be included in the report.
There are several ongoing studies, sponsored by the NCI, to assess cancer risks among physicians who are exposed to high levels of radiation associated with medical imaging, including interventional cardiologists and interventional radiologists. The results of these studies are expected to be published during 2012.
SEGMENT OF POPULATION ESTIMATED TO EXCEED OCCUPATIONAL REGULATORY EXPOSURE LIMITS
There are relatively few data that have described the distribution in radiation exposure at the individual level that would permit assessing what proportion of the population receives high (20–50 mSv) or very high (>50 mSv) radiation exposure annually. Fazel and colleagues (2009) reported that the between 2005 and 2007, among a fee-for-service insured population aged 18–65, high and very high radiation doses were incurred by approximately 2 percent and 0.2 percent of adult enrollees per year, respectively. In our recent study across the six integrated health plans, we found that nearly twice as many enrollees had high exposures, and five times as many enrollees had very high radiation exposures that exceeded the annual occupational exposure limits (Burger et al., 2010a,b). Thus nearly 1 percent of enrollees will have received exposures that exceed allowable occupational thresholds.
ESTIMATE OF THE NUMBERS OF CASES ATTRIBUTABLE TO MEDICAL USES OF RADIATION
The number of cancers that might result from current medical use of radiation can be estimated at the patient level (if a patient undergoes a particular type of scan, what is the risk of cancer) and at the population level (i.e., how many cancers are likely to result from current utilization of medical imaging tests).
Risk from an Individual CT Examination
Among frequent imaging examinations, CT is associated with the highest radiation exposure and is utilized across all age groups. The cancer risk associated with a single CT examination will be considerably higher than other examinations. However, even for CT, the radiation exposure will vary by type of study, and so will cancer risk. Thus it is important to consider the study type and actual dose of a particular scan when estimating the cancer risk. In our work published in December of 2009 in Archives of Internal Medicine (Smith-Bindman et al., 2009), we estimated that the risks of cancer will vary dramatically by the type of study and age of patient at the time of scan. The estimated number of patients undergoing CT that would lead to the development of one radiation-induced cancer, by type of CT examination and age at the time of exposure, is shown in the Archives paper. We estimated that 1 in 270 women who underwent a CT coronary angiogram at age 40 will develop cancer from the procedure, compared to 1 in 600 men. For a routine head CT scan at the same age, because the
dose is so much lower, the estimated risk is that 1 in 8,100 women and 1 in 11,080 men will develop cancer. In patients around 20 years of age, the risks were approximately twice as high. And among patients who were age 60, the risks were substantially lower. We found these risks for many CT study types to be substantially higher than those routinely quoted. In Figure F-5, the range in cancer risk, based on the range of observed doses, is shown for several types of scans, assuming the examinations had all been received by 20-year-old women. We chose to show this group, as it is in younger patients for whom cancer risks are of greater concern. For each scan type, there was a dramatic variation in risks based on the variation in the doses actually used. At the highest extreme of observed dose, the risk of a patient developing cancer was as high as 1 in 80.
Risk from an Individual Nuclear Medicine Scan
Nuclear cardiac perfusion tests are used in the assessment of coronary artery disease, and they represent the second largest source of medical radiation exposure in the United States. The risks tend to be lower than for CT, as the patients imaged tend to be older. Berrington de Gonzalez et al. (2010) estimated future cancer risks that would result from cardiac perfusion imaging in the United States. Utilization of imaging was determined from national survey data, and radionuclide dosage was estimated to follow current guidelines. Cancer risk projection models were generated based on the National Research Council’s Biologic Effects of Ionizing Radiation VII report (NRC, 2006), under the assumption that cancer risk has a linear relationship with radiation exposure even at low doses. The mean projected number of radiation-related incident cancers and 95 percent uncertainty intervals were estimated using Monte Carlo simulation methods. For an individual aged 40–50 years at the time of testing, lifetime risk estimates ranged from 1 cancer per 1,250 tests (95% uncertainty interval: 1 cancer per 769 tests to 1 cancer per 3,333 tests) for a stress-only technetium-99m test to 1 cancer per 400 tests (95% uncertainty interval: 1 cancer per 172 tests to 1 cancer per 1,111 tests) for a dual-isotope (thallium-201/technetium-99m) study. Risks were 50 percent lower at age 70, and were broadly similar for males and females at all ages. These tests are rarely used among younger adults, and thus risks were not calculated for patients in their 20s.
Risk of Cancer to the U.S. Population
Even though the risk of cancer to an individual patient is relatively modest, the large number of people exposed could translate into many cases of cancer resulting directly from the radiation exposure from medical imaging. Berrington de Gonzalez and colleagues have completed several papers
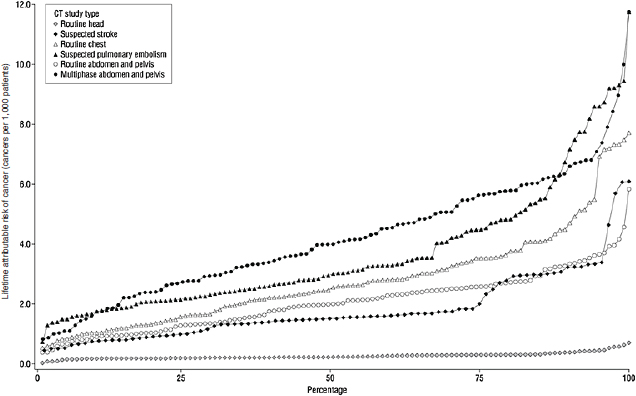
FIGURE F-5 Estimated range in the lifetime attributable risk of cancer if a 20-year-old woman underwent one of several types of CT studies using observed radiation dose.
SOURCE: Smith-Bindman et al. (2009, p. 2082). Reprinted with permission from Smith-Bindman, R., J. Lipson, R. Marcus, K. P. Kim, M. Mahesh, R. Gould, A. Berrington de Gonzalez, and D. L. Miglioretti. 2009. Radiation dose associated with common computed tomography examinations and the associated lifetime attributable risk of cancer. Arch Intern Med 169(22):2078–2086.
that have estimated the number of future cancers that would expected to result from ionizing radiation associated with current levels of medical imaging.
These analyses have estimated future cancers that would result from exposure to conventional radiographs (Berrington de Gonzalez and Darby, 2004), CT (Berrington de Gonzalez et al., 2009), and myocardial perfusion scanning (the most common type of nuclear medicine examination) (Berrington de Gonzalez et al., 2010). Combined, these exposures would account for approximately 80 percent of the U.S. population’s cumulative annual exposure to radiation from medical imaging.
These previously published results have been updated by Dr. Berrington de Gonzalez for this report to focus specifically on future breast cancers, taking into account the increase in imaging rates since these papers were published, and including cancer risks associated with the additional imaging examinations not covered in these prior reports. These calculations were based on estimates of the number of imaging tests conducted annually, the age distribution of patients undergoing those tests, radiation delivered by those tests, organ-specific doses, and models of carcinogenesis, including the biological effectiveness of the radiation, underlying cancer risks of the population, lag time between exposure and cancer induction, and mortality in the population undergoing imaging. The major sources of information used in each of these analyses are clearly outlined in the primary manuscripts. For CT, which is the largest contributor to radiation dose, each of the major assumptions used to generate the estimates was varied in the model to generate an estimate of the uncertainty limits. Each of the papers is summarized below.
Cancers Associated with Radiography (Berrington de Gonzalez and Darby, 2004)
Dr. Berrington de Gonzalez’s original analysis estimated the risk of cancer from conventional X-rays in the United Kingdom and 13 other developed countries. The authors combined data on the frequency of X-rays (including mammography), estimated organ-specific radiation doses from each type of X-ray, and used cancer risk models for each organ system that were based on the Japanese atomic bomb survivor data, and combined these with population-based cancer incidence rates. The authors estimate that in the United Kingdom about 0.6 percent of the cumulative risk of cancer to age 75 years could be attributable to diagnostic X-rays. This percentage is equivalent to about 700 cases of cancer per year. In the 13 other countries, estimates of the attributable risk ranged from 0.6 percent to 1.8 percent; whereas in Japan, which had the highest estimated annual exposure level in the world, it was more than 3 percent.
The model developed for the 2004 paper was updated for this Institute of Medicine summary to estimate breast cancers that would result from conventional radiographs conducted in the United States in 2006. This involved updating assumptions regarding the number of conventional radiographs conducted in the United States in 2006 (Mettler et al., 2009) (overall increase from 960 to 1,080 tests /1,000 patients/year), and adapting the results for the 14 countries included in the original publication to cancer incidence rates in the United States. Based on these analyses, Dr. Berrington de Gonzales has estimated that 250 breast cancers would result from conventional X-ray use in the United States in 2006, and that the number would be likely to increase to 280 with imaging rates observed in 2010.
Cancers Associated with CT (Berrington de Gonzalez et al., 2009)
Berrington de Gonzalez et al. (2009) estimated the frequency of different types of CT scans performed in the United States in 2007 using a combination of data sources, primarily Medicare claims data and the IMV Medical Information Division survey of CT scan use in 2,451 U.S. facilities in 2007. Radiation-related cancer risks depend on sex and age at exposure, and the authors estimated the age and sex distribution for each CT scan type using a large national commercial insurance database. These estimates were scaled to be applicable to the age–sex distribution of the U.S. population and combined with the national frequency estimates. The authors used risk models based on the National Research Council’s BEIR VII report (NRC, 2006) with minor modifications, and they developed additional models for anatomic sites that were not covered in the BEIR VII report.
An important assumption in the estimation of lifetime radiation-related cancer risk is the life expectancy of persons receiving CT scans. There is a lag between radiation exposure and cancer diagnosis (which can be as short as 2 years for leukemia and 10 years for brain cancer [Preston et al., 2007]), and patients who are unlikely to survive that long are unlikely to develop imaging-related cancer. To address the problem of survival, the authors used the commercial insurance data set to estimate the proportion of scans performed in patients who were unlikely to survive long enough to develop cancer. Scans performed in cancer patients were also omitted, as consideration of second cancers was outside the scope of their analysis. The estimated mean number of radiation-related incident cancers, with 95 percent uncertainty limits (UL), were calculated using Monte Carlo simulation. Uncertainty intervals were estimated to account for statistical uncertainties in the risk parameters, uncertainties in the dose rate reduction effectiveness factor, and differences in application of risks from the Japanese to the U.S. population.
Overall, the authors estimated that approximately 29,000 future can-
cers (95% UL, 15,000–45,000) could be related to CT scans performed in the United States in 2007. The largest contributions were from scans of the abdomen and pelvis (n = 14,000) (95% UL, 6,900–25,000), chest (n = 4,100) (95% UL, 1,900–8,100), and head (n = 4,000) (95% UL, 1,100–8,700), as well as from chest CT angiography (n = 2,700) (95% UL, 1,300–5,000). Approximately one-third of the projected cancers were from scans performed on patients between the ages of 35 and 54 years, whereas only 15 percent were from scans performed on patients under the age of 18 years. This is important, as it is widely believed that cancer risks are only of concern in children; however, because imaging with CT increases so much with increasing age, cancers that result from radiation from the more frequent medical imaging that occurs in middle age are actually more numerous. Further, Berrrington de Gonzalez’s models assumed that the risks of cancer per exposure decline with advancing age. However, several recent analyses have suggested that risks might even increase with exposures at older ages (Preston et al., 2007; Shuryak et al., 2010), making the estimates presented here highly conservative (i.e., the true risks may be higher than these analyses suggest).
The breakdown by cancer site showed that lung cancer was the most common projected radiation-related cancer (n = 6,200) (95% UL, 2,300– 13,000), followed by colon cancer (n = 3,500) (95% UL, 1,000–6,800) and leukemia (n = 2,800) (95% UL, 800–4,800) (Figure F-6). The cancer sites with the highest risks were common cancers with a high frequency of exposure to that organ (e.g., colon from CT of the abdomen and pelvis and lung from CT of the chest) or higher radiosensitivity (e.g., red bone marrow and leukemia). The projected radiation-related cancers would be spread out over many decades. However, if CT scan use remains at the current level or increases further, then the results of the Berrington de Gonzalez analyses suggest that eventually 29,000 (95% UL, 15,000–45,000) cancers every year could be related to past CT scan use. This is equivalent to approximately 2 percent (1–3 percent) of the 1.4 million cancers that are diagnosed annually in the United States being attributable to the prior use of CT.
Using very slight modification of these methods, Dr. Berrington de Gonzalez estimates that 1,800 future breast cancers could result from CT utilization in 2007.
Cancers Associated with Cardiac Nuclear Medicine Imaging (Berrington de Gonzalez et al., 2010)
Nuclear cardiac perfusion tests are used in the assessment of coronary artery disease, and they represent the second largest source of medical radiation exposure in the United States. It is estimated that 85 percent of radiation exposure from nuclear medicine procedures is accounted for from
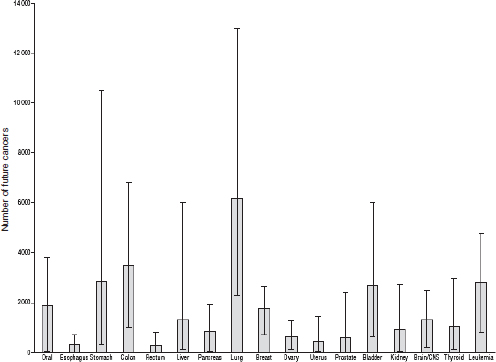
FIGURE F-6 Projected number of future cancers (mean and 95% uncertainty limits) that could be related to CT scan use in the United States in 2007, according to cancer type.
SOURCE: Berrington de Gonzalez et al. (2009, p. E1). Reprinted with permission from Berrington de Gonzalez, A., M. Mahesh, K. P. Kim, M. Bhargavan, R. Lewis, F. Mettler, and C. Land. 2009. Projected cancer risks from computed tomographic scans performed in the United States in 2007. Arch Intern Med 169(22):2071–2077.
these types of examinations. As described above, Berrington de Gonzalez and colleagues (2010) estimated future cancer risks that would result from the cardiac perfusion scans conducted in 2007. Combination of cancer risk estimates with data on frequency of use suggested that the 9.1 million annual cardiac perfusion tests in the United States could result in 8,100 (3,700–15,200) additional future cancers, assuming use of median radionuclide activity. If the tests were performed at the lowest or highest recommended activity levels, risks would be reduced or increased by about 20 percent. If the levels of use remain similar in the future, the estimates suggest that, eventually, approximately 0.6 percent (0.3–1.1 percent) of the 1.4 million cancers diagnosed annually in the United States could be related to these studies.
TABLE F-5 Estimated Number of Future Breast Cancers That Might Occur Related to a Single Year of Medical Radiation Exposure
|
|
|
| Source of Medical Radiation | Estimated Number of Cancers |
|
|
|
| CT scans | 1,800 |
| Conventional radiography | 280 |
| Nuclear medicine | 150 |
| Other | 560 |
| All sources | 2,800 (UL, 2,000–3,500) |
|
|
|
Using very slight modification of these methods, Dr. Berrington de Gonzalez estimates that 150 future breast cancers could result from nuclear medicine utilization in 2007.
Summary of Future Breast Cancers from Medical Imaging
Berrington de Gonzalez estimates that 2,230 future breast cancers would result from radiation from conventional radiography (280), cardiac perfusion imaging (150), and CT (1,800), as described above. These cancers would occur over women’s lifetimes, but result from these medical imaging exposures from a single year. These estimates account for about 80 percent of collective medical radiation dose to the U.S. population as interventional radiology is not included (16 percent of collective U.S. dose) and the other 15 percent of nuclear medicine (4 percent of collective U.S. dose). Thus she estimates an additional 560 breast cancers would result from the remaining radiation exposure from angiography and interventional radiology procedures, and from the nuclear medicine procedures not counted in this estimate. This yields a total estimated cancer burden of approximately 2,800 future breast cancers (95% UL, 2,000–3,500) that would result from 1 year of medical radiation exposure among the entire U.S. female population (Table F-5).
REFERENCES
ACR (American College of Radiology). 2011. ACR launches Dose Index Registry. Press release, May 12. http://www.acr.org/SecondaryMainMenuCategories/NewsPublications/FeaturedCategories/CurrentACRNews/ACR-Launches-Dose-Index-Registry.aspx (accessed September 15, 2011).
Alliance for Radiation Safety in Pediatric Imaging. 2011. Image gently: CT resources. www.pedrad.org/associations/5364/ig/index.cfm?page=369 (accessed February 13, 2009).
Amis, E. S., Jr., P. F. Butler, K. E. Applegate, S. B. Birnbaum, L. F. Brateman, J. M. Hevezi, F. A. Mettler, R. L. Morin, et al. 2007. American College of Radiology white paper on radiation dose in medicine. J Am Coll Radiol 4(5):272–284.
Baker, L. C., S. W. Atlas, and C. C. Afendulis. 2008. Expanded use of imaging technology and the challenge of measuring value. Health Aff (Millwood) 27(6):1467–1478.
Bassal, M., A. C. Mertens, L. Taylor, J. P. Neglia, B. S. Greffe, S. Hammond, C. M. Ronckers, D. L. Friedman, et al. 2006. Risk of selected subsequent carcinomas in survivors of childhood cancer: A report from the Childhood Cancer Survivor Study. J Clin Oncol 24(3):476–483.
Berrington, A., S. C. Darby, H. A. Weiss, and R. Doll. 2001. 100 years of observation on British radiologists: Mortality from cancer and other causes 1897–1997. Br J Radiol 74(882):507–519.
Berrington de Gonzalez, A., and S. Darby. 2004. Risk of cancer from diagnostic X-rays: Estimates for the UK and 14 other countries. Lancet 363(9406):345–351.
Berrington de Gonzalez, A., M. Mahesh, K. P. Kim, M. Bhargavan, R. Lewis, F. Mettler, and C. Land. 2009. Projected cancer risks from computed tomographic scans performed in the United States in 2007. Arch Intern Med 169(22):2071–2077.
Berrington de Gonzalez, A., K. P. Kim, R. Smith-Bindman, and D. McAreavey. 2010. Myocardial perfusion scans: Projected population cancer risks from current levels of use in the United States. Circulation 122(23):2403–2410.
Bhargavan, M., and J. H. Sunshine. 2005. Utilization of radiology services in the United States: Levels and trends in modalities, regions, and populations. Radiology 234(3):824–832.
Brenner D. J., R. Doll, and D. T. Goodhead. 2003. Cancer risks attributable to low doses of ionizing radiation: Assessing what we really know. Proc Natl Acad Sci U S A 100(24): 13761–13766.
Burger, I., D. Miglioretti, E. Johnson, N. Vanneman, and R. Smith-Bindman. 2010a. Radiation exposure increased dramatically in a large health plan, particularly among cancer patients. Paper presented at RSNA meeting, December 1, Chicago, IL.
Burger, I., D. Miglioretti, E. Johnson, H. Feigelson, M. Flynn, R. Smith-Bindman, D. Roblin, S. Weinmann, A. Williams, and R. Greenlee. 2010b. Rise in radiation exposure from diagnostic imaging in patients across several different HMO populations. Paper presented at RSNA meeting, December 2, Chicago, IL.
Calicchia, A., F. Mazzei, F. Dobici, M. Paganini Fioratti, and P. L. Indovina. 1991. Patient exposure during radiodiagnosis. The Nationwide Evaluation of X-ray Trends (NEXT) program in Italy. Radiol Med 81(6):910–917.
Cardis, E., M. Vrijheid, M. Blettner, E. Gilbert, M. Hakama, C. Hill, G. Howe, J. Kaldor, et al. 2007. The 15-country collaborative study of cancer risk among radiation workers in the nuclear industry: Estimates of radiation-related cancer risks. Radiat Res 167(4):396–416.
CE Essentials. 2011. Online radiography continuing education for radiologic X ray technologists. http://www.ceessentials.net/article.php (accessed August 1, 2011).
Charles, M. 2001. UNSCEAR report 2000: Sources and effects of ionizing radiation. United Nations Scientific Committee on the Effects of Atomic Radiation. J Radiol Prot 21(1):83–86.
Chen, J., A. J. Einstein, R. Fazel, H. M. Krumholz, Y. Wang, J. S. Ross, H. H. Ting, N. D. Shah, et al. 2010. Cumulative exposure to ionizing radiation from diagnostic and therapeutic cardiac imaging procedures: A population-based analysis. J Am Coll Cardiol 56(9):702–711.
Conference of Radiation Control Program Directors. 1992. Nationwide Evaluation of X-ray Trends (NEXT): Summary of 1990 computed tomography survey and 1991 fluoroscopy survey. Publication No. 94-2, Frankfurt, KY.
Conference of Radiation Control Program Directors. 2007. Nationwide evaluation of X-ray trends (NEXT): Tabulation and graphical summary of 2000 survey of computed tomography. Frankfurt, KY.
Dinan, M. A., L. H. Curtis, B. G. Hammill, E. F. Patz, Jr., A. P. Abernethy, A. M. Shea, and K. A. Schulman. 2010. Changes in the use and costs of diagnostic imaging among Medicare beneficiaries with cancer, 1999–2006. JAMA 303(16):1625–1631.
Dorfman, A. L., R. Fazel, A. J. Einstein, K. E. Applegate, H. M. Krumholz, Y. Wang, E. Christodoulou, J. Chen, et al. 2011. Use of medical imaging procedures with ionizing radiation in children: A population-based study. Arch Pediatr Adolesc Med 165(5): 458–464.
Einstein, A. J., M. J. Henzlova, and S. Rajagopalan. 2007a. Estimating risk of cancer associated with radiation exposure from 64-slice computed tomography coronary angiography. JAMA 298(3):317–323.
Einstein, A. J., K. W. Moser, R. C. Thompson, M. D. Cerqueira, and M. J. Henzlova. 2007b. Radiation dose to patients from cardiac diagnostic imaging. Circulation 116(11): 1290–1305.
Einstein, A. J., J. Sanz, S. Dellegrottaglie, M. Milite, M. Sirol, M. Henzlova, and S. Rajagopalan. 2008. Radiation dose and cancer risk estimates in 16-slice computed tomography coronary angiography. J Nucl Cardiol 15(2):232–240.
Einstein, A. J., C. D. Elliston, A. E. Arai, M. Y. Chen, R. Mather, G. D. Pearson, R. L. Delapaz, E. Nickoloff, et al. 2010. Radiation dose from single-heartbeat coronary CT angiography performed with a 320-detector row volume scanner. Radiology 254(3):698–706.
Fazel, R., H. M. Krumholz, Y. Wang, J. S. Ross, J. Chen, H. H. Ting, N. D. Shah, K. Nasir, et al. 2009. Exposure to low-dose ionizing radiation from medical imaging procedures. N Engl J Med 361(9):849–857.
FDA (U.S. Food and Drug Administration). 2009. Safety investigation of CT brain perfusion scans: Initial notification. http://www.fda.gov/MedicalDevices/Safety/AlertsandNotices/ucm193293.htm (accessed August 15, 2011).
FDA. 2010. FDA white paper: Initiative to reduce unnecessary radiation exposure from medical imaging. http://www.fda.gov/Radiation-EmittingProducts/RadiationSafety/RadiationDoseReduction/ucm199994.htm (accessed June 30, 2010).
Foley, W. D., T. A. Mallisee, M. D. Hohenwalter, C. R. Wilson, F. A. Quiroz, and A. J. Taylor. 2000. Multiphase hepatic CT with a multirow detector CT scanner. AJR Am J Roentgenol 175(3):679–685.
Gonzalez, A. J., G. C. Mason, R. H. Clarke, A. D. Wrixon, J. Cooper, L. E. Holm, J. D. Boice, Jr., C. Cousins, et al. 2007. Scope of radiological protection control measures. Ann ICRP 37(5):1–105.
Hackbarth, G. M. 2007. Options to improve Medicare’s payments to physicians. Testimony before the Subcommittee on Health of the House Committee on Ways and Means, May 10. http://www.medpac.gov/documents/051007_Testimony_MedPAC_physician_payment.pdf (accessed August 15, 2010).
Hausleiter, J., T. Meyer, F. Hermann, M. Hadamitzky, M. Krebs, T. C. Gerber, C. McCollough, S. Martinoff, et al. 2009. Estimated radiation dose associated with cardiac CT angiography. JAMA 301(5):500–507.
Hendrick, R. E., E. D. Pisano, A. Averbukh, C. Moran, E. A. Berns, M. J. Yaffe, B. Herman, S. Acharyya, et al. 2010. Comparison of acquisition parameters and breast dose in digital mammography and screen-film mammography in the American College of Radiology Imaging Network digital mammographic imaging screening trial. AJR Am J Roentgenol 194(2):362–369.
Hoeffner, E. G., I. Case, R. Jain, S. K. Gujar, G. V. Shah, J. P. Deveikis, R. C. Carlos, B. G. Thompson, et al. 2004. Cerebral perfusion CT: Technique and clinical applications. Radiology 231(3):632–644.
Hricak, H., D. J. Brenner, S. J. Adelstein, D. P. Frush, E. J. Hall, R. W. Howell, C. H. McCollough, F. A. Mettler, et al. 2011. Managing radiation use in medical imaging: A multifaceted challenge. Radiology 258(3):889–905.
Hurwitz, L. M., T. T. Yoshizumi, R. E. Reiman, E. K. Paulson, D. P. Frush, G. T. Nguyen, G. I. Toncheva, and P. C. Goodman. 2006. Radiation dose to the female breast from 16-MDCT body protocols. AJR Am J Roentgenol 186(6):1718–1722.
Hurwitz, L. M., R. E. Reiman, T. T. Yoshizumi, P. C. Goodman, G. Toncheva, G. Nguyen, and C. Lowry. 2007. Radiation dose from contemporary cardiothoracic multidetector CT protocols with an anthropomorphic female phantom: Implications for cancer induction. Radiology 245(3):742–750.
IAEA (International Atomic Energy Agency). 1996. International basic safety standards for protection against ionizing radiation and for the safety of radiation sources. ISSN 0074-1892; 115. Safety standards. Vienna, Austria: IAEA.
ICRP (International Commission on Radiological Protection). 1991. 1990 recommendations of the International Commission on Radiological Protection. ICRP Pub. No. 60. Oxford, UK: Pergamom.
Kuhn, H. 2006. Payment for imaging services under the Medicare physician fee schedule. Testimony before the House Subcommittee on Health of the Committee on Energy And Commerce, July 18. http://www.cms.hhs.gov/apps/media/press/release.asp?Counter=1903 (accessed August 15, 2011).
Land, C. E. 1995. Studies of cancer and radiation dose among atomic bomb survivors. The example of breast cancer. JAMA 274(5):402–407.
Lewis, E. B. 1963. Leukemia, multiple myeloma, and aplastic anemia in American radiologists. Science 142:1492–1494.
Linet, M. S., K. P. Kim, D. L. Miller, R. A. Kleinerman, S. L. Simon, and A. Berrington de Gonzalez. 2010. Historical review of occupational exposures and cancer risks in medical radiation workers. Radiat Res 174(6):793–808.
Little, M. P. 2001. Cancer after exposure to radiation in the course of treatment for benign and malignant disease. Lancet Oncol 2(4):212–220.
Matanoski, G. M., R. Seltser, P. E. Sartwell, E. L. Diamond, and E. A. Elliott. 1975. The current mortality rates of radiologists and other physician specialists: specific causes of death. Am J Epidemiol 101(3):199–210.
Mettler, F. A., Jr., W. Huda, T. T. Yoshizumi, and M. Mahesh. 2008. Effective doses in radiology and diagnostic nuclear medicine: A catalog. Radiology 248(1):254–263.
Mettler, F. A., Jr., M. Bhargavan, K. Faulkner, D. B. Gilley, J. E. Gray, G. S. Ibbott, J. A. Lipoti, M. Mahesh, et al. 2009. Radiologic and nuclear medicine studies in the United States and worldwide: Frequency, radiation dose, and comparison with other radiation sources—1950–2007. Radiology 253(2):520–531.
Modan, B., L. Keinan, T. Blumstein, and S. Sadetzki. 2000. Cancer following cardiac catheterization in childhood. Int J Epidemiol 29(3):424–428.
Muirhead, C. R., A. A. Goodill, R. G. Haylock, J. Vokes, M. P. Little, D. A. Jackson, J. A. O’Hagan, J. M. Thomas, et al. 1999. Occupational radiation exposure and mortality: Second analysis of the National Registry for Radiation Workers. J Radiol Prot 19(1):3–26.
Muirhead, C. R., J. A. O’Hagan, R. G. Haylock, M. A. Phillipson, T. Willcock, G. L. Berridge, and W. Zhang. 2009. Mortality and cancer incidence following occupational radiation exposure: Third analysis of the National Registry for Radiation Workers. Br J Cancer 100(1):206–212.
NCRP (National Council on Radiation Protection and Measurements). 1987a. NCRP Report No. 91: Recommendations on limits for exposure to ionizing radiation. Bethesda, MD: NCRP.
NCRP. 1987b. NCRP Report No. 93: Ionizing radiation exposure of the population of the United States. Bethesda, MD: NCRP.
NCRP. 1989. NCRP Report No. 105: Radiation protection for medical and allied health personnel. Bethesda, MD: NCRP.
NCRP. 1993. NCRP Report No. 116: Limitations on exposure to ionizing radiation. Bethesda, MD: NCRP.
NCRP. 2009. NCRP Report No. 160: Ionizing radiation exposure of the population of the United States. Bethesda, MD: NCRP.
NCRP. 2011. National Council on Radiation Protection and Measurements. http://www.ncrponline.org/ (accessed August 1, 2011).
Neglia, J. P., D. L. Friedman, Y. Yasui, A. C. Mertens, S. Hammond, M. Stovall, S. S. Donaldson, A. T. Meadows, et al. 2001. Second malignant neoplasms in five-year survivors of childhood cancer: Childhood Cancer Survivor Study. J Natl Cancer Inst 93(8):618–629.
Neglia, J. P., L. L. Robison, M. Stovall, Y. Liu, R. J. Packer, S. Hammond, Y. Yasui, C. E. Kasper, et al. 2006. New primary neoplasms of the central nervous system in survivors of childhood cancer: A report from the Childhood Cancer Survivor Study. J Natl Cancer Inst 98(21):1528–1537.
NRC (National Research Council). 1996. Health effects of exposure to low levels of ionizing radiation: BEIR V. Washington, DC: National Academy Press.
NRC. 2003. Exposure of the American population to radioactive fallout from nuclear weap ons tests: A review of the CDC–NCI draft report on a feasibility study of the health consequences to the American population from nuclear weapons tests conducted by the United States and other nations. Washington, DC: The National Academies Press.
NRC. 2006. Health risks from exposure to low levels of ionizing radiation: BEIR VII Phase 2. Washington, DC: The National Academies Press.
Pierce, D. A., and D. L. Preston. 1993. Joint analysis of site-specific cancer risks for the atomic bomb survivors. Radiat Res 134(2):134–142.
Pierce, D. A., and D. L. Preston. 2000. Radiation-related cancer risks at low doses among atomic bomb survivors. Radiat Res 154(2):178–186.
Preston, R. J. 2008. Update on linear non-threshold dose-response model and implications for diagnostic radiology procedures. Health Phys 95(5):541–546.
Preston, D. L., D. A. Pierce, Y. Shimizu, E. Ron, and K. Mabuchi. 2003. Dose response and temporal patterns of radiation-associated solid cancer risks. Health Phys 85(1):43–46.
Preston, D. L., E. Ron, S. Tokuoka, S. Funamoto, N. Nishi, M. Soda, K. Mabuchi, and K. Kodama. 2007. Solid cancer incidence in atomic bomb survivors: 1958–1998. Radiat Res 168(1):1–64.
Ron, E. 2003. Cancer risks from medical radiation. Health Phys 85(1):47–59.
Ron, E., J. H. Lubin, R. E. Shore, K. Mabuchi, B. Modan, L. M. Pottern, A. B. Schneider, M. A. Tucker, et al. 1995a. Thyroid cancer after exposure to external radiation: A pooled analysis of seven studies. Radiat Res 141(3):259–277.
Ron, E., D. L. Preston, and K. Mabuchi. 1995b. More about cancer incidence in atomic bomb survivors: Solid tumors, 1958–1987. Radiat Res 141(1):126–127.
Ronckers, C. M., A. J. Sigurdson, M. Stovall, S. A. Smith, A. C. Mertens, Y. Liu, S. Hammond, C. E. Land, et al. 2006. Thyroid cancer in childhood cancer survivors: A detailed evaluation of radiation dose response and its modifiers. Radiat Res 166(4):618–628.
Rydberg, J., K. A. Buckwalter, K. S. Caldemeyer, M. D. Phillips, D. J. Conces, Jr., A. M. Aisen, S. A. Persohn, and K. K. Kopecky. 2000. Multisection CT: Scanning techniques and clinical applications. Radiographics 20(6):1787–1806.
Sachs, R. K., and D. J. Brenner. 2005. Solid tumor risks after high doses of ionizing radiation. Proc Natl Acad Sci U S A 102(37):13040–13045.
Shuryak, I., R. K. Sachs, and D. J. Brenner. 2010. Cancer risks after radiation exposure in middle age. J Natl Cancer Inst 102(21):1628–1636.
Sigurdson, A. J., C. M. Ronckers, A. C. Mertens, M. Stovall, S. A. Smith, Y. Liu, R. L. Berkow, S. Hammond, et al. 2005. Primary thyroid cancer after a first tumour in childhood (the Childhood Cancer Survivor Study): A nested case–control study. Lancet 365(9476):2014–2023.
Smith-Bindman, R., D. L. Miglioretti, and E. B. Larson. 2008. Rising use of diagnostic medical imaging in a large integrated health system. Health Aff (Millwood) 27(6):1491–1502.
Smith-Bindman, R., J. Lipson, R. Marcus, K. P. Kim, M. Mahesh, R. Gould, A. Berrington de Gonzalez, and D. L. Miglioretti. 2009. Radiation dose associated with common computed tomography examinations and the associated lifetime attributable risk of cancer. Arch Intern Med 169(22):2078–2086.
Spelic, D. 2007. Nationwide evaluation of X-ray trends: NEXT 2005–2006. Paper read at Conference of Radiation Control Program Directors annual meeting, Spokane, WA, May 21–24.
Spelic, D. C., R. V. Kaczmarek, and O. H. Suleiman. 2004. Nationwide evaluation of X-ray trends survey of abdomen and lumbosacral spine radiography. Radiology 232(1):115–125.
State of California. 2010. Senate bill 1237: Radiation Safety Bill.
Strzelczyk, J., W. Potter, and Z. Zdrojewicz. 2007. Rad-by-rad (bit-by-bit): Triumph of evidence over activities fostering fear of radiogenic cancers at low doses. Dose Response 5(4):275–283.
U.S. House of Representatives: Subcommittee on Health. 2010. Medical radiation: An overview of the issues. http://democrats.energycommerce.house.gov/index.php?q=hearing/medical-radiation-an-overview-of-the-issues (accessed August 15, 2010).
This page intentionally left blank.


